
Skewness-Kurtosis Model-Based Projection Pursuit with Application to Summarizing Gene Expression Data


Abstract
1. Introduction
2. Background and Motivation
2.1. The Skew-Normal and Skew-T Distributions
2.2. Motivating Example
3. Skewness-Kurtosis Based Projection Pursuit
3.1. Skewness Maximization
3.2. Kurtosis Maximization
3.3. Computational Issues
4. Application to Synthetic Data
4.1. Simulation Study for the Bidimensional Case
4.2. Simulation Study for
- Scenario 1. The simulation experiments are determined by the following settings: , shape vector lying on the direction of the first principal component of the scale matrix , and matrix such that either or , with the aforementioned values for and .
- Scenario 2. It is determined by the settings from the previous scenario but with the shape vector lying on the direction .
- Scenario 3. The simulation experiments are determined using the following settings: , shape vector lying on the direction of the first principal component of the scale matrix , and either equal diagonal elements of the matrix given by or unequal diagonal elements given by , with the aforementioned values for and .
- Scenario 4. It uses the same settings of scenario 3 but now the shape vector lies on the direction of .
5. Application to Real Genomic Data
5.1. Data Collection
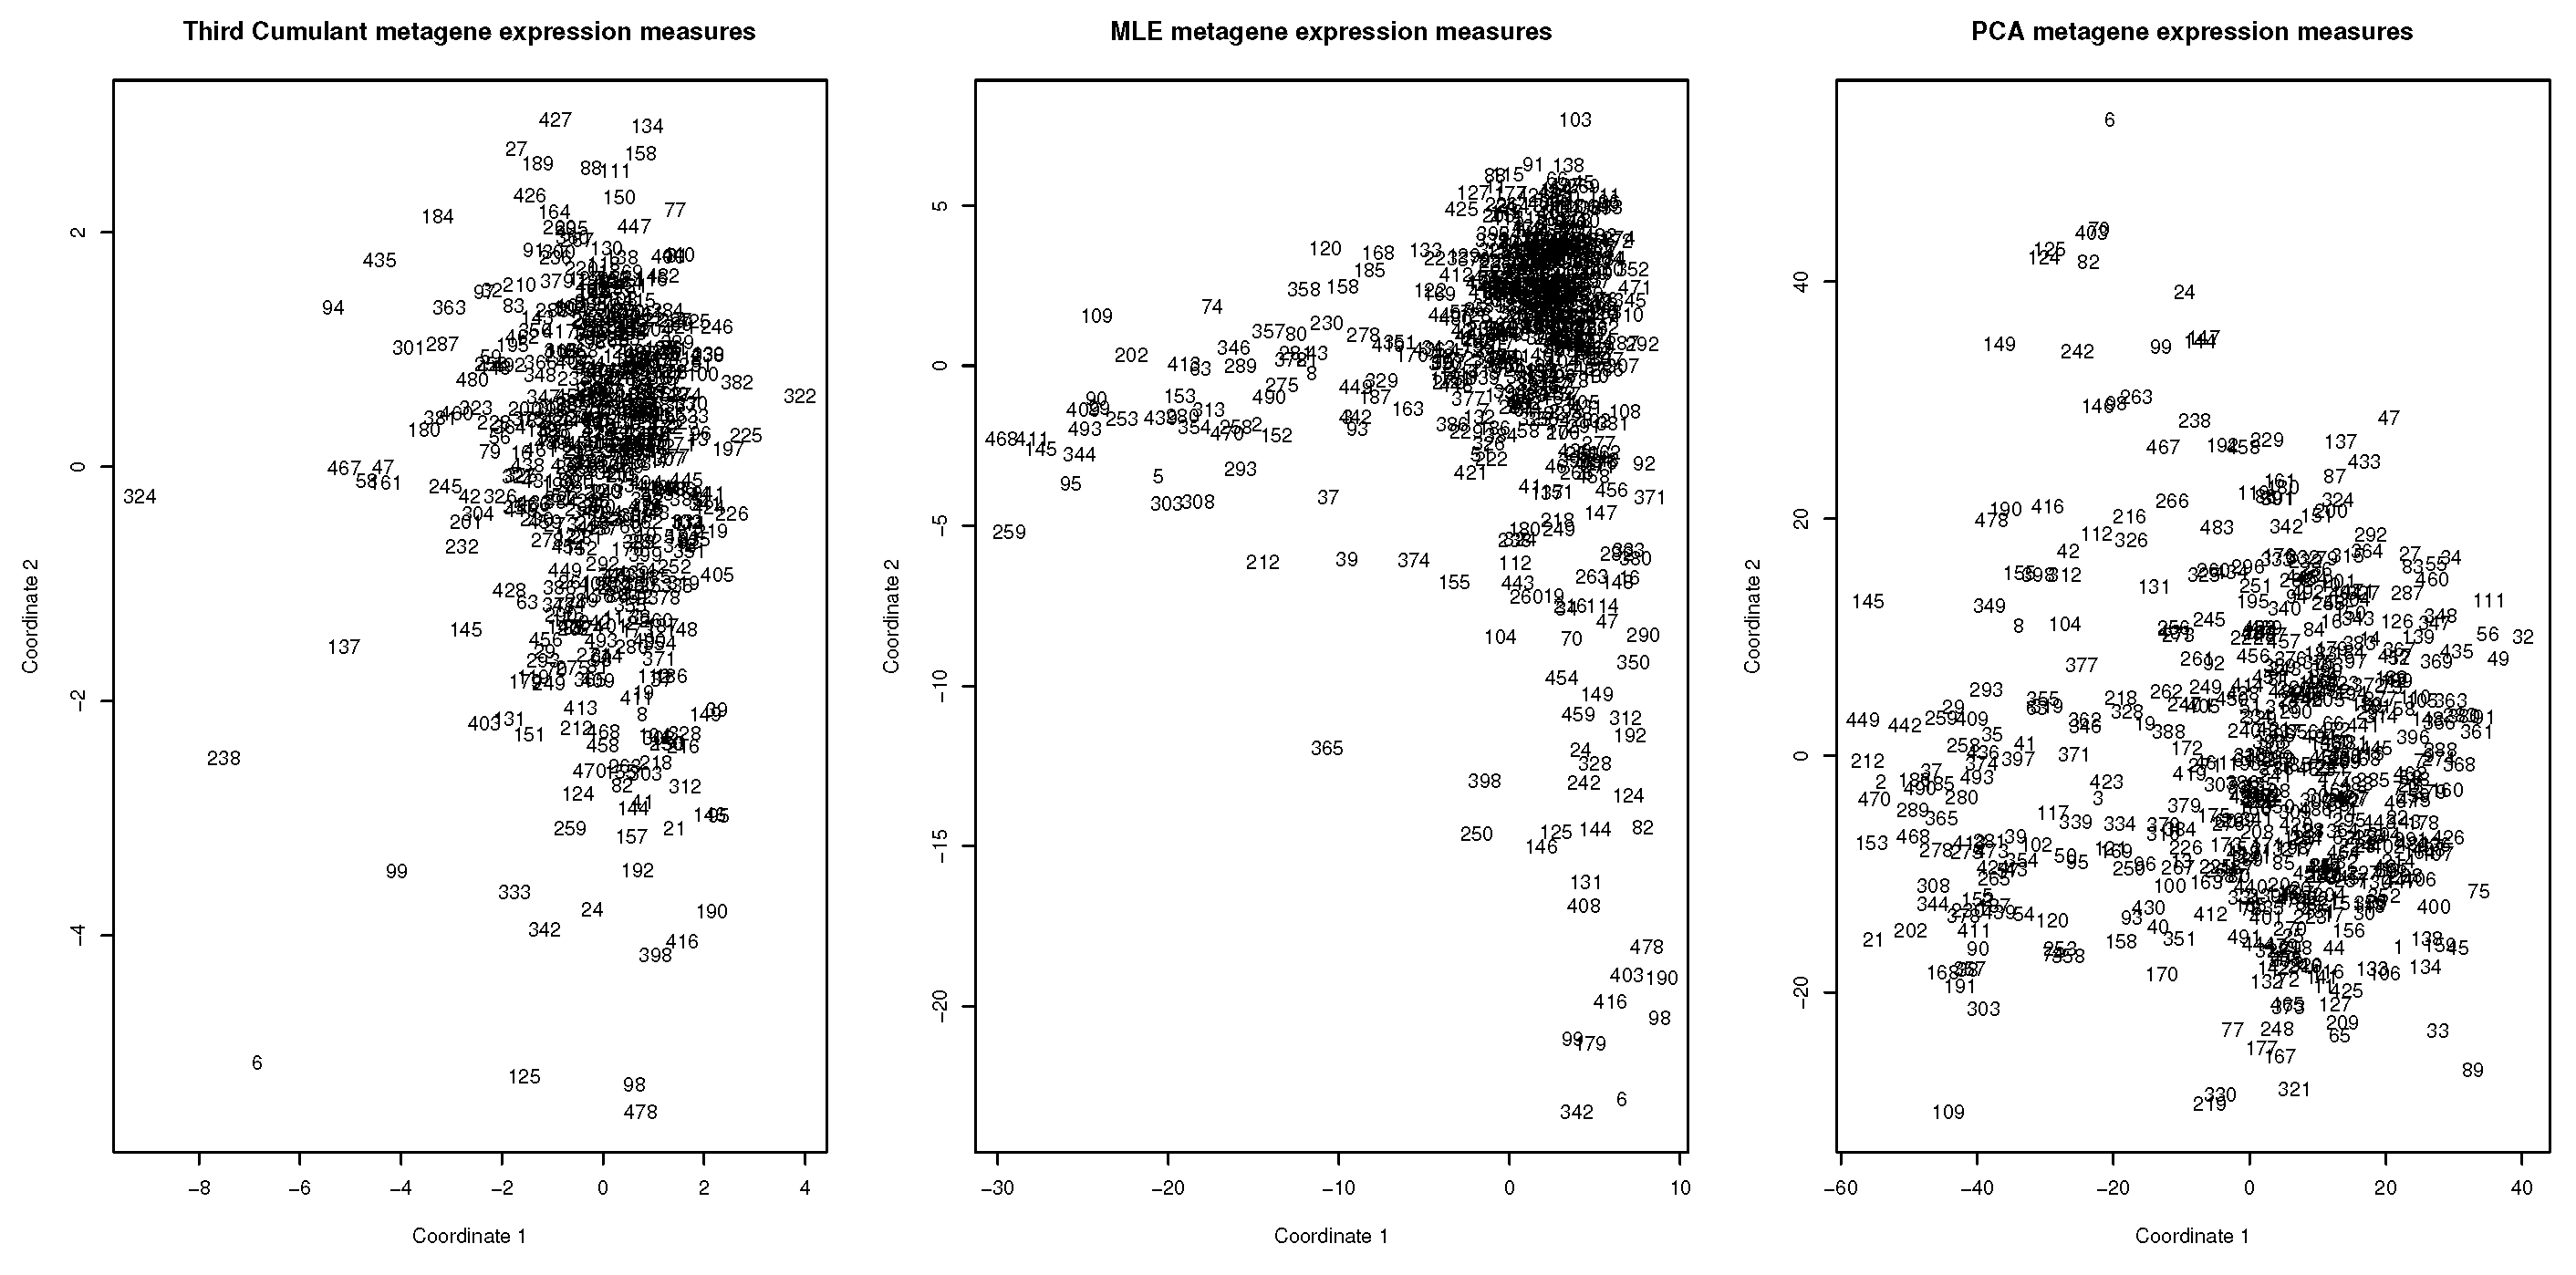
5.2. Application of Skewness-Kurtosis Projection Pursuit
5.3. Discussion and Interpretation of Results
6. Concluding Remarks
Author Contributions
Funding
Institutional Review Board Statement
Informed Consent Statement
Data Availability Statement
Acknowledgments
Conflicts of Interest
Appendix A
Appendix A.1. Proof of Theorem 1 for Skewness Maximization
Appendix A.2. Proof of Theorem 1 for Kurtosis Maximization
References
- Hardin, J.; Wilson, J. A note on oligonucleotide expression values not being normally distributed. Biostatistics 2009, 10, 446–450. [Google Scholar] [CrossRef] [PubMed][Green Version]
- Casellas, J.; Varona, L. Modeling Skewness in Human Transcriptomes. PLoS ONE 2012, 7, e38919. [Google Scholar] [CrossRef] [PubMed]
- Marko, N.F.; Weil, R.J. Non-gaussian distributions affect identification of expression patterns, functional annotation, and prospective classification in human cancer genomes. PLoS ONE 2012, 7, e46935. [Google Scholar] [CrossRef]
- Mar, J.C. The rise of the distributions: Why non-normality is important for understanding the transcriptome and beyond. Biophys. Rev. 2019, 11, 89–94. [Google Scholar] [CrossRef]
- Huber, P.J. Projection Pursuit. Ann. Stat. 1985, 13, 435–475. [Google Scholar] [CrossRef]
- Malkovich, J.F.; Afifi, A.A. On Tests for Multivariate Normality. J. Am. Stat. Assoc. 1973, 68, 176–179. [Google Scholar] [CrossRef]
- Kim, H.M.; Mallick, B.K. Moments of random vectors with skew t distribution and their quadratic forms. Stat. Probab. Lett. 2003, 63, 417–423. [Google Scholar] [CrossRef]
- Loperfido, N. Generalized Skew-Normal Distributions. In Skew-Elliptical Distributions and Their Applications: A Journey Beyond Normality; CRC/Chapman & Hall: Boca Raton, FL, USA, 2004; Chapter 4; pp. 65–80. [Google Scholar]
- Loperfido, N. Canonical transformations of skew-normal variates. Test 2010, 19, 146–165. [Google Scholar] [CrossRef]
- Loperfido, N. Skewness and the linear discriminant function. Stat. Probab. Lett. 2013, 83, 93–99. [Google Scholar] [CrossRef]
- Arevalillo, J.M.; Navarro, H. A note on the direction maximizing skewness in multivariate skew-t vectors. Stat. Probab. Lett. 2015, 96, 328–332. [Google Scholar] [CrossRef]
- Arevalillo, J.M.; Navarro, H. Data projections by skewness maximization under scale mixtures of skew-normal vectors. Adv. Data Anal. Classif. 2020, 14, 435–461. [Google Scholar] [CrossRef]
- Kim, H.M.; Kim, C. Moments of scale mixtures of skew-normal distributions and their quadratic forms. Commun. Stat. Theory Methods 2017, 46, 1117–1126. [Google Scholar] [CrossRef]
- Loperfido, N. Skewness-Based Projection Pursuit: A Computational Approach. Comput. Stat. Data Anal. 2018, 120, 42–57. [Google Scholar] [CrossRef]
- Peña, D.; Prieto, F. Cluster Identification Using Projections. J. Am. Stat. Assoc. 2001, 96, 1433–1445. [Google Scholar] [CrossRef]
- Peña, D.; Prieto, F. Combining Random and Specific Directions for Outlier Detection and Robust Estimation in High-Dimensional Multivariate Data. J. Comput. Graph. Stat. 2007, 16, 228–254. [Google Scholar] [CrossRef]
- Loperfido, N. A note on the fourth cumulant of a finite mixture distribution. J. Multivar. Anal. 2014, 123, 386–394. [Google Scholar] [CrossRef]
- Loperfido, N. Kurtosis-based projection pursuit for outlier detection in financial time series. Eur. J. Financ. 2020, 26, 142–164. [Google Scholar] [CrossRef]
- Azzalini, A.; Capitanio, A. Statistical applications of the multivariate skew normal distribution. J. R. Stat. Soc. Ser. B 1999, 61, 579–602. [Google Scholar] [CrossRef]
- Azzalini, A. The Skew-normal Distribution and Related Multivariate Families. Scand. J. Stat. 2005, 32, 159–188. [Google Scholar] [CrossRef]
- Contreras-Reyes, J.E.; Arellano-Valle, R.B. Kullback-Leibler Divergence Measure for Multivariate Skew-Normal Distributions. Entropy 2012, 14, 1606–1626. [Google Scholar] [CrossRef]
- Balakrishnan, N.; Scarpa, B. Multivariate measures of skewness for the skew-normal distribution. J. Multivar. Anal. 2012, 104, 73–87. [Google Scholar] [CrossRef]
- Balakrishnan, N.; Capitanio, A.; Scarpa, B. A test for multivariate skew-normality based on its canonical form. J. Multivar. Anal. 2014, 128, 19–32. [Google Scholar] [CrossRef]
- Azzalini, A.; Capitanio, A. The Skew-Normal and Related Families; IMS Monographs; Cambridge University Press: Cambridge, UK, 2014. [Google Scholar]
- Azzalini, A.; Dalla Valle, A. The multivariate skew-normal distribution. Biometrika 1996, 83, 715–726. [Google Scholar] [CrossRef]
- Azzalini, A.; Capitanio, A. Distributions generated by perturbation of symmetry with emphasis on a multivariate skew t-distribution. J. R. Stat. Soc. Ser. B 2003, 65, 367–389. [Google Scholar] [CrossRef]
- Villasenor Alva, J.A.; Estrada, E.G. A generalization of Shapiro-Wilk’s test for multivariate normality. Commun. Stat. Theory Methods 2009, 38, 1870–1883. [Google Scholar] [CrossRef]
- Gonzalez-Estrada, E.; Villasenor-Alva, J.A. goft: Tests of Fit for Some Probability Distributions; R Package Version 1.3.4. 2017. Available online: https://cran.microsoft.com/snapshot/2017-11-08/web/packages/goft/goft.pdf (accessed on 24 April 2021).
- Nordhausen, K.; Oja, H.; Tyler, D.E. Tools for Exploring Multivariate Data: The Package ICS. J. Stat. Softw. 2008, 28, 1–31. [Google Scholar] [CrossRef]
- Mardia, K.V. Applications of Some Measures of Multivariate Skewness and Kurtosis in Testing Normality and Robustness Studies. Sankhyā Indian J. Stat. Ser. B (1960–2002) 1974, 36, 115–128. [Google Scholar]
- Henze, N.; Zirkler, B. A class of invariant consistent tests for multivariate normality. Commun. Stat. Theory Methods 1990, 19, 3595–3617. [Google Scholar] [CrossRef]
- Doornik, J.; Hansen, H. An Omnibus Test for Univariate and Multivariate Normality. Oxf. Bull. Econ. Stat. 2008, 70, 927–939. [Google Scholar] [CrossRef]
- Korkmaz, S.; Goksuluk, D.; Zararsiz, G. MVN: An R Package for Assessing Multivariate Normality. R J. 2014, 6, 151–162. [Google Scholar] [CrossRef]
- Azzalini, A. The R Package sn: The Skew-Normal and Related Distributions such as the Skew-t (Version 1.5-2); Università di Padova: Padova, Italy, 2018. [Google Scholar]
- De Lathauwer, L.; De Moor, B.; Vandewalle, J. On the best rank-1 and rank-(R1, R2, …, RN) approximation of higher-order tensor. SIAM J. Matrix Anal. Appl. 2000, 21, 1324–1342. [Google Scholar] [CrossRef]
- Franceschini, C.; Loperfido, N. MaxSkew: Orthogonal Data Projections with Maximal Skewness; R Package Version 1.0. 2016. Available online: https://mran.microsoft.com/snapshot/2017-01-21/web/packages/MaxSkew/MaxSkew.pdf (accessed on 24 April 2021).
- Gamez-Pozo, A.; Berges-Soria, J.; Arevalillo, J.M.; Nanni, P.; Lopez-Vacas, R.; Navarro, H.; Grossmann, J.; Castaneda, C.A.; Main, P.; Diaz-Almiron, M.; et al. Combined Label-Free Quantitative Proteomics and microRNA Expression Analysis of Breast Cancer Unravel Molecular Differences with Clinical Implications. Cancer Res. 2015, 75, 2243–2253. [Google Scholar] [CrossRef] [PubMed]
- Prado-Vázquez, G.; Gámez-Pozo, A.; Trilla-Fuertes, L.; Arevalillo, J.M.; Zapater-Moros, A.; Ferrer-Gómez, M.; Díaz-Almirón, M.; López-Vacas, R.; Navarro, H.; Maín, P.; et al. A novel approach to triple-negative breast cancer molecular classification reveals a luminal immune-positive subgroup with good prognoses. Sci. Rep. 2019, 9, 1538. [Google Scholar] [CrossRef]
- Rody, A.; Karn, T.; Liedtke, C.; Pusztai, L.; Ruckhaeberle, E.; Hanker, L.; Gaetje, R.; Solbach, C.; Ahr, A.; Metzler, D.; et al. A clinically relevant gene signature in triple negative and basal-like breast cancer. Breast Cancer Res. 2011, 13, R97. [Google Scholar] [CrossRef] [PubMed]
- Fraley, C.; Raftery, A.E. Model-Based Clustering, Discriminant Analysis, and Density Estimation. J. Am. Stat. Assoc. 2002, 97, 611–631. [Google Scholar] [CrossRef]
- Scrucca, L.; Fop, M.; Murphy, T.B.; Raftery, A.E. mclust 5: Clustering, classification and density estimation using Gaussian finite mixture models. R J. 2016, 8, 205–233. [Google Scholar] [CrossRef]
- Hothorn, T.; Hornik, K.; Zeileis, A. Unbiased Recursive Partitioning: A Conditional Inference Framework. J. Comput. Graph. Stat. 2006, 15, 651–674. [Google Scholar] [CrossRef]
- Hothorn, T.; Hornik, K.; van de Wiel, M.A.; Zeileis, A. A Lego System for Conditional Inference. Am. Stat. 2006, 60, 257–263. [Google Scholar] [CrossRef]
- Hothorn, T.; Zeileis, A. Partykit: A Modular Toolkit for Recursive Partytioning in R. J. Mach. Learn. Res. 2015, 16, 3905–3909. [Google Scholar]
- Bickel, P.J.; Kur, G.; Nadler, B. Projection pursuit in high dimensions. Proc. Natl. Acad. Sci. USA 2018, 115, 9151–9156. [Google Scholar] [CrossRef]
- Meinshausen, N.; Bühlmann, P. High-dimensional graphs and variable selection with the Lasso. Ann. Stat. 2006, 34, 1436–1462. [Google Scholar] [CrossRef]
- Friedman, J.; Hastie, T.; Tibshirani, R. Sparse inverse covariance estimation with the graphical lasso. Biostatistics 2008, 9, 432–441. [Google Scholar] [CrossRef]
- Witten, D.M.; Friedman, J.H.; Simon, N. New Insights and Faster Computations for the Graphical Lasso. J. Comput. Graph. Stat. 2011, 20, 892–900. [Google Scholar] [CrossRef]
- Branco, M.D.; Dey, D.K. A General Class of Multivariate Skew-Elliptical Distributions. J. Multivar. Anal. 2001, 79, 99–113. [Google Scholar] [CrossRef]
- Wang, J. A family of kurtosis orderings for multivariate distributions. J. Multivar. Anal. 2009, 100, 509–517. [Google Scholar] [CrossRef][Green Version]
- Arevalillo, J.M.; Navarro, H. A study of the effect of kurtosis on discriminant analysis under elliptical populations. J. Multivar. Anal. 2012, 107, 53–63. [Google Scholar] [CrossRef]
- Arevalillo, J.M.; Navarro, H. A stochastic ordering based on the canonical transformation of skew-normal vectors. Test 2019, 28, 475–498. [Google Scholar] [CrossRef]


| Test | |||||||||
|---|---|---|---|---|---|---|---|---|---|
| Shapiro–Wilk’s | 7716 | 8079 | 8878 | 9798 | 9853 | 9952 | 9998 | 9998 | 10,000 |
| ICS skewness | 5503 | 5944 | 7090 | 8583 | 8830 | 9363 | 9867 | 9904 | 9969 |
| ICS kurtosis | 8327 | 8546 | 9082 | 9934 | 9946 | 9982 | 10,000 | 10,000 | 10,000 |
| Mardia skewness | 5899 | 6368 | 7528 | 9418 | 9562 | 9812 | 9998 | 9999 | 10,000 |
| Mardia kurtosis | 8358 | 8615 | 9221 | 9958 | 9975 | 9995 | 10,000 | 10,000 | 10,000 |
| Henze–Zirkler | 4571 | 5232 | 6942 | 9200 | 9389 | 9717 | 9999 | 10,000 | 10,000 |
| Doornik–Hansen | 8189 | 8513 | 9135 | 9866 | 9907 | 9964 | 10,000 | 10,000 | 10,000 |
| (1, 10) | (1, 5) | (5, 10) | (5, 5) | (1, 10) | (1, 5) | (5, 10) | (5, 5) | ||
|---|---|---|---|---|---|---|---|---|---|
| 0.532 | 0.525 | 0.064 | 0.105 | 0.769 | 0.761 | 0.121 | 0.213 | ||
| 0.491 | 0.368 | 0.022 | 0.012 | 0.789 | 0.604 | 0.034 | 0.031 | ||
| 0.415 | 0.403 | 0.022 | 0.077 | 0.671 | 0.625 | 0.057 | 0.144 | ||
| 0.341 | 0.182 | 0.004 | 0.004 | 0.583 | 0.377 | 0.013 | 0.013 | ||
| 0.748 | 0.687 | 0.133 | 0.213 | 0.809 | 0.813 | 0.177 | 0.296 | ||
| 0.736 | 0.506 | 0.047 | 0.035 | 0.826 | 0.634 | 0.053 | 0.050 | ||
| 0.547 | 0.551 | 0.064 | 0.154 | 0.690 | 0.667 | 0.096 | 0.217 | ||
| 0.478 | 0.281 | 0.012 | 0.013 | 0.573 | 0.422 | 0.021 | 0.021 | ||
| (1, 10) | (1, 5) | (5, 10) | (5, 5) | (1, 10) | (1, 5) | (5, 10) | (5, 5) | ||
|---|---|---|---|---|---|---|---|---|---|
| 0.484 | 0.466 | 0.057 | 0.083 | 0.312 | 0.269 | 0.023 | 0.047 | ||
| 0.445 | 0.341 | 0.013 | 0.007 | 0.296 | 0.175 | 0.007 | 0.004 | ||
| 0.395 | 0.362 | 0.016 | 0.053 | 0.245 | 0.228 | 0.006 | 0.023 | ||
| 0.352 | 0.189 | 0.003 | 0.003 | 0.190 | 0.092 | 0.001 | 0.001 | ||
| NA | NA | NA | NA | NA | NA | NA | NA | ||
| NA | NA | NA | NA | NA | NA | NA | NA | ||
| 0.320 | 0.298 | 0.015 | 0.039 | 0.271 | 0.246 | 0.007 | 0.026 | ||
| 0.300 | 0.231 | 0.002 | 0.002 | 0.260 | 0.148 | 0.002 | 0.001 | ||
| (1, 10) | (1, 5) | (5, 10) | (5, 5) | (1, 10) | (1, 5) | (5, 10) | (5, 5) | ||
|---|---|---|---|---|---|---|---|---|---|
| 0.553 | 0.488 | 0.064 | 0.113 | 0.347 | 0.299 | 0.034 | 0.072 | ||
| 0.503 | 0.358 | 0.020 | 0.013 | 0.307 | 0.210 | 0.009 | 0.007 | ||
| 0.427 | 0.394 | 0.021 | 0.065 | 0.270 | 0.254 | 0.014 | 0.043(0.026) | ||
| 0.341 | 0.192 | 0.004 | 0.004 | 0.208 | 0.117 | 0.001 | 0.001(0.001) | ||
| 0.707 | 0.652 | 0.117 | 0.194 | 0.427 | 0.433 | 0.067 | 0.132 | ||
| 0.607 | 0.484 | 0.034 | 0.029 | 0.395 | 0.338 | 0.011 | 0.012 | ||
| 0.521 | 0.535 | 0.055 | 0.148 | 0.341 | 0.352 | 0.031 | 0.093(0.064) | ||
| 0.409 | 0.282 | 0.011 | 0.011 | 0.272 | 0.194 | 0.004 | 0.004(0.002) | ||
| (5, 10) | (5, 5) | (5, 10) | (5, 5) | (5, 10) | (5, 5) | (5, 10) | (5, 5) | ||
|---|---|---|---|---|---|---|---|---|---|
| Equal | Unequal | Equal | Unequal | ||||||
| Scenario 1 | 0.198 | 0.393 | 0.650 | 0.954 | 0.462 | 0.784 | 0.853 | 1.117 | |
| 0.024 | 0.018 | 0.233 | 0.200 | 0.102 | 0.069 | 0.332 | 0.270 | ||
| Scenario 2 | 0.195 | 0.394 | 0.186 | 0.176 | 0.423 | 0.724 | 0.210 | 0.350 | |
| 0.022 | 0.018 | 0.025 | 0.003 | 0.098 | 0.067 | 0.026 | 0.012 | ||
| Equal | Unequal | Equal | Unequal | ||||||
| Scenario 3 | 0.691 | 0.970 | 1.334 | 1.607 | 1.196 | 1.430 | 1.400 | 1.550 | |
| 1.125 | 0.858 | 1.563 | 1.690 | 1.765 | 1.730 | 1.670 | 1.550 | ||
| Scenario 4 | 0.708 | 0.960 | 0.491 | 0.680 | 1.140 | 1.380 | 0.829 | 0.953 | |
| 1.044 | 0.821 | 0.130 | 0.065 | 1.640 | 1.600 | 0.769 | 0.638 | ||
| Rody’s Metagenes | Gene Ids |
|---|---|
| Adipocyte | ADIPOQ ADH1B CD36 CHRDL1 |
| Apocrine | PIP ALDH3B2 SPDEF FOXA1 MLPH TFAP2B AGR2 AR HMGCS2 DHRS2 UGT2B28 ALOX15B |
| B-Cell | IGKC IGHM IGL@ IGHG1 IGHD IGH@ |
| Basal-Like | KRT23 SOX10 SFRP1 GABRP VGLL1 PLEKHB1 ELF5 KRT14 KRT17 KRT5 MIA KRT16 SERPINB5 S100A2 KRT6B TRIM29 KRT6A FOXC1 |
| CLaudin-CD24 | CLDN4 CLDN3 KRT19 KRT7 RAB25 CD24 |
| HOXA | HOXA10 HOXA11 |
| Histone | H2BFS HIST1H1C HIST1H2AE HIST1H2BG |
| IFN | IFI44L MX1 IFIT1 IFI27 |
| IL-8 | IL8 CXCL1 CXCL2 |
| MHC-2 | HLA-DRA HLA-DQA1 HLA-DQB1 |
| Proliferation | CDCA8 FOXM1 BUB1 |
| Stroma | FBN1 POSTN FN1 |
| T-cell | GZMK PTPRC CD52 |
Publisher’s Note: MDPI stays neutral with regard to jurisdictional claims in published maps and institutional affiliations. |
© 2021 by the authors. Licensee MDPI, Basel, Switzerland. This article is an open access article distributed under the terms and conditions of the Creative Commons Attribution (CC BY) license (https://creativecommons.org/licenses/by/4.0/).
Share and Cite
Arevalillo, J.M.; Navarro, H. Skewness-Kurtosis Model-Based Projection Pursuit with Application to Summarizing Gene Expression Data. Mathematics 2021, 9, 954. https://doi.org/10.3390/math9090954
Arevalillo JM, Navarro H. Skewness-Kurtosis Model-Based Projection Pursuit with Application to Summarizing Gene Expression Data. Mathematics. 2021; 9(9):954. https://doi.org/10.3390/math9090954
Chicago/Turabian StyleArevalillo, Jorge M., and Hilario Navarro. 2021. "Skewness-Kurtosis Model-Based Projection Pursuit with Application to Summarizing Gene Expression Data" Mathematics 9, no. 9: 954. https://doi.org/10.3390/math9090954
APA StyleArevalillo, J. M., & Navarro, H. (2021). Skewness-Kurtosis Model-Based Projection Pursuit with Application to Summarizing Gene Expression Data. Mathematics, 9(9), 954. https://doi.org/10.3390/math9090954