
Short-Term Scheduling Model of Cluster Tool in Wafer Fabrication

Abstract
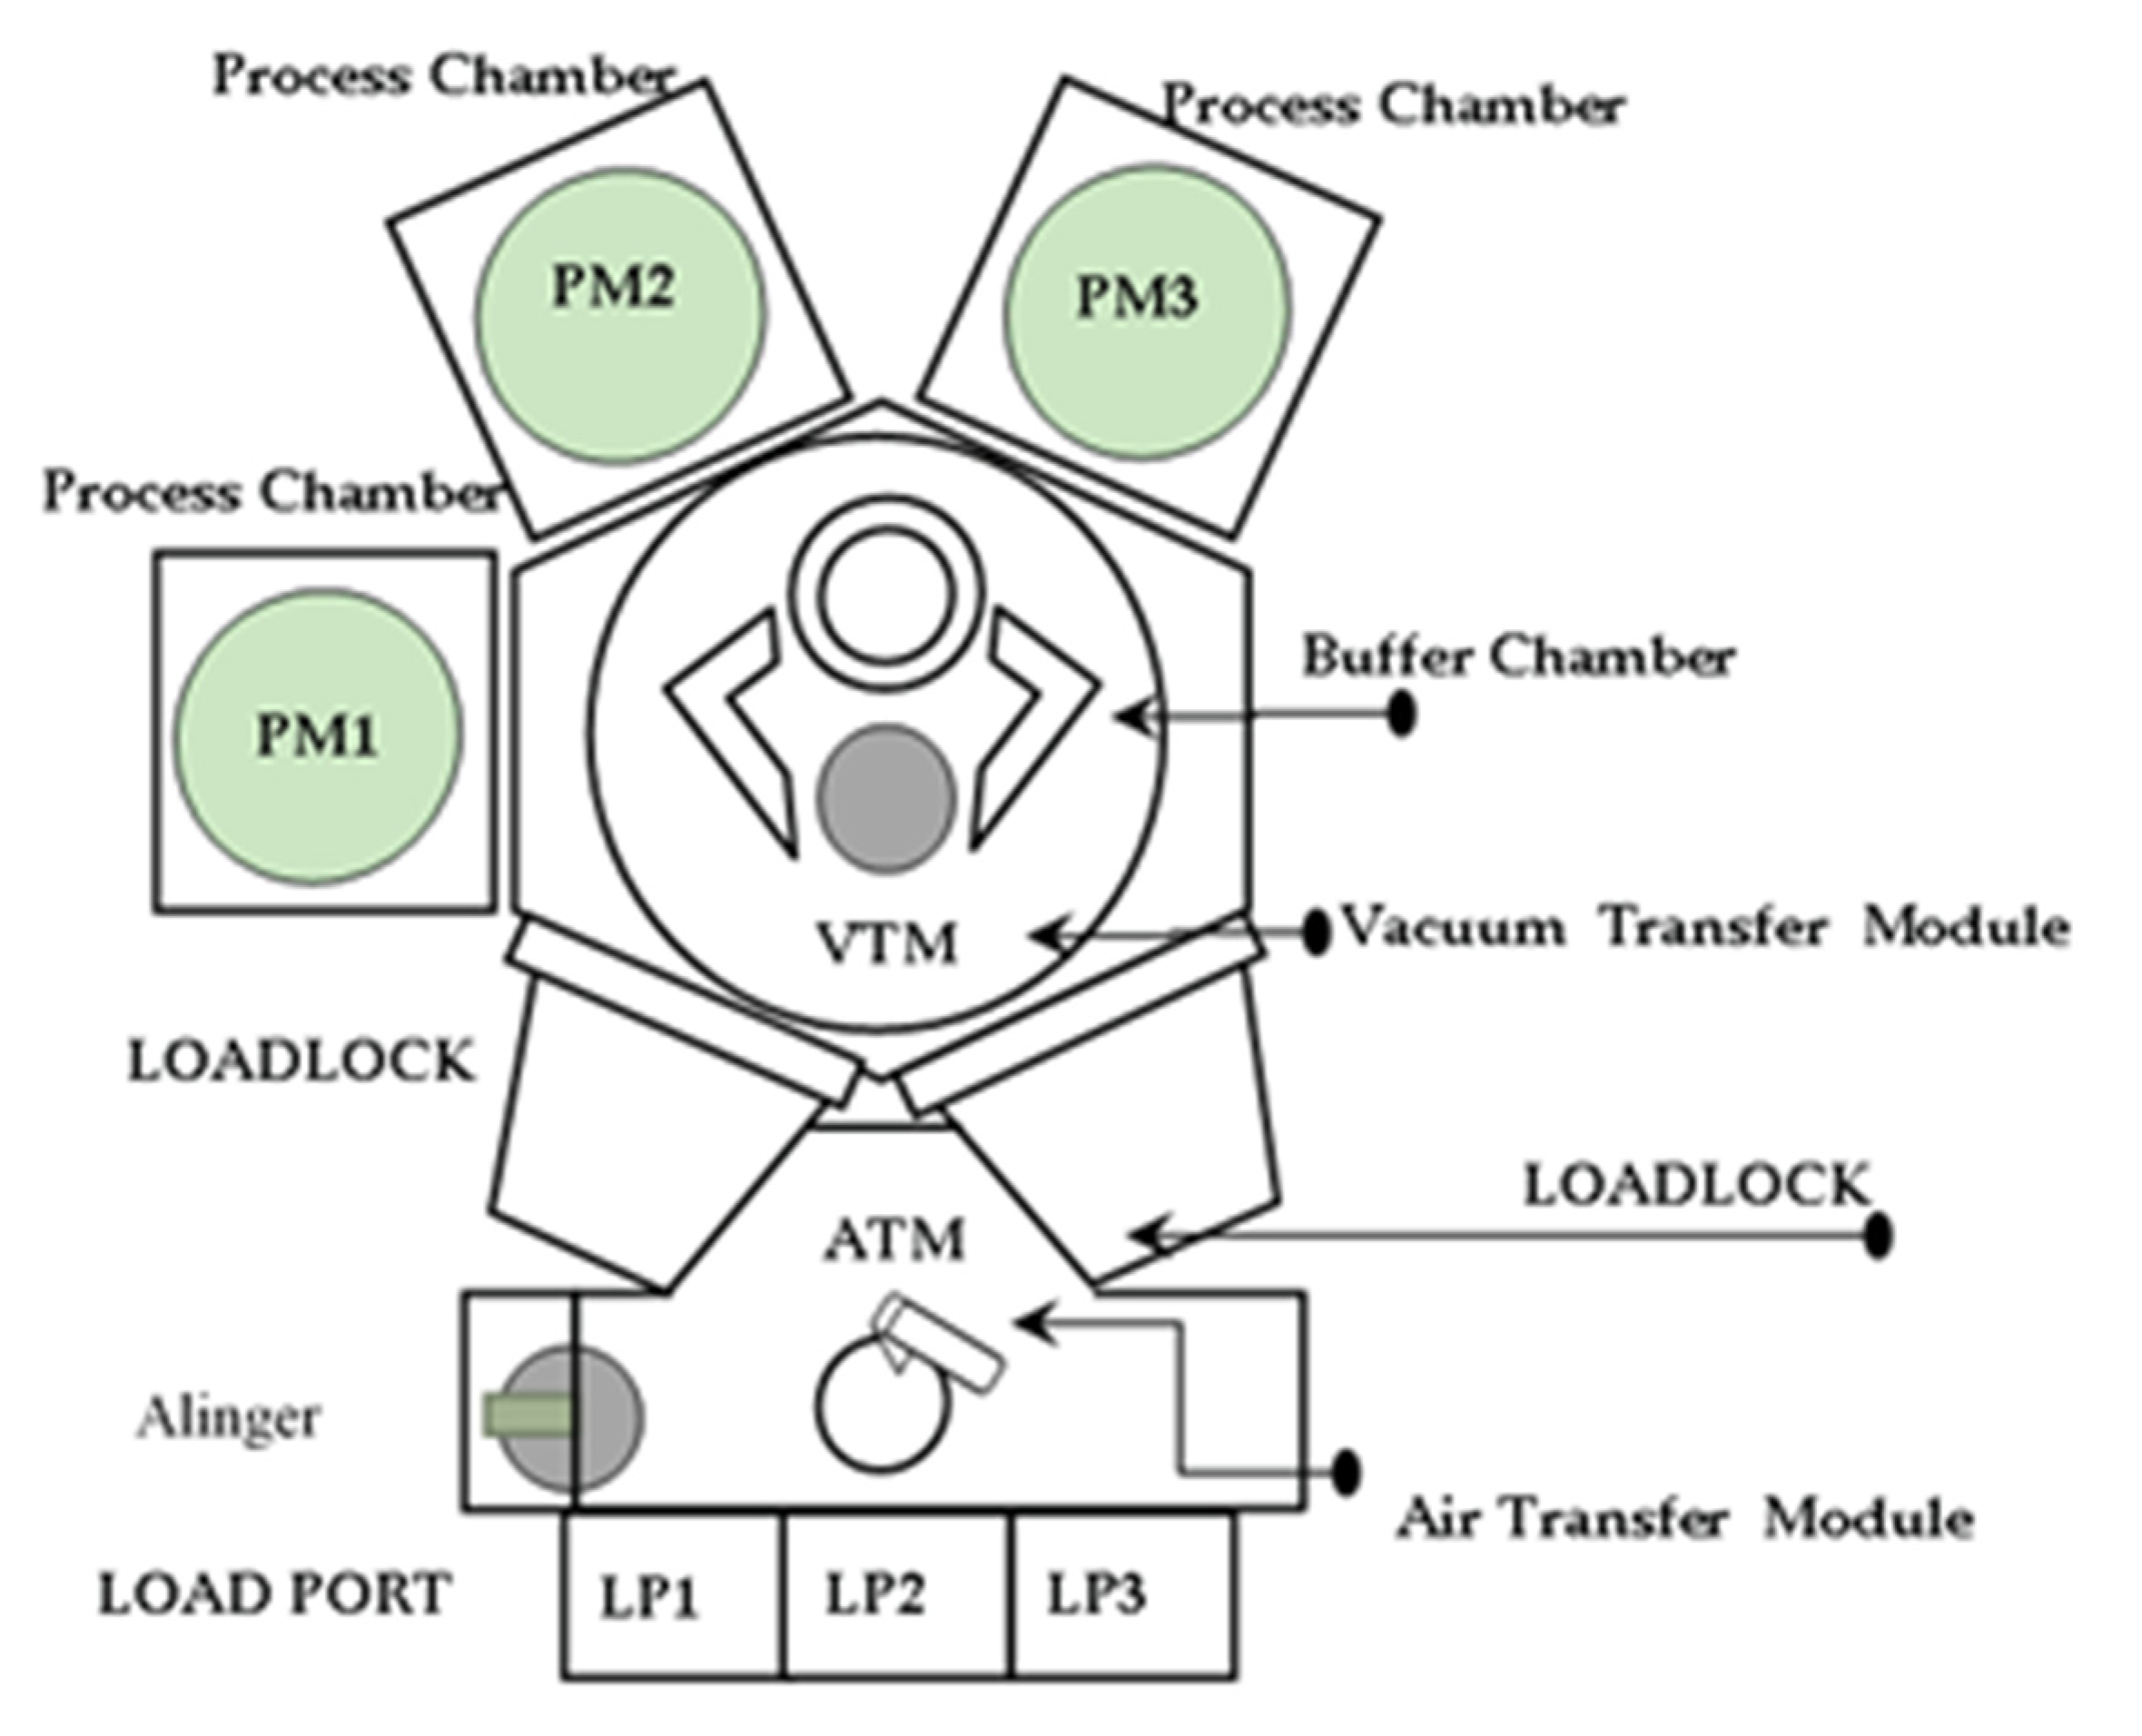
1. Introduction
2. Literature Review
3. Short-Term Scheduling Model
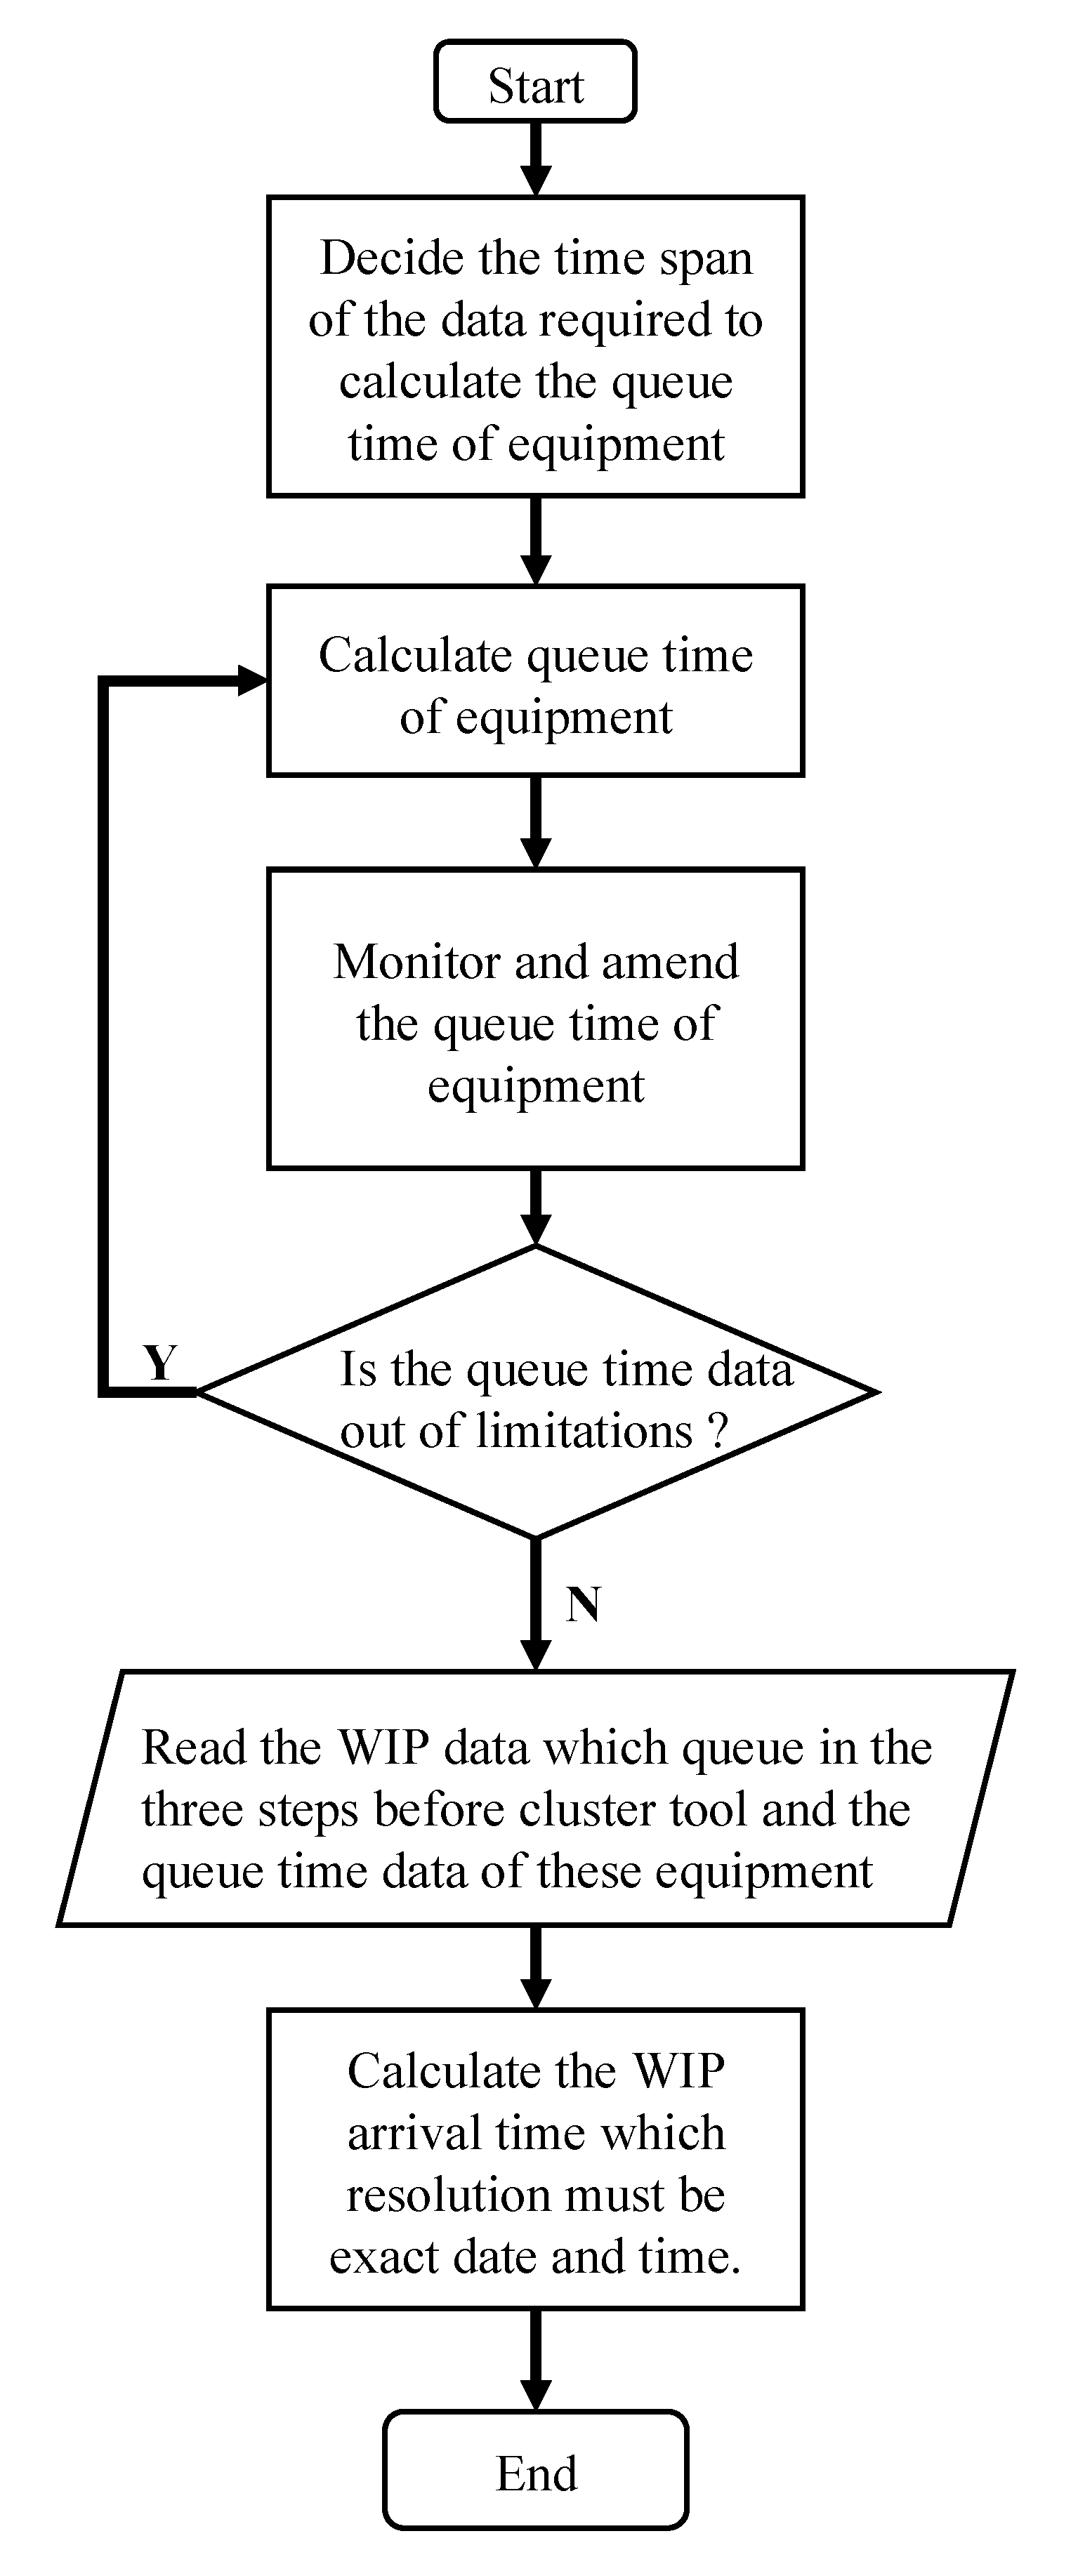
3.1. Arrival Time Estimation
3.1.1. Step 1. Decide the Time Span (TS) of the Data Required to Calculate the Queue Time of Equipment
3.1.2. Step 2. Calculate Queue Time of Equipment
3.1.3. Step 3. Monitor and Amend the Queue Time of Equipment
3.2. Short-Term Scheduling
3.2.1. Step 1. Set the Latest Time Which WIP Should Be Processed
3.2.2. Step 2. Estimate the Complete Time of Processing Lots
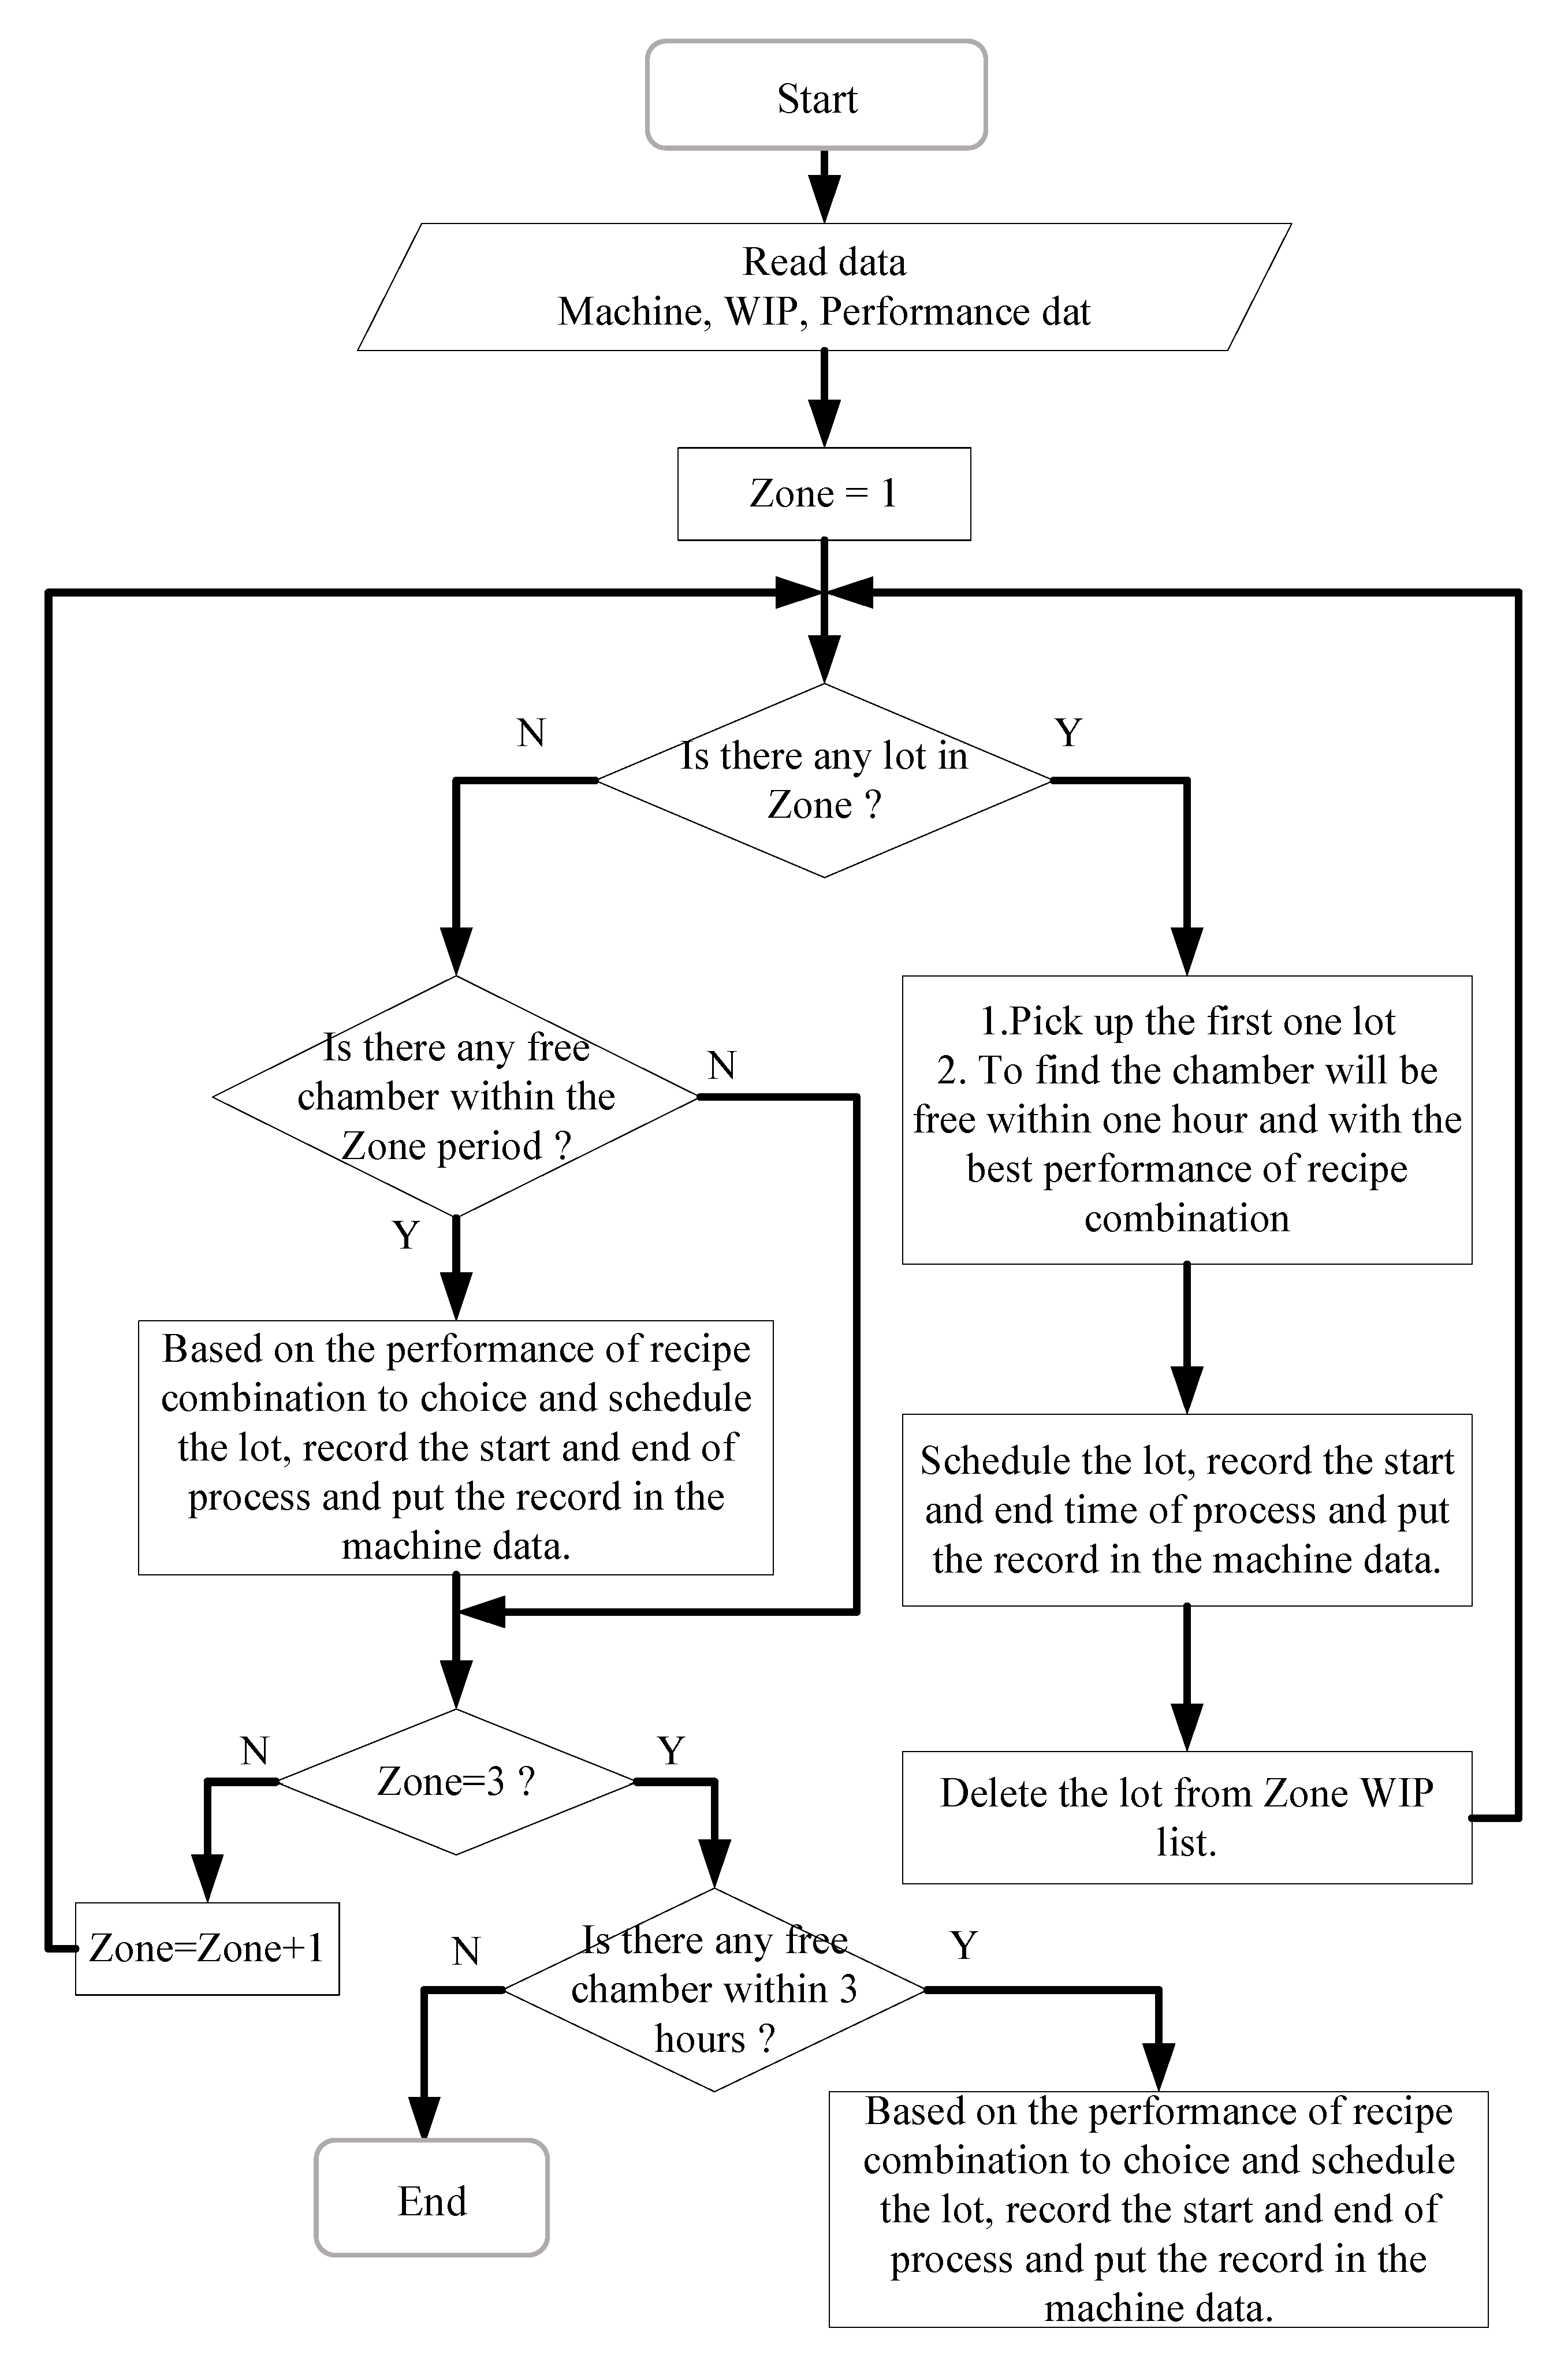
3.2.3. Step 3. Arrange the Next 3 h of Production Activities for Each Machine in This Workstation
- Step 3.1. Read Data
- Step 3.2. Capacity check and allocate for each zone
- Step 3.3. Schedule Lots
4. Performance Comparison with Dissimilar Model
5. Conclusions
Funding
Institutional Review Board Statement
Informed Consent Statement
Data Availability Statement
Acknowledgments
Conflicts of Interest
References
- Liao, D.Y. Automation and Integration in Semiconductor Manufacturing. In Semiconductor Technologies; Exclusive Books: Johannesburg, South Africa, 2010; pp. 39–56. [Google Scholar]
- Kim, D.K.; Lee, T.E.; Lim, H.J. Optimal scheduling of transient cycles for single-armed cluster tools with parallel chambers. IEEE Trans. Autom. Sci. Eng. 2016, 13, 1165–1175. [Google Scholar] [CrossRef]
- Lee, T.E. A review of scheduling theory and methods for semiconductor manufacturing cluster tools. In Proceedings of the 40th Conference on Winter Simulation, 2008 Winter Simulation Conference, Miami, FL, USA, 7–10 December 2008; pp. 2127–2135. [Google Scholar]
- Tu, Y.M. Throughput Estimation Model of Cluster Tool in Semiconductor Manufacturing. Key Eng. Mater. 2019, 814, 196–202. [Google Scholar] [CrossRef]
- Tu, Y.M. Capacity estimation model of cluster tool in wafer fabrication. Int. J. Adv. Sci. Technol. 2020, 29, 1877–1882. [Google Scholar]
- Lim, Y.; Yu, T.S.; Lee, T.E. Adaptive Scheduling of Cluster Tools with Wafer Delay Constraints and Process Time Variation. IEEE Trans. Autom. Sci. Eng. 2019, 17, 375–388. [Google Scholar] [CrossRef]
- Yu, Q.; Yang, H.; Lin, K.Y.; Li, L. A Predictive Dispatching Rule Assisted by Multi-Layer Perceptron for Scheduling Wafer Fabrication Lines. J. Comput. Inf. Sci. Eng. 2020, 20, 031001. [Google Scholar] [CrossRef]
- Wang, L.C.; Chu, P.C.; Lin, S.Y. Impact of capacity fluctuation on throughput performance for semiconductor wafer fabrication. Robot. Comput. Integr. Manuf. 2019, 55, 208–216. [Google Scholar] [CrossRef]
- Weigang, J.; Ringel, R.; Kalisch, S.; Quarg, T. Method and system for scheduling a stream of products in a manufacturing environment by using process-specific WIP limits. U.S. Patent No. 8,185,226, 22 May 2012. [Google Scholar]
- Uzsoy, R.; Lee, C.Y.; Martin-Vega, L.A. A Review of Production Planning and Scheduling Models in Semiconductor Industry Part I: System Characteristics, Performance Evaluation and Production Planning. IIE Trans. 1992, 24, 47–60. [Google Scholar] [CrossRef]
- Toba, H.; Izumi, H.; Hatada, H.; Chikushima, T. Dynamic load balancing among multiple fabrication lines through estimation of minimum inter-operation time. IEEE Trans. Semicond. Manuf. 2005, 18, 202–213. [Google Scholar] [CrossRef]
- Lee, Y.Y.; Hsiao, C.C. Cross area lot arrangement—Shortest inter cycle time. In Proceedings of the 2007 International Symposium on Semiconductor Manufacturing Conference, Santa Clara, CA, USA, 15–17 October 2007. [Google Scholar]
- Chang, C.S.; Lo, H.L.; Pan, C.C.; Wu, D.L. Advanced effective dispatching method for 300mm Twin-Phase Twin-Fab. In Proceedings of the 2009 IEEE/SEMI Advanced Semiconductor Manufacturing Conference, Berlin, Germany, 10–12 May 2009; pp. 76–79. [Google Scholar]
- Lee, Y.F.; Jiang, Z.B.; Liu, H.R. Multiple-objective scheduling and real-time dispatching for the semiconductor manufacturing system. Comput. Oper. Res. 2009, 36, 866–884. [Google Scholar] [CrossRef]
- Mathirajan, M.; Sivakumar, A.I.; Kalaivani, P. An efficient simulated annealing algorithm for scheduling burn-in oven with non-identical job sizes. Int. J. Appl. Manag. Technol. 2004, 2, 117–138. [Google Scholar]
- Kim, Y.D.; Joo, B.J.; Choi, S.Y. Scheduling wafer lots on diffusion machines in a semiconductor wafer fabrication facility. IEEE Trans. Semicond. Manuf. 2010, 23, 246–254. [Google Scholar]
- Kurz, M.E.; Mason, S.J. Minimizing total weighted tardiness on a batch-processing machine with incompatible job families and job ready times. Int. J. Prod. Res. 2008, 46, 131–151. [Google Scholar] [CrossRef]
- Klemmt, A.; Weigert, G.; Werner, S. Optimisation approaches for batch scheduling in semiconductor manufacturing. Eur. J. Ind. Eng. 2011, 4, 338–359. [Google Scholar] [CrossRef]
- Yugma, C.; Dauzere-Peres, S.; Derreumaux, A.; Sibille, O. A Batch Optimization Sofware for diffusion area scheduling in semiconductor manufacturing. In Proceedings of the 2008 IEEE/SEMI Advanced Semiconductor Manufacturing Conference IEEE, Cambridge, MA, USA, 5–7 May 2008; pp. 327–332. [Google Scholar]
- Yurtsever, T.; Kutanoglu, E.; Johns, J. Heuristic based scheduling system for diffusion in semiconductor manufacturing. In Proceedings of the Winter Simulation Conference, Winter Simulation Conference, Austin, TX, USA, 13–16 December 2009; pp. 1677–1685. [Google Scholar]
- Cakici, E.; Scott, J.M. Parallel machine scheduling subject to auxiliary resource constraints. Prod. Plan. Control 2007, 18, 217–225. [Google Scholar] [CrossRef]
- Mazumdar, C.S.; Mathirajan, M.; Gopinath, R.; Sivakumar, A.I. Tabu search methods for scheduling a burn-in oven with non-identical job sizes and secondary resource constraints. Int. J. Oper. Res. 2008, 3, 119–139. [Google Scholar] [CrossRef]
- Chien, C.F.; Chen, C.H. A novel timetabling algorithm for a furnace process for semiconductor fabrication with constrained waiting and frequency-based setups. Or Spectr. 2007, 29, 391–419. [Google Scholar] [CrossRef]
- Bixby, R.; Burda, R.; Miller, D. Short-interval detailed production scheduling in 300mm semiconductor manufacturing using mixed integer and constraint programming. In Proceedings of the 17th Annual SEMI/IEEE ASMC 2006 Conference, IEEE, Boston, MA, USA, 22–24 May 2006; pp. 148–154. [Google Scholar]
- Fordyce, K.; Bixby, R.; Burda, R. Technology that upsets the social order: A paradigm shift in assigning lots to tools in a wafer fabricator—The transition from rules to optimization. In Proceedings of the 40th Conference on Winter Simulation, Winter Simulation Conference, Miami, FL, USA, 7–10 December 2008; pp. 2277–2285. [Google Scholar]
- Cochran, J.K.; Horng, S.M.; Fowler, J.W. A multi-population genetic algorithm to solve multi-objective scheduling problems for parallel machines. Comput. Oper. Res. 2003, 30, 1087–1102. [Google Scholar] [CrossRef]
- Swamidass, P.M. (Ed.) Encyclopedia of Production and Manufacturing Management; Springer Science & Business Media: Berlin/Heidelberg, Germany, 2000. [Google Scholar]
- Postorino, M.N.; Versaci, M. A geometric fuzzy-based approach for airport clustering. Adv. Fuzzy Syst. 2014, 2014, 201243. [Google Scholar] [CrossRef]
- Mahela, O.P.; Khan, B.; Alhelou, H.H.; Siano, P. Power quality assessment and event detection in distribution network with wind energy penetration using stockwell transform and fuzzy clustering. IEEE Trans. Ind. Inform. 2020, 16, 6922–6932. [Google Scholar] [CrossRef]
- Bagherinia, A.; Minaei-Bidgoli, B.; Hosseinzadeh, M.; Parvin, H. Reliability-based fuzzy clustering ensemble. Fuzzy Sets Syst. 2021, 413, 1–28. [Google Scholar] [CrossRef]
- Wang, Q.; Yang, X. Investigating the sustainability of renewable energy–An empirical analysis of European Union countries using a hybrid of projection pursuit fuzzy clustering model and accelerated genetic algorithm based on real coding. J. Clean. Prod. 2020, 268, 121940. [Google Scholar] [CrossRef]


| Recipe | PT (Sec) | WAC1 (Sec/Lot) | WAC2 (Sec/PCS) | WAC3 (Sec/Lot) | Stable + Others (Sec/PCS) | WPH | Rate |
|---|---|---|---|---|---|---|---|
| TR1 | 150 | 200 | 80 | 80 | 30 | 13.27 | 60% |
| TR2 | 310 | 200 | 80 | 80 | 30 | 8.35 | 30% |
| TR3 | 250 | 200 | 80 | 80 | 30 | 9.70 | 10% |
| Priority | Combination |
|---|---|
| 1 | TR1 + TR2 + TR3 |
| 2 | TR2 + TR3 + TR3 |
| 3 | TR3 + TR2 + TR2 |
| 4 | TR2 + TR2 + TR2 |
| 5 | TR2 + TR1 + TR1 |
| 6 | TR1 + TR3 + TR3 |
| 7 | TR1 + TR2 + TR2 |
| 8 | TR3 + TR3 + TR3 |
| 9 | TR3 + TR1 + TR1 |
| 10 | TR1 + TR1 + TR1 |
| Arrival Time | Recipe | TC Flag | Remaining TC (min) |
|---|---|---|---|
| 0.0000 | R3 | 1 | 119 |
| 0.0000 | R1 | 0 | 0 |
| 0.0000 | R3 | 1 | 393 |
| 0.0000 | R1 | 0 | 0 |
| 0.0000 | R2 | 0 | 0 |
| 0.0000 | R2 | 0 | 0 |
| 35:34.5800 | R1 | 0 | 0 |
| 1:16:00.8173 | R1 | 0 | 0 |
| 2:02:07.1239 | R3 | 1 | 68 |
| 2:43:59.7596 | R1 | 0 | 0 |
| 3:22:57.2514 | R1 | 0 | 0 |
| 3:53:14.4643 | R2 | 0 | 0 |
| 4:24:22.9500 | R2 | 0 | 0 |
| CT_Mean (Min/Lot) | CT_Dev (Min/Lot) | PT_Mean (Min/Lot) | PT_Dev (Min/Lot) | Throughput (Lot) | Over_TC (Lot) | |
|---|---|---|---|---|---|---|
| R1 | 3144 | 1010 | 114 | 1 | 591 | |
| R2 | 7541 | 3138 | 181 | 1 | 220 | |
| R3 | 233 | 64 | 159 | 1 | 110 | |
| Total | 3846 | 2853 | 136 | 29 | 921 | 0 |
| CT_Mean (Min/Lot) | CT_Dev (Min/Lot) | PT_Mean (Min/Lot) | PT_Dev (Min/Lot) | Throughput (Lot) | Over_TC (Lot) | |
|---|---|---|---|---|---|---|
| R1 | 4950 | 1947 | 114 | 2 | 529 | |
| R2 | 5172 | 1941 | 181 | 1 | 259 | |
| R3 | 200 | 29 | 159 | 2 | 110 | 2 |
| Total | 4432 | 2414 | 139 | 30 | 898 | 2 |
| CT_Mean (Min/Lot) | CT_Dev (Min/Lot) | PT_Mean (Min/Lot) | PT_Dev (Min/Lot) | Throughput (Lot) | Over_TC (Lot) | |
|---|---|---|---|---|---|---|
| R1 | 4380 | 1775 | 115 | 2 | 541 | |
| R2 | 4601 | 1755 | 181 | 1 | 266 | |
| R3 | 4266 | 1900 | 159 | 2 | 94 | 94 |
| Total | 4433 | 1784 | 139 | 30 | 901 | 94 |
Publisher’s Note: MDPI stays neutral with regard to jurisdictional claims in published maps and institutional affiliations. |
© 2021 by the author. Licensee MDPI, Basel, Switzerland. This article is an open access article distributed under the terms and conditions of the Creative Commons Attribution (CC BY) license (https://creativecommons.org/licenses/by/4.0/).
Share and Cite
Tu, Y.-M. Short-Term Scheduling Model of Cluster Tool in Wafer Fabrication. Mathematics 2021, 9, 1029. https://doi.org/10.3390/math9091029
Tu Y-M. Short-Term Scheduling Model of Cluster Tool in Wafer Fabrication. Mathematics. 2021; 9(9):1029. https://doi.org/10.3390/math9091029
Chicago/Turabian StyleTu, Ying-Mei. 2021. "Short-Term Scheduling Model of Cluster Tool in Wafer Fabrication" Mathematics 9, no. 9: 1029. https://doi.org/10.3390/math9091029
APA StyleTu, Y.-M. (2021). Short-Term Scheduling Model of Cluster Tool in Wafer Fabrication. Mathematics, 9(9), 1029. https://doi.org/10.3390/math9091029