Abstract
Over the last decade, hundreds of thousands of volunteers have contributed to science by collecting or analyzing data. This public participation in science, also known as citizen science, has contributed to significant discoveries and led to publications in major scientific journals. However, little attention has been paid to data quality issues. In this work we argue that being able to determine the accuracy of data obtained by crowdsourcing is a fundamental question and we point out that, for many real-life scenarios, mathematical tools and processes for the evaluation of data quality are missing. We propose a probabilistic methodology for the evaluation of the accuracy of labeling data obtained by crowdsourcing in citizen science. The methodology builds on an abstract probabilistic graphical model formalism, which is shown to generalize some already existing label aggregation models. We show how to make practical use of the methodology through a comparison of data obtained from different citizen science communities analyzing the earthquake that took place in Albania in 2019.
1. Introduction
Citizen science (CS) is scientific research conducted, in whole or in part, by amateur (or nonprofessional) scientists [1]. Haklay [2] offers an overview of the typologies of the level of citizen participation in citizen science, which range from “crowdsourcing” (level 1), where the citizen acts as a sensor, to “distributed intelligence” (level 2), where the citizen acts as a basic interpreter, to “participatory science”, where citizens contribute to problem definition and data collection (level 3), to “extreme citizen science”, which involves collaboration between the citizen and scientists in problem definition, collection and data analysis. In this work we focus on distributed intelligence citizen science tasks where the citizen provides basic interpretations of data. Examples of tasks under the scope would be (i) citizens classifying images of living species in a taxonomy or (ii) citizens determining whether a tweet contains relevant information for the evaluation of a specific natural disaster.
The current practice tackles distributed intelligence citizen science tasks by (i) determining a set of tasks that need to be solved/annotated/interpreted; then (ii) distributing each of those tasks to a set of citizens who solve them; and finally (iii) aggregating the solutions from the citizens to obtain a consensus solution for each task. Steps (i) and (ii) are usually guided by tools such as Pybossa [3]. In this work we focus mainly on stage (iii), that is, how to perform the aggregation of different citizens’ annotations for a specific task. However, we will see that models used to aggregate citizens’ annotations can also be used to influence stage (ii) in the decision of how many citizens, and more specifically, which citizens, should be requested to solve a specific task.
Data fusion in citizen science is a very wide topic [4,5,6]. For the specific subtopic of interest in this paper, that of label aggregation, the state-of-the-art citizen science applications aggregate the annotations of different citizen scientists on a specific task by using majority voting [7]. That is, the option that gets the larger number of votes is the option considered as correct, with each citizen’s opinion having the very same weight. However, the problem of aggregating different annotations has received a lot of attention from the statistics and machine learning communities, where more complex aggregation procedures have been introduced. The contributions of our work are (i) the introduction of a probabilistic model-based approach to aggregate annotations with citizen science applications in mind, and (ii) providing a case study that shows the added value in a citizen science scenario: the comparison of the data quality that can be obtained from different communities, where a gold set for measuring quality is unavailable. Furthermore, we approach the problem from an epistemic probabilistic perspective [8], relying as much as possible on information-theoretic concepts [9,10].
We start by reviewing related work in Section 2. After that, we provide an abstract probabilistic model for the annotation problem in Section 3. Later, in Section 4 we particularize our abstract model into two different models (multinomial and Dawid–Skene) when annotations are selected out of a discrete set of possible labels. In Section 5 we show how our mathematical model can be used in a specific application scenario to evaluate the data quality of different communities performing the annotation. In addition, we conduct predictive inference about the quality of data in hypothetical scenarios within these very same communities. Finally, Section 6 concludes and discusses future work.
2. Related Work
The problem of label aggregation in crowdsourcing has received a lot of attention from the statistics and machine learning communities, starting from classical latent class models [11]. A succinct review of latent class analysis can be found in [12]. A well-known specific application of latent class analysis to label aggregation is the seminal work of Dawid and Skene [13]. Another one is the simpler multinomial model presented in [14]. Passonneau and Carpenter [15] highlight the relevance of relying on an annotation model for the analysis of crowdsourcing data. Paun et al. [14] provide a comparison of different probabilistic annotation models for the task, and conclude that using partially pooled models, such as the hierarchical Dawid–Skene model, results in very good performance among different datasets and applications.
From the methodological perspective, perhaps a more mature alternative is the CrowdTruth framework [16,17]. The conceptual departure point for this framework is the paper by Aroyo and Welty [18], which provides a good overview of the usual misconceptions in label aggregation. Their arguments are aligned with those in this paper, in particular with respect to the myths that there is “only one truth” and that “one expert is enough”. Dumitrache et al. [19] provide specifics on the quality metrics used in CrowdTruth, which incorporate the ambiguities and the inter-dependency of the crowd, input data and annotations. However, although intuitive and useful, these specifics lack a strong probabilistic and information theoretic background, which is the approach taken in this work.
Bu et al. [20] propose a graph model to handle both single- and multiple-step classification tasks and try to “infer the correct label path”. They present an “adapted aggregation method” for three existing inference algorithms, namely ‘majority voting’, ‘expectation-maximization’ [21] and ‘message-passing’ [22].
Recently, Nguyen et al. [23] have presented the CLARA framework, which is in production at Facebook and relies on a Bayesian probabilistic model. In their work, they show that the consensus achieved by CLARA is clearly better than that obtained by majority voting. However, the application scenario is restricted to a binary labeling problem, whilst in citizen science scenarios many-valued labeling is frequently found.
Given the fact that even the subject-matter experts can disagree for a given task (e.g., the diagnosis of a patient), the quality of the data generated by crowdsourcing needs to be ensured, or at least soundly measured. Some of the obvious reasons for this need are that the participating citizens are not necessarily experts in the field, and that the protocol itself that they are asked to follow in processing the task may lead to mistakes. Accordingly, the citizen science community has put considerable effort into defining the dimensions of data quality (e.g., [24]) and building effective strategies to improve the quality (e.g., [25,26]). This is still a hot research topic and new methods are continuously being suggested.
Since the skills of each participating citizen may vary, efficient methods of task assignation have also been studied to minimize the cost and/or maximize the accuracy of a crowdsourcing project (e.g., [22,27]).
3. Modeling the Domain
In this section we provide our conceptual and mathematical model of the citizen science crowdsourcing domain. The conceptual modeling presented in Section 3.1 is deeply influenced by the CrowdTruth framework [16]. We start by using an example to help capture the three most relevant concepts. After the conceptual model has been presented, we turn it into a probabilistic model in Section 3.2.
3.1. Participating Concepts: Tasks, Workers and Annotations
We start with an example in the disaster management area to help us make concrete the intervening concepts. Timely and accurate management when a natural disaster occurs is of fundamental importance to diminish the humanitarian impact of the disaster. However, timely and accurate disaster management requires the presence of an information system reporting the places that have been more damaged and the specifics of the support required. Information is usually scarce when a disaster occurs and social networks have been shown to provide a wealth of images and videos describing details of the disaster. Hence, structuring that information is of foremost importance for adequate disaster management. Software is already available for selecting tweets with images that potentially contain valuable information (e.g., [28]). Although computer vision advances in the last decade are astonishing, it is still the case that even the best AI-based software for the task is still far from resulting in high-quality selection and classification of the images. Fortunately, citizen scientists can help in this endeavor. Each of the images obtained from the social network by the AI can be distributed to a set of citizen scientists that can help labeling that image either as irrelevant for the task at hand or with the degree of damage observed, measuring the degree of damage as either no-damage, minimal, moderate or severe. After this annotation process takes place, we need to reconcile different labels from citizen scientists for each image and use that information to report to the disaster relief organization.
The main concepts in our model are as follows.
- Worker
- A worker is any of the participants in the annotation process. In our example, each of the volunteer citizen scientists involved in labeling images is a worker.
- Task
- A task can be understood as the minimal piece of work that can be assigned to a worker. In our example, labeling each of the images obtained from Twitter is a task.
- Annotation
- An annotation is the result of the processing of the task by the worker. An example of annotation in the above described disaster management example conveys the following information: Task 22 has been labeled by worker 12 as moderate.
3.2. Abstract Mathematical Model
Next, we present a mathematical model of the problem. We start with a finite set of workers , a finite set of tasks and a finite set of annotations We assume that two different workers can have different features. So, to characterize each worker we introduce a set , which we refer to as worker feature space, and a feature mapping . Thus, for each worker , provides a description of the worker capabilities and characteristics. Following the same pattern, we assume that two different tasks can also each have distinctive features, and introduce a set (the task feature space) and a mapping so that for each task , provides a description of the task characteristics.
Each annotation is the result of the processing of a task by a worker. Function maps each annotation to its worker and function maps each annotation to its task. Finally, we also introduce a set , which we refer to as annotation feature space and mapping so that for each , describes the annotation characteristics. The spaces and mappings introduced above and represented in Figure 1 provide a backbone on which we can build.
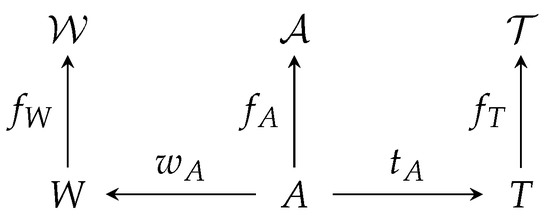
Figure 1.
Spaces and mappings in our mathematical model.
The main reason for requesting the annotation of tasks by workers is that we are interested in determining a specific characteristic (or a set of characteristics) of the task that is (are) unknown to us. We assume that we can factor the task feature space as , where contains the observable characteristics, contains those unobservable characteristics in which we are interested and contains those characteristics of the tasks that are unobservable and in which we are not interested in the consensus. Epistemologically, we model our lack of knowledge by means of a probability distribution, and hence we are interested in determining a probability distribution over We call such a distribution a joint consensus. In its most general form, a joint consensus allows dependencies between the consensuses of different tasks. In this paper we will restrict our interest to individual task consensuses; that is, the marginal distribution of the joint consensus for each task.
Similarly, we can split the worker feature space as , where contains the observable characteristics and contains the unobservable characteristics.
We also assume the existence of some general characteristics that are relevant for the annotation. Here, the word ‘general’ is used in the sense of not directly related to a specific task or a specific annotator. We represent the domain characteristics by an element , where we refer to as the domain space.
3.3. The Consensus Problem
The conceptual framework introduced above allows us to properly define what a consensus problem is. It takes as inputs the following:
- The number of workers , tasks and annotations
- For each worker , its observable characteristics, namely
- For each task , its observable characteristics, namely
- For each annotation , the task being annotated (), the worker that did the annotation () and the annotated characteristics ()
- A probabilistic model of annotation, consisting of the following:
- -
- An emission model , returning the probability that in a domain of characteristics , a worker with characteristics annotates a task with characteristics with label
- -
- A joint prior over every unobservable characteristic
Provided with the input of a consensus problem, our probability distribution factorizes as shown in Figure 2 and we can write
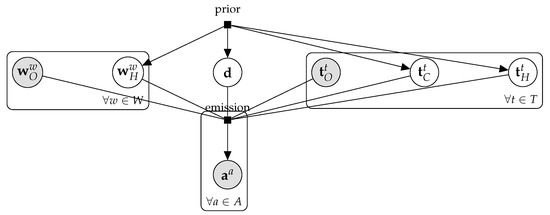
Figure 2.
Probabilistic graphical model description of the abstract consensus model.
It is important to highlight that, similarly to what happens in latent class models, our model encodes a conditional independence assumption. Our model assumes that annotations are independent from one another provided that we are given all the characteristics of the task, the domain and the worker. However, the conditional independence assumption encoded in latent class models is much stronger. They assume that annotations are independent provided that we know the task label. This assumption has been widely identified as a drawback of this model (as argued for example in [29], where some approaches for overcoming this drawback are also presented). By incorporating dependence on the available characteristics of the task and the annotator, the independence assumption included in our framework is much milder and justifiable. That said, the simpler incarnations of our generic model used later in the paper to analyze the Albania earthquake are in fact latent class models and, as such, encode a strong conditional independence assumption.
The objective of a consensus problem is answering a probabilistic query to this probability distribution. For example, finding the joint consensus , which can be done by marginalizing out every hidden variable except the consensus variables .
4. Discrete Annotation Models
The abstract probabilistic model presented above is overly general and can be particularized in many different ways. Here, as in most of the cases in the literature, we assume that workers are requested to select from a finite set of annotations (the annotation feature space is restricted to be a finite set). That is, when presented with a task, each annotator will annotate it by selecting an element Following the disaster management example in Section 3.1, imagine that the problem at hand is the classification of images into one of five different categories: irrelevant,no-damage, minimal, moderate or severe. In that case, we will request each worker to annotate an image by selecting a label from Furthermore, in discrete annotation models, each task is considered to have an unobservable characteristic: its “real” label. That is, Next, we will see how different discrete annotation models can be accommodated into our framework.
4.1. The Multinomial Model
Perhaps the simplest model of annotation is the pooled multinomial model [14]. In the pooled multinomial model:
- Tasks are indistinguishable other than by their real classes. That is, the task feature space with and
- The general domain characteristics store the following:
- The probability that the “real” label of a task comes from each of the classes. Thus, the domain space is , that is, the set of probability distributions over This domain can be encoded as a stochastic vector of dimension , where can be understood as the probability of a task being of class
- The noisy labeling model for this simple model is the same for each worker. It has as characteristic an unobservable stochastic matrix of dimension Intuitively, element of the matrix can be understood as “the probability that a worker labels an image of class with label ” Thus, when is the identity matrix, our workers are perfect reporters of the real label. The further away from the identity, the bigger the confusion.
- Workers are indistinguishable from one another. Hence,
- The emission model in this case is
- The prior is assumed to be a Dirichlet both for and for each of the rows of and also encodes that is the prior for the real label of the tasks.where , , and .
The main problem from the pooled multinomial model originates from the assumption that workers are indistinguishable from each other. This assumption is dropped in the model presented below.
4.2. The DS Model
Dawid and Skene [13] proposed one of the seminal models for crowdsourcing, the Dawid–Skene (DS) model. In this section we see how to map the DS model to our abstract framework. The DS model draws inspiration from the multinomial model, but instead of having a single noisy labeling model, it introduces a noisy labeling model per worker. Thus, in the DS model
- Tasks are indistinguishable other than by their real classes.
- The general domain characteristics store only the stochastic vector with the probability that the “real” label of a task comes from each of the classes.
- Each worker w has as characteristic an unobservable stochastic matrix Intuitively, element of the matrix can be understood as “the probability of worker w labeling an image of real class with label ”
- The emission model in this case is
- The prior is assumed to be a Dirichlet both for p and for each of the rows of . (The DS model, as presented in [13], used maximum likelihood to estimate its parameters and thus no prior was presented. Later, Paun et al. [14] presented the prior provided here.)where , and are the same as for the multinomial model and
5. Evaluating Data Quality in Highly Uncertain Scenarios
In the previous section we presented a general framework and particularized it into two well-known specific models. Now, we provide an example of how our framework can be actioned to help data quality analysis in citizen science projects.
Usually, three standard methods are used for ensuring the reliability of citizen science data:
- Gold sets measure accuracy by comparing annotations to a ground truth;
- Auditing measures both accuracy and consistency by having an expert review the labels;
- Consensus, or overlap, measures consistency and agreement amongst a group.
We are particularly interested in building a methodology for quality assurance in scenarios, such as disaster response, where gold sets would be unavailable. In such domains, auditing may be used under the hypothesis of infallible experts (e.g., [30]). However, in Section 5.2, we show that this hypothesis does not necessarily hold in every domain. Thus, our approach is to rely on our probabilistic consensus model introduced above. We describe how to do it by following an example.
In Section 5.1, we detail the process of data collection from expert, volunteer and paid worker communities. Section 5.2 analyzes inter-expert agreement. In Section 5.3, we further scrutinize the error rates of the experts. For this evaluation, we employ our multinomial model to build their consensus and noisy labeling model. Section 5.4 and Section 5.5 exploit the experts’ consensus using it as the ground truth for the analysis of the quality of data collected from the volunteer and paid worker communities. This analysis allows us to compare the performances of these two communities, which is increasingly being discussed within the citizen science research community (e.g., [31]). Furthermore, in Section 5.6, we show how our probabilistic model can also be leveraged for a predictive analysis to estimate the number of annotations required to reach the desired accuracy for each of the three communities we worked with.
5.1. Data and Methodology
To form the set of tasks for citizen scientists, we used the social media data that were collected right after the earthquake that struck Albania on 26 November 2019. It was the strongest earthquake to hit the country in more than 40 years and the world’s deadliest in 2019 (https://en.wikipedia.org/wiki/2019_Albania_earthquake, accessed on 25 February 2021).
The extraction of the disaster information from Twitter, its filtering and automatic classification were all carried out by the AIDR image processing system [28,30], which collected data during four consecutive days following the earthquake. Out of 9241 collected tweets, AIDR produced a dataset of 907 images that it deemed relevant.
Since we lacked a gold set for our domain of interest, first we needed to establish a ground truth. Hence, we contacted a group of ten experts with prior knowledge of disaster response and crisis data. We presented the set of 907 images as tasks to the experts via the Crowd4EMS platform [32]. Crowd4EMS combines automatic methods for gathering information from social media and crowdsourcing techniques, in order to manage and aggregate volunteers’ contributions. We asked our experts to assess the severity of the damage on each image and annotate it with one of the five labels given in Section 4. To account for the possibility that the experts may also suffer from biases, each image was evaluated by three experts. Specifically, images were ordered and then they were presented to the experts following a single sequence, independently of the expert who was requesting. That is, the first image was assigned to the first image request received, the second image was assigned to the second request and so on until the complete set of images was assigned a label. The only constraint was that an image was not presented to the same expert more than once. This process was repeated three times, guaranteeing that each image was labeled at least three times by different experts.
Then, we provided the same dataset to a community of fifty volunteers via Crowd4EMS and to paid workers via the Amazon Mechanical Turk (MTurk) platform. MTurk is an online micro-tasking platform that allows requesters to distribute tasks that are difficult to classify for machine intelligence, yet simple for humans, to a large group of users termed as workers for a monetary incentive. Both crowds were asked to annotate the images using the above-mentioned set of five labels. The same image assignment process detailed for experts was followed for the volunteers as well so that each image was labeled at least by three different volunteers, who made 3015 contributions in total. In MTurk, 171 paid workers participated in labeling and each image was annotated by ten different workers, thus a total of 9070 contributions was made by this community.
5.2. Evaluating Expert Infallibility
Since the annotation data collected from the experts was destined to be used as the ground truth, before any further analysis, we measured the inter-expert agreement of their answers in two ways. First, we checked the percentage of full agreement (i.e., when all annotators annotated an image with the same label). Second, we calculated the Fleiss generalized Kappa coefficient [33], which is a well-known inter-rater reliability measure. We saw that the experts fully agreed only 61.41% on the image labels. The Fleiss generalized Kappa coefficient for their answers was 53.6%. According to Landis and Koch [34], this Kappa statistic corresponds to a “moderate” agreement (for Landis and Koch [34], a Kappa statistic has to be ≥0.81 to be considered “almost perfect”).
As a conclusion of this analysis we have to drop the expert infallibility assumption in this domain. This raises the question about how to better evaluate the data quality of a volunteer or paid crowd for a specific task, particularly when we cannot assume expert infallibility. To this end, in the next section, we propose a simple methodology that is based on the probabilistic labeling model that we introduced in Section 4.1.
5.3. Error Rates for Experts
Given the experts’ annotation data, we use the multinomial model presented in Section 4.1 for three purposes: (1) to draw the joint consensus for the labeled tasks, i.e., where ; (2) to estimate the stochastic matrix with that characterizes the single noisy labeling model for all experts; and (3) to estimate the a priori probabilities of each label (i.e., ). This process is illustrated in the upper half of Figure 3, where the upper box corresponds to the expectation-maximization (EM) algorithm applied to annotation data by Dawid and Skene [13]. We particularized this EM algorithm into our multinomial model. Specifically, the initial estimates of the joint consensus are calculated as raw probabilities of each label for each task using the annotation data. Then, in the Maximization step, the algorithm calculates the maximum likelihood estimates of and using the current estimate of the joint consensus (with Equations (2.3) and (2.4) in [13], respectively). Subsequently, in the Expectation step, current estimates of and are used to calculate the new estimates of the joint consensus (with Equation (2.5) in [13]). The algorithm alternates between these two steps until a desired convergence for the joint consensus is achieved or a given number of iterations is reached. The final estimates of and are values that maximize the full likelihood of the annotation data, and the final estimates of the joint consensus gives us .
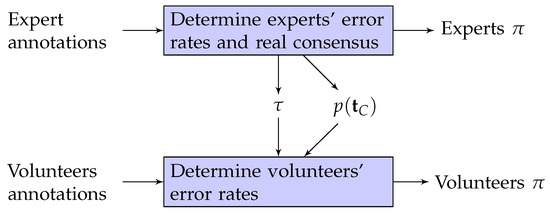
Figure 3.
Flow of data for computing the error rates of the experts and volunteers.
As detailed in Section 4.1, the consensus is essentially a matrix where the entry is the probability of the real label of task t being . Figure 4 presents the error rates of experts for whom we detailed their calculation in the above paragraph. Each cell in the figure contains the corresponding value; that is, the probability that an expert will report label for an image when the real label is . For experts, the real label of an image is the label with the highest probability. Although the cells include pairs, which are the correctly reported labels, this matrix is known as the error rate (a.k.a. confusion matrix) in the literature.
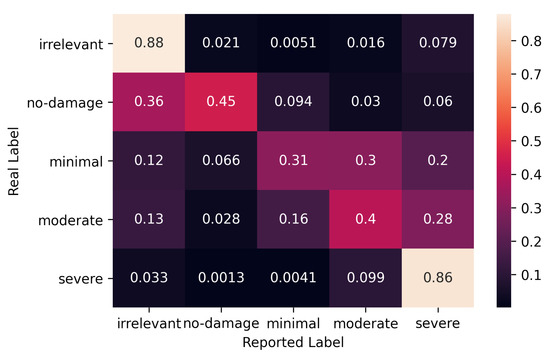
Figure 4.
Error rates for experts.
In Figure 4, we observe that although irrelevant and severe damage labels are more likely to be correctly annotated, the expected accuracies for other answers are drastically low. Each of the moderate, minimal and no-damage labels has a probability below 50% of being correctly reported by the experts. For example, moderate damage is estimated to be correctly labeled only with a 40% probability, and mislabeled as severe 28% of the time. In addition, in the case of minimal damage, it is confused with moderate almost with the same probability.
As mentioned in Section 4.1, the ideal would be an identity matrix whereas for our group of experts and set of tasks, Figure 4 is far from being an identity matrix. Thus, for our domain of interest, the experts’ also corroborates the exclusion of the expert infallibility assumption that we have shown in the above section. Experts do disagree.
In the following two sections, we will use experts’ consensus as the ground truth for the evaluation of the quality of labeling made by the volunteer and paid workers. Then, following these sections we will use the a priori probability vector for a prospective data quality analysis for all three communities.
5.4. Evaluation of Volunteer Crowd
Given the experts’ joint consensus, we fit our probabilistic model to the volunteer crowd’s labeling data, and calculated their error-rates as illustrated in the lower half of Figure 3. The lower box corresponds to Equation (2.3) in [13], which calculates the maximum likelihood estimate of the for volunteers by using the ground truth we achieved from our model for the experts in the above section. The error rates for labels are given in Figure 5.
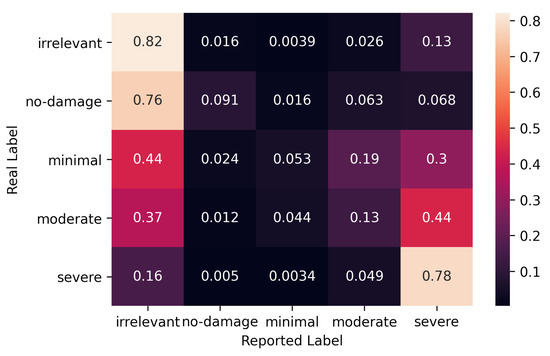
Figure 5.
Error rates for volunteer crowd.
The figure shows that the volunteers have a lower probability of correct labeling compared to the corresponding probabilities for experts given in Figure 4. In particular, the probabilities of correct labels for minimal and no-damage are near zero. In both cases, the volunteers are likely to label them as irrelevant. On the other hand, moderate damage will be labeled correctly only with a 13% probability, while it is more likely to be regarded as either severe or irrelevant with probabilities of 44% and 37%, respectively.
We can speculate that the apparent subjectivity in volunteer labels may be due to the fact that each image is only annotated by 3.32 volunteers on average, and that more annotations could be expected to yield more accuracy. This speculation is exactly what we will be analyzing in Section 5.6.
5.5. Evaluation of Paid Crowd
In a similar way to the volunteers, given the experts’ consensus, we fit our probabilistic model to the paid crowd’s labeling data by using this data as an input to the lower box in Figure 3, which calculated, this time, the maximum likelihood estimate of the for this crowd given the ground truth we computed via experts’ annotation data in Section 5.3. The calculated error rates of paid workers are shown in Figure 6.
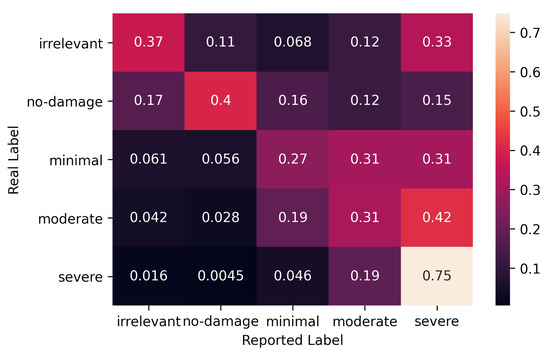
Figure 6.
Error rates for paid crowd.
In the figure, we see that paid workers do a similar ‘good’ job like volunteers for the severe damage. They also approximate to the experts’ performance for moderate and minimal damage, and no-damage. However, paid workers do seem to fail for the irrelevant images, and they are even expected to label them as severe 33% of the time.
Section 5.6 will help us to speculate on the cost-effectiveness of paid workers compared to that of the volunteers as we analyze the expected accuracies of both communities for higher number of annotations.
5.6. Prospective Comparison
In this section we aim to make a predictive analysis for the accuracy that we would expect from our three communities when they contribute with more annotations per image. For this purpose, we synthetically generated labeling-data for each of the expert, volunteer and paid communities for varying numbers of annotators by using the parameters of their probabilistic models.
Specifically, we had a separate multinomial model that we fit to each one of the data of three communities in Section 5.3, Section 5.4 and Section 5.5. As we know from Section 4.1, a multinomial model allows us to estimate the a priori probabilities of each label (i.e., ), and the probability distribution of the error rates for an annotator (i.e., ) for the corresponding crowd. Accordingly, we created two synthetic sets with 1000 and 10,000 tasks. The synthetic real labels of the tasks were assigned by following the that we obtained from the model for experts in Section 5.3. The for experts was calculated as .
Then, for each community, by following the of the community model, we synthetically generated a different set of labeling-data that corresponded to each of the given number of annotations. Subsequently, for each item of synthetic community data, we calculated the synthetic consensus of the community for the corresponding number of annotations.
Finally, by using the set of synthetic real labels and synthetic consensuses, we calculated the accuracy of all (crowd, number of annotations) pairs. The accuracy was calculated as the percentage of correct labels, and the label attached by the crowd to an image was selected as the label with the highest probability in the corresponding consensus.
Furthermore, to be able to compare the performance of the multinomial model to the standard majority voting method, we also measured the accuracy when the synthetic consensus was calculated by the latter method instead.
Figure 7 depicts the accuracy in the assessment of the severity of damage by the three communities for different numbers of tasks and different numbers of annotations per task. In all sub-figures, we observe that the probabilistic model outperforms majority voting for the corresponding community. The performance is comparable only for the lowest number of annotations per task—which was three—for the expert and volunteer communities in Figure 7a–d.
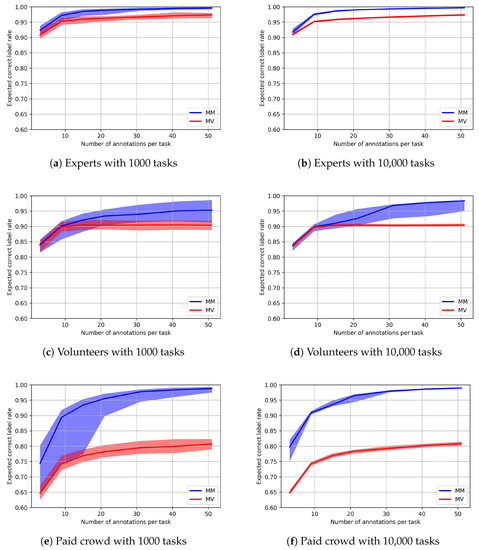
Figure 7.
Prospective analysis for correct label rates for experts, volunteers and paid crowd with multinomial model (MM) and majority voting (MV).
The figures show that when we use the proposed probabilistic model for consensus, the probability of mislabeling decreases as the number of annotators increases. This observation is also true for majority voting, but this aggregation method converges to a certain percentage after which no increase is achieved no matter how many annotations per task are carried out. Majority voting results in less accurate data, especially for the paid workers, as can be seen in Figure 7e,f. This is probably due to the poor performance of the paid crowd for the irrelevant images as we examined in Section 5.5, as these images may form an important part (expected to be 33.6%) of the synthetic real labels according to the the experts’ a priori probability distribution of labels.
We also note that, although the average accuracy increases with the number of annotations in Figure 7c, we observe that the uncertainty around the accuracy also increases as opposed to other plots in Figure 7. This is due to the fact that the EM algorithm used to calculate the synthetic consensus for prospective analysis is prone to getting stuck in local maxima in the case of volunteers as a consequence of their error rates. As seen in Figure 5, the values on the diagonal are very low for three labels, and this causes the label emitted by our model to be frequently different from the real label for these classes. Hence, it is very difficult for the EM algorithm not to get stuck in alternative local maxima instead of reaching the global maximum (which ought to be close to the error-rates shown in Figure 5).
Finally, we can say that with the probabilistic model, we do not only achieve more accurate consensus results, but we also achieve them with less annotators. Therefore, our probabilistic model is more cost-effective than the standard majority voting scheme.
6. Conclusions and Future Work
In this work we have introduced a conceptual and formal framework for modeling crowdsourced data obtained in citizen science projects. We have shown how this general model can encompass different probabilistic models already presented in the literature, such as the multinomial or the Dawid–Skene models. Finally, we have seen a use case of application to citizen science data obtained for disaster management purposes, by modeling the data obtained to perform damage assessment of the 2019 Albania earthquake. We have seen that our probabilistic model helps build a methodology that
- can be applied in scenarios where the hypothesis of infallible experts does not hold;
- can be used to characterize and study the different behaviors of different communities (in our case, experts, volunteers and paid workers);
- can be actioned to perform prospective analysis, allowing the manager of a citizen science experiment to make informed decisions on aspects such as the number of annotations required for each task to reach a specific level of accuracy.
Our work is only a first step towards establishing a scientific methodology for the analysis of crowdsourced citizen science data. In the future, we plan to fit into this very same conceptual and formal framework the application of active learning strategies (e.g., [35]) for coordinating to which workers each task should be sent to minimize the number of annotations necessary.
We have started experimenting with the use of Bayesian methods with the objective of obtaining more realistic prospective analyses. We have identified that a major problem for the application of generic inference platforms (such as Stan [36]) is the label-switching problem [37]. However, while crowdsourcing models can be understood as discrete mixture models, we think that the particularities of the task can be used to build models that are free from label switching and we are working towards proving the usefulness of those models.
In damage assessment scenarios such as the one reported in this paper, we could also model the severity of damage as a fuzzy linguistic variable with five fuzzy labels. It could be interesting to study whether crowdsourcing information could be used to learn the membership function for each fuzzy label, thus modeling uncertainty through a vague description of the concepts instead of (or in combination with) modeling the error introduced by the workers.
Author Contributions
Conceptualization, J.C., J.H.-G., A.R.S. and J.L.F.-M.; Data curation, A.R.S.; Investigation, J.C. and M.O.M.; Methodology, J.C., M.O.M. and A.R.S.; Project administration, J.L.F.-M.; Software, J.C. and M.O.M.; Supervision, J.L.F.-M.; Validation, J.H.-G.; Writing—original draft, J.C. and M.O.M.; Writing—review & editing, J.C., M.O.M., J.H.-G. and J.L.F.-M. All authors have read and agreed to the published version of the manuscript.
Funding
This work was partially supported by the projects Crowd4SDG and Humane-AI-net, which have received funding from the European Union’s Horizon 2020 research and innovation program under grant agreements No 872944 and No 952026, respectively. This work was also partially supported by the project CI-SUSTAIN funded by the Spanish Ministry of Science and Innovation (PID2019-104156GB-I00). We acknowledge the support of the publication fee by the CSIC Open Access Publication Support Initiative through its Unit of Information Resources for Research (URICI). J.H.-G. is a Serra Húnter Fellow.
Institutional Review Board Statement
Not applicable.
Informed Consent Statement
Not applicable.
Data Availability Statement
We plan to make the data available through Zenodo.
Acknowledgments
We want to thank Muhammad Imran, from Qatar Computing Research Institute, for sharing their pre-filtered social media imagery dataset on the Albanian earthquake from the Artificial Intelligence for Disaster Response (AIDR) Platform. We want to thank Hafiz Budi Firmansyah, Lecturer from Sumatra Institute of Technology for his collaboration in setting up the activation on the Amazon Mechanical Turk Platform. We would also like to extend our gratitude to the volunteers for their contribution on the Crowd4EMS Platform.
Conflicts of Interest
The authors declare no conflict of interest.
References
- Gura, T. Citizen science: Amateur experts. Nature 2013, 496, 259–261. [Google Scholar] [CrossRef]
- Haklay, M. Citizen Science and Volunteered Geographic Information: Overview and Typology of Participation. In Crowdsourcing Geographic Knowledge: Volunteered Geographic Information (VGI) in Theory and Practice; Sui, D., Elwood, S., Goodchild, M., Eds.; Springer: Dordrecht, The Netherlands, 2013; pp. 105–122. [Google Scholar] [CrossRef]
- González, D.L.; Alejandrodob; Therealmarv; Keegan, M.; Mendes, A.; Pollock, R.; Babu, N.; Fiordalisi, F.; Oliveira, N.A.; Andersson, K.; et al. Scifabric/Pybossa: v3.1.3. 2020. Available online: https://zenodo.org/record/3882334 (accessed on 16 August 2020).
- Lau, B.P.L.; Marakkalage, S.H.; Zhou, Y.; Hassan, N.U.; Yuen, C.; Zhang, M.; Tan, U.X. A survey of data fusion in smart city applications. Inf. Fusion 2019, 52, 357–374. [Google Scholar] [CrossRef]
- Fehri, R.; Bogaert, P.; Khlifi, S.; Vanclooster, M. Data fusion of citizen-generated smartphone discharge measurements in Tunisia. J. Hydrol. 2020, 590, 125518. [Google Scholar] [CrossRef]
- Kosmidis, E.; Syropoulou, P.; Tekes, S.; Schneider, P.; Spyromitros-Xioufis, E.; Riga, M.; Charitidis, P.; Moumtzidou, A.; Papadopoulos, S.; Vrochidis, S.; et al. hackAIR: Towards Raising Awareness about Air Quality in Europe by Developing a Collective Online Platform. ISPRS Int. J. Geo-Inf. 2018, 7, 187. [Google Scholar] [CrossRef]
- Feldman, A.M. Majority Voting. In Welfare Economics and Social Choice Theory; Feldman, A.M., Ed.; Springer: Boston, MA, USA, 1980; pp. 161–177. [Google Scholar] [CrossRef]
- Moss, S. Probabilistic Knowledge; Oxford University Press: Oxford, UK; New York, NY, USA, 2018. [Google Scholar]
- Shannon, C.E. A mathematical theory of communication. Bell Syst. Tech. J. 1948, 27, 379–423. [Google Scholar] [CrossRef]
- Cover, T.M.; Thomas, J.A. Elements of Information Theory, 2nd ed.; John Wiley & Sons: Hoboken, NJ, USA, 2006. [Google Scholar]
- Collins, L.M.; Lanza, S.T. Latent Class and Latent Transition Analysis: With Applications in the Social, Behavioral, and Health Sciences; Wiley Series in Probability and Statistics; Wiley: New York, NY, USA, 2009. [Google Scholar]
- He, J.; Fan, X. Latent class analysis. Encycl. Personal. Individ. Differ. 2018, 1, 1–4. [Google Scholar]
- Dawid, A.P.; Skene, A.M. Maximum Likelihood Estimation of Observer Error-Rates Using the EM Algorithm. J. R. Stat. Soc. Ser. C (Appl. Stat.) 1979, 28, 20–28. [Google Scholar] [CrossRef]
- Paun, S.; Carpenter, B.; Chamberlain, J.; Hovy, D.; Kruschwitz, U.; Poesio, M. Comparing Bayesian Models of Annotation. Trans. Assoc. Comput. Linguist. 2018, 6, 571–585. [Google Scholar] [CrossRef]
- Passonneau, R.J.; Carpenter, B. The Benefits of a Model of Annotation. Trans. Assoc. Comput. Linguist. 2014, 2, 311–326. [Google Scholar] [CrossRef]
- Inel, O.; Khamkham, K.; Cristea, T.; Dumitrache, A.; Rutjes, A.; van der Ploeg, J.; Romaszko, L.; Aroyo, L.; Sips, R.J. CrowdTruth: Machine-Human Computation Framework for Harnessing Disagreement in Gathering Annotated Data. In The Semantic Web—ISWC 2014; Mika, P., Tudorache, T., Bernstein, A., Welty, C., Knoblock, C., Vrandečić, D., Groth, P., Noy, N., Janowicz, K., Goble, C., Eds.; Lecture Notes in Computer Science; Springer: Cham, Switzerland, 2014; pp. 486–504. [Google Scholar] [CrossRef]
- Dumitrache, A.; Inel, O.; Timmermans, B.; Ortiz, C.; Sips, R.J.; Aroyo, L.; Welty, C. Empirical methodology for crowdsourcing ground truth. Semant. Web 2020, 1–19. [Google Scholar] [CrossRef]
- Aroyo, L.; Welty, C. Truth Is a Lie: Crowd Truth and the Seven Myths of Human Annotation. AI Mag. 2015, 36, 15–24. [Google Scholar] [CrossRef]
- Dumitrache, A.; Inel, O.; Aroyo, L.; Timmermans, B.; Welty, C. CrowdTruth 2.0: Quality Metrics for Crowdsourcing with Disagreement. arXiv 2018, arXiv:1808.06080. [Google Scholar]
- Bu, Q.; Simperl, E.; Chapman, A.; Maddalena, E. Quality assessment in crowdsourced classification tasks. Int. J. Crowd Sci. 2019, 3, 222–248. [Google Scholar] [CrossRef]
- Dempster, A.P.; Laird, N.M.; Rubin, D.B. Maximum Likelihood from Incomplete Data via the EM Algorithm. J. R. Stat. Soc. Ser. B (Methodol.) 1977, 39, 1–38. [Google Scholar]
- Karger, D.R.; Oh, S.; Shah, D. Iterative Learning for Reliable Crowdsourcing Systems. In Advances in Neural Information Processing Systems 24; Shawe-Taylor, J., Zemel, R.S., Bartlett, P.L., Pereira, F., Weinberger, K.Q., Eds.; Curran Associates, Inc.: New York, NY, USA, 2011; pp. 1953–1961. [Google Scholar]
- Nguyen, V.A.; Shi, P.; Ramakrishnan, J.; Weinsberg, U.; Lin, H.C.; Metz, S.; Chandra, N.; Jing, J.; Kalimeris, D. CLARA: Confidence of Labels and Raters. In Proceedings of the 26th ACM SIGKDD International Conference on Knowledge Discovery & Data Mining, KDD ’20, New York, NY, USA, 23–27 August 2020; Association for Computing Machinery: New York, NY, USA, 2020; pp. 2542–2552. [Google Scholar] [CrossRef]
- Pipino, L.L.; Lee, Y.W.; Wang, R.Y. Data Quality Assessment. Commun. ACM 2002, 45, 211–218. [Google Scholar] [CrossRef]
- Freitag, A.; Meyer, R.; Whiteman, L. Strategies Employed by Citizen Science Programs to Increase the Credibility of Their Data. Citiz. Sci. Theory Pract. 2016, 1, 2. [Google Scholar] [CrossRef]
- Wiggins, A.; Newman, G.; Stevenson, R.D.; Crowston, K. Mechanisms for Data Quality and Validation in Citizen Science. In Proceedings of the IEEE Seventh International Conference on e-Science Workshops, Stockholm, Sweden, 5–8 December 2011; pp. 14–19. [Google Scholar] [CrossRef]
- Ho, C.J.; Vaughan, J. Online Task Assignment in Crowdsourcing Markets. In Proceedings of the AAAI Conference on Artificial Intelligence, Toronto, ON, Canada, 22–26 July 2012; Volume 26. [Google Scholar]
- Imran, M.; Castillo, C.; Lucas, J.; Meier, P.; Vieweg, S. AIDR: Artificial intelligence for disaster response. In Proceedings of the 23rd International Conference on World Wide Web, Seoul, Korea, 7–11 April 2014; pp. 159–162. [Google Scholar]
- van Smeden, M.; Naaktgeboren, C.A.; Reitsma, J.B.; Moons, K.G.M.; de Groot, J.A.H. Latent Class Models in Diagnostic Studies When There is No Reference Standard—A Systematic Review. Am. J. Epidemiol. 2014, 179, 423–431. [Google Scholar] [CrossRef]
- Imran, M.; Alam, F.; Qazi, U.; Peterson, S.; Ofli, F. Rapid Damage Assessment Using Social Media Images by Combining Human and Machine Intelligence. arXiv 2020, arXiv:2004.06675. [Google Scholar]
- Kirilenko, A.P.; Desell, T.; Kim, H.; Stepchenkova, S. Crowdsourcing analysis of Twitter data on climate change: Paid workers vs. volunteers. Sustainability 2017, 9, 2019. [Google Scholar] [CrossRef]
- Ravi Shankar, A.; Fernandez-Marquez, J.L.; Pernici, B.; Scalia, G.; Mondardini, M.R.; Di Marzo Serugendo, G. Crowd4Ems: A crowdsourcing platform for gathering and geolocating social media content in disaster response. Int. Arch. Photogramm. Remote Sens. Spat. Inf. Sci. 2019, 42, 331–340. [Google Scholar] [CrossRef]
- Gwet, K.L. Handbook of Inter-Rater Reliability: The Definitive Guide to Measuring the Extent of Agreement Among Raters, 4th ed.; Advanced Analytics, LLC: Gaithersburg, MD, USA, 2014. [Google Scholar]
- Landis, J.R.; Koch, G.G. The Measurement of Observer Agreement for Categorical Data. Biometrics 1977, 33, 159–174. [Google Scholar] [CrossRef] [PubMed]
- Sheng, V.S.; Provost, F.; Ipeirotis, P.G. Get another label? improving data quality and data mining using multiple, noisy labelers. In Proceeding of the 14th ACM SIGKDD International Conference on Knowledge Discovery and Data Mining—KDD 08, Las Vegas, NV, USA, 24–27 August 2008; ACM Press: New York, NY, USA, 2008; p. 614. [Google Scholar] [CrossRef]
- Carpenter, B.; Gelman, A.; Hoffman, M.D.; Lee, D.; Goodrich, B.; Betancourt, M.; Brubaker, M.; Guo, J.; Li, P.; Riddell, A. Stan: A Probabilistic Programming Language. J. Stat. Softw. 2017, 76, 1–32. [Google Scholar] [CrossRef]
- Rodríguez, C.E.; Walker, S.G. Label Switching in Bayesian Mixture Models: Deterministic Relabeling Strategies. J. Comput. Graph. Stat. 2014, 23, 25–45. [Google Scholar] [CrossRef]
Publisher’s Note: MDPI stays neutral with regard to jurisdictional claims in published maps and institutional affiliations. |
© 2021 by the authors. Licensee MDPI, Basel, Switzerland. This article is an open access article distributed under the terms and conditions of the Creative Commons Attribution (CC BY) license (https://creativecommons.org/licenses/by/4.0/).