1. Introduction
There are many non-stationary scenarios in large extension water-saturated porous media in which the existence of both the regional velocity and molecular diffusion of a solute in the fluid are combined. The primary interest in eventual processes of pollutant spreading is to determine the spatial and temporal evolution of the contaminant plumes in order to plan actions of control. The environmental effects involve aquifer contamination, a problem that has been widely treated in the scientific literature since the middle of the last century. Specific aspects that range from the mathematical-physical theoretical description of the process [
1] to real cases that generally cause socio-economic impacts [
2] have been addressed.
The objective of this work, as in other works where similar methodologies have been applied [
3,
4,
5,
6,
7,
8], is to obtain dimensionless groups that govern the expansive dynamics of the plumes caused by the simultaneous effects of advection and diffusion. These groups will collect the preponderance of one phenomenon over another, and they are the monomials according to which the temporal evolution of the horizontal and transversal plume extensions can be described and represented graphically by means of a universal abacus.
From a practical point of view, these type curves or universal abacuses allows hydrogeologists and engineers to confront contamination problems in groundwater systems through direct analyses to gain rapid predictions using curve matching and interpolation techniques, making computer simulations or field testing unnecessary. Although the accuracy of the results depends, to a great extent, on the experimental parameters, which could be difficult to obtain when time or economic variables are present, the universal curves can establish a range of spatial-temporal contamination extensions based on the reliability of the field data introduced as input, which must be set as a starting hypothesis. These type curves can also be used to obtain a preliminary idea of the spread of the contamination when planning in–situ trace tests, which require setting the location of control points [
9,
10] as well as delimiting the time-dependent perimeters when establishing different types of land use [
11,
12].
To limit the scope of the work, large 2D rectangular scenarios in which the extension of the contamination is far from reaching the boundaries of the domain have been devised. The regional flow has been implemented from left to right and the horizontal faces of the domain are impervious to both flow and solute, simulating a narrowly-confined layer of 1m in depth parallel to the horizontal surface. The methodology described in this work to obtain the proper monomials consisted of, firstly, applying the discriminated dimensionless technique to the governing equations to obtain the dimensionless groups (a standard objective of dimensional analysis [
13,
14,
15,
16,
17,
18]), secondly, defining the interdependences among monomials or unknowns using the Pi theorem [
19] and, finally, providing extensive numerical simulations to verify the reliability of the groups and to depict the universal abacuses.
It is worth mentioning that in the first step of the protocol, the use of a standard non-discriminated technique to obtain dimensionless groups in the mathematical model that govern this problem is a topic of heated debate among researchers [
20,
21]. The classic techniques used to obtain the dimensionless groups, once the governing equation has been written in its dimensionless form, would not, in fact, lead to a proper characterisation of the problem. These techniques do not generally introduce the hidden magnitudes (which are the unknowns of interest) or the time factor into the process, so that such unknowns cannot be derived from the groups by applying the Pi theorem. Instead, the proposed dimensionless protocol (discriminated and normalised nondimensionalisation of the governing equation) leads directly to the least number of independent groups and to the function of dependence between the unknowns and the physical and geometric parameters of the problem. By means of mathematical approximations and manipulation, the protocol associates to each addend of the equation a numerical coefficient of a dimensional character which balances with the rest, deducing the groups as independent ratios between these coefficients.
It should also be noted that the dimensionless group that characterises this type of coupled problem (advection and molecular diffusion) is the so-called Peclet number [
22]. A dimensional study of the equation has been carried out in some research with different transport and flow conditions in dispersive scenarios, depicting type curves that are dependent on the Peclet number [
23,
24]. Despite the fact that hydrodynamic dispersion effects can be neglected when regional velocities are small enough, in the scenario presented here, this number cannot be defined a priori since the extensions of the domain (length or width) are not relevant to the study of the dynamics of contamination. As mentioned above, in this work we consider instead the time needed for the contamination plume to reach the boundaries. The dimensionless groups deduced, all of which contain unknowns, allow us to establish the functional relationships that we are interested in.
As for the second step in the methodology, once the Pi theorem has been applied and the dependences of the unknowns have been deduced, the direct quotient between the regional velocity (vo) and the molecular diffusivity (D) emerges as a determining factor in the prevalence of the transport phenomenon over diffusion. It is a dimensional factor (vo/D) whose unit is the inverse of a length (m−1) with no apparent physical meaning. Indeed, the unknowns (horizontal and transversal extensions of the contamination plume or global isoline pattern) are also dependent on a time factor. The expression of this dependence allows us to separate the effect of the quotient (vo/D) and the product voτ (τ is time) to substantially simplify the universal representation.
Finally, the numerical simulations are performed with SEAWAT [
25], a widely recognised and reliable software package used for theoretical [
26,
27] and practical-technical purposes [
28,
29]. A large number of numerical simulations has allowed us to develop a wide set of universal abacuses that provide relevant information on the space-time dynamics of the contamination plume. The physical variables of the problem cover a range of solutions which are fully representative of all the cases that may occur in practice, including those asymptotic cases of negligible diffusion versus advection, and vice versa. The limit of negligible diffusivity allows us to represent new universal curves to characterise pure advective processes. The use of universal graphs is illustrated with examples.
The hypotheses assumed in the physical model are the following: (i) velocities small enough to neglect the effect of hydrodynamic dispersion, (ii) the Darcy flow (negligible inertial forces and laminar flow), (iii) isotropic and uniform hydraulic conductivity, (iv) viscosity independent of concentration, (v) two-dimensional geometry and the absence of gravitational effects, (vi) isothermal conditions, (vii) water-saturated porous media, (viii) the absence of sources and/or sinks for flow, (ix) fully miscible single-phase fluid with negligible compressibility for both the fluid and the porous matrix (constant porosity) and (x) non-reactive solute transport.
2. Nomenclature
| ao | numerical constant (dimensionless) |
| c | fluid concentration (kg/m3) |
| co | constant fluid concentration at a certain point (kg/m3) |
| D | molecular diffusivity coefficient (m2/d) |
| g | gravity acceleration (m/s2) |
| h | hydraulic head (energy per unit of specific weight) |
| H | height of the domain (m) |
| hl, hr | hydraulic head at the left and right boundaries, respectively |
| k | permeability (m2) |
| K | hydraulic conductivity (m/d) |
| l | length (m) |
| L | horizontal length of the domain (m) |
| L | length of the domain (m) |
| H | vertical length of the domain (m) |
| p | pressure at the point (Pa) |
| q | specific discharge or Darcy velocity (m/d) |
| v | fluid velocity (m/d) |
| vo | regional Darcy velocity (m/d) |
| xo | location of the constant concentration point (m) |
| x,y | horizontal and transversal coordinates (m) |
| θ | porosity (dimensionless) |
| μ | dynamic viscosity (kg m−1s−1) |
| π | dimensionless groups |
| ρ | fluid density (kg/m3) |
| ρo | density of the fluid with zero concentration (Kg/m3) |
| τ | time (days) |
| τc | time factor (days) |
| Ψ | identifies a general unknown function |
| ~ | denotes the same order of magnitude |
| ≡ | denotes equivalence for dimensionless groups |
| Subscripts | |
| 1,2,… | used to identify the dimensionless groups |
| x,y | related with coordinate direction |
| left | refers to the left of the focus |
| Superscripts | |
| ′ | denotes the dimensionless variable |
| * | denotes characteristic values of a given quantity |
3. Mathematical Model
Under the conditions mentioned at the end of
Section 1, the mathematical model is composed of the mass conservation equations for the fluid and for the contaminant [
30,
31]. In mathematical terms, these read as follows:
The relationship between the specific discharge and the actual fluid velocity is given by q = vθ, with θ being the porosity of the medium. Thanks to the coupling, according to Equation (2), the velocity of the fluid in the porous medium causes continuous redistribution of the concentration and, therefore, of the density of the solution, which affects its movement through Equation (1).
Equation (1) can be solved in terms of hydraulic potential or pressure by means of Darcy’s law (i.e., a stationary momentum equation), expressed by Muskat [
32] as follows:
Since the global pressure distribution depends on the global density distribution, the and components of the specific discharge are affected by spatial variations in density. In terms of the hydraulic head, , and assuming that the fluid viscosity is not dependent on concentration, Darcy´s equation is written as , with being hydraulic conductivity, a physical parameter of the porous medium, which is decisive for velocity, included in the mathematical model.
We consider a two-dimensional water-saturated rectangular domain with a 2:1 aspect ratio, according to the schematics of
Figure 1.
The parameters of the soil that will later be shown to influence the values of the monomials have values of between 2.5 and 20 m/d (equivalent to fine sand or silty sand) for the hydraulic conductivity , an effective porosity of 0.15 and a molecular diffusivity coefficient D ranging between 0.0003 and 0.0012 m2/d (representative of different salt species).
A zero-concentration regional flow, with a constant velocity vo and constant density ρo, enters from the boundary on the left due to a fixed hydraulic potential drop between the left and right-hand boundaries. The upper and lower horizontal boundaries are impermeable (zero normal velocity) and do not let the concentration go through by diffusion (zero normal concentration gradient). In the position (x = xo, y = 0), which we will call focus, there is a cell of constant concentration co, representing the source of contaminant. The boundary conditions can be summarised as follows:
Under these conditions, we will study the non-stationary pattern of concentrations when H is large compared to the transversal dimension of the contamination plume. The isolines of the concentration pattern are deformed ellipsoids that widen in the horizontal and vertical directions of the domain due to the coupled processes of diffusion and advection. These ellipsoids surround the focus and finally keep its left end in a fixed position. As long as the contamination plume does not reach the right and upper (or lower) boundaries of the domain, the problem is not stationary (except for the small region to the left of the focus) so we expect the vertical and horizontal extent of the plume to depend on the parameters of the problem and on time. The interaction between the advection and diffusion phenomena is not easily predictable, even though each equation is linear in its unknown, as the position of the plume and isolines are complex non-linear functions of the velocities, pressure, and their gradients.
In the following section, we rewrite this mathematical model in its dimensionless form and, after some algebraic manipulations and the application of the Pi theorem, the dependences between the variables of interests and the physical parameters of the problem are obtained.
4. Dimensionless Groups
4.1. Deduction of the Dimensionless Groups
Before deriving the dimensionless groups for the coupled diffusion and advection problems or for purely advective problems, it is worth mentioning the easier problem of pure diffusion for which analytical solutions have been established [
33]. Some comments should be made regarding the applied protocol.
The procedure followed to deduce the dimensionless groups that rule a given problem based on the Pi theorem consists of reducing the governing equations to their dimensionless normalised forms and obtaining such groups by comparing the coefficients that multiply the derivatives of each addend of the equation. These coefficients, which are physically or dimensionally homogeneous, are of the same order of magnitude in the normalised equation so their ratios are the dimensionless groups that are sought. In recent years, a formal procedure of nondimensionalising has been proposed and successfully applied to many complex problems in different areas to obtain new universal solutions. For example, it is worth citing the consolidation problem in soil mechanics, flow and (heat or solute) transport in porous media, and a variety of mechanical problems, all of which are coupled and nonlinear [
7,
8,
34]. It should be noted that since the dimensionless numbers for most engineering or scientific problems are already found in the literature, the former procedure is generally avoided, and classical known numbers are directly used in the Pi theorem. This, however, generally leads to poorer predictive capabilities compared to the approach presented here.
The first step carried out to deduce the dimensionless governing equation is to choose a suitable list of reference quantities to define the dependent and independent dimensionless variables. These are chosen either from the input parameters of the problem or (as in this case) by introducing suitable unknowns whose order of magnitude will later be deduced as a consequence of the application of the Pi theorem. The only criterion with which these reference quantities should be chosen is that the range of values of the normalised variables is as bounded as possible to the interval [0, 1]. This criterion allows the derivatives of these variables to be averaged to a value of the order of the unit throughout the entire length of the scenario. In addition, the discrimination must be applied [
35,
36]. This means that vector variables such as position or velocity must be made dimensionless by means of different references according to their spatial direction. In this way, dimensionless groups commonly called “aspect ratios” or ”form factors” do not necessarily emerge directly as independent groups.
As in other problems of similar complexity, the procedure requires good physical knowledge of the problem and some experience to find the unknowns introduced as references, their order of magnitude (by application of the Pi theorem) and their exact solution through the universal curves obtained by a large number of precise numerical simulations. This procedure has some advantages over the classical dimensional analysis. Firstly, the dimensionless groups emerging in the process, some containing unknowns and others without unknowns, are formally obtained and the relationship between them constitutes the direct application of the Pi theorem. Secondly, the groups have a unitary order of magnitude since they are obtained as balances between the addends of the governing equation. Groups of an order of magnitude higher (or lower) than unity, can be neglected in the governing equation, which simplifies the problem. Thirdly, this procedure incorporates the dimensionless physical parameters into the deduced monomials, thus reducing the global number of groups and making the characterisation more precise. The resulting groups are the proper parameters to represent universal solutions.
4.2. Coupled Advection and Diffusion Case
We assume isotropic molecular diffusivity, the porosity θ to be constant, and we neglect the transversal velocity (v
y) and its spatial derivatives (since they are of an order of magnitude much lower than the regional velocity and its changes). Therefore, it follows that
and
is negligible, and Equation (2) in rectangular 2D coordinates is reduced to:
Dimensionless variables for x, y, c, v
x, and τ are defined (discriminately) as
In these definitions,
and
are known parameters, while
,
and
are unknown parameters related to each other. For a given time characteristic (
),
and
define the extension of the solute plume from the constant concentration point. For example, they can be defined as the region in which the concentrations are above a certain percentage of c
o. With this choice, dimensionless variables may be considered normalised since they vary in the range [0, 1]. Substituting (7) in (6), the last equation becomes dimensionless:
Assuming the derivatives between brackets to be of the order of one, four coefficients are found to describe the solution (or patterns) of the equation in the domain defined by
,
and time
. These are:
These coefficients have to be of the same order of magnitude since their terms in the equation balance each other. The independent ratios between these coefficients, chosen for suitability, are the dimensionless groups. We choose them as follows:
To characterise the solution in the better way, each of the unknowns
,
and
must appear only in one group, unless this is not possible (which is the case of
). Therefore, group
can be substituted for the product of groups
and
. This finally leads to the alternative solution:
Group
is an aspect ratio of the domain and provides information about the relation between
and
. The other groups allow us to relate time and the horizontal length of the transition or salt contaminated region measured from the focus. According to the Pi theorem, the solution
leads to:
with Ψ an unknown function of its arguments. Writing the solution in the following way:
we obtain interesting and useful information. As expected, each iso-concentrated line of the pattern (defined by the dimensional value
) depends on time (
), regional velocity (
) and molecular diffusivity (D), and for the same values of
and
, the concentration isoline is the same. Equation (13) shows detailed information about this kind of dependence. Firstly, keeping the ratio
constant, the patterns for each
are the same for all the times so that
is also constant. This means that if we take two scenarios, the first with the pair of values (
,
) and the second with the pair (
,
), the patterns of dimensionless isolines (
) at a given time
for the first scenario is the same as that of the second one at time
. In this way, scenarios of the same value of the ratio
, for a given time
contain the information from the patterns corresponding to all the regional velocity values. This allows us to depict a set of abacuses, one for each value of the ratio
, in which the extension of each concentration isoline,
may be represented as a function of time
, choosing
as the parameter of the abacus. To use this information, the time has to be suitably corrected according to the value of the regional velocity. In the following section related to the construction of the universal curves, this will be further clarified.
With regards to the characteristic transversal length, the group
allows us to write
which is equivalent to the dependence
with Ψ being a new function of its argument. The same discussion made above for
applies here.
Finally, we can expect that the part of the pattern which is located to the left of the focus (x
o, y = 0) will be a steady-state pattern after a relatively short time characteristic for which each isoline defined by
is located at a characteristic distance from (x
o,0),
. Indeed, deleting the addend
from Equation (6) and assuming changes only in the x coordinate, the only emerging dimensionless group is
. Then, the solution is given as:
The solutions provided by Equations (13)–(15), and the universal curves that make use of them, constitute an important management tool since they provide the level of global contamination of the domain and its gradation, at every instant.
4.3. Pure Advection
For this scenario, with the same assumptions as the coupled problem and using the same dimensionless variables defined in (7), Equation (2) is reduced to:
which leads to two coefficients,
and
and one single dimensionless group
. This results in the following dependence:
As in the former analysis, each isoline defined by its dimensionless concentration
has its particular solution. So,
is the horizontal extension at time
going from the furthest point of the isoline to the constant concentration position imposed by the inner boundary condition. This length is proportional to the regional velocity but changes from one isoline to another
The function
is universal and may be depicted by a single numerical simulation. The region of concentration is a slender arrow in which the advancing fronts of the lower concentration isolines are ahead of the higher concentration fronts. The distance between the fronts of any pair of isolines
and
, increases with time and depends on their concentrations according to the expression:
This result can also be conveniently represented by a universal abacus.
4.4. Perspectives
It is interesting to discuss here what can be deduced from the previous results in finite domains and large time periods in which contamination reaches the boundaries of the scenario. Although this is not the main subject of this work, the treatment of finite scenarios adds new dimensionless groups and makes the solution more complex. For example, a finite scenario in the horizontal direction (but very large in the transversal direction) introduces the extension L in the dimensionalising process, giving rise to a new dimensionless group. In contrast, if the scenario is finite in the transversal direction (and very extensive in the horizontal one), the extension H of the domain must be considered, which also gives rise to the appearance of a new group. Finally, if the scenario is finite in both directions, the introduction of L and H would create two new dimensionless groups.
In this way, the introduction of any new condition like a sink or source (an injection or abstraction well), or reactive transport (degradation tracers), increases the number of monomials and, thus, the universal solutions are translated into a set of abacuses in a way that each one is set according to a specific value of a selected dimensionless group. A scenario similar to the one here presented but introducing an abstraction well located at a specific distance would be an interesting case for further research. From the practical point of view, this represents an often-used procedure in field testing to estimate the physical parameters of soils. The use of universal abacuses will contribute to obtaining these parameters by means of an inverse protocol.
5. Verification by Numerical Simulations
The numerical simulations have been carried out using the programme SEAWAT V.4 [
37]. The following figures illustrate some of the simulated scenarios created to obtain the universal graphs. For example,
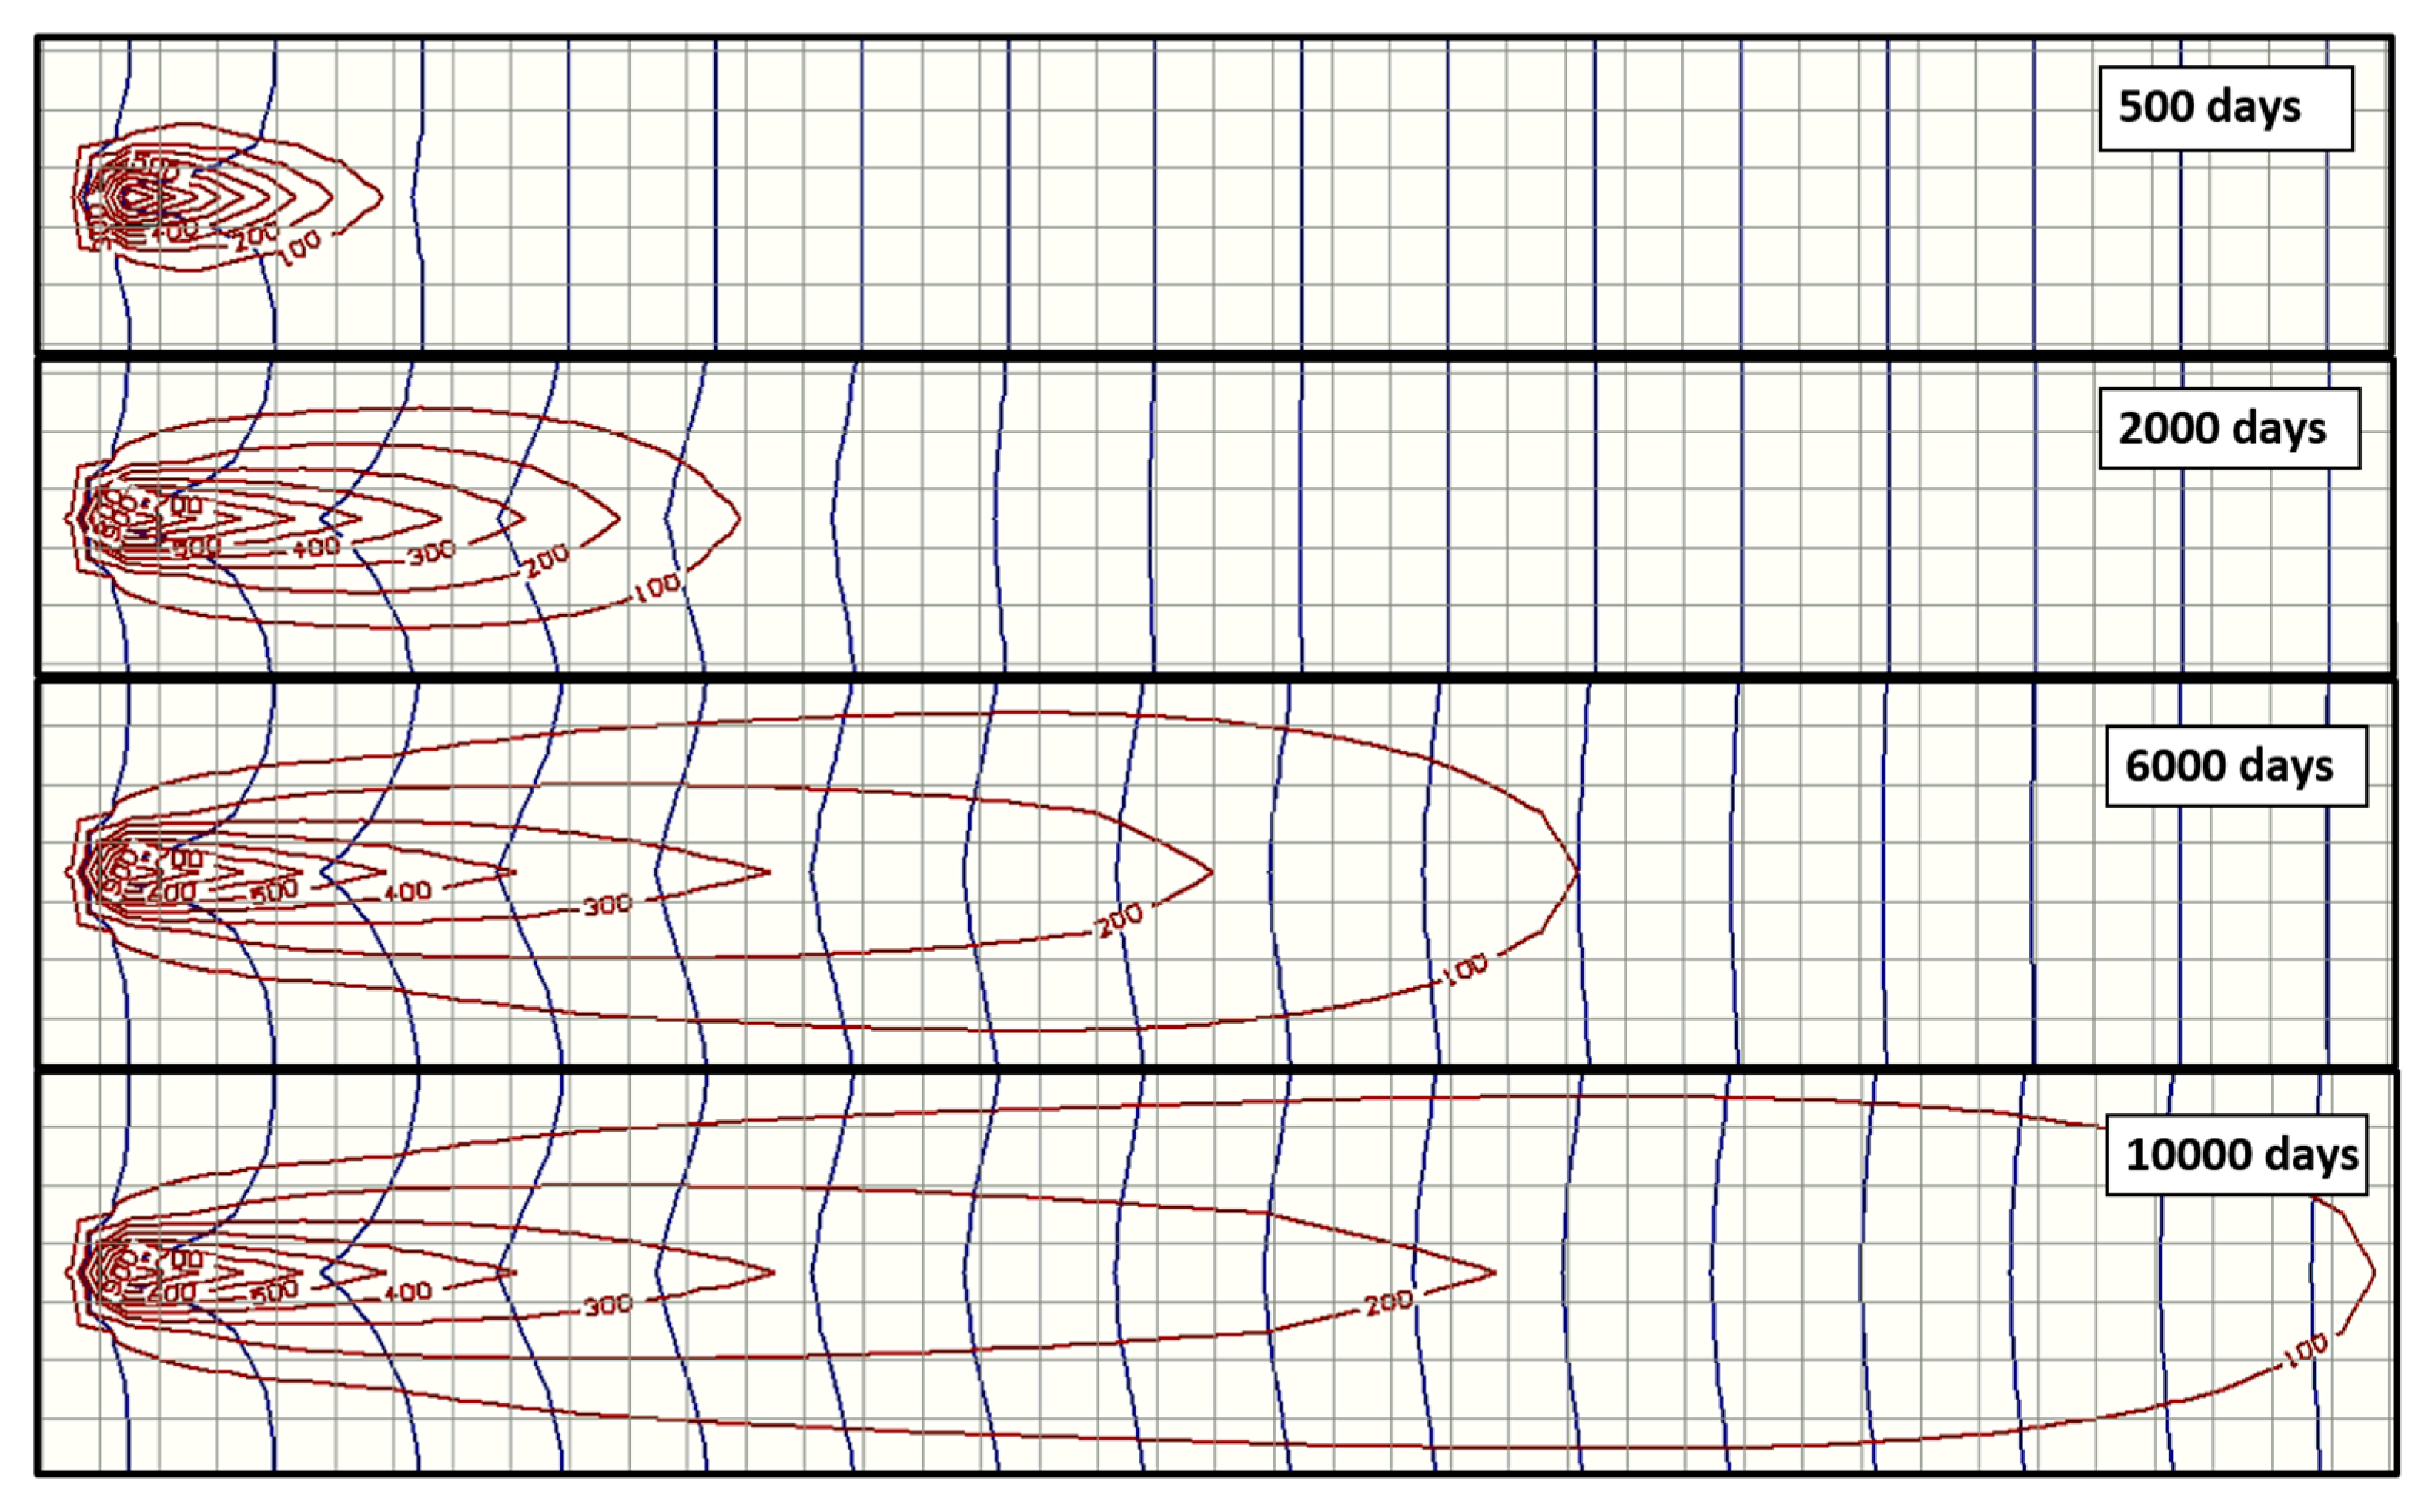
Figure 2 shows the iso-concentration patterns in a large 2D scenario with a focus or constant concentration point located near the left-hand boundary, in which advection and diffusion effects are coupled. The data are: v
o = 0.0006 m/d, D = 0.0006 m
2/d and c
o = 1000 kg/m
3. The concentrations of the isolines are 10, 200… kg/m
3, which correspond to 10%, 20%… of c
o. The vertical extension of each pattern has been trimmed to reduce the size of the figure. As shown, the patterns progressively extend the contaminated region in vertical and horizontal directions. The deformation of the isolines (more pronounced for small concentration isolines) with respect to the circular shape that they would have with pure diffusion is due to the advective effect.
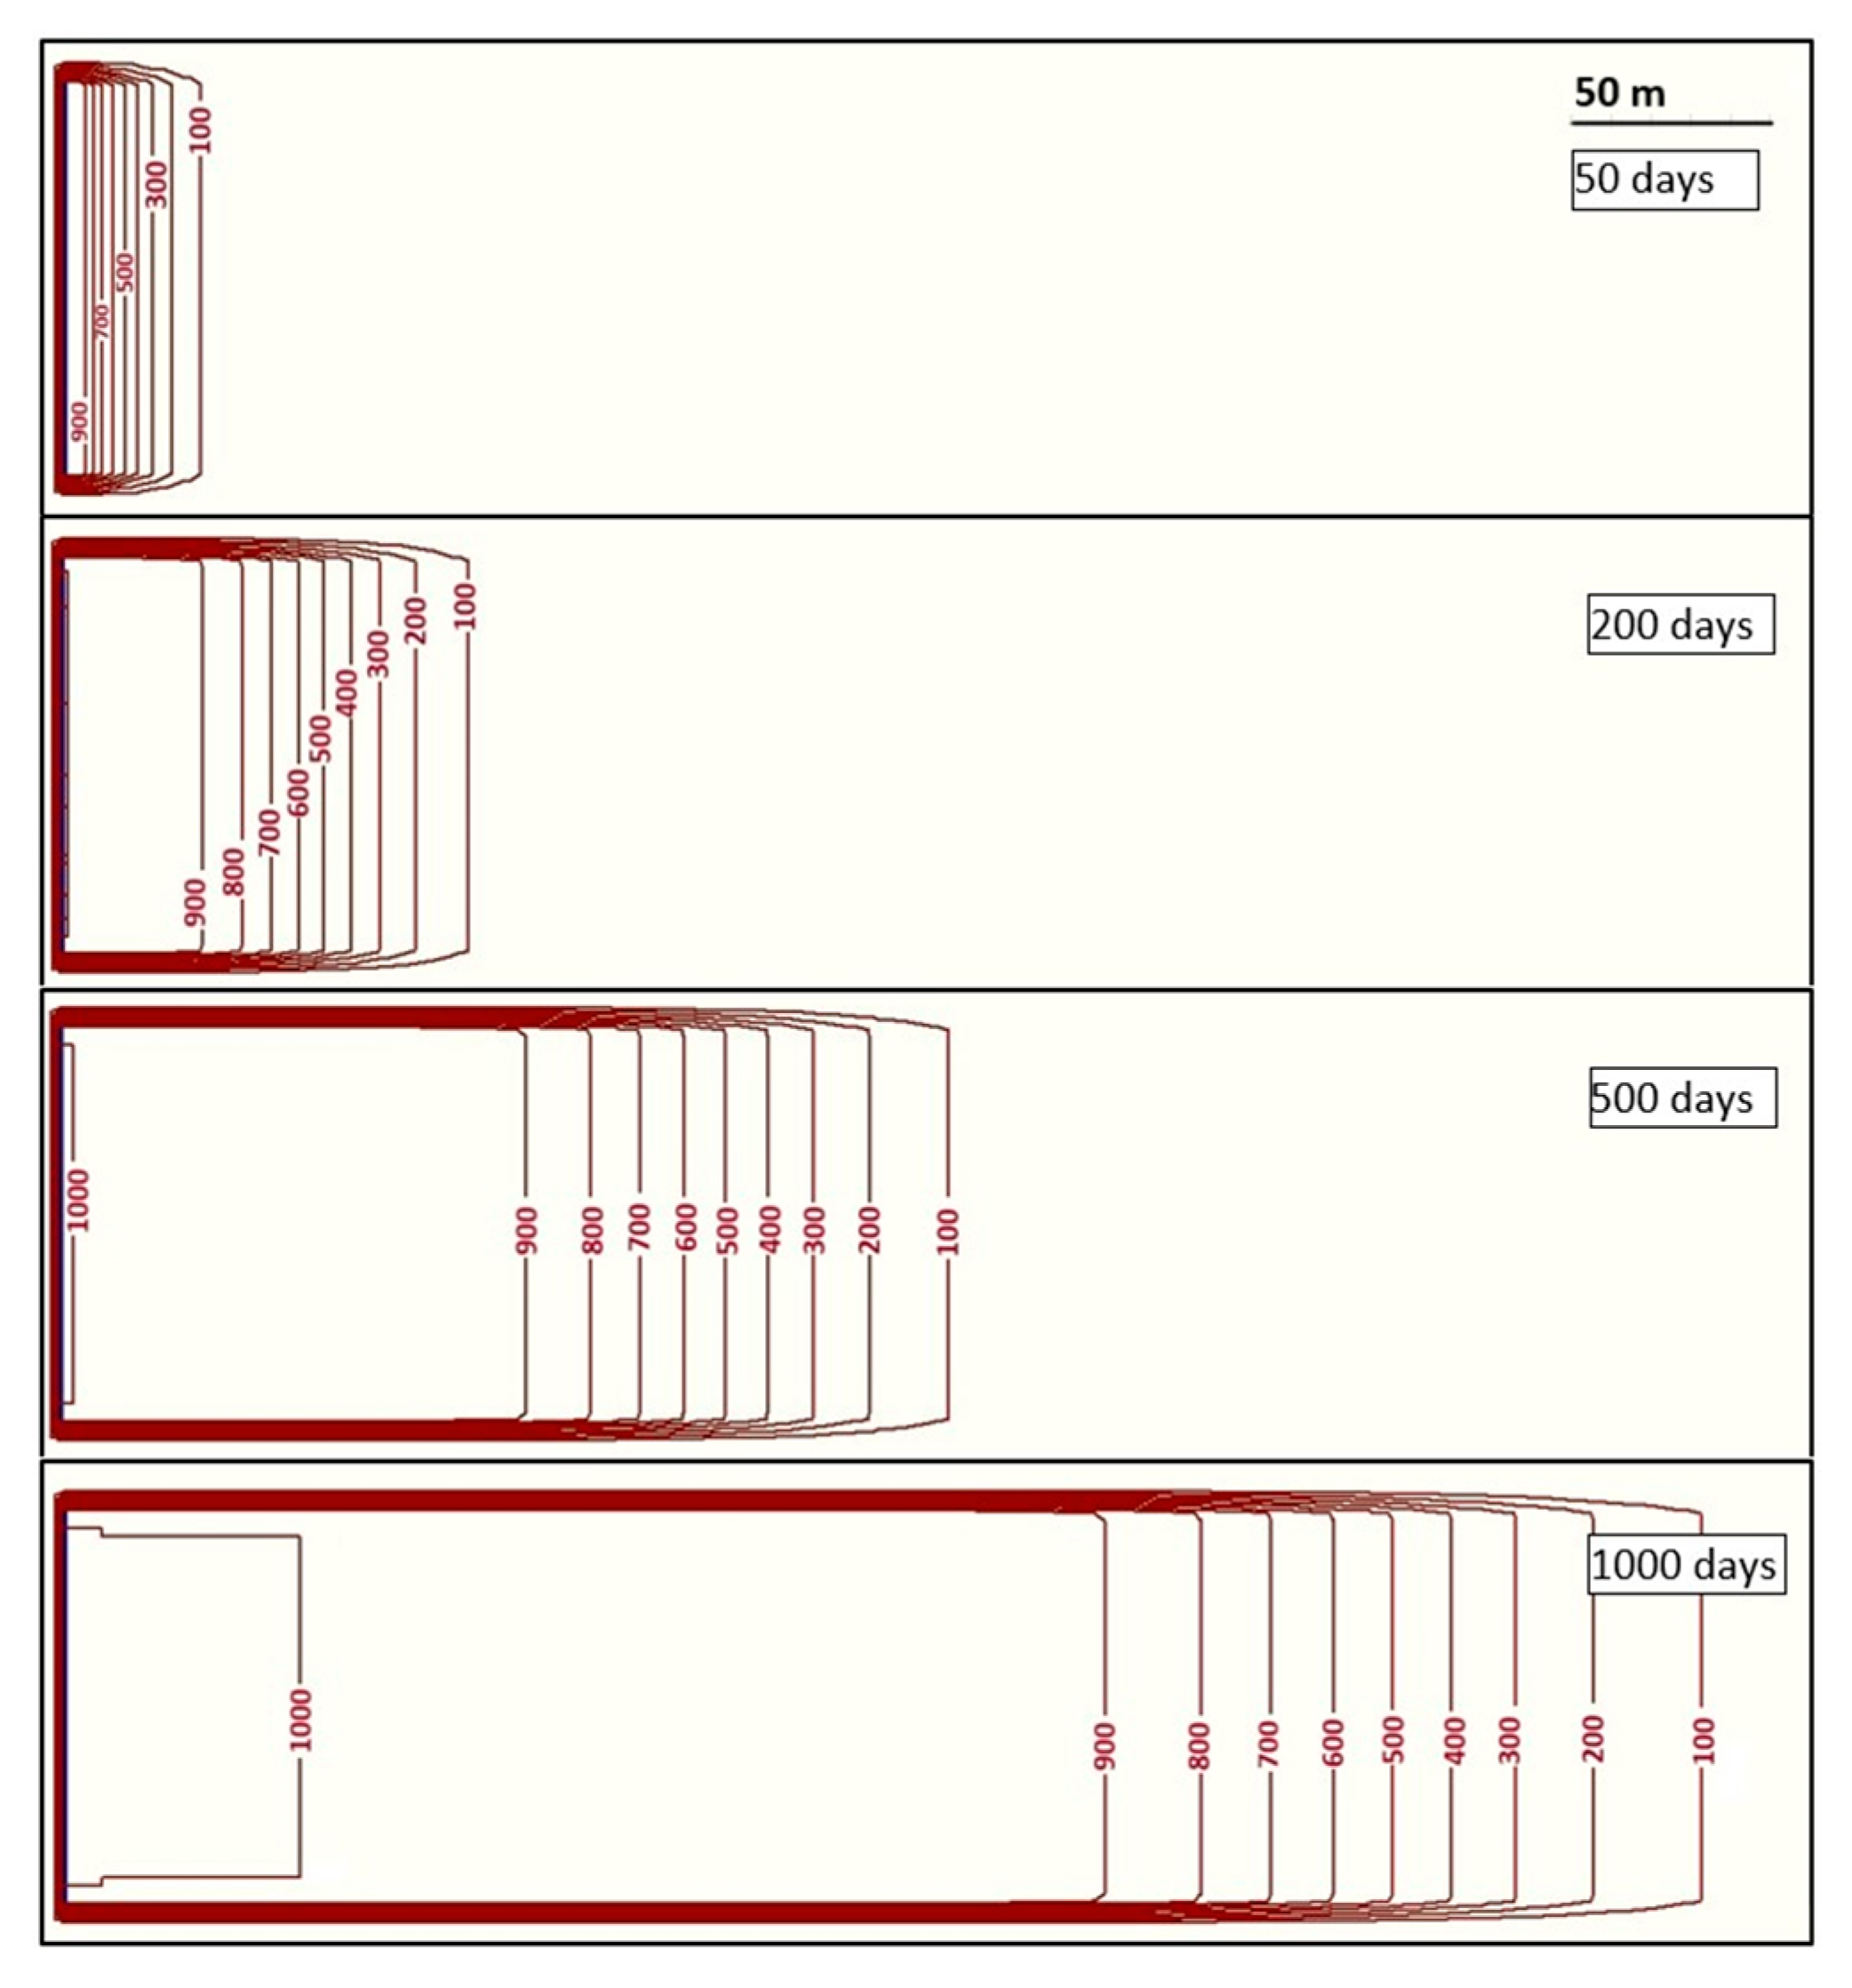
In contrast, the patterns for a scenario with only the advection effect is shown in
Figure 3. The data are: v
o = 0.05 m/d, D = 0 and c
o = 1000 kg/m
3. In this scenario, the focus has been converted into a vertical segment to better appreciate the progress of the concentration fronts (of equal length to that of the segment) of each isoline. It can be seen that the velocities of each front depend on the concentration of the isoline, with values greater than the regional velocity (v
o) for the small concentration isolines and lower for those with higher concentrations.
Figure 4 and
Figure 5 show the evolution of the isoline fronts in x direction (for v
o = 0.05 m/d) when D = 0 and advection dominates. The first one shows the temporal evolution of the width of the region of variable concentration; that is, the area affected by significant contamination, defined as the distance between the isolines of concentration 100 and 900 (10% and 90% of c
o, respectively). The solution for an identical scenario with a 2c
o concentration has been superimposed. The separation between isolines of the same relative concentration (10% and 90%) has the same evolution. The different lines depicted in
Figure 5 establish the distance to the focus of any iso-concentration line (defined as a percentage in respect to the contamination source) as a function of time. As previously mentioned, the velocity of each front is constant but increases as the concentration diminishes; that is, the variation in the inclination of different lines indicates that low concentration isolines spread faster than high concentration values.
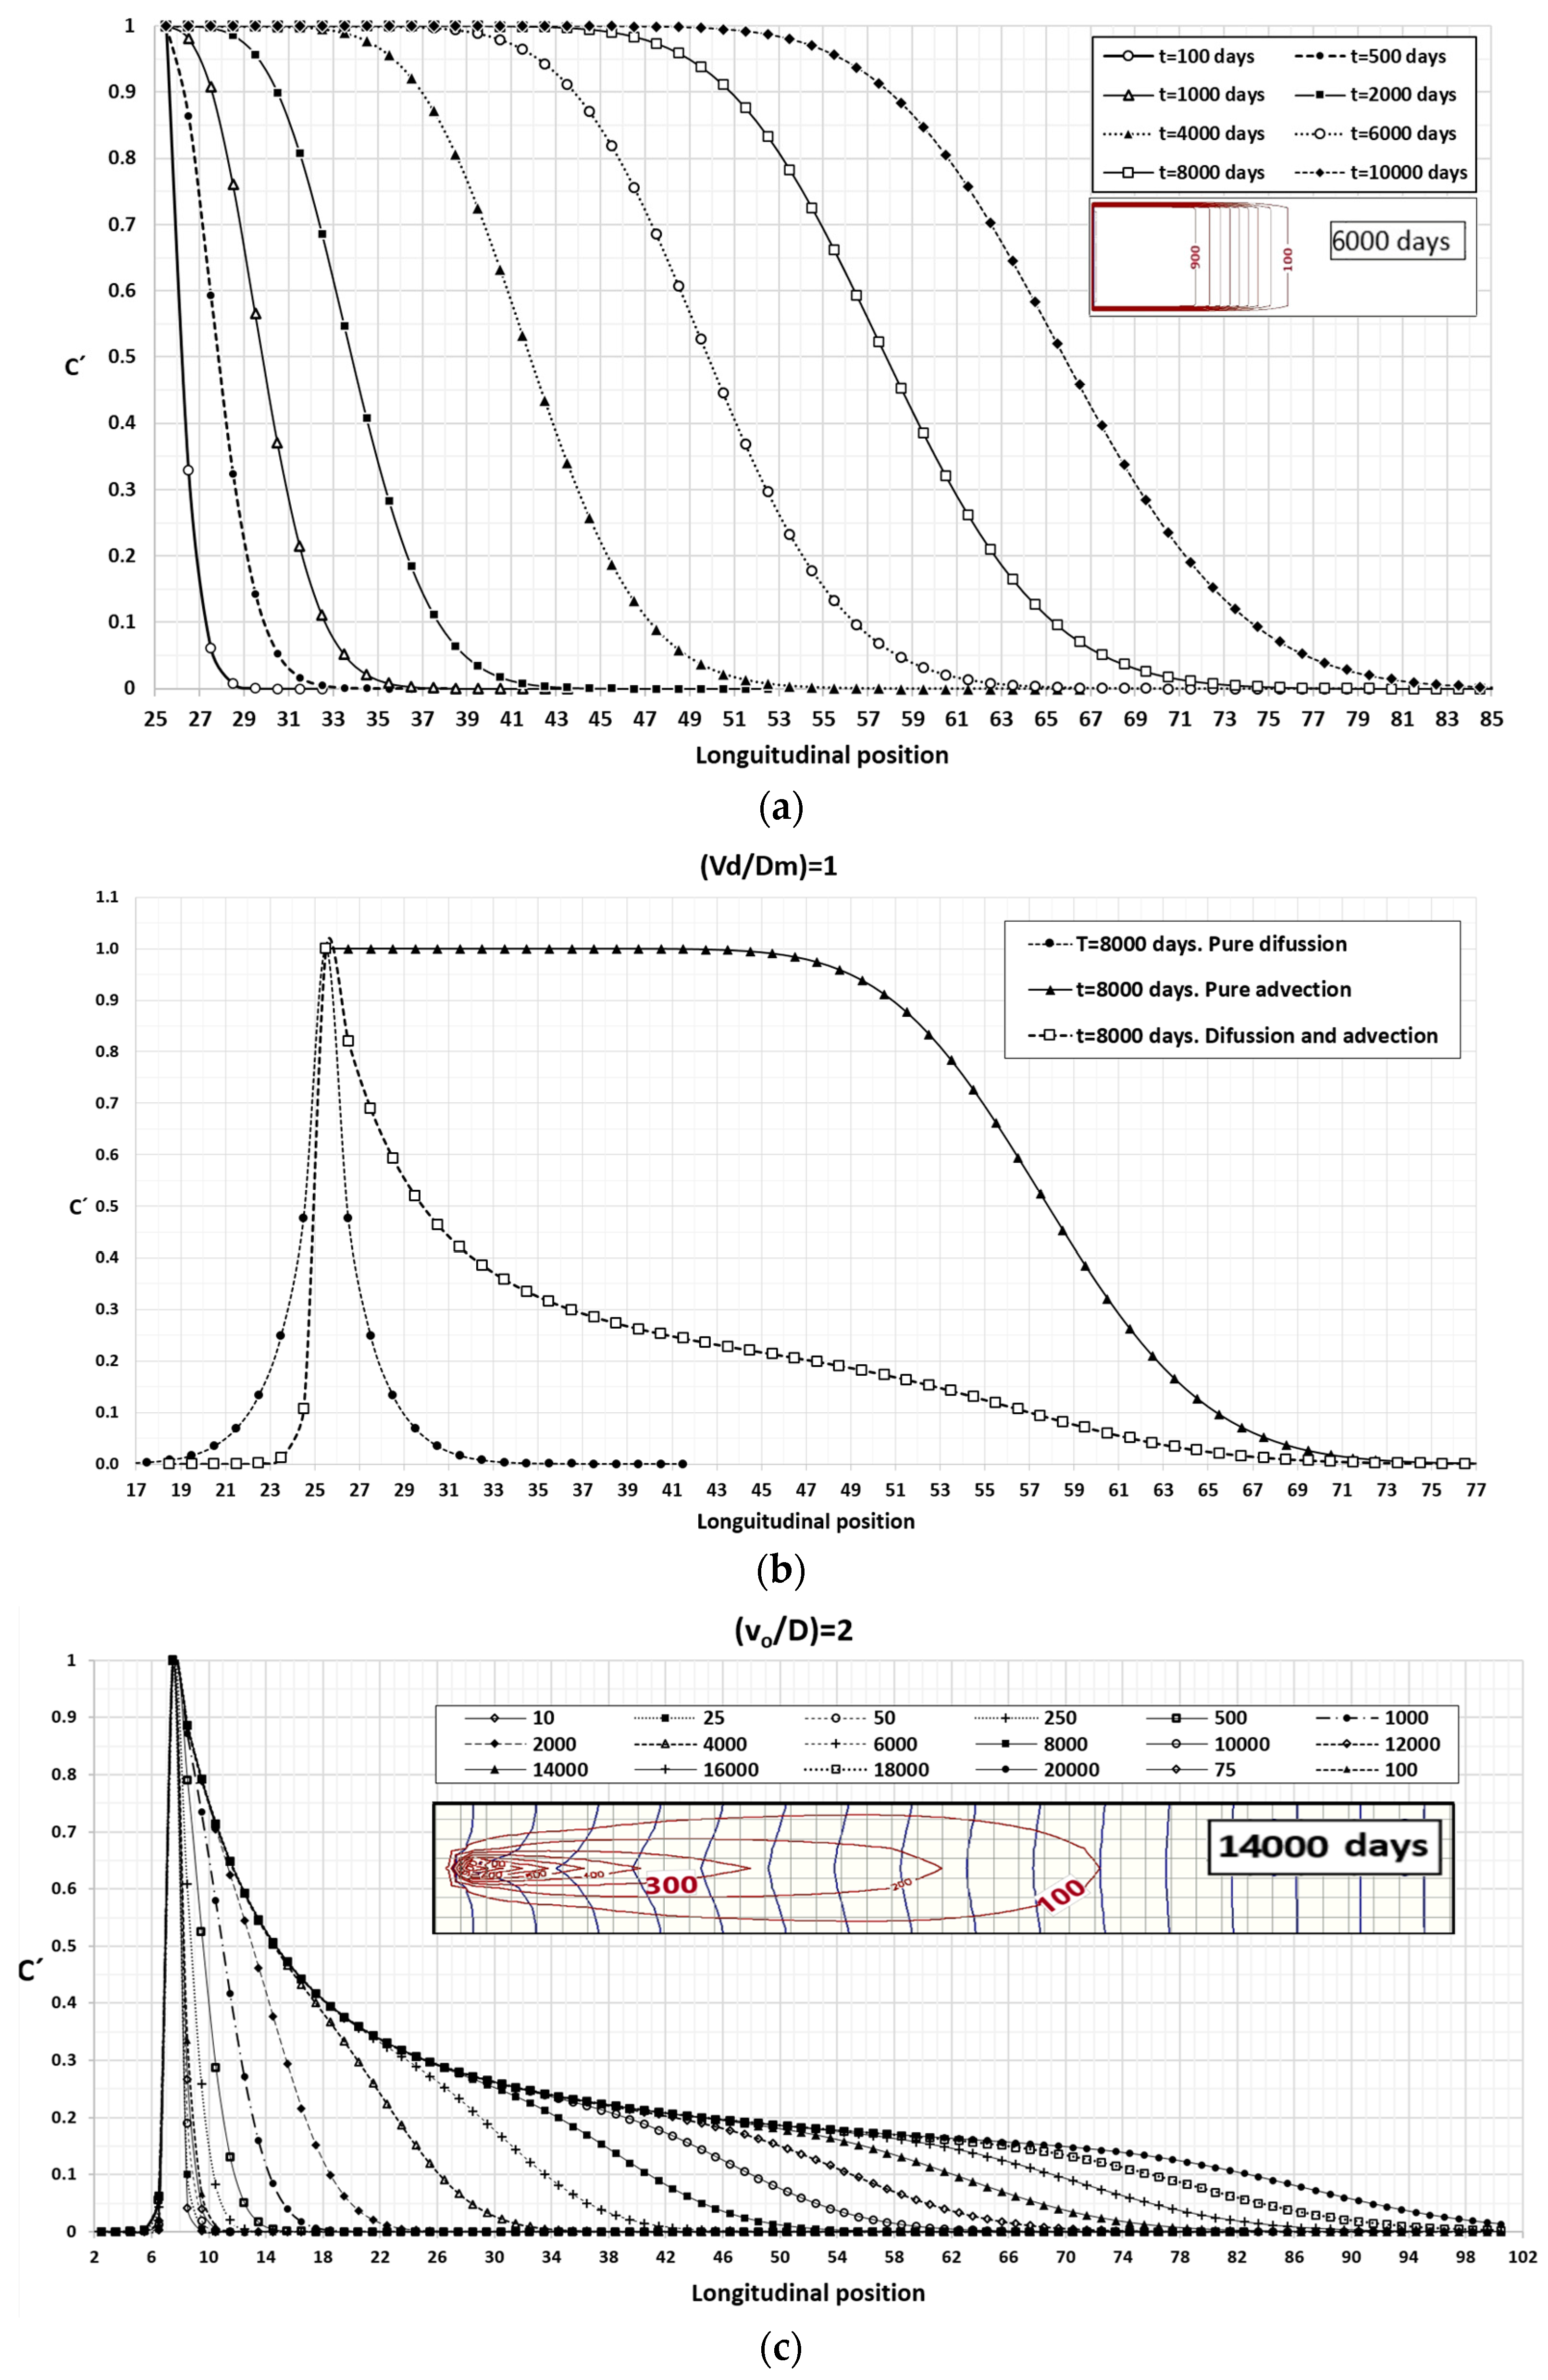
Continuing with the illustration of the coupled diffusion and advection effects,
Figure 6a–c show the typical concentration profiles for different ratios of v
o/D and c
o = 1000 kg/m
3. These figures can be contemplated as a different and more complete configuration of
Figure 2 and
Figure 3; the x-y axis distribution of concentration for specific times is now plotted on the vertical axis of concentration (z coordinate) in
Figure 6a–c.
Figure 6a is the case of no diffusion, with c = 1000 kg/m
3 and v
o = 0.0006 m/a, a velocity that corresponds to the front of the isoline of concentration 0.5c
o. The profiles gradually decrease their negative slope, increasing the distance from the small concentration isolines to those of higher concentration. Below the legend, the spreading of contamination in the x-y coordinates corresponding to the curve t = 6000 days is represented. Positions of concentrations 900 and 100 are represented as normalised with the 0.9 and 0.1 values in coordinate z (vertical axis in the chart).
Figure 6b is a comparison between the profiles after 80 days for a pure diffusion process (D = 0.0006 m
2/d), pure advection (v
o = 0.0006 m/d) and coupled advection-diffusion (D = 0.0006 m
2/d, v
o = 0.0006 m/d). The profile corresponding to the combination of both effects presents two marked inflection points, depending on the v
o/D ratio. This is a consequence of the coupling between both effects.
Finally,
Figure 6c shows the profiles for a coupled problem with D = 0.0006 m
2/d and v
o = 0.0003 m/d for different times. For this ratio, v
o/D = 2 as well as for ratios that are larger than unity, the profiles present an interesting result. If we consider the same concentration value in all the profiles (for example 0.3, which corresponds to c = 300 kg), the point of the domain with this concentration moves to the right more and more slowly until it stops at a certain distance from the focus at a certain time. This distance is set by the curve corresponding to the last time studied. The lower the chosen concentration, the greater the distance and time at which the concentration is fixed, and vice versa. As will be seen in the next section, similar phenomena occur in the transversal direction. As in
Figure 6a, an x-y coordinate image of iso-concentration lines for t=14,000 days has been included below the legend so it can be compared with the concentration values of the same line in the z coordinate (or vertical axis in the chart).
All these results, which have been qualitatively described, will be represented by universal curves in the following section, after a large number of numerical simulations have been made. All this will verify the mathematical dependences derived through the non-dimensionalisation process followed in
Section 4.
6. Universal Solutions
6.1. Scenarios with Only Advective Flow
For these scenarios, the only universal curve comes from expression (18), which we rewrite in the form of:
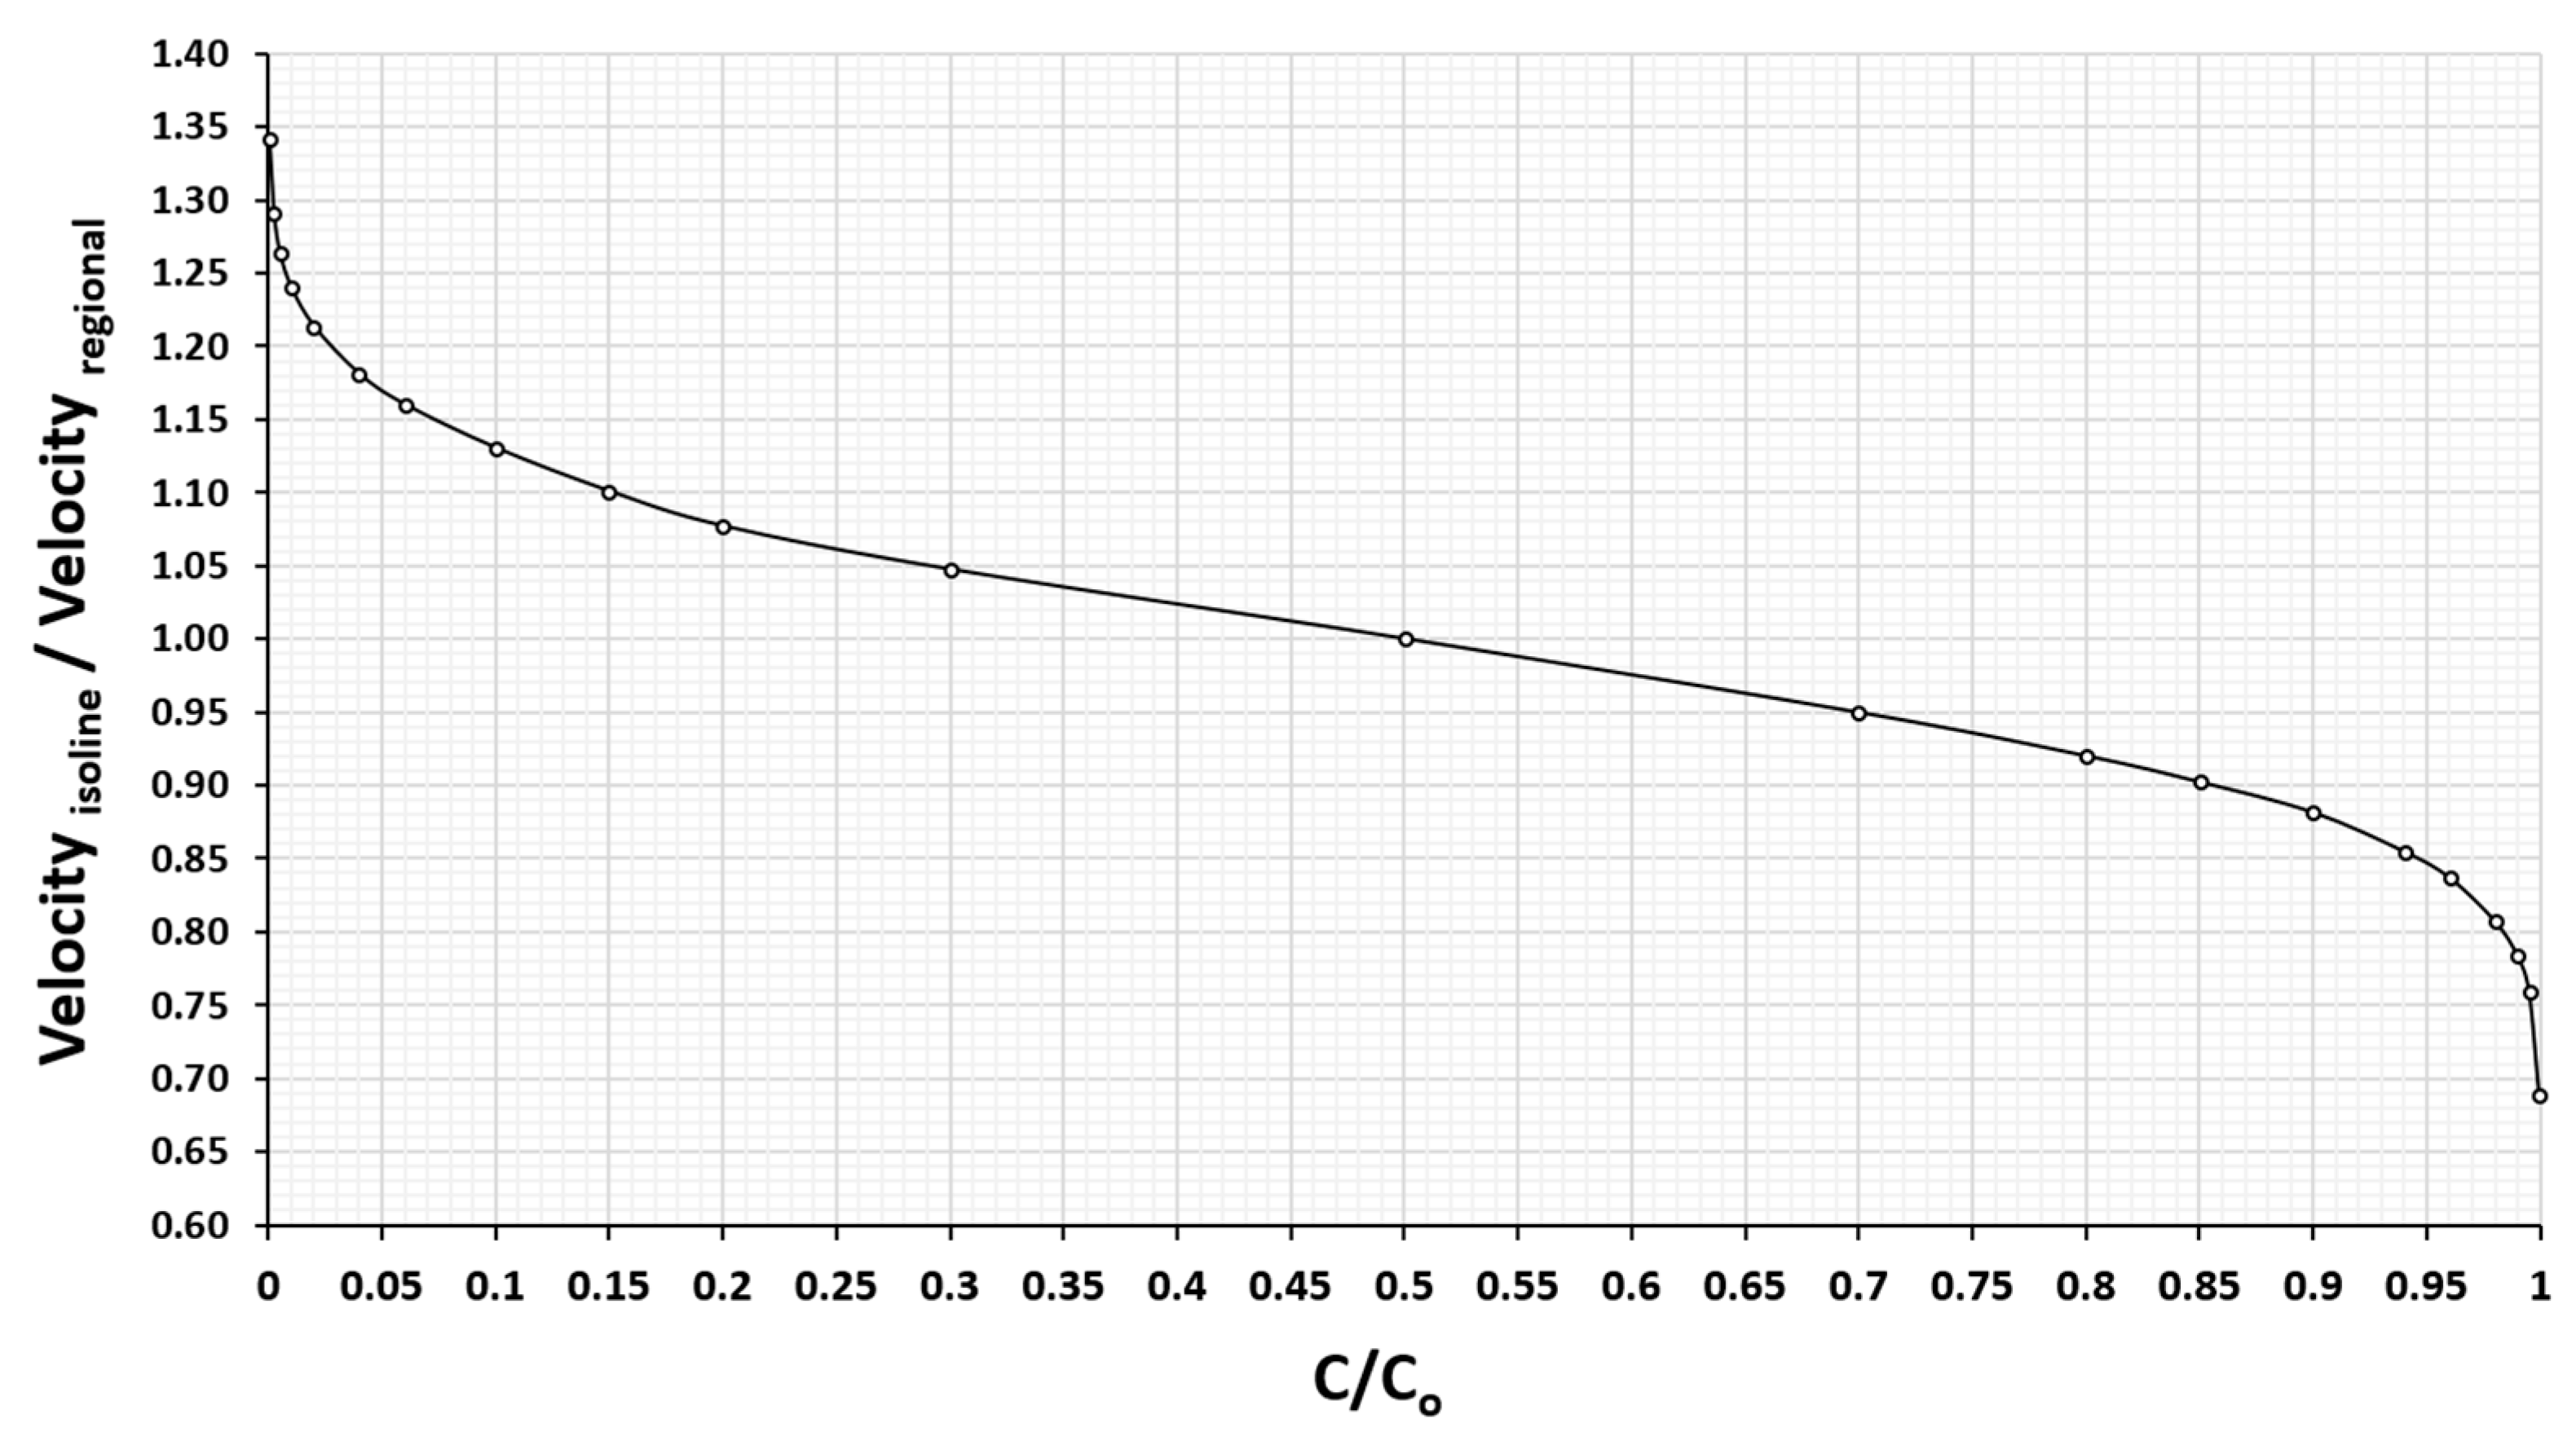
This relationship represents the ratio between the velocity of the front of the dimensionless concentration c′, and the regional velocity v
o. c′ is the ratio between the actual concentration of the front (c) and the constant concentration of the source.
Figure 7 shows the universal dependence
, or
, on c′. The c′ = 0.5 front travels at the regional Darcy velocity. For a wide range of concentrations, c′ ∈ [0.15–0.85], the velocities of the fronts deviate very little from the value of v
o (less than 10%). Only for very small or very large values of c′, the velocities are somewhat higher (up to 1.3
) or lower (0.7
) than
, respectively.
6.2. Scenarios with Coupled Diffusion and Advection
The universal curves presented in this sub-section derive from the expressions (13)–(15). The first expresses the longitudinal extension measured from the source of contamination of each concentration isoline, the second, the maximum transversal extension, and the third, the horizontal extension of the polluted region to the left of the focus. Each isoline is characterised by its dimensionless concentration, taking that of the focus as a reference. The way in which these characteristic lengths depend on the physical parameters of the problem, v
o and D, allows us to organise the universal curves in the form of an abacus, with a specific value for the relationship v
o/D for each one. Every curve in
Figure 8 represents the horizontal extension (vertical axis) of the isolines of dimensionless concentration c′ (
) against a time factor
(horizontal axis), for
= 1. The simulations to determine the function of the dependence (13) have been carried out for values v
o = 0.0006 m/d and D = 0.0006 m
2/d. In this way, the time factor (
) is related to real time (
) by
Thus, for the same ratio (
=1) and different values of v
o and D, the extension of any isoline (
) associated with a real time
is obtained by entering the abscissa axis with the value
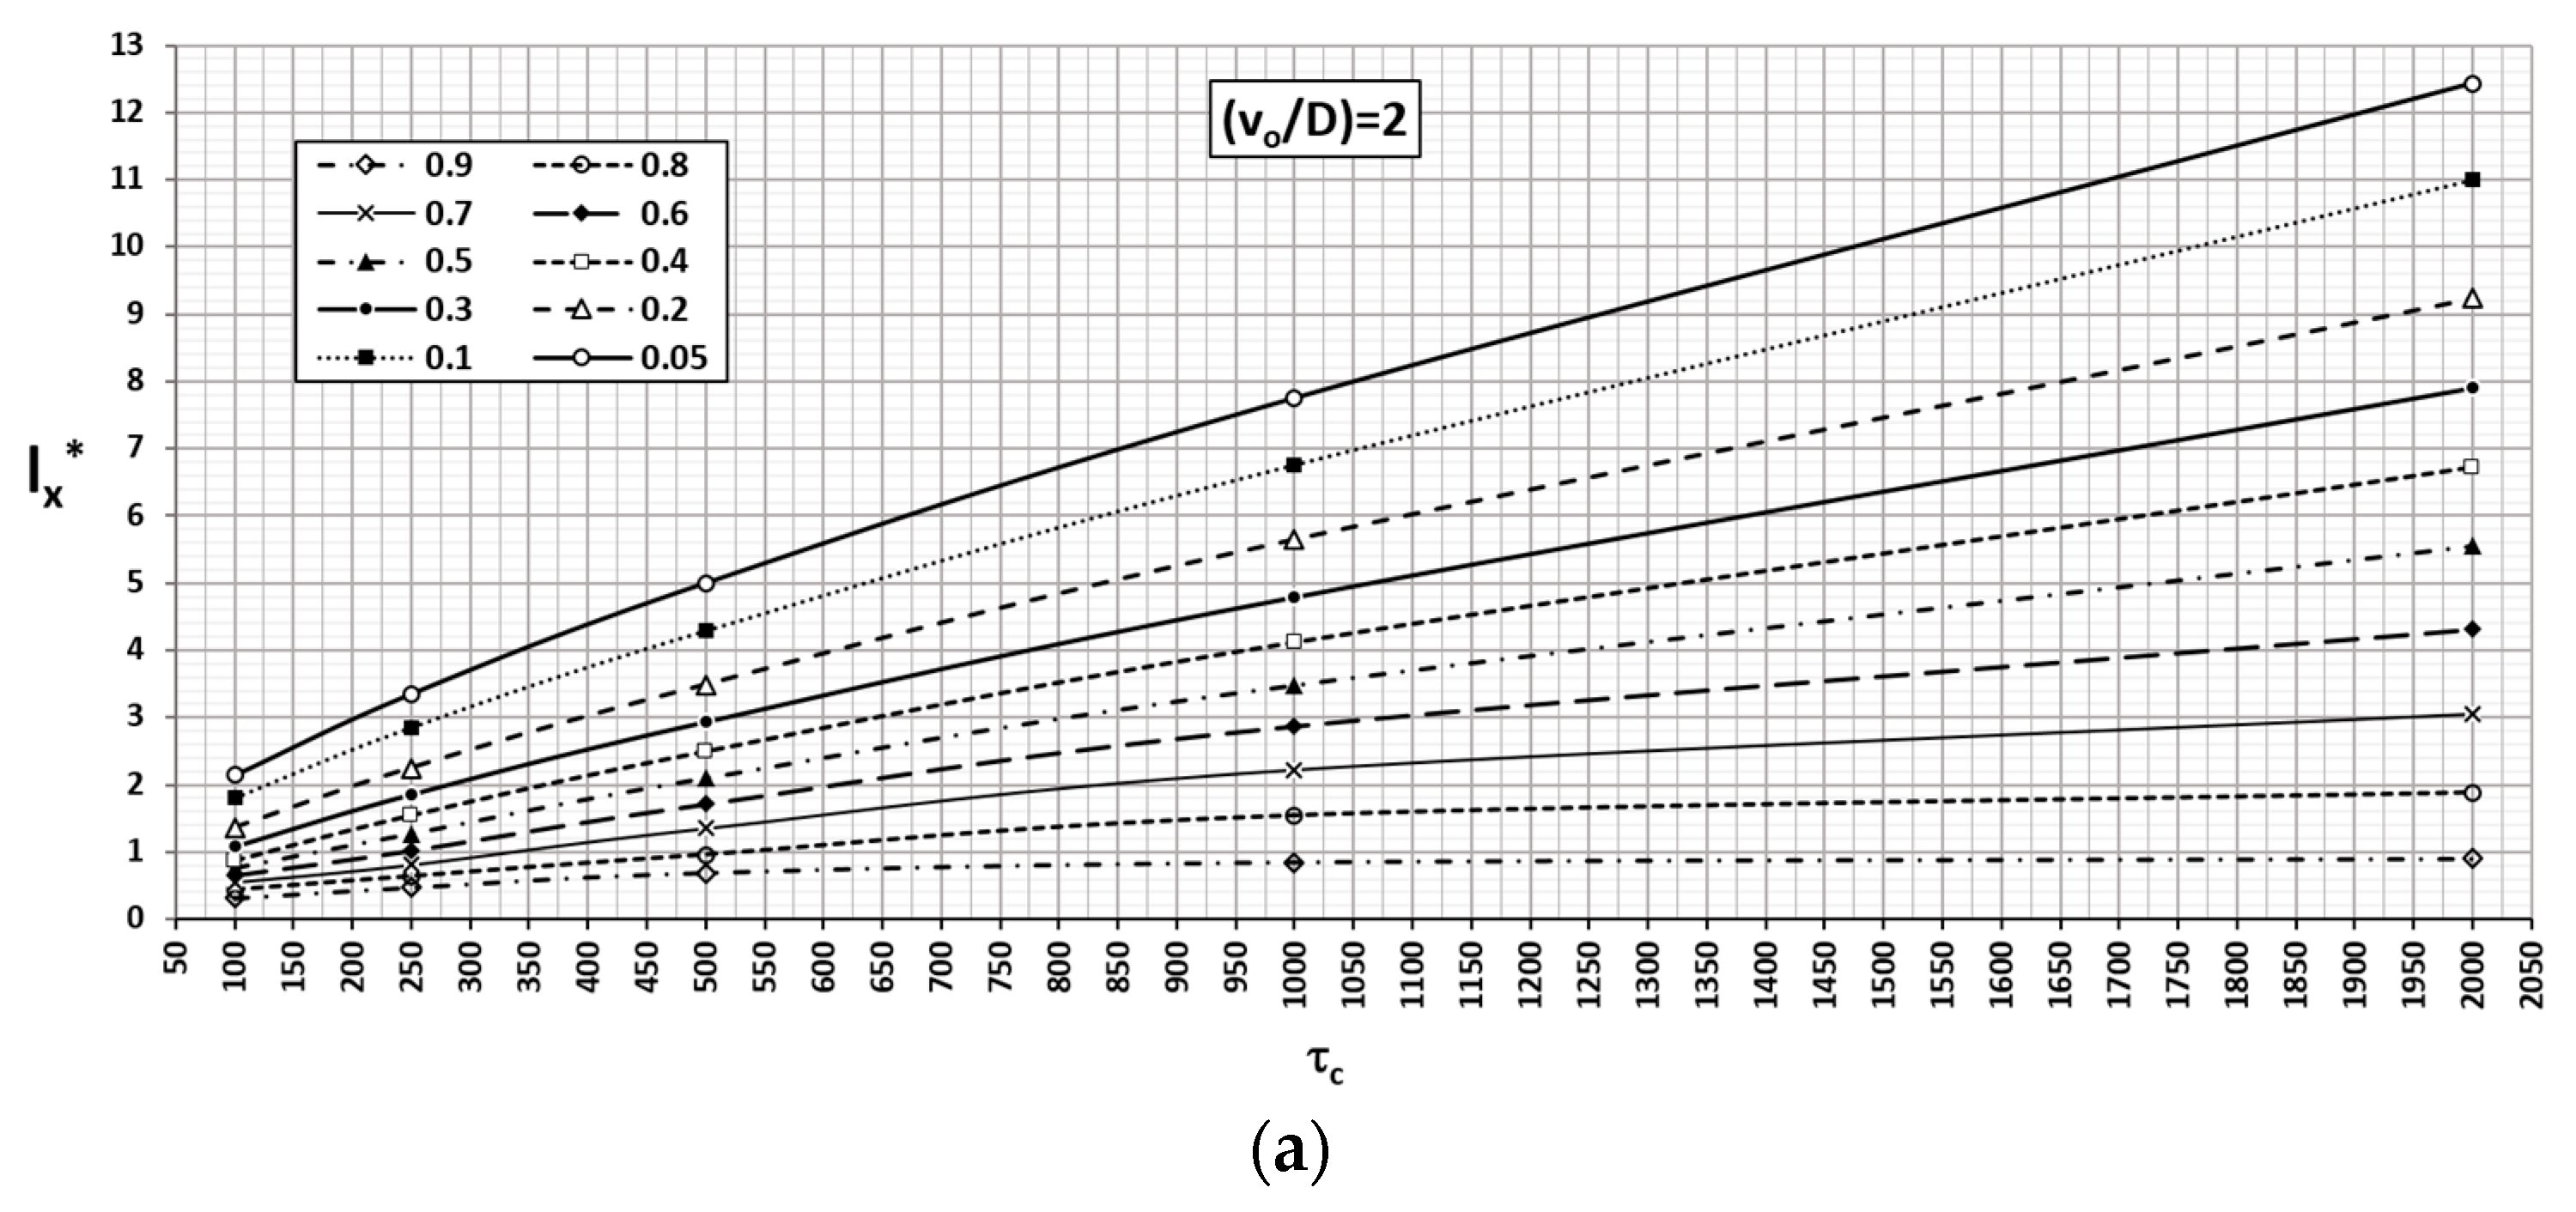
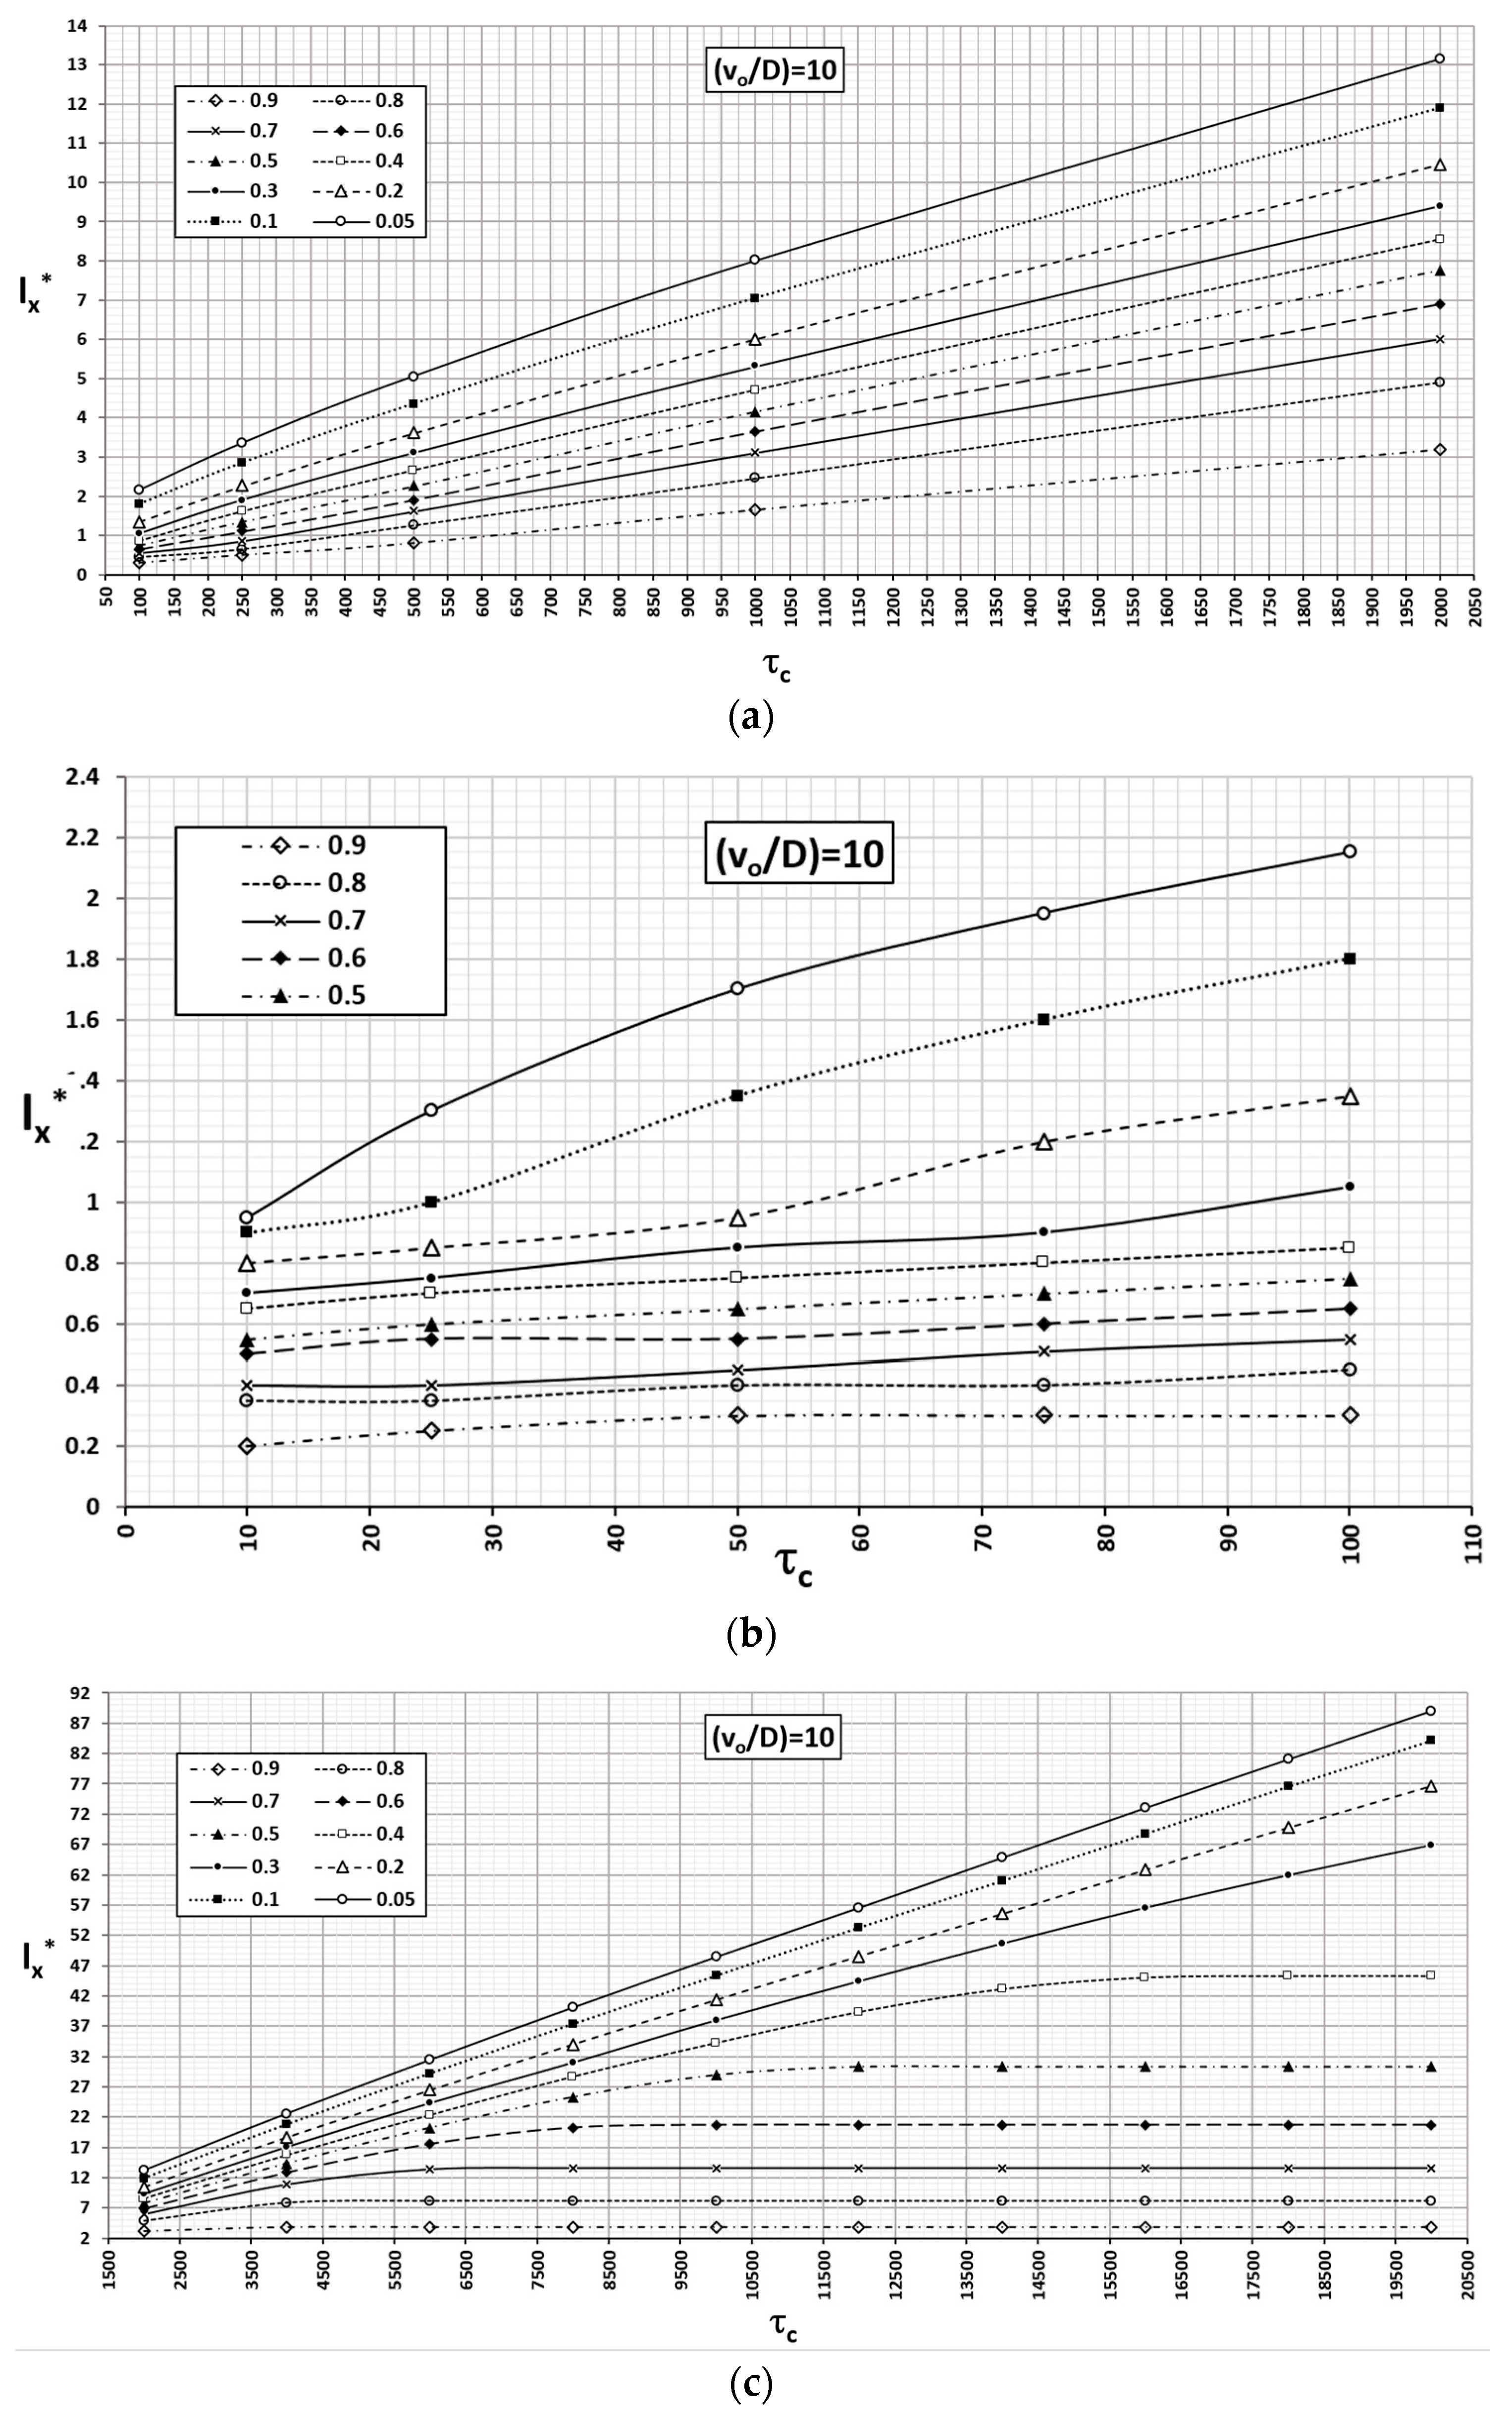
given by expression (21). For greater detail, the time factor has been separated into two intervals with ranges [100–2000 days] and [10–100 days],
Figure 8a,b, respectively. For longer times, the contaminated regions stabilise for successively increasing values of c′. The lower the concentration is, the sooner the stabilisation occurs.
Figure 8c,d show the extensions of some isolines for times of [2000–20,000 days] and [2000–8000 days], respectively.
The abacus corresponding to the monomials
= 2, 5 and 10 are shown in
Figure 9,
Figure 10 and
Figure 11, respectively, with details similar to the previous ones. Numerical solutions have been obtained by retaining the regional velocity (v
o = 0.0006 m/d) and changing the diffusivity to successive values D = 3·10
−4, 1.2·10
−4 and 3·10
−4 m
2/d. In this way, the time factor is related to real time through the same expression as the former abacus (21).
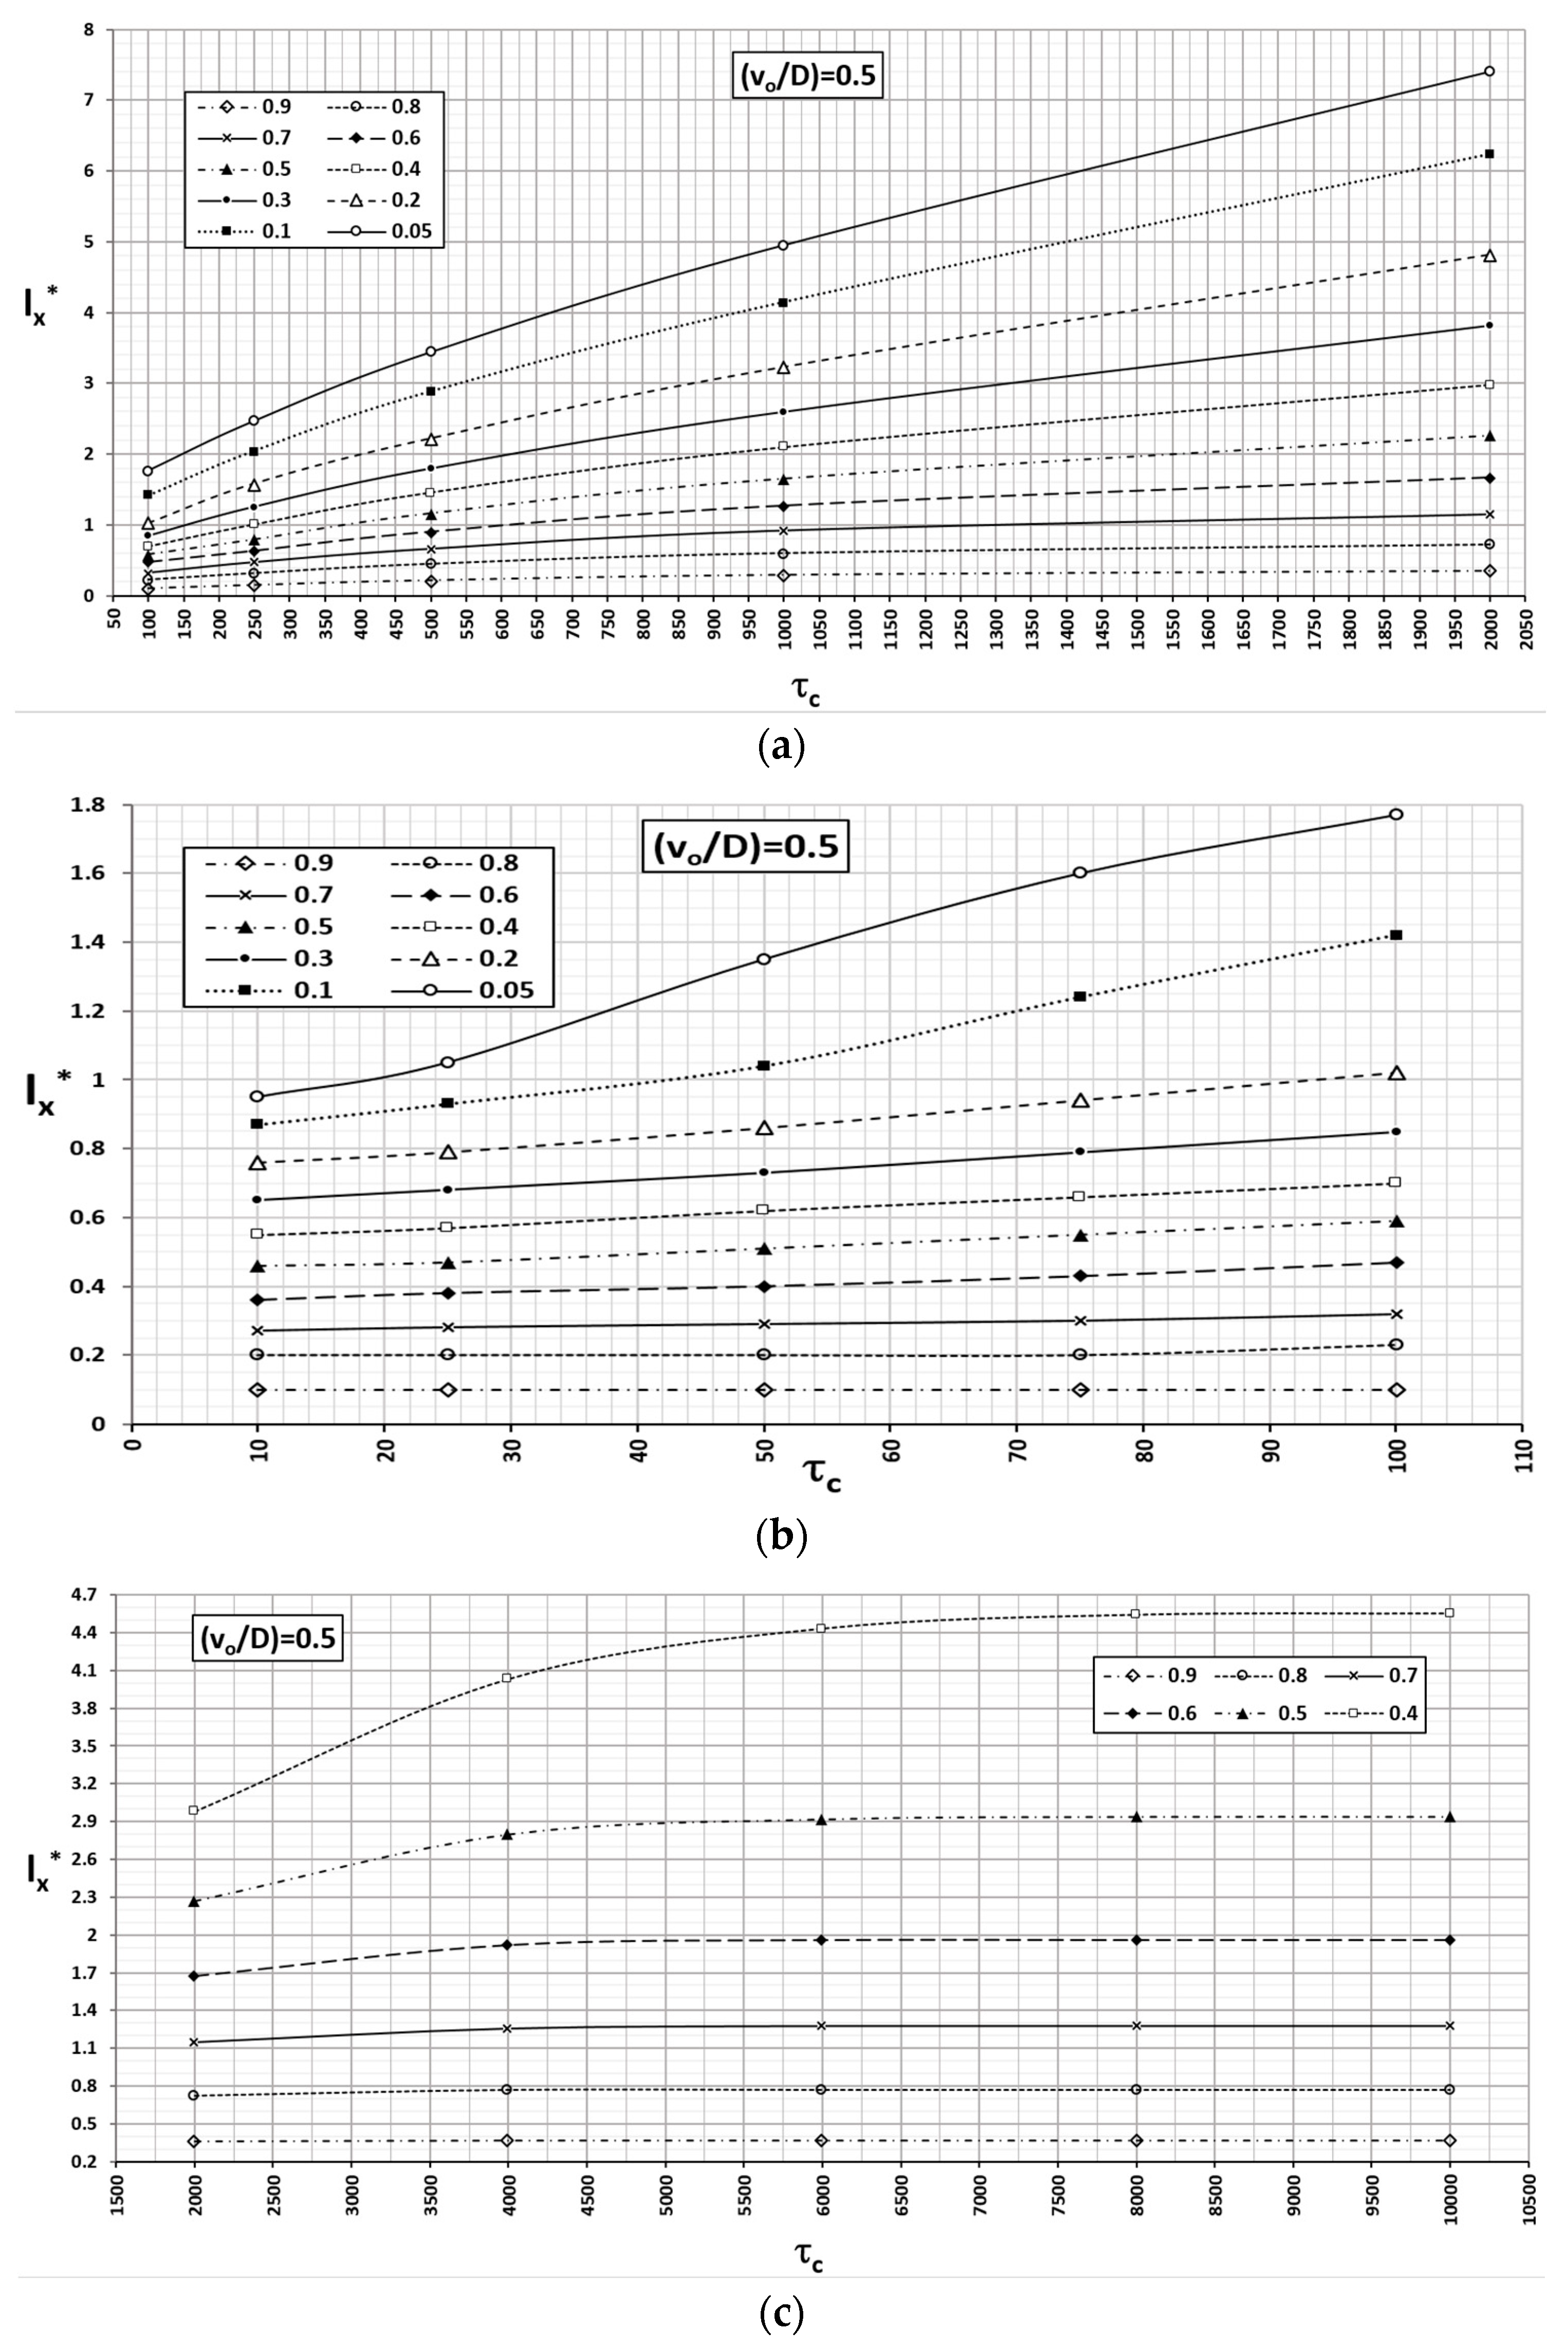
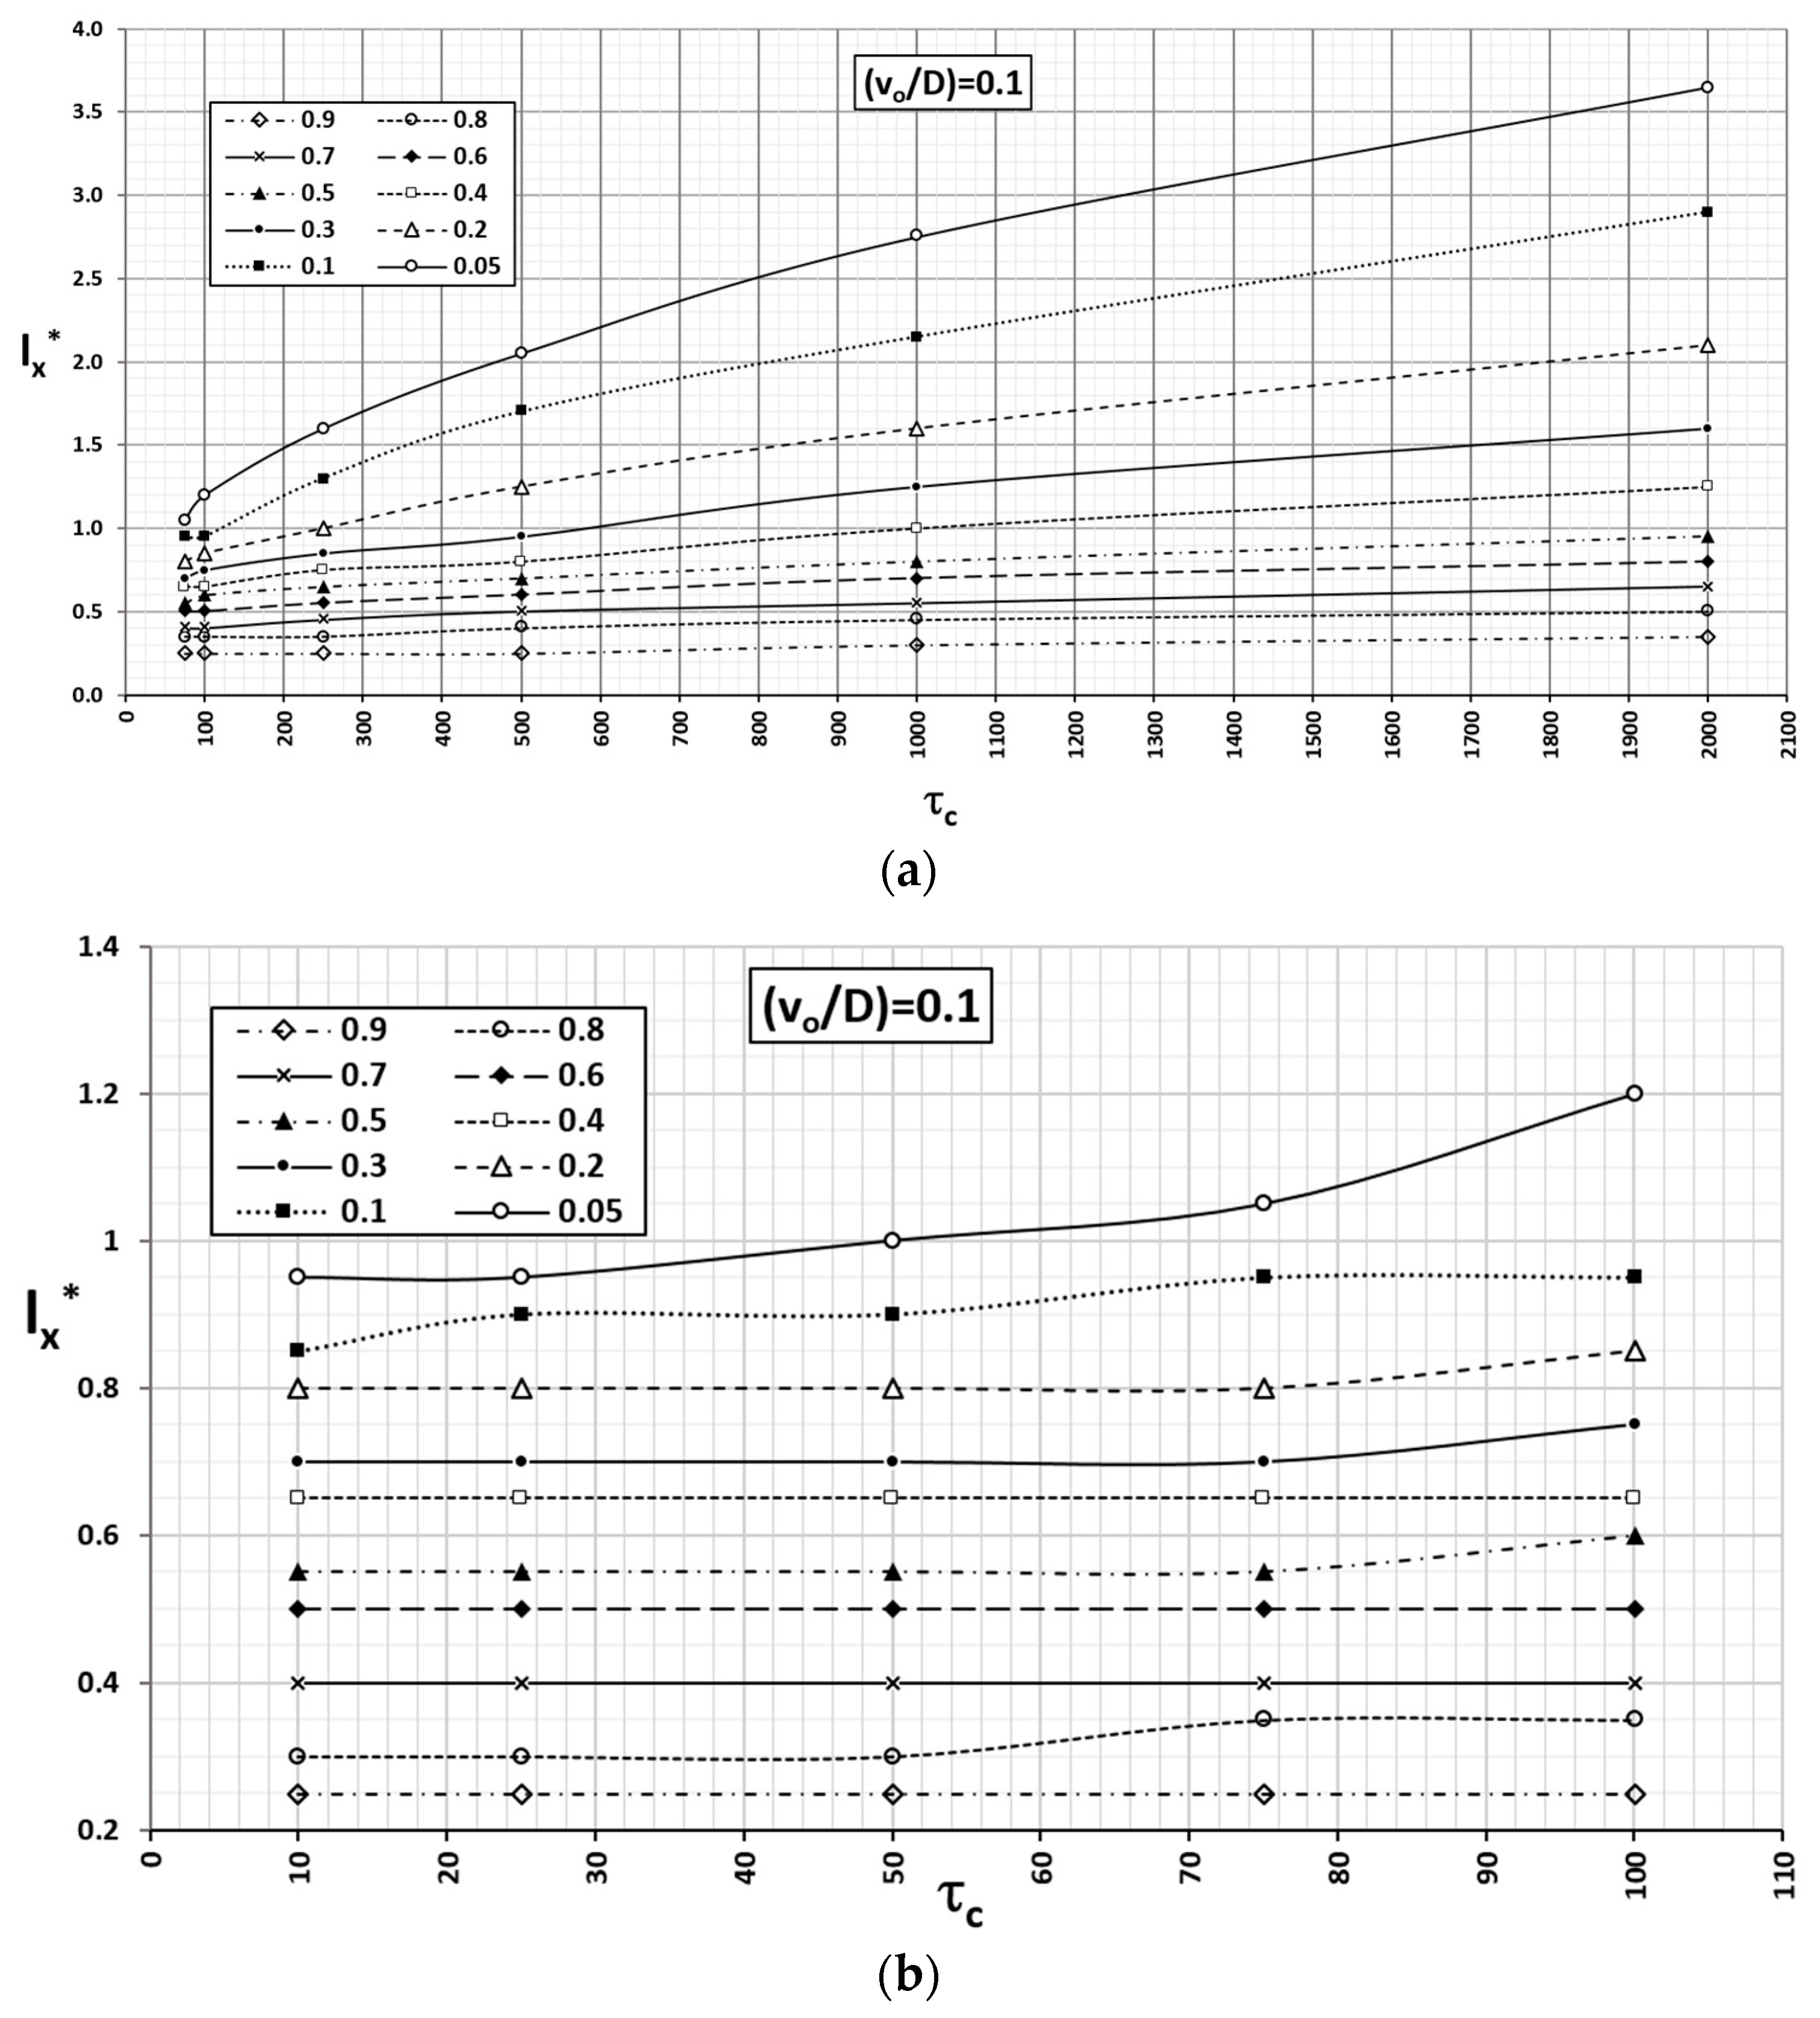
Similarly, the abacus corresponding to values
= 0.5 and 0.1, made with v
o = 0.0003 and 0.00006 m/d, are shown in
Figure 12 and
Figure 13, respectively. Accordingly, the time factors and real time are related by:
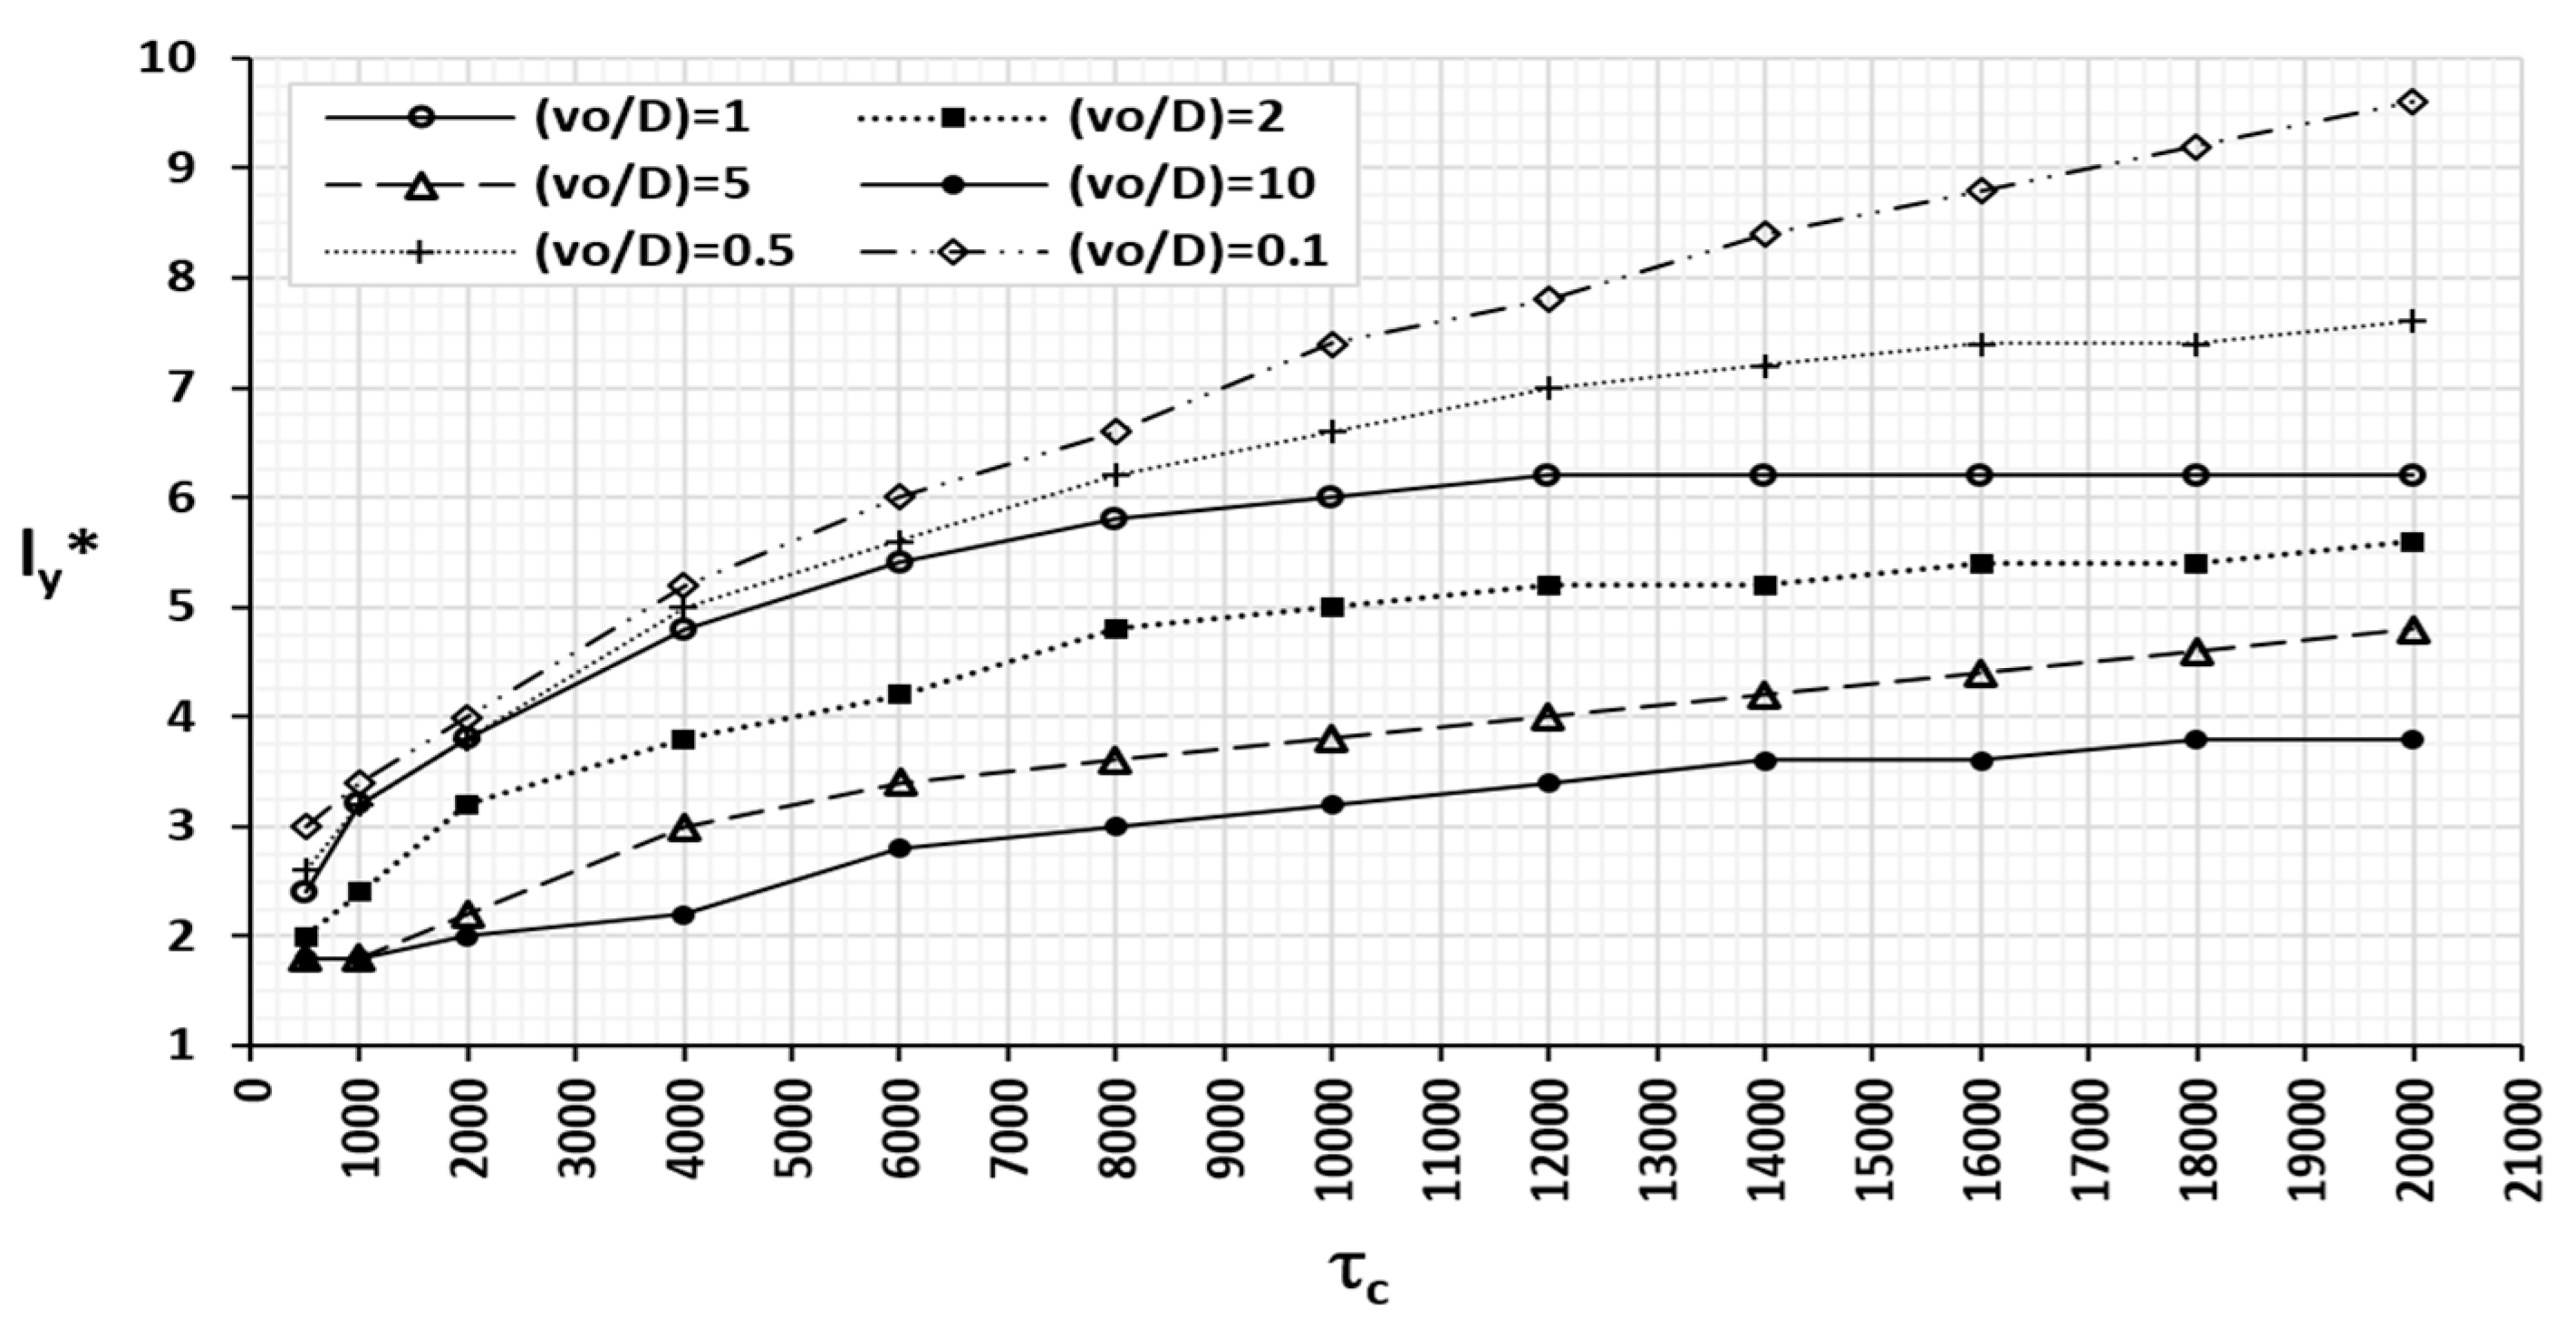
In relation to the largest transversal extension (
) given by dependence (17), the curves depicted in
Figure 14 show this parameter (vertical axis) for isoline c′ = 0.1, which represents 10% of the concentration of the focus, as a function of time factor
(horizontal axis) for
= 0.1, 0.5, 1, 2, 5 and 10. As in the former figures, the time factor scale and real time are related by expressions
for the curves
= 1, 2, 5 and 10,
for the curve
= 0.5 and
for the curve
= 0.1. The lack of monotony in the slope of the curves is a consequence of the coupling between advection and diffusion, which occurs at different times according to the relative influence of one effect or the other. The patterns tend to stabilise when the advective and diffusive processes balance each other, while the preponderance of the diffusive process clearly establishes an unsteady pattern. There is a relationship between this maximum transversal extension (
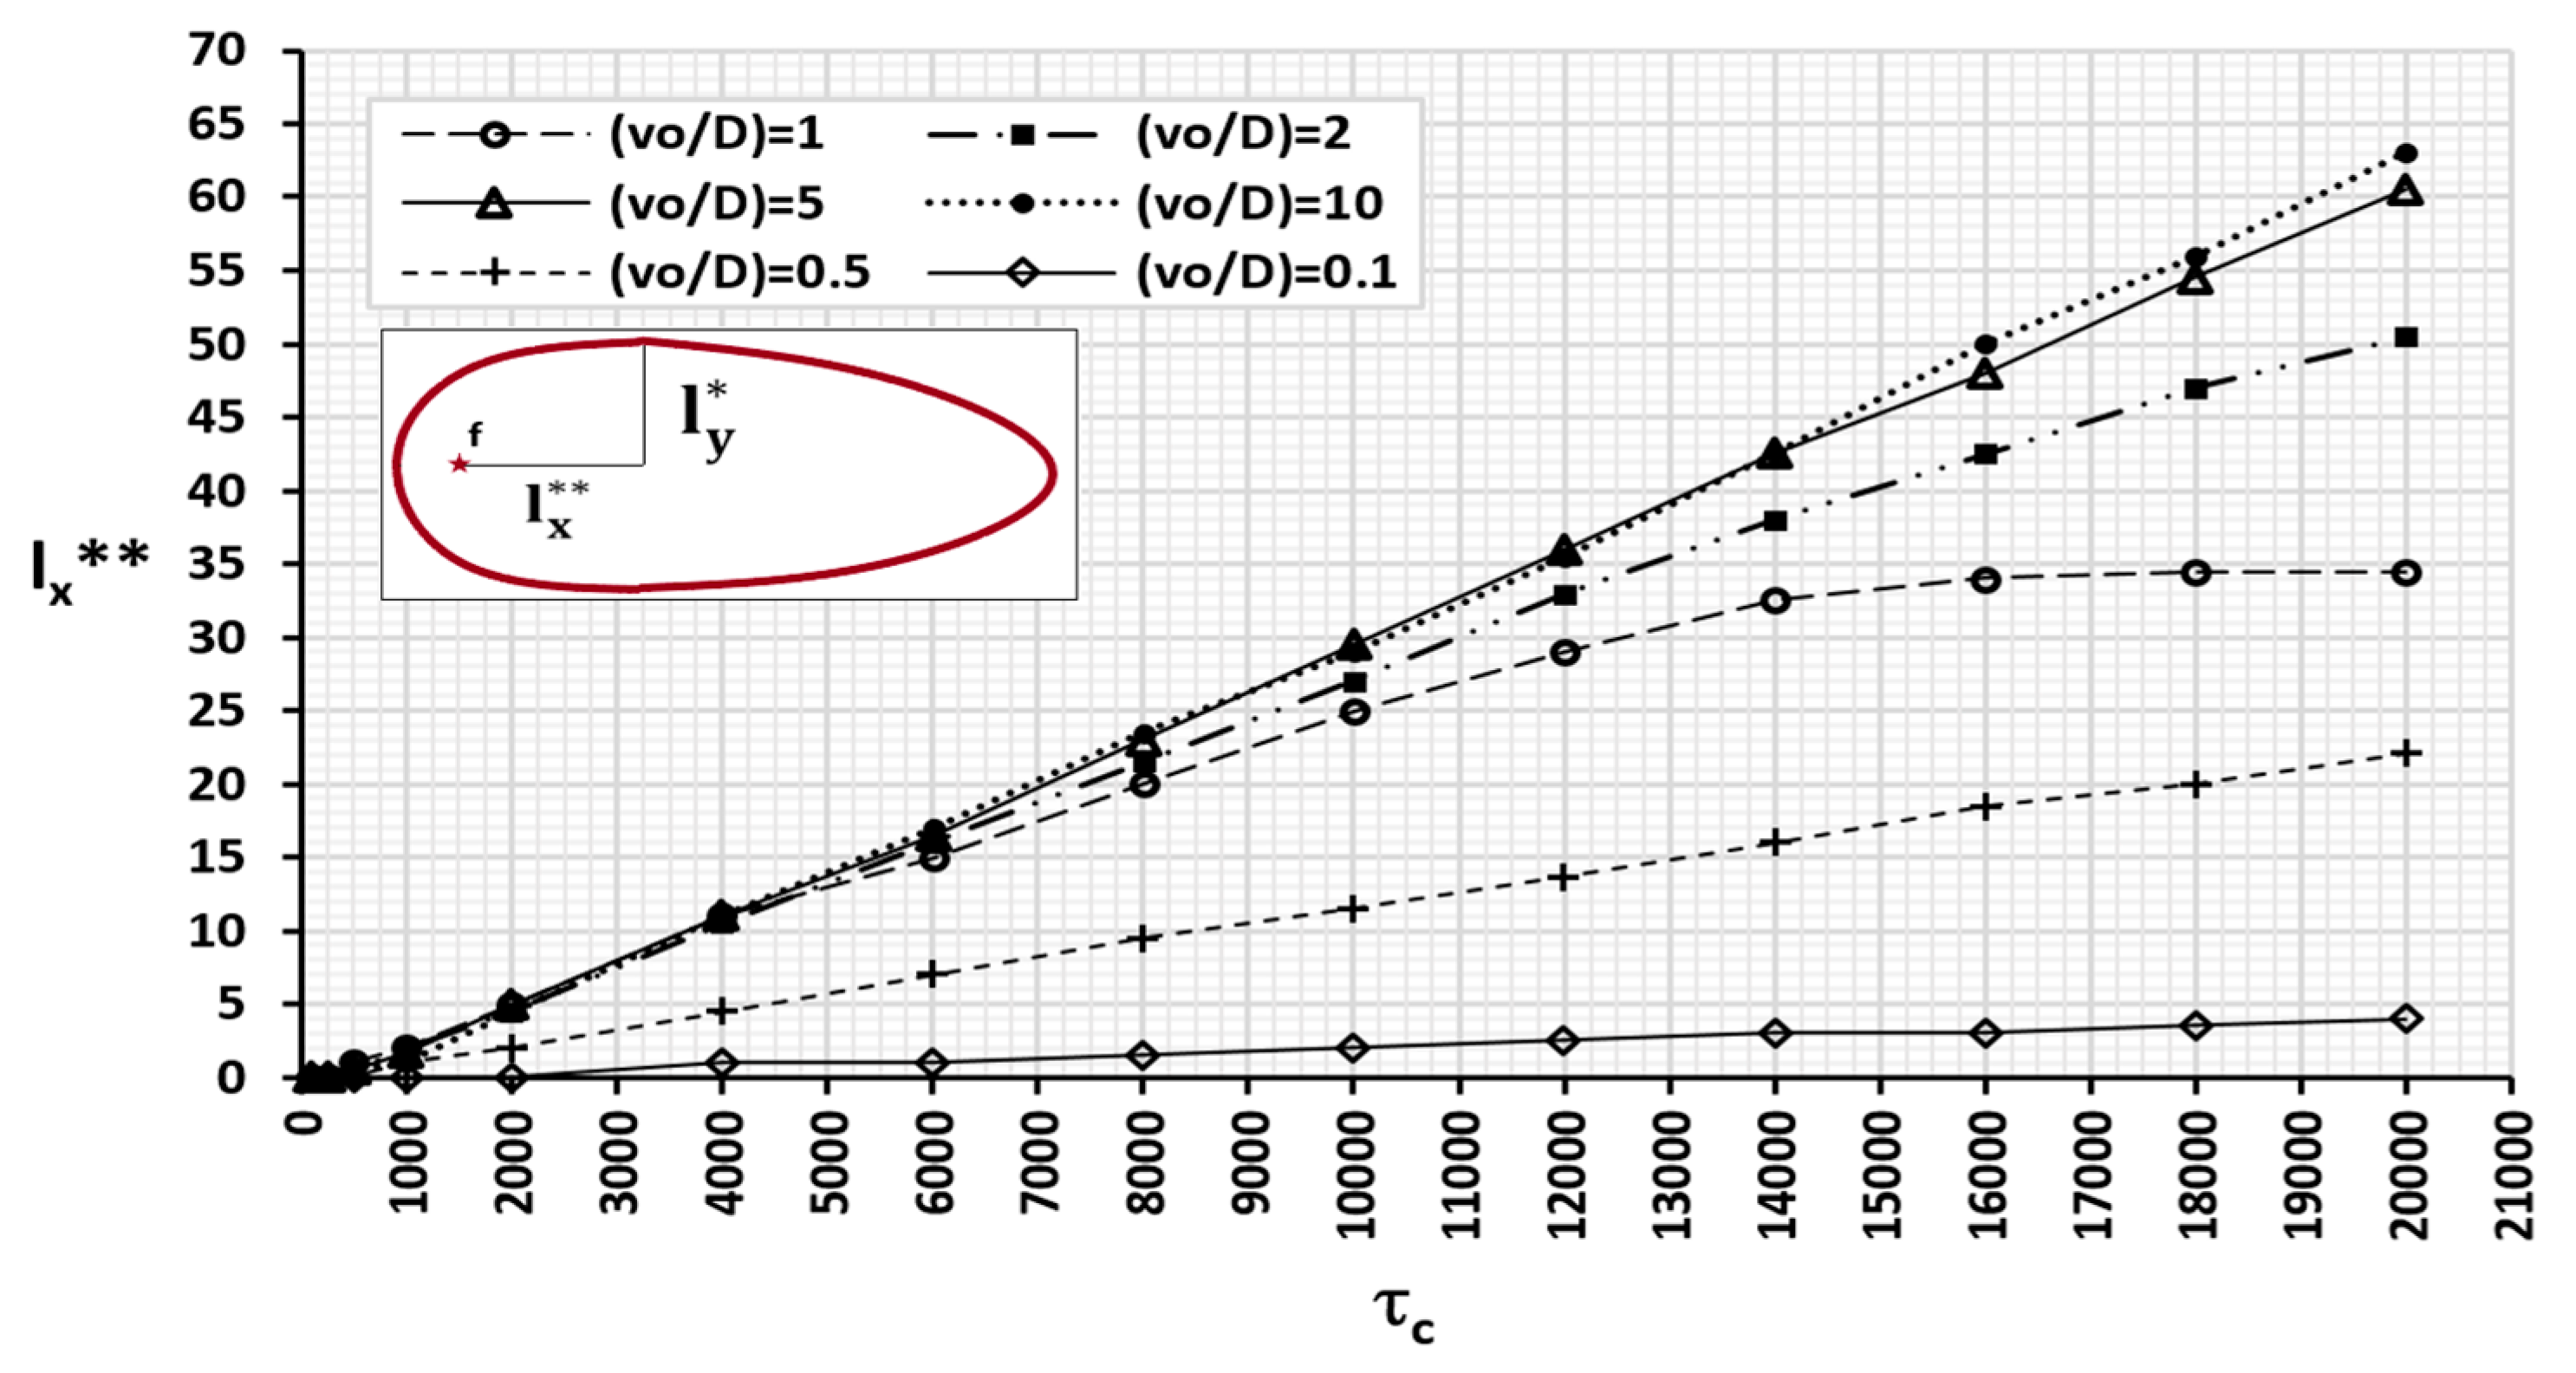
) and the horizontal location (
) measured from the focus (f) at which such extension occurs.
Figure 15 shows this dependence, in addition to that of the dimensionless concentration c′ = 0.1 and the same ratios of
.
To finish, the universal curve corresponding to the location of the stationary contamination fronts to the left of the focus, defined by the extension
, is shown in
Figure 16 for the general case
= 1, in which advection and diffusion process are equally balanced. According to Equation (15), the curve is independent of the regional velocity as long as the ratio
remains constant. The period of time necessary to achieve this stationary distribution of concentration profiles, estimated from different simulations, is expressed as t =
and varies from 750 to 6000 days, depending on the regional velocity (v
o = 0.0024 to 6000 m/d, respectively). Further research may aim to establish new curves as a function of the
ratio as well as to define the characteristic stabilisation time as a function of this ratio and the regional velocity.
7. Conclusions and Final Comments
The parametric dimensionless characterisation following a discriminated and normalised dimensionless protocol of the governing equations has allowed us to deduce precise information about the dynamics of contaminant plumes in extensive 2D scenarios with a constant concentration focus under the effects of advection and molecular diffusion. The proposed non-dimensionalised procedure as well as the application of the Pi theorem have resulted in accurate expressions of the unknown functions of interest (that is, the horizontal and transversal extensions of the plume) on the physical and geometrical parameters of the problem. In the most complex case, the lengths that define the pattern of the plume extension depend on three parameters: the dimensionless concentration of the isoline, the ratio between molecular diffusivity and regional velocity and a time corrected by the regional Darcy velocity. Based on these results and thanks to a sufficient number of numerical simulations, the functions can be universally represented by means of an easy-to-use abacus that facilitates the monitoring and management of the contamination plume in most real cases.
In the proposed protocol for the search of the dimensionless groups, normalisation makes it possible to approximate the changes or partial derivatives of the dependent variables to the unit when these are averaged over the entire domain of the problem, while discrimination prevents the emergence of monomials of the type of geometric shape factors that unnecessarily increase the number of dimensionless groups.
The coupling of the diffusive and advective flows is not intuitive since the cross values of the variables and their derivatives are combined in the governing equation. Small diffusivities versus advection (to the magnitude of unity, at the most) advance the dragging effect by redistributing the concentration in the posterior or central area of the plume before it affects the diffusive effect. However, if diffusion predominates over advection, it will produce a redistribution of the concentration by diffusion and, over this dampened field of concentrations, advection occurs.
The scenario addressed here is only a sample of the problems of contaminant flow and transport in porous media. First, the geometry of the scenario may be different or finite, including the effects associated with gravity flow. In addition, scenarios with a constant initial concentration (not maintained), with a non-constant concentration or with a contaminated fluid injection well could be tackled. Finally, the study of the dynamics of contaminants under the effects of advection and hydrodynamic dispersion (in general, with negligible molecular diffusivity) is another pending issue to characterise and for which to propose new universal solutions.

