1. Introduction
The application of mathematical methods to the process of solving economic problems is widespread. Dozens of monographs and thousands of scientific articles are published annually on the application of mathematical methods in economics. Even special scientific areas dealing with the application of mathematical methods in economics, including operations research, econometrics, mathematical economics, have emerged [
1]. The theory of constrained optimization with Kuhn-Tucker conditions, the task of optimizing consumption with the Slutsky equation and the aggregation conditions of Engel and Cournot have been widely used. Research in the field of economic equilibrium, including the models of L. Walras, Arrow-Debreu, is of great importance.
At the level of microeconomics, the most interesting are the applied studies associated with the firm profit maximization, including linear models of the economy (e.g., Leontief cost-output model). Models of imperfect competition, risk management, investment analysis, and capital structure optimization should also be mentioned here.
Of course, these are fundamental scientific studies that are of great importance for the development, first of all, of economic thought, the scientific justification of the conclusions made by economists, and the confirmation of the hypotheses put forward by them.
However, unfortunately, there is a huge gap between the economic theory and its and mathematical methods, on the one hand, and the practical applications of these tools, on the other. One subjective factor is the insufficient willingness among economists to use the appropriate tools.
In practice, the solutions to problems within mass service systems theory have become widespread. However, even elementary loss-free models based on cost-output theory provisions are poorly applicable in practice, since, in most cases, they are oriented to one product, which does not correspond to the practice of firms. Of course, there are many nomenclature break even models, but their use involves making certain assumptions (for example, the conditional distribution of fixed costs among the types of manufactured products), which reduces the accuracy of the calculations. The ideality of the developed theoretical models leads to objective difficulties in their use in a nonideal world. In practice, there is neither a perfect form of competition nor an ideal market. Additionally, there is no such thing as perfect access to information, which ultimately leads to imperfect states in economic systems and imperfect management by economic agents.
Nevertheless, we believe that the priority of modern management is still to increase the scientific validity of management decisions. To this end, mathematical methods should become the basis not only of theoretical calculations in the framework of scientific research, but also tools for decision-making in applied economics. The process of applying mathematical methods as funds management tools is of particular interest. Along with accounting, this is the one of the most closely related areas of economic activity in mathematics. There are a number of publications and scientific articles on financial mathematics. Unfortunately, almost none of the reviewed publications included a description of the use of probability theory methods for the purpose of predicting the emergence of one of the most undesirable states for an organization—a cash deficit [
2,
3,
4,
5,
6].
Specific instruments for predicting default using numerical methods are present in a number of works [
7,
8,
9]. These problems were also raised in fundamental dissertation studies [
10], as well as in reviews by international organizations [
11]. In most cases, however, publications address issues only at the macro- or industry levels.
Based on our analysis of the given sources, it can be stated that the probability function of normal distribution is especially popular in economics and finance for making predictions ([
12], p. 343). However, its incorrect use can lead to significant errors in determining probabilities [
13].
In our opinion, the more justified approach is to collect the data on the cash balance and construct the empirical probability distribution function, testing the null hypothesis that the cash balances are normally distributed. When the null hypothesis is rejected, it seems more appropriate to use empirical probability distribution function to calculate the probability of a cash deficit ([
14], pp. 255–256).
Currently, various methods, including scoring assessment, are used to assess the risks of insolvency and creditworthiness. Scoring issues are widely described in the economic literature, especially in relation to credit scoring [
15,
16].
At the same time, much attention has been paid to the quality of the results obtained from the use of scoring models. Notably, some approaches were found to be imperfect [
17].
The essence of this approach was formed several decades ago. For example, in 1941, David Durand reviewed 7200 reports provided by credit organizations. Then, based on the analysis of this large amount of information, a system of level values of indicators was built with which the values of a particular economic entity were subsequently compared [
18].
Of course, this is a very popular tool for external financial analysis. However, we believe that a different approach is necessary for internal users of information. Scoring is not acceptable for several reasons:
- -
a lack of own data sampling (when analyzing, it is necessary to rely on data from other organizations, which may be outdated or unavailable).
- -
weak consideration of the individual characteristics of an entity (use in the analysis of levels based on data from other organizations that may operate in other areas of business or may exhibit different characteristics).
After all, in rating evaluations, the system of levels is based on the results of statistical processing of a large amount of data from various organizations. At the same time, each analyst has his/her own initial data for building a model, or obtains them from other entities (for example, credit bureaus). As a result, the number of scoring models increases annually (by an average of 10–25%), which makes it difficult to choose the most adequate ones for evaluation according to the data of an organization. [
19,
20].
The purpose of this article is to develop a model that estimates the probability of default based on the data of a particular organization. This is how the model fundamental differs from the scoring models, although we do not deny their significance. Moreover, we believe that the results of this paper obtained are comparable with the results of the scoring assessment for possible clarification of the conclusions. It should be noted that the proposed model is based on fundamentally different assumptions.
When preparing this paper, we investigated the content of classical works in this area. Particularly close attention was paid to the paper by Miller and Orr [
21]. Their main ideas assume that the cash flows of a given organization are poorly predictable, the balance of funds on the settlement account changes randomly, and significant fluctuations in cash flow are possible. These ideas are the basis for the research part of the present model. Similarly, as Miller and Orr used the Bernoulli process to construct their model (a stochastic process in which the receipt and expenditure of money from period to period are independent random events), the same approach was chosen in this publication. However, the key difference is that Miller and Orr focused on determining the optimal (normal) balance of cash of the organization, while this research focuses on determining the probability of a cash deficit regardless of the initial balance, taking into account the entire set of initial balances during the period in question instead. Moreover, for the study we use not only one indicator (the cash balance), but three interrelated indicators (cash balance, absolute and relative changes in the cash balance), the essence of which will be considered later.
Moreover, this study can be considered as describing a method for determining the lower control limit, which, in accordance with the Miller-Orr theory, is determined by expert means based on the average need of an organization to pay counterparty bills, bank requirements, payments to the budget, etc. We consider this to be the weakest element of their entire theory, which should be strengthened. The same conclusion can be drawn regarding the study by Costa Moraes and Nagano [
22].
Their algorithm was developed to use with the Miller-Orr model and to define the lower bound parameter, which is not obtained in the original model. The results indicated that evolutionary algorithms produced better results than the Miller-Orr model.
In addition, the Miller-Orr theory is focused on determining the upper limit of the cash balance in the accounts minus whatever cash must be transformed into highly liquid securities. This action, which was relevant in the 1960s, when the Miller-Orr model was developed, lost its relevance today, since there is no need to transform cash into the securities under the conditions of interest paid by banks on the account balances. Thus, under the conditions of the guaranteed return on the cash balance on the account, the use of the Miller-Orr model is only of theoretical, but not practical interest. Accordingly, taking their main idea as a basis, we have completely shifted the focus to predicting the probability of a cash deficit. Obviously, if the financial manager is satisfied with the received probability value, then the organization should not use a strategy to increase cash funds. If the risk seems to be too high to the financial manager, then it is necessary to adjust the strategy of the organization and prevent the reduction of the cash balance below the increased Lower Control Limit.
The same can be applied to the Baumol-Tobin model [
23,
24]. It is well known that this model analyzes the advantages and disadvantages of accumulating cash. The main advantage, according to these authors, is that the individual is freed from the need to go to the bank. The disadvantage is that the individual has an opportunity cost, losing the interest that he could have received by putting money into a savings account. We believe that under the conditions of the economy digitalization, the approaches used by Baumol-Tobin in their model are outdated. In the context of the ubiquity of electronic technologies, an individual does not incur any additional costs associated with a visit to the bank, except for insignificant time losses when making an electronic transaction. The theory of lost interest also seems somewhat outdated, since banks actively practice charging interest on the account balance.
Moreover, we also consider it unjustified to draw analogies between the theory of determining the optimal size of the material reserve and determining the optimal stock of funds at the present stage. Diverting funds into inventories leads to the large amount of the transaction costs. But not the storage of cash funds, because in this case, additional costs either do not arise at all or are not significant.
We do not deny Baumol-Tobin’s contribution to the development of the theory of financial management, but we believe that almost 70 years after its development, it requires some adjustment and rethinking. It contains the relative determination of the lower and upper limits of the cash balance which are the basis of the whole financial management. However, the key problem remains the same - assessing the riskiness of the strategy chosen by the organization in practice. That is, we still consider the key question as what is the probability of a cash deficit with the strategy used by the organization.
However, the Miller-Orr and Baumol-Tobin models are classical in this area of scientific research and their basic provisions must be understood before studying this article.
The purpose of this paper is to describe the method of cash deficit probability estimation using the basic principles of probability theory. In this, as the hypothesis, we make assumption that with a sufficiently large number of observations over a long period of time, the cash balance is a random variable, which may have both normal distribution and the distribution different from the normal. Nevertheless, the methods based on the probability theory to predict the cash deficit are quite applicable.
2. Materials and Methods
There is a problem of applying ideally constructed theories to nonideal economic processes. That is, if a theoretical description of the state of an economic system could be presented as a function
then the real state of the economic system may be described by a function such as
where
and
E are constants that determine the value of the dependent variable.
At the same time, the value of random variable ε is much lower than that of random variable E. That is, the level of a random factor in determining the level of a dependent variable is incommensurably higher than the estimated value of a random variable input to the model in comparison with the influence exerted by an independent variable.
Obviously, these are only theoretical assumptions based on the authors’ own conclusions. However, years of practical experience, including the implementation of financial planning at the microlevel, inclines us to consider this hypothesis, if not an axiom, at least for the relatively weak Russian economy. The pandemic has proved that external, difficult-to-predict factors can have a much greater impact on economic systems than managed economic processes.
If we add to this political, social, environmental, infrastructural and other similar factors that also certainly affect the economy, then the magnitude of the random component in the functional characteristics describing the state of economic systems is more than significant.
It is clear that in such situations, much attention should be paid to the use of probabilistic methods in analyses of economic processes. That is, the key question will not be what the state of the economic system will be, but rather, what the probability is that that state will be no worse (i.e., neither below or above) than a predetermined level.
In this sense, the task of the data analyst, in practice, includes determining the possibility of using a method for the purpose of analyzing economic processes.
We will analyze this using a problem that is often encountered in the practice of organizing—the cash deficit.
A cash deficit is a situation when it is necessary to spend money without holding the required funds, even though cash flow is expected soon and the existing liabilities will ultimately be met. To avoid cash deficits, financial planning is carried out through a payment calendar in which cash flows are not forecast on a monthly basis, but for shorter periods, sometimes daily. As a last resort, external sources are used to close cash deficits.
The casts when cash deficits can occur are illustrated in
Table 1.
It is obvious that the firm will face difficulties in making payments twice a month under such a payment schedule, even though it is planned to increase the cash balance by 60 percent at the end of the month, and the cash balances will increase sharply the day after the cash deficit. It is obvious that, from an economic point of view, in such a situation, it would be appropriate, first of all, to revise the payment schedule and possibly postpone some of the payments to a later date. However, the main task, in our opinion, is not to suggest possible ways to solve the described problem, but to predict the likelihood of its occurrence, i.e., to determine the risk of a cash deficit in order to form the necessary degree of readiness for action in a possible financial emergency.
With this regard, one of the features of the empirical data that were accepted for initial analysis is obvious—they cannot be negative, since in real economic practice, the value of the cash balance cannot go below 0. The assets of the organization cannot be negative!
Therefore, the task is to estimate the probability of a default with a potentially negative balance for all positive outcome data.
We believe that in order to estimate the probability of a default, it is possible to apply two methods to model the cash balance in the settlement account:
Let random variable Xt be the bank account balance at the end of operational day t, considering both payments made and those rejected due to the lack of funds. That is, if the Xt takes a negative value, this indicates a cash deficit, but not a negative balance of the bank account. In this case, the probability of a cash deficit will be defined as Pr(Xt < 0) = F(0), where F() is a cumulative distribution function of a random variable Xt.
We define two more random variables and , which reflect absolute and relative changes in the bank account balance over the operational day t, respectively. Using these two random variables, the cash deficit probability can be expressed as and , where is the bank account balance at the end of the previous day. determines the probability that the decrease in the cash balance for day t will exceed the bank account balance at the end of the previous day, t − 1, that is, the balance at the end of day t will be negative. The meaning of is that the relative change in the balance in the settlement account should be more than 100% downward.
When F() is known, finding the probability is not difficult. Therefore, the first step in solving the problem in practice should be the estimation of F(). This is not as simple as it might seem. Once again, recall the notion that the incorrect use of the distribution function may lead to the significant errors in determining probabilities [
13].
For example, as follows from central limit theorem, if a quantity is the sum of many random, weakly dependent quantities, each of which makes a small contribution relative to the total sum, then the centered and normalized distribution of such a quantity with a sufficiently large number of terms tends toward a normal distribution.
Accordingly, the first question that the researcher faces is to assess whether the values in the choice under consideration are weakly dependent.
On the one hand, if we are talking about the cash balance, then it is clear that the cash balance at the end of the current day is determined by the cash balance at the end of the previous day. However, it is obvious that the cash balance is connected with cash flow, while cash flows are poorly connected with the size of a cash balance, even though mathematically, this connection is elementary. This dependency can be represented by the model:
Since cash inflows (to a greater extent) and outflows are random variables in terms of determining the cash balance (together forming ∆Xt, as well as having a large number of observations), it can be said that the quantity in question is generally random, and its sampling is sufficient to indicate a potentially normal distribution.
3. Results
We collected the data on cash balances on the bank account over 1485 operating days, and the data on the payments rejected due to the insufficient amount of funds. As the initial data for the study, the data of two firms for the period 2015–2020 were used. Firm 1 operates in the production sector and firm 2 operates in the service sector. Both firms operate on the market for more than 20 years. The data collected represent the result of a total measurement of cash balances. We believe that the number of observations in the data is sufficient to identify patterns in the balance of funds. Empirical data only illustrate the application of the methods proposed by the authors. They are not the basis for calculating any constants, but are used to visually represent the calculations being carried out.
We believe that the scope of the operations of the firms used in this research is not a limitation, since the scheme for the formation of the balance of funds, the main directions of income and expenditure of financial resources are generally universal.
The first step was to calculate the observations of random variable
Xt as the difference between the bank account balance and the amounts due, including the rejected payments. Then, the observations for the random variables
Yt and
Zt are calculated. The descriptive statistics for all three random variables are shown in
Table 2.
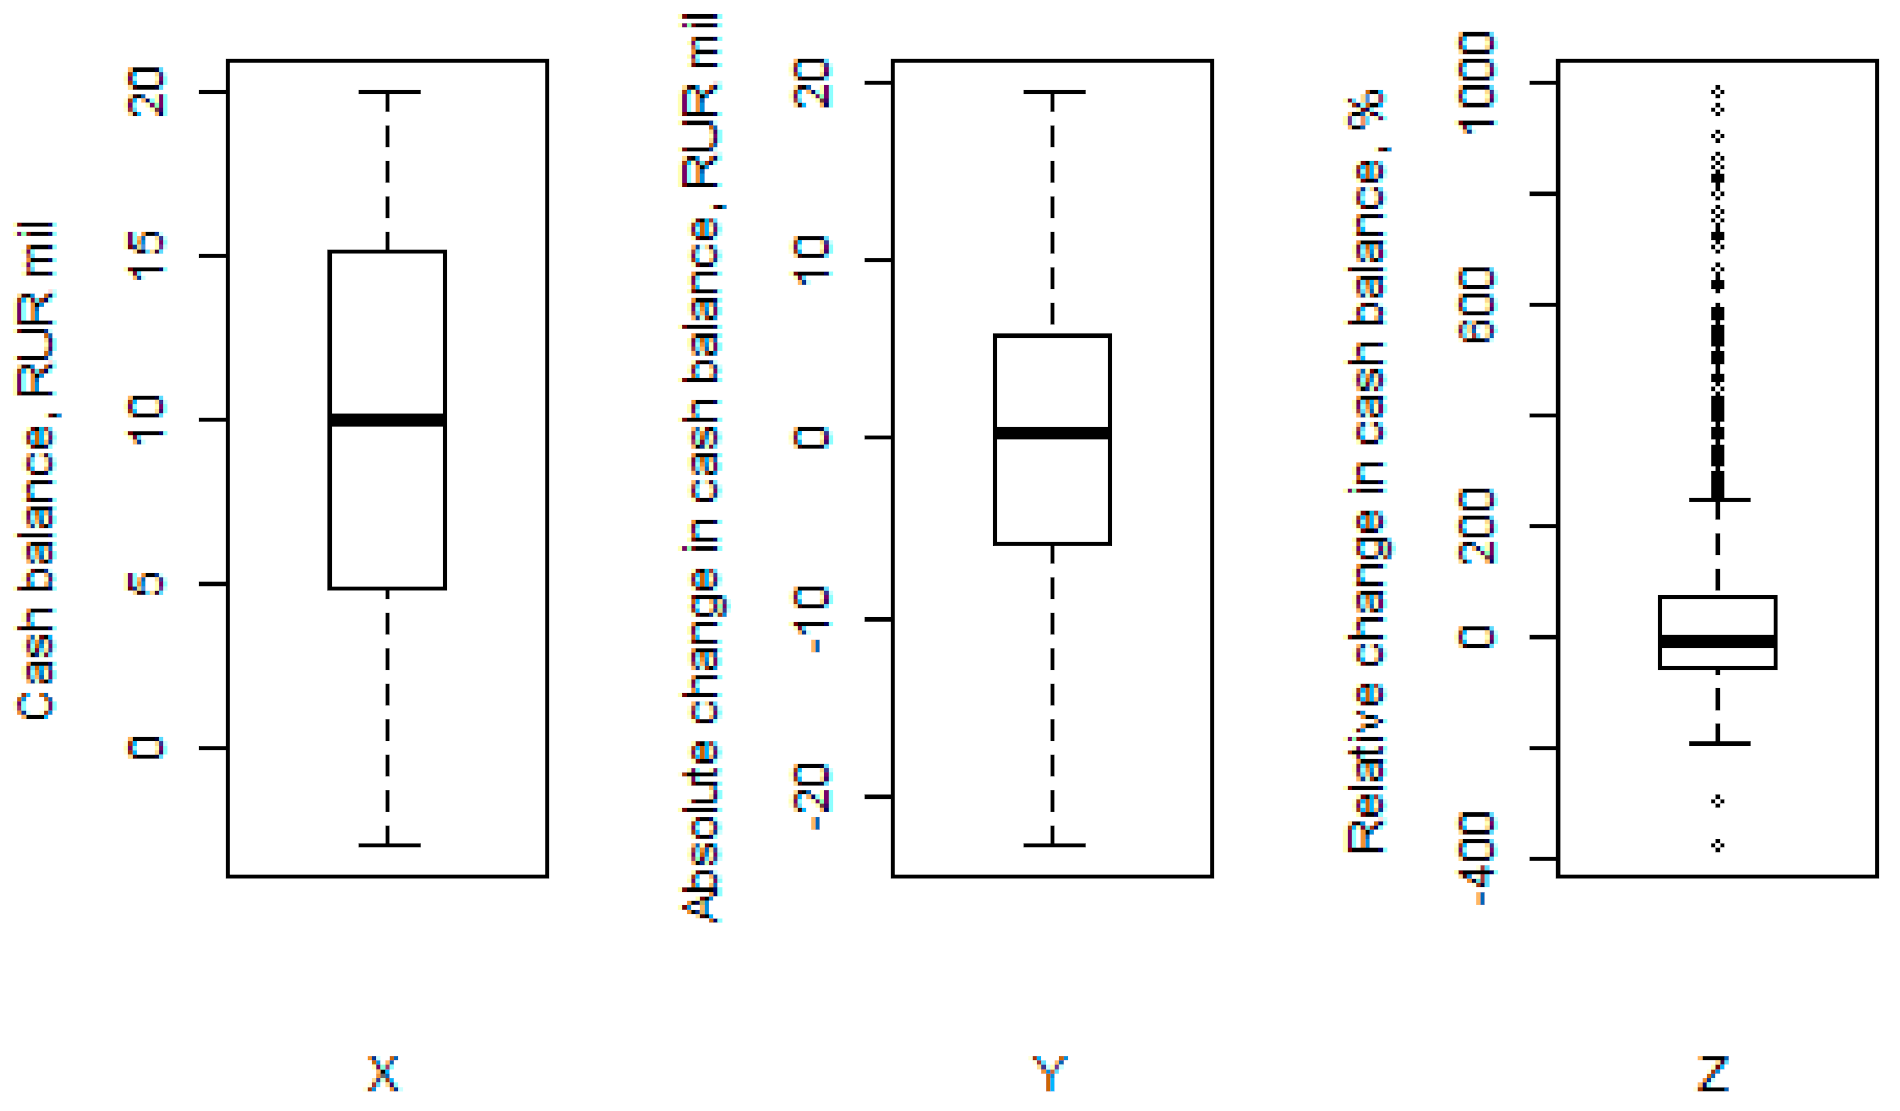
The box-plots for the variables are shown in
Figure 1.
As shown in the descriptive statistics and the box-plot, observations of random variables Xt and Yt are close to symmetric, while the distribution of Zt has a strong right skeweness. In other words, the major number of observations is concentrated in the interval [−200; 300], but the small number of observations go far beyond 300.
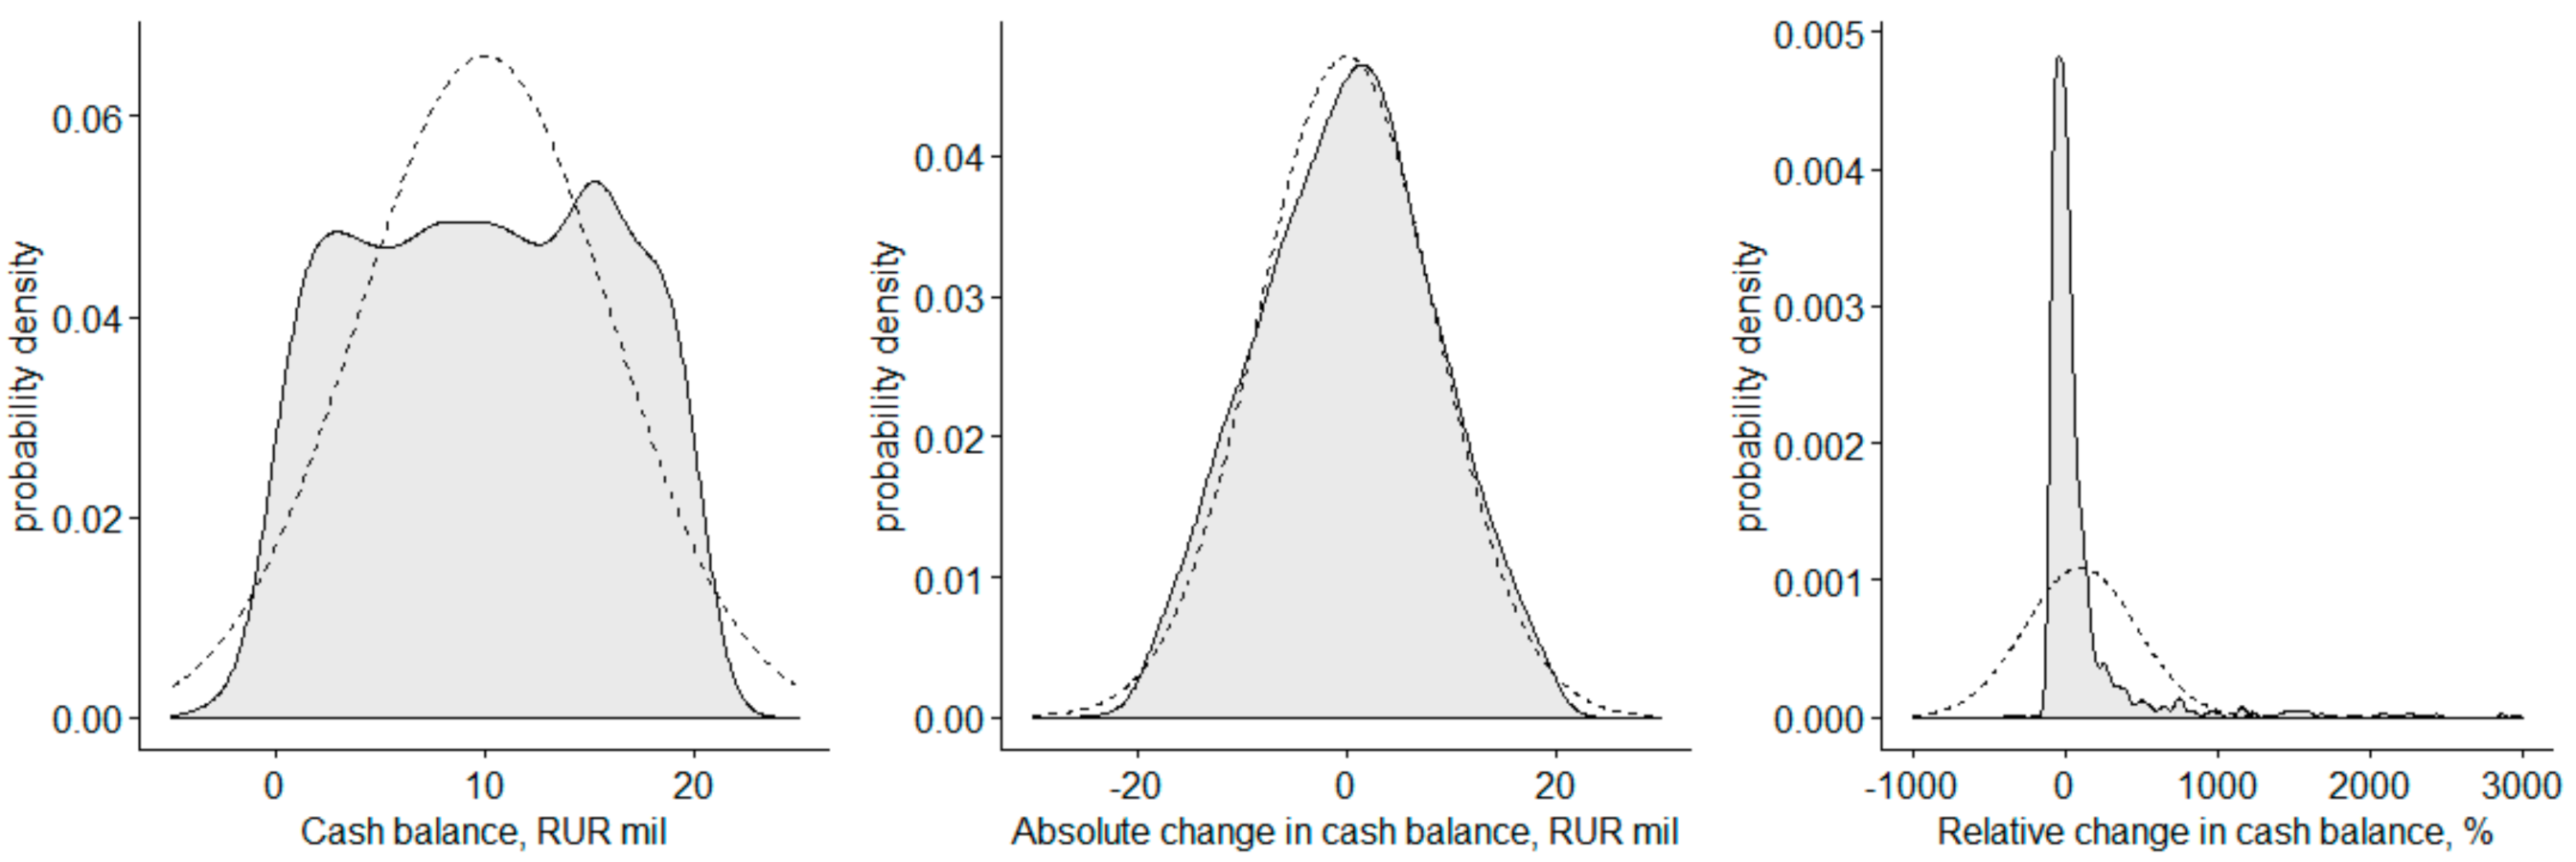
Figure 2 shows graphs of the empirical distribution of the analyzed variables (gray areas) together with the plots of the normal distribution density with the mean and standard deviation taken from the
Table 1 (dashed lines).
As shown in the
Figure 2, the empirical distribution of random variable
Yt is close to normal, while the two remaining variables are far from the normal distribution.
The formal test that the observed values come from the normal distribution is, for example, the Shapiro-Wilk test [
25]. The null hypothesis of this test is that the data sample comes from the normal distribution.
Table 3 shows the values of the W statistic W and the
p-values for the variables of interest.
The formal test for all variables suggests that their distributions are not normal, even though the empirical distribution for
Yt in the
Figure 2 looks identical.
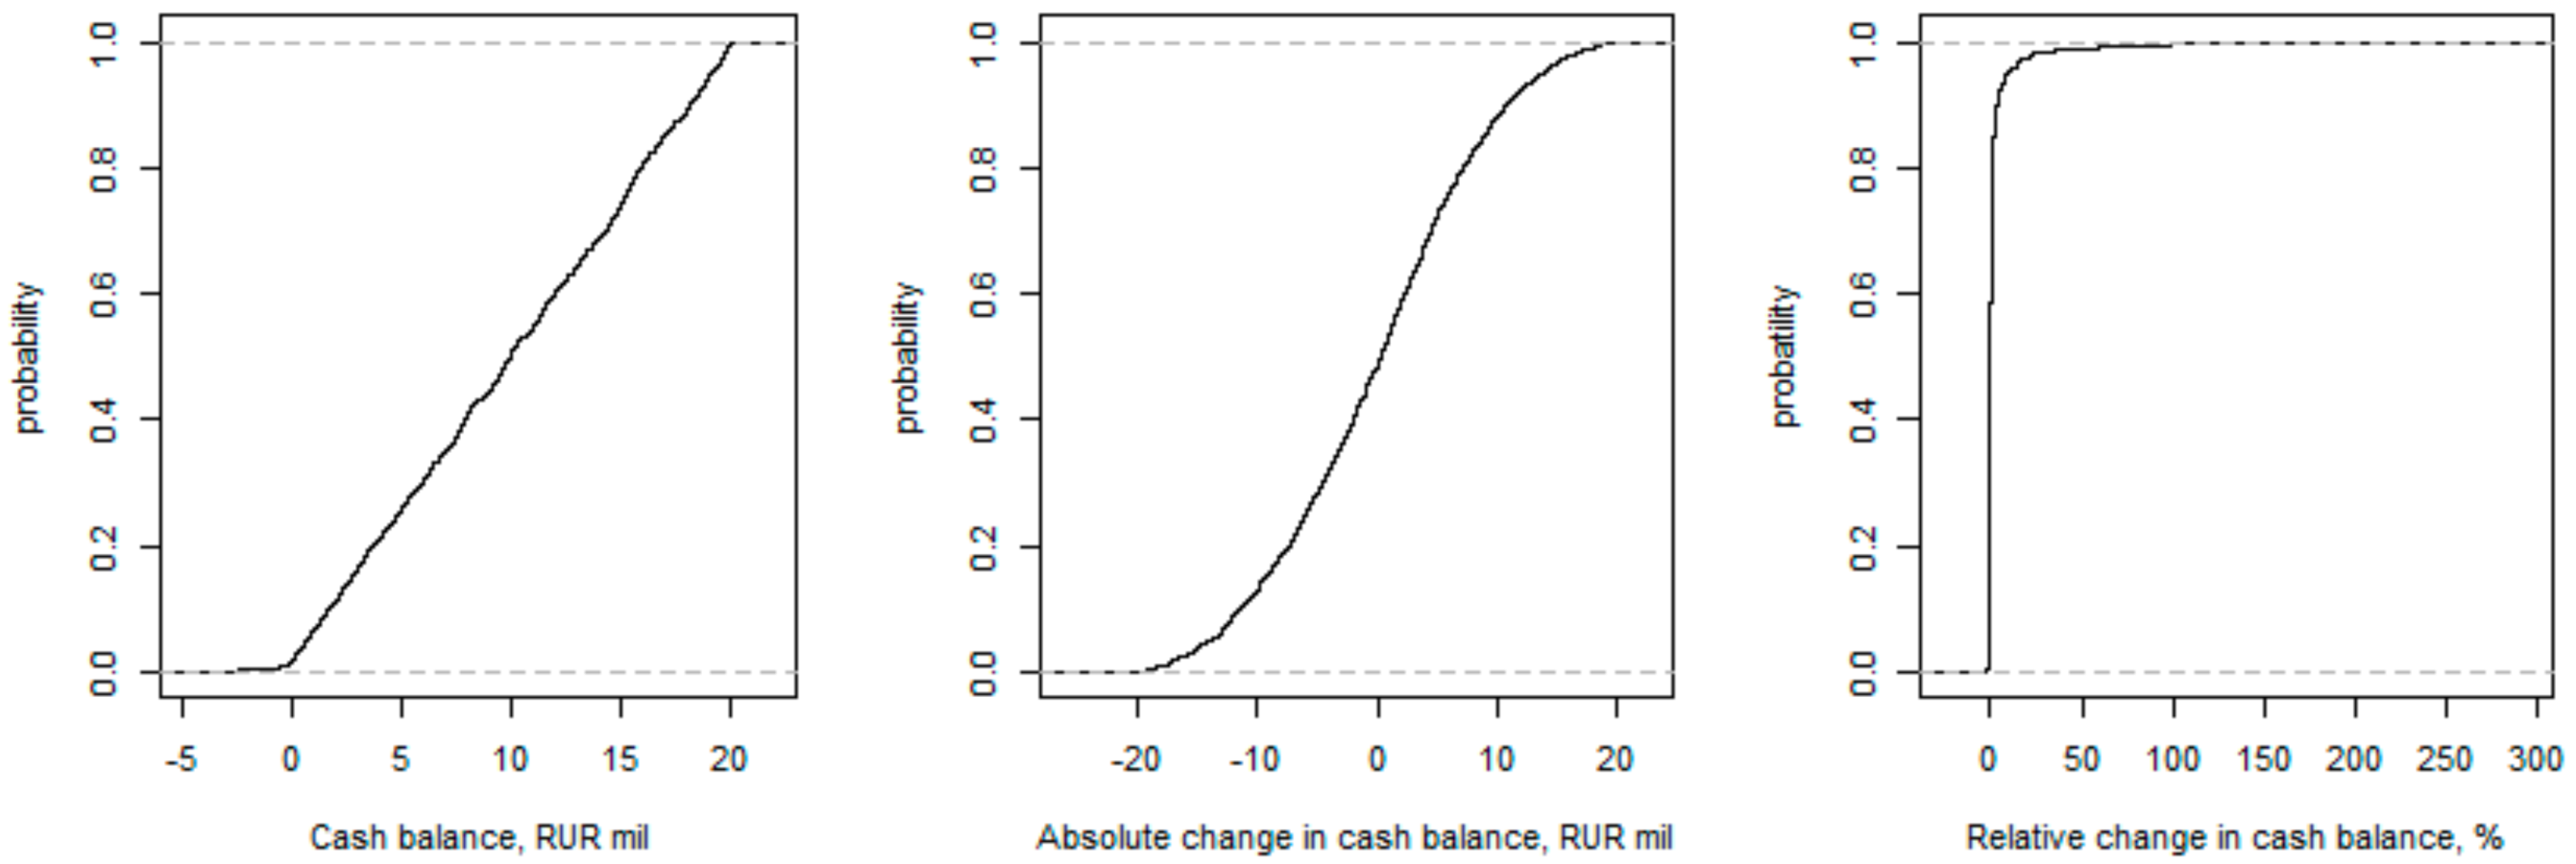
When it is not possible to apply the theoretical probability distribution, it is advised to calculate the probability of a cash deficit based on the empirical cumulative distribution function. In order to do this, all observations of the variable are sorted in the ascending order and each observation is considered to be equally probable. Then, the cumulative distribution function is constructed as the probability that the random variable does not exceed a given value.
Figure 3 presents graphs of the empirical cumulative distribution functions for the random variables of interest.
To find on the account balance, the one needs to find the related point on the left graph, i.e., for , which is . Similarly, we find .
As for the use of the random value of the absolute change of balance Yt to predict a cash deficit, it is obvious that here, the probability will always change and it depends on the value of . So, for example, if the cash balance at the end of the previous day was rubles, then , and in the case of . Thus, considering a change in the cash balance on the account is more flexible to determine the probability of a cash deficit.
In order to show that the use of a normal distribution can lead to the significant error in the cash default probability estimation, we calculate the same probabilities using the normal distribution function: , , and . Thus, for random variables Xt and Zt, the normal distribution significantly overestimates the predicted default probability, while for a variable Yt, the probability is slightly underestimated.
We tested this technique using another set of empirical data. Enterprises A and B have comparable values of indicators. The total sample size is also 1485 observations. The minimum cash balance at the cash desk amounts to 87,420 rubles, and the maximum 19,900,171 rubles. The average sample value is 10,016,890 rubles, with a standard deviation of 3,589,046 rubles. That is, at approximately the same level of meaning, there is a much smaller standard deviation. At the same time, it is obvious that the median value is very close to the average. The distribution by percentiles also allows us to put forward a null hypothesis about the normal distribution of the available data. The percentile distribution is shown in
Figure 4.
In this example, for Xt = 0, the integral probability that the cash balance is less than 0 is 0.002628.
We compared this value with empirical data (i.e., information on the number of times during the period under review that the organization experienced insufficient funds for payment, which led to adjustments in payment terms). So, in the analyzed period, the organization faced problems of compliance with the payment schedule on five occasions, which represents 0.003367 of the total number of observations. As we can see, the error in prediction with a normally distributed value for the cash balance is small.
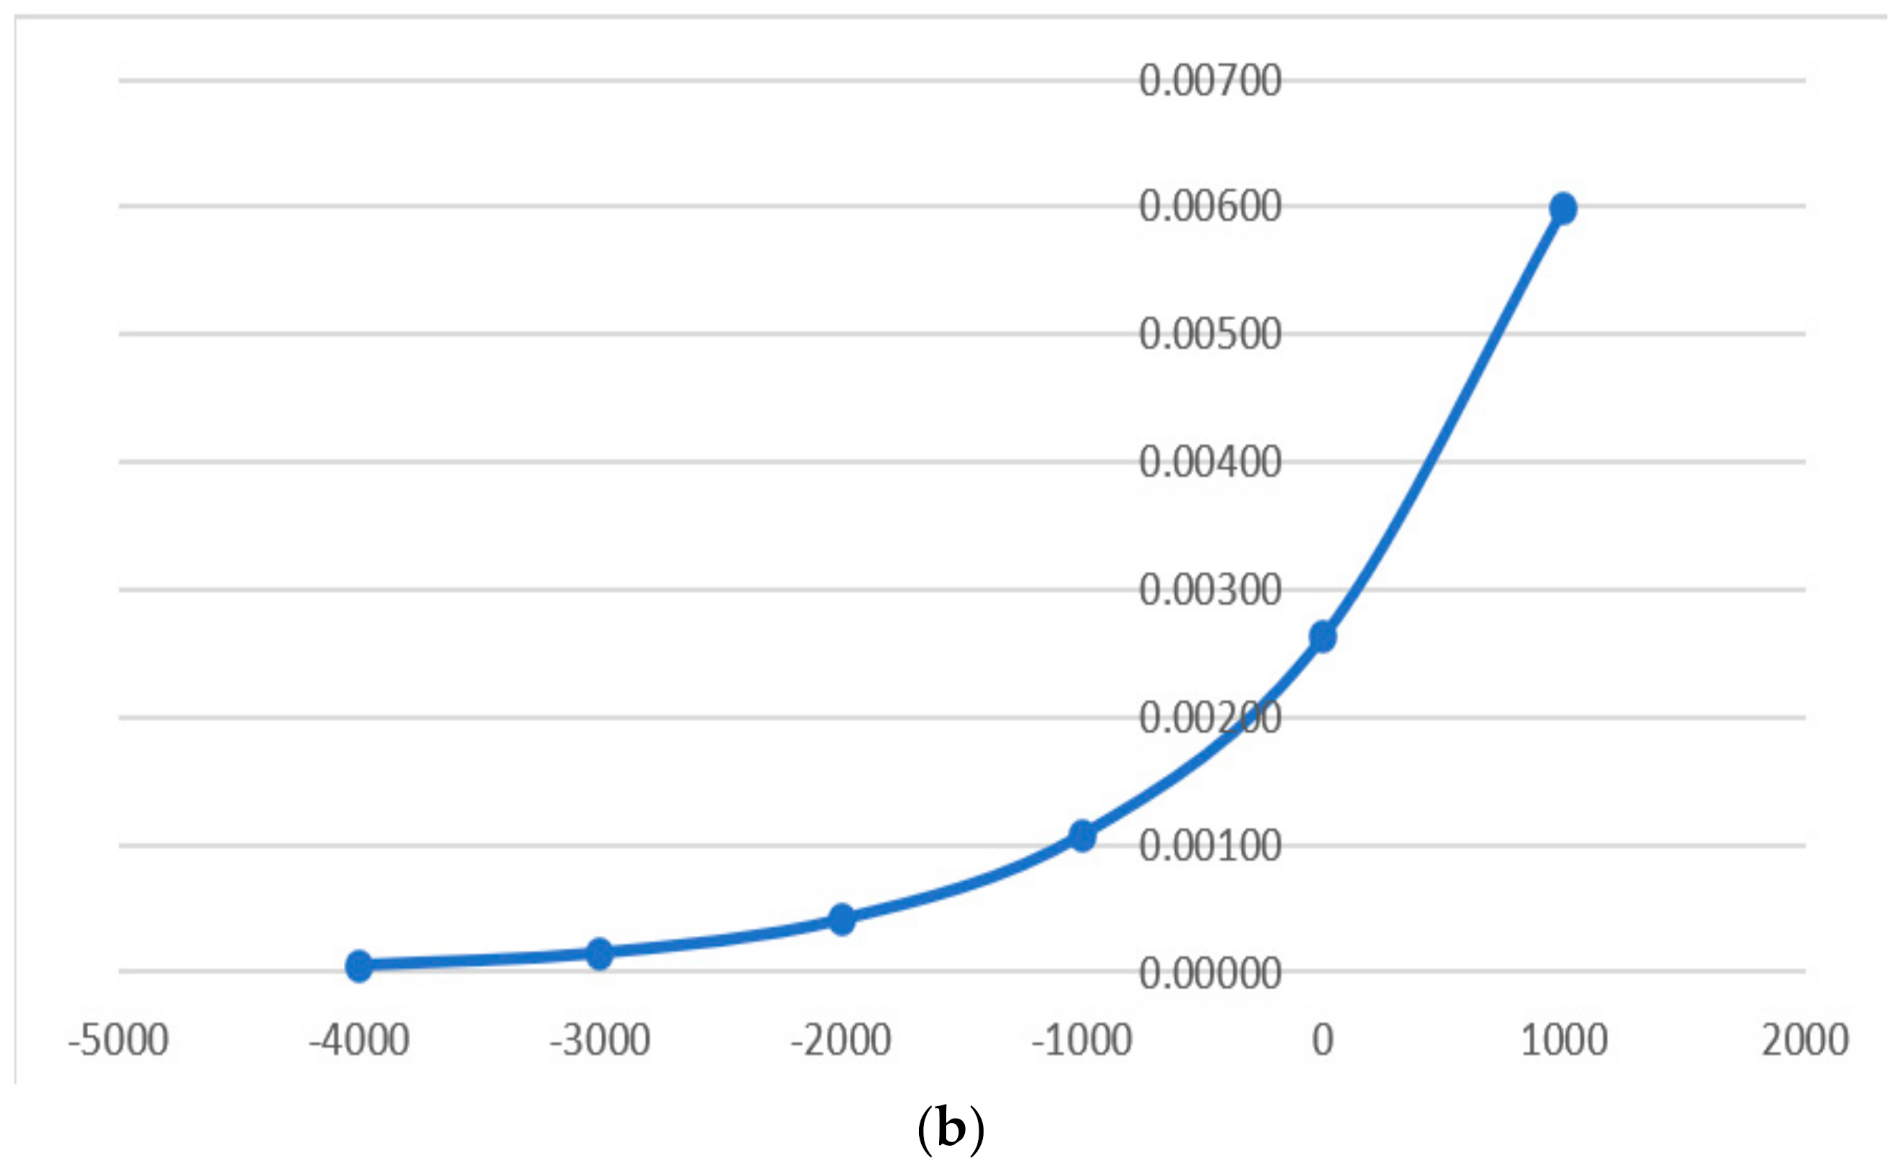
A graph of the distribution function in general form and on an enlarged scale for the value of interest is shown in
Figure 5a,b.
4. Discussion
The distinctiveness of the proposed approach for the implementation of economic calculations is that the value by which the integral function of probability distribution is determined can be anything, and accordingly, the proposed algorithm can be used to solve other problems. For example, an organization can estimate the likelihood that it will need to use funds set aside in a settlement account. Suppose that if the specified amount of the reserve is 1,000,000 rubles, then the probability of the need to use this reserve is 0.005997.
Obviously, the amount of the cash balance will not always be a normally distributed value. Moreover, we believe that the question of whether the balance of funds can be considered a random value is statically debatable.
First of all, anticipating the questions of financial analysis theorists, we would like to note that the use of the author’s approach is possible only at the level of internal financial analysis. External users will simply not have enough information to conduct such assessments. In this regard, the study by De Bruine M. devoted to the analysis of the use by external auditors of the internal auditor in conducting financial audits was very interesting. [
26]
Agreeing with the authors’ opinion that the involvement of an internal auditor can improve the quality of external audit, we note that the issue of providing such assistance will be decided by the organization itself. External users’ access to internal financial information is limited by the amount of information presented in financial statements, since financial and management accounting are typically separate. The expansion of these boundaries is possible only with the consent of the organization itself. Therefore, the use of the authors’ scheme is possible only for internal analyses. The author’s methodology does not supersede the above-described scoring approaches to evaluation, i.e., approaches based on the use of financial coefficients; rather, we are only expanding the boundaries of such analyses through the use of additional internal information.
We also certainly found the methods proposed by Pietrucha and Maciejewski for the precautionary demand for cash and perceived risk of electronic payments to be very interesting. [
27] However, we note that with regard to the research topic, the development of an electronic payment system will not have a significant impact on the formation of a cash deficit, and should not lead to an increase in demand for money from the organization. This opinion is based on the fact that the use of electronic payments reduces the time of settlement, as well as various risks associated with settlements, but does not eliminate the need to make a corresponding payment. Rather, the issue of the impact of changes in the content of commercial contracts on the risk of a cash deficit should be considered here. In particular, it is obvious that in modern instances of short-term cash deficits, it is advisable to have, through contracts with partners, the ability to achieve minimum payment delays, thereby ensuring the flexibility of the payment calendar with minimal financial losses incurred by the various parties.
We fully agree with the proposition of Zeynalli E.J, i.e., that in order to make the right decisions regarding the financial management of an enterprise, it is necessary to approach different events and processes separately, evaluate the factors affecting them and interpret the results correctly. [
28]
Therefore, in order to obtain a high-quality assessment by a financial manager, all available tools and methods should be used. The method proposed by the authors should not be considered as the only possible one, but should nonetheless be understood as a viable option.
However, let us emphasize once again that we seek only to demonstrate the possibility of using mathematical methods for the purpose of predicting cash deficits. If the related value is distributed according to another law, then this will lead to the use of another probability density function, but the essence of the method will remain the same.
Further research of this topic could be aimed at developing a model for estimating the probability of a cash deficit in the condition of an abnormal distribution, e.g., a uniform distribution or other. It is obvious that empirical data will obey the normal distribution law, and therefore, that additional research of such cases would be possible and worthwhile.
Another question for further research is why the distribution of the cash balance turned out to be abnormal. In our opinion, the following hypothesis can be put forward. The distribution was abnormal because the initial data were not represented by random values of variables, but rather, by controlled (dependent) variables. That is, organizations manage their cash flows using cash flow models such as the Baumol-Tobin or Miller-Orr models. Theoretically, this is possible, but it is worth noting that cash flow is determined by the incoming and outcoming flows, and if the outcoming one is manageable, then the organization cannot manage the incoming one.
For a more accurate answer, we consider it necessary to increase the sample size for the study in terms of the number of organizations whose data are being studied. It is possible that the distribution of other economic entities will be close to normal.
5. Conclusions
In summary, the proposed approach can be used to make calculations by economists with a minimal level of mathematical training. All calculations performed are easily algorithmicized using various software products including Microsoft Excel. The usefulness in financial planning is obvious. This approach makes it possible to assess the likelihood of an extremely negative situation for the organization—a cash deficit. In fact, this is a tool for assessing and managing financial risk—the risk of insolvency. However, it must be taken into account that the distribution of magnitude may be far from normal in actual economic practice.
For example, from the analysis of empirical data on organization A, it seems that the most efficient way for an enterprise to calculate the probability of a cash deficit is to use the absolute change in the balance of the account as a random factor, since, on the one hand, its empirical distribution is closest to normal, and, on the other hand, the calculation of the belief was more adaptive, as it depended on the cash balance at the end of the previous day.
However, regardless of the specific data, the general logic of the method remains unchanged, i.e., the use of empirical data to determine the probability of a cash deficit under any distribution of a given value. We believe that the introduction of an appropriate approach to the practice of financial management will significantly increase the validity of financial decisions and minimize the risk of crisis situations.


