Abstract
The COVID-19 pandemic caused a boom in demand for personal protective equipment, or so-called “COVID-19 goods”, around the world. We investigate three key sectoral global value chain networks, namely, “chemicals”, “rubber and plastics”, and “textiles”, involved in the production of these goods. First, we identify the countries that export a higher value added share than import, resulting in a “value added surplus”. Then, we assess their value added flow diversification using entropy. Finally, we analyze their egonets in order to identify their key affiliates. The relevant networks were constructed from the World Input-Output Database. The empirical results reveal that the USA had the highest surplus in “chemicals”, Japan in “rubber and plastics”, and China in “textiles”. Concerning value added flows, the USA was highly diversified in “chemicals”, Germany in “rubber and plastics”, and Italy in “textiles”. From the analysis of egonets, we found that the USA was the key supplier in all sectoral networks under consideration. Our work provides meaningful conclusions about trade outperformance due to the fact of surplus, trade flow robustness due to the fact of diversification, and trade partnerships due to the egonets analysis.
1. Introduction
COVID-19 has led to an unprecedented global health crisis [1]. Most countries seek to obtain personal protective equipment (PPE) or “COVID-19 goods” and, in turn, manufacturers seek to obtain relevant raw materials or “COVID-19 materials” [2]. This has caused a boom in demand for PPE around the world [3,4,5,6]. PPE includes surgical masks, P2/N95 respirators, gloves, goggles, glasses, face shields, gowns, and aprons [7]. The basic raw materials involved in the production of PPE are “chemicals”, “rubber and plastics”, and “textiles” [8]. The high demand for these materials has resulted in uncertainty about their future availability. At the same time, lockdowns impose trade limitations on the interconnectedness among countries [9]. These limitations reduce the connectivity of the corresponding sectoral global value chain (GVC) networks, or “COVID-19 GVC nets”. Although countries with higher exports than imports—“high surplus countries”—play a key role, we must examine how robust their role is in COVID-19 GVC nets. Countries with high trade diversification are more robust than countries with low trade diversification, as they can absorb disruptive changes more effectively. Moreover, we need to identify the key affiliates of high surplus countries for two reasons: (a) policymakers should know the countries that contribute to surplus creation of the outperforming countries, as they could be alternative partners with the other countries that seek to obtain COVID-19 materials; (b) unstable affiliations may undermine the outperforming countries. As the supply–use of COVID-19 materials is a critical issue, decisions cannot be trustworthy unless we can address the following questions concerning the COVID-19 GVC nets:
Question 1: Which are the high surplus countries (exports are higher than imports)?
Question 2: What is the trade diversification of the high surplus countries?
Question 3: Who are the trade affiliates of the high surplus countries?
The answers to these questions are valuable to policymakers for their decisions on COVID-19 materials supplies management. For example, the answer to Questions 1 and 3 supports (a) the selection of key participants in COVID-19 materials supply agreements and (b) the identification of the most appropriate countries in order to establish a factory producing COVID-19 goods or a logistic center. The answer to Question 2 allows a further selection criterion for suppliers, namely, their robustness due to the fact of diversification. Network analysis is the natural tool for addressing global trade issues. The GVCs describe the value added of all activities that are directly and indirectly involved in the production of final products [10]. The value chain concept has a long history [11,12,13,14,15,16,17,18,19]. Special interest is concentrated in the theoretical framework for explaining governance patterns in GVCs [20,21,22,23,24,25,26,27,28,29]. Network analysis of GVC networks has highlighted their structure, evolution, connectivity, and countries’ participation [30,31,32,33,34,35,36,37,38,39]. COVID-19’s impact on global value chains was recently assessed [3,40,41,42,43,44,45].
The goal of this work was to address the above three questions. Network analysis is necessary for the study of the first and third questions. However, in order to address the second question of diversification, network analysis should be combined with entropy. We used data provided by World Input-Output Database (WIOD), which included 44 countries and 54 sectors. The data and methodology are presented in Section 2. We constructed three COVID-19 GVC nets (“chemicals”, “rubber and plastics”, and “textiles”) for the period 2000–2014 (3 × 15 = 45 networks in total). The sectoral network construction is presented in Section 3. We introduce a new method of examining the trade balance [46], adapted to network analysis, through the difference of weighted in-degree from weighted out-degree of each country’s value added flows. If a country has a weighted out-degree higher than the weighted in-degree, then it has a surplus of value added share in a specific sectoral GVC network, otherwise it has a deficit. We address the issue of diversification of GVC networks in the light of previous results [47,48]. We compute the in- and out-weight entropies as the natural tool for the analysis of diversification of value added flows among countries in GVC networks. Relevant concepts from network theory are presented in Section 4. The empirical findings of the network analysis and discussion are presented in Section 5, where two technical novelties are introduced, namely, (a) the value added trade balance indicator (3), which reveals if a country has a surplus or a deficit of the value added share, (b) the degree entropies, which indicate how diversified trade flows have a country and, therefore, if it is directly accessible from other countries. These technical novelties allow us to go beyond the analysis of the participation of each country in GVCs as an importer through degree-in and as an exporter through degree-out [31,32,33,34,35,36,37]. High entropy signifies countries with input/output value added share distributed to many partners, while low entropy indicates countries specialized their share in a few partners [49,50]. We visualize the affiliates sub-networks of the countries with the highest surplus in the sectoral GVC networks under examination in order to determine their best suppliers and clients of value added. Our conclusions are summarized in Section 6.
2. Data and Methodology
Our research was based on the last release of World Input-Output Database, commonly used for GVC studies [10,30,31,32,47,48,51,52,53]. The advantages of this database and its differences with similar databases can be found in [52]. WIOD provides World Input–Output Tables for the period from 2000 to 2014, including 43 countries and an extra area, called ROW (rest of world) for the non-negligible remaining part of the world economy (estimated to be less than 15% of world gross domestic product in 2008 [52,54]), and their gross trade flows for 54 sectors. In our work, we included ROW (as a country-node) due to the fact that its relatively large size cannot be ignored in an analysis of global trade.
To compute the value added flows among 44 countries for the three sectoral GVC networks under examination, we employed Leontief’s decomposition technique which is broadly accepted [48,52,54,55,56,57,58]. The World Input-Output Database provides the intermediate goods required for producing the output in a given sector, the consumption for each sector, and country, and the value added to gross output ratios in all sectors in all countries. We denote by B the matrix with intermediate input coefficients, by C the vector of consumption for each sector and country, by F the diagonal matrix of value added to gross output ratios, and by I the identity matrix. The “Leontief Inverse” is the gross output produced at every step of the production process of one unit of consumption either domestic or foreign. The sectoral output level matrix is . The value added exports from all sectors involved in the production of C outside the country, are assessed by the matrix . If the “Leontief Inverse” exists, then it is represented as a power series: . The conditions for the existence of the “Leontief Inverse” and the input–output physics behind it are well known and described in detail in textbooks [59,60].
We denote by and , the matrix elements of the matrix VA, representing the value added exports from country (from supply sector μ) to country (for examined sector ν). Therefore, the value added exports of country (from all supply sectors) to country for sector ν is:
3. Construction of Sectoral GVC Networks
We constructed weighted directed networks with nodes from the countries and edges of the value added flows. We constructed 45 directed weighted GVC networks (one for each of the three sectors for the available 15 years, 3 × 15 = 45). Each network consisted of 44 nodes (i.e., countries), and the weights were constructed from the value added exports , using the formula:
The denotes the share of value added exports from country i to country j divided by the sum of all transactions among countries (global value added flows), following previous related work [47,48]. As we are interested only in the foreign component of the countries, we excluded domestic components and worked on the weight matrix with zero diagonal elements: = 0.
We selected Formula (2) from the input–output analysis [61]. This analysis is adopted by the OECD for the GVC multi-region input-output tables [34]. An illustrative example of a sectoral GVC network is shown in Figure 1.
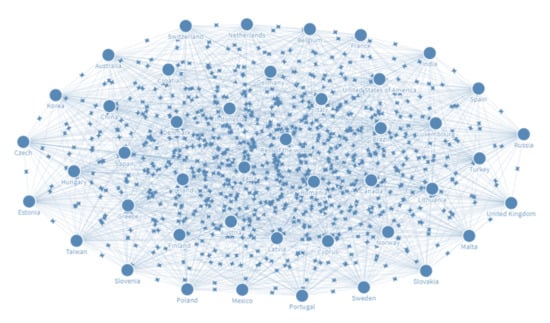
Figure 1.
Sectoral GVC network. Each country (node) imports/exports the same share (identical weights) from/to all other countries.
4. Concepts from Network Theory
We present the relevant definitions used to address the three questions posed in Section 1. The degrees (definition 1) and value added trade balance (definition 2) are used to address question 1 (high surplus countries) and question 3 (trade affiliates). Question 2 (diversification) is naturally addressed by entropy (definition 3).
Definition 1.
(Weighted In- and Out-Degree).
For each sector and each country i = 1, 2, …, 44, the total of the shares of the flows to country i is the weighted in-degree, , and the total of the shares of the flows from the country i is the weighted out-degree, [62]. The weighted degrees indicate the relative position of country i in the sectoral GVC network, as they have been computed for the value added shares over the global transactions of sector v.
Definition 2.
(Value-Added Trade Balance).
The trade balance is the difference between gross exports and gross imports over a certain time period [46]. A country has a trade surplus when exports are of greater value than imports, while it has a trade deficit when imports are of greater value than exports. In an interconnected global economy with increasingly complicated supply chains, conventional trade statistics are not sufficient, while value added trade offers a more precise view of global trade [63]. In this direction, we used value added flows in the computation of the balance of trade. For each sector and each country i, we measured the value added trade balance as the difference balance weighted out-degree and weighted in-degree.
The country i with a value added trade surplus, exports a higher value added share than imports. Otherwise, country i presents a value added trade deficit, .
Definition 3.
(In- and Out-Weight Entropy).
The entropy of a variable is the average information obtained from the measurement of the possible values of the variable. Therefore, entropy is a measure of the lack of information before more accurate measurements are made. The Boltzmann, Planck, and Gibbs’ entropy of statistical physics is [64,65]: . We shall use Shannon’s entropy, representing the minimal average length of binary coding [66,67]:
In order to compare different entropies, the normalized entropy is computed, taking values in the interval . Entropy is a measure of the diversity of the values of the variables. High entropy indicates that most values are more or else equally probable, while low entropy indicates that few values are highly probable and dominate, as the other values have a rather low probability.
For each sector and each country i = 1, 2, …, 44, Shannon entropy is a natural estimator of the diversification of the flows of a country i from/to others. If a country i has equal in-flows from all other countries, the in-entropy has its maximum value . At the other extreme, if the in-flows from its suppliers are restricted to imports from one country, the in-entropy reaches the minimum value (zero). If the out-flows from a country i to all other countries are equal, the out-entropy takes its maximum value . On the other extreme, if the out-flows from a country to the other countries are restricted to exports to only one country, the out-entropy reaches the minimum value (zero).
The in-weight entropy of node is:
where
is the distribution of the incoming weights of node for each sector .
The out-weight entropy of node is:
where
is the distribution of the outgoing weights of node for each sector .
The normalized entropies are:
For each country , we capture the normalized in-entropy and out-entropy 54-dimensional vectors:
Countries with diversified import sources and value flows have high normalized in-entropy, while countries with diversified destinations and value flows have high normalized out-entropy.
5. Empirical Results and Discussion
We address the three questions, posed in Section 1 by estimating the relevant concepts presented in the previous section.
5.1. The High Surplus Countries in the COVID-19 GVC Nets (Question 1)
We used the value added trade balance in sectoral GVC networks, involved in the production of COVID-19 materials in order to identify the high surplus countries. High surplus countries are outperforming and, therefore, they are expected to meet the growing demand of COVID-19 materials in world trade.
The results of the weighted in-degree, weighted out-degree, and value added trade balance for the three selected sectoral GVC networks (“chemicals”, “rubber and plastics”, and “textiles”) are presented in Figure 2, Figure 3 and Figure 4.
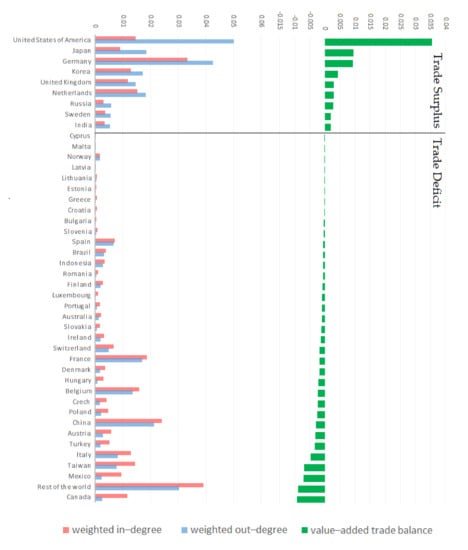
Figure 2.
Sectoral GVC network: “Manufacture of chemicals and chemical products”.
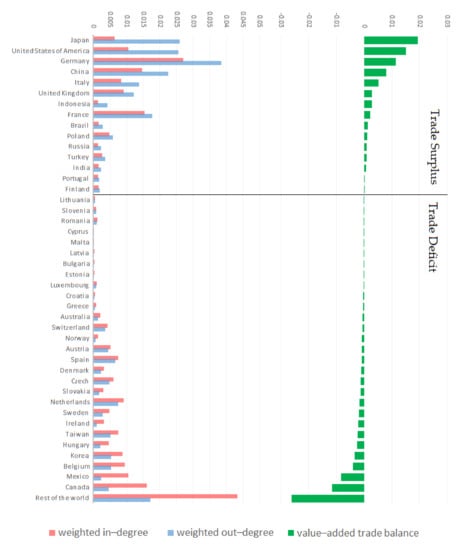
Figure 3.
Sectoral GVC network: “Manufacture of rubber and plastic products”.
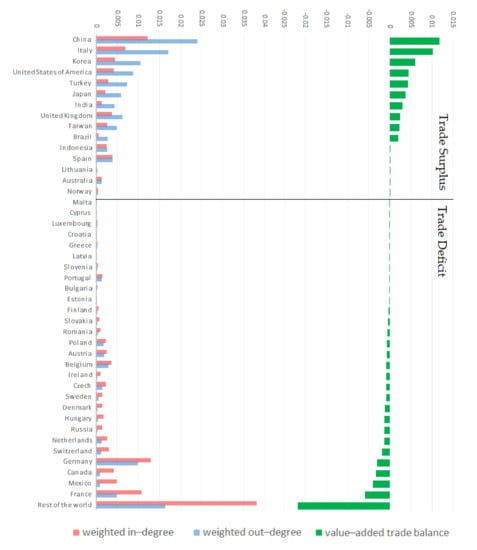
Figure 4.
Sectoral GVC network: “Manufacture of textiles, wearing apparel, and leather products”.
The vertical axis lists the countries (nodes), sorted from the largest to smallest value added trade balance. The red bars represent the weighted in-degree of each country, and the blue bars represent the weighted out-degree of each country. The green bars represent the value added trade balance of each country. The value added trade balance () appears as the difference between the blue bar and the red bar.
Remark 1.
“Uncle Sam” wins “the war of chemicals”.
We can observe (Figure 2) that the USA, Japan, Germany, Korea, UK, Netherlands, Russia, Sweden, and India are the high surplus countries in the COVID-19 GVC net: “Manufacture of chemicals and chemical products”. All other examined countries exhibited a deficit in value added trade balance. The performance of the USA stands out, while economies such as China, France, Italy, Belgium, and rest of the world have a balance close to zero, although they have high participation (high in-degree and out-degree) in the global trade of chemicals.
Remark 2.
Domestic disasters do not hinder Japan’s supremacy in “rubber and plastics”.
We can observe (Figure 3) that Japan, the USA, Germany, China, Italy, UK, Indonesia, France, Brazil, Poland, Russia, Turkey, India, Portugal, and Finland were the high surplus countries in the COVID-19 GVC net: “Manufacture of rubber and plastic products”. All other examined countries exhibited a deficit in VATB. Japan was a leader in rubber and plastic products, overcoming various domestic disasters (earthquake, tsunami, nuclear alert, and power shortages) that appeared during the examination period. Large economies (USA, Germany, and China) followed Japan, while the rest of the world exhibited the highest deficit.
Remark 3.
The textiles “Made in China” beat the textiles “Made in Italy”.
We can observe (Figure 4) that China, Italy, Korea, the USA, Turkey, Japan, India, UK, Taiwan, Brazil, Indonesia, Spain, Lithuania, and Australia were the high surplus countries in the COVID-19 GVC net: “Manufacture of textiles, wearing apparel, and leather products”. All other examined countries exhibited a deficit in VATB. China’s low production costs seems to have defeated Italy’s heritage in “textiles”. France and the rest of the world had the largest deficits, although they had high participation (high in-degree and out-degree) in the global trade of textiles.
5.2. Diversification of the High Surplus Countries (Question 2)
Entropy is a natural estimator of trade diversification. A country with high entropy imports/exports from/to many partners, while a country with low entropy trades with only a few partners [49,50]. Figure 5, Figure 6 and Figure 7 present the results of the in-weight entropy (red column) and the out-weight entropy (blue column) for the high surplus countries for the three selected sectoral GVC networks (i.e., “chemicals”, “rubber and plastics”, and “textiles”). The countries are sorted by entropy values from largest to smallest. We added also the average of all countries in the network as a reference indicator.
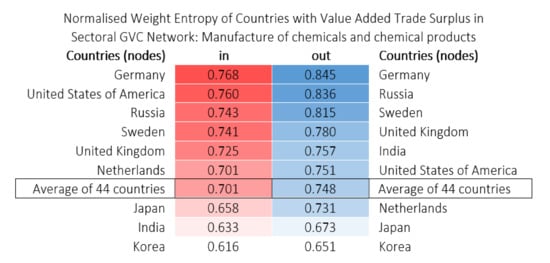
Figure 5.
Sectoral GVC network: “Manufacture of chemicals and chemical products”. Normalized in- and out-weight entropy average (2000–2014) of countries with a value added trade surplus.
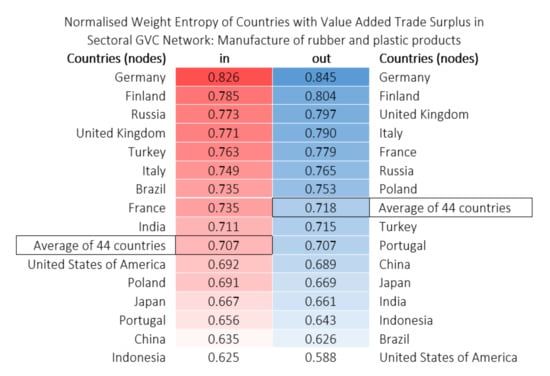
Figure 6.
Sectoral GVC network: “Manufacture of rubber and plastic products”. Normalized in- and out-weight entropy average (2000–2014) of countries with a value added trade surplus.
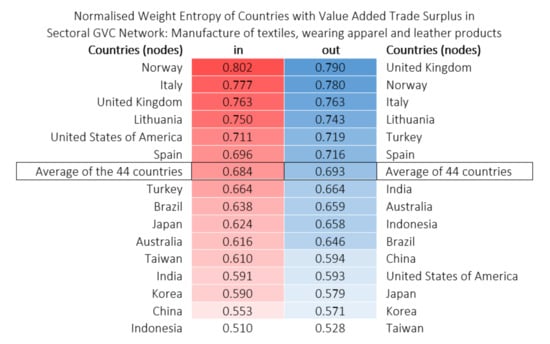
Figure 7.
Sectoral GVC network: “Manufacture of textiles, wearing apparel, and leather products”. Normalized in- and out-weight entropy average (2000–2014) of countries with value added trade surplus.
Remark 4.
Countries with a high surplus in chemicals were highly diversified.
Manufacture of chemicals and chemical products was the GVC net with the fewest countries with a surplus of value added share (Figure 2). However, most of them present high (above average) import and export diversification (Figure 5). Germany and the USA had a high value added trade surplus and high in- and out-weight entropy. This indicates that Germany and the USA traded uniformly with other countries in the network. Japan and Korea had a high value added trade surplus but low (below average) in- and out-weight entropy. We can therefore infer that Japan and Korea owe their success to a few partnerships.
Remark 5.
Outperforming EU countries in rubber and plastics were also diversified.
In the GVC net “Manufacture of rubber and plastic products”, the EU counties, namely, Germany, Italy, UK, France, and Finland, had a value added trade surplus and were uniformly globalized (highly diversified). Although, the USA, China, and Japan also had a high surplus, they were highly selective (low in- and out-weight entropy).
Remark 6.
Surplus in textiles was not related with diversification policy.
5.3. The Affiliate Network of the High Surplus Countries (Question 3)
In order to identify the key affiliates (suppliers and clients) of the high surplus countries, we present the egonets (neighborhoods) of the top three high surplus countries for each sector (“chemicals”, “rubber and plastics”, and “textiles” (Figure 8, Figure 9 and Figure 10)). The edges represent the average (2000–2014) imports (in-weights) and exports (out-weights) of each country from/to the other 43 countries. The in-egonet is represented by the red links, and out-egonet is represented by the blue links.
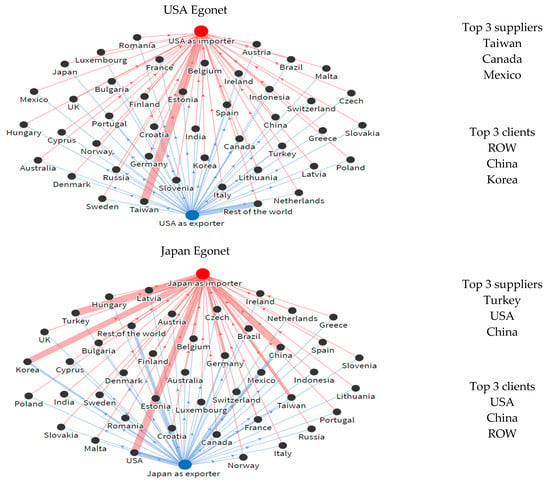
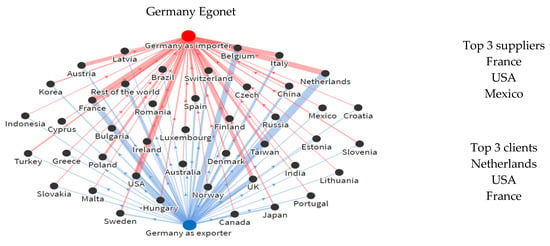
Figure 8.
The egonets of USA, Japan, and Germany in the Sectoral GVC network: “Manufacture of chemicals and chemical products”.
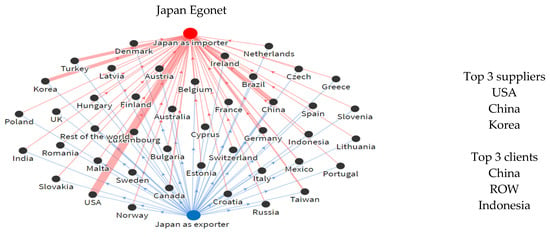
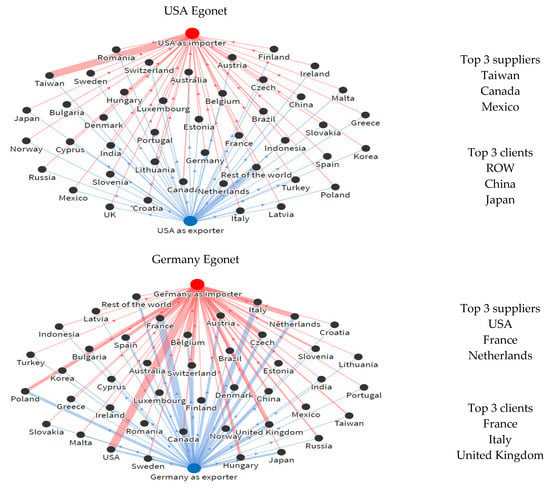
Figure 9.
The egonets of Japan, the USA, and Germany in the Sectoral GVC network: “Manufacture of rubber and plastic products”.
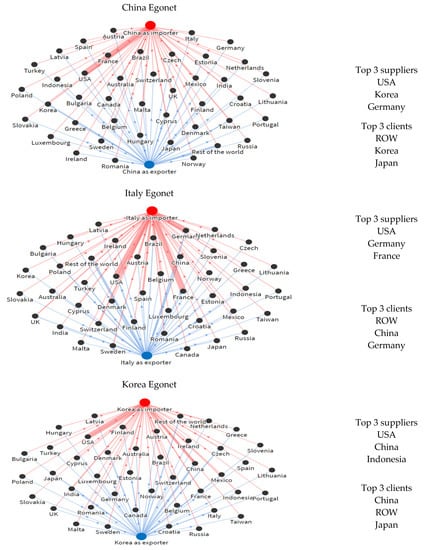
Figure 10.
The egonets of China, Italy, and Korea in the Sectoral GVC network: “Manufacture of textiles, wearing apparel, and leather products”.
Remark 7.
USA had the highest influence in the chemical sector.
The USA had the highest surplus in chemicals (Figure 2) and, at the same time, was one of the best trade affiliates of the second and third countries (i.e., Japan and Germany) with a high surplus (Figure 8). Τhis reveals the significant influence of the USA in this market. Moreover, the USA imported mainly from Taiwan and exported mainly to the rest of the world.
Remark 8.
The USA had the highest influence in “rubber and plastics” as a supplier.
We can observe (Figure 9) that the USA was the key supplier of Japan and Germany, imported mainly from Taiwan, and exported mainly to the rest of the world. Τhis reveals the significant influence of the USA as a supplier, but it was only one of the key clients. Japan traded mainly with China, Korea, and Indonesia. Germany traded mainly with European countries (France, Italy, Netherlands, and UK). We can observe that geographical proximity did matter for the partnerships of Japan and Germany.
Remark 9.
The USA was the key supplier of the leaders in the textiles market.
6. Concluding Remarks
We identified the high surplus countries (Question 1), their diversification (Question 2), and their key partnerships (Question 3) in the COVID-19 GVC nets, namely, for the sectoral networks of “chemicals”, “rubber and plastics”, and “textiles”. We used network theory and entropy combining forward and backward flows from data for the period 2000–2014. The key findings of our work are summarized as follows:
Question 1: Which are the high surplus countries (export higher than import)? Our study reveals that the supply of world trade in COVID-19 materials depended mainly on the USA, Japan, and China (Remarks 1–3). The USA, Japan, Germany, Korea, UK, Netherlands, Russia, Sweden, and India were the high surplus countries in the GVC net “Manufacture of chemicals and chemical products” (Figure 2). Japan, USA, Germany, China, Italy, UK, Indonesia, France, Brazil, Poland, Russia, Turkey, India, Portugal, and Finland were the high surplus countries in the GVC net “Manufacture of rubber and plastic products” (Figure 3). China, Italy, Korea, the USA, Turkey, Japan, India, UK, Taiwan, Brazil, Indonesia, Spain, Lithuania, and Australia were the high surplus countries in the GVC net “Manufacture of textiles, wearing apparel, and leather products” (Figure 4).
Question 2: What is the trade diversification of the high surplus countries? In the GVC net “Manufacture of chemicals and chemical products”, a few countries had a high surplus and high diversification (Remark 4). In the GVC net “Manufacture of rubber and plastic products”, the outperforming EU counties were more uniformly globalized. Although, the USA and Asian countries also had a high surplus, they were highly selective (Remark 5). In the GVC net “Manufacture of textiles, wearing apparel, and leather products”, the value added trade surplus was not related with diversification policy. Countries with a higher surplus had a lower diversification and vice versa (Remark 6).
Question 3: Who are the trade affiliates of the high surplus countries? The USA had the highest influence in the COVID-19 GVC nets (Remarks 7–9) and high flows from/to other high surplus countries (Japan, Germany, China, Italy, and Korea, (Figure 8, Figure 9 and Figure 10)).
The “COVID-19 goods” were discussed with data from 2000 to 2014. This gap was due to the lack of data of the same quality (WIOD database). However, this lack of data did not have significant implications on the results, because the average annual changes over the last five years were of the order 1% for the weight entropies and of the order of 10% for the weighted degrees as indicated in the Table 1.

Table 1.
Average annual changes (2009–2014) for weight entropies and weighted degrees.
The annual change in the indices under consideration are given by the formulas:
for t = 2009, 2010, 2011, 2012, and 2013. Therefore, the results based on entropy (diversification) are more robust compared to the results based on weighted degrees (country position in GVCs). These are our estimations for the expected modifications if more data were available.
We examined the sectoral scope of countries’ activities, as we were interested in the sectoral distribution of them. The examination of the flows among sectors is an interesting question but lies beyond the scope of this work. This discussion requires a multigraph of different sectoral network analysis which may provide additional insights.
The answers to these questions are valuable to policymakers for their decisions on COVID-19 material supplies management. Examples of recommendations based on our work are the following: For COVID-19 material supply agreements, the USA should be seriously considered. For establishing a factory producing COVID-19 goods or a logistic center, one should consider the USA for “chemicals”, Japan for “rubber and plastics”, and China for “textiles”. For the selection of robust suppliers, one should consider the USA for “chemicals”, Germany for “rubber and plastics”, and Italy for “textiles”.
Our study contributes to the recent discussion on value added trade in GVCs [32,33,34,35,39]. Our GVC construction of nets, based on Formula (1), allowed us to assess a country’s participation in specific sectors of the global value chain as a function of all sectors of other countries.
Author Contributions
Conceptualization, G.A., C.B., G.M., E.I., N.C.V. and I.E.A.; Data curation, G.A., C.B., G.M., E.I., N.C.V. and I.E.A.; Formal analysis, G.A., C.B., G.M., E.I., N.C.V. and I.E.A.; Investigation, G.A., C.B., G.M., E.I., N.C.V. and I.E.A.; Methodology, G.A., C.B., G.M., E.I., N.C.V. and I.E.A.; Project administration, G.A., C.B., G.M., E.I., N.C.V. and I.E.A.; Resources, G.A., C.B., G.M., E.I., N.C.V. and I.E.A.; Software, G.A., C.B., G.M., E.I., N.C.V. and I.E.A.; Supervision, G.A., C.B., G.M., E.I., N.C.V. and I.E.A.; Validation, G.A., C.B., G.M., E.I., N.C.V. and I.E.A.; Visualization, G.A., C.B., G.M., E.I., N.C.V. and I.E.A.; Writing—original draft, G.A., C.B., G.M., E.I., N.C.V. and I.E.A.; Writing—review and editing, G.A., C.B., G.M., E.I., N.C.V. and I.E.A. All authors have read and agreed to the published version of the manuscript.
Funding
This project was funded by the subcontracting services of the Aristotle University of Thessaloniki (AUTH).
Institutional Review Board Statement
Not applicable.
Informed Consent Statement
Not applicable.
Data Availability Statement
Data available in a publicly accessible repository. The data supporting reported results are available from the World Input-Output Database (http://www.wiod.org/release16 (accessed on 30 October 2021). An illustrated user’s guide can be found at: https://doi.org/10.1111/roie.12178 (accessed on 30 October 2021).
Conflicts of Interest
The authors declare no conflict of interest.
References
- Lodigiani, C.; Lapichino, G.; Carenzo, L.; Cecconi, M.; Ferrazzi, P.; Sebastian, T.; Barco, S. Venous and arterial thromboembolic complications in COVID-19 patients admitted to an academic hospital in Milan, Italy. Thromb. Res. 2020, 191, 9–14. [Google Scholar] [CrossRef]
- Park, C.-Y.; Kim, K.; Roth, S.; Beck, S.; Kang, J.; Tayag, M. Global Shortage of Personal Protective Equipment amid COVID-19: Supply Chains, Bottlenecks, and Policy Implications. ADB Briefs 2020, 130, 1–10. [Google Scholar]
- Gereffi, G. What does the COVID-19 pandemic teach us about global value chains? The case of medical supplies. J. Int. Bus. Policy 2020, 3, 287–301. [Google Scholar] [CrossRef]
- Boškoski, I.; Gallo, C.; Wallace, M.B.; Costamagna, G. COVID-19 pandemic and personal protective equipment shortage: Protective efficacy comparing masks and scientific methods for respirator reuse. Gastrointest. Endosc. 2020, 92, 519–523. [Google Scholar] [CrossRef] [PubMed]
- Bauchner, H.; Fontanarosa, P.; Livingston, E. Conserving Supply of Personal Protective Equipment—A Call for Ideas. JAMA 2020, 323, 1911. [Google Scholar] [CrossRef] [PubMed] [Green Version]
- Burki, T. Global shortage of personal protective equipment. Lancet 2020, 20, 785–786. [Google Scholar] [CrossRef]
- WHO. Rational Use of Personal Protective Equipment for Coronavirus Disease (COVID-19) and Considerations during Severe Shortages; World Health Organization: Geneva, Switzerland, 2020; Available online: https://apps.who.int/iris/handle/10665/331695 (accessed on 30 October 2021).
- Henneberry, B. How to Make Personal Protective Equipment (PPE) for COVID-19 (Manufacturing and Sourcing Guide). Available online: https://www.thomasnet.com/articles/plant-facility-equipment/how-to-make-ppe/#register (accessed on 30 October 2021).
- Vidya, C.; Prabheesh, K. Implications of COVID-19 Pandemic on the Global Trade Networks. Emerg. Mark. Financ. Trade 2020, 56, 2408–2421. [Google Scholar] [CrossRef]
- Timmer, M.; Erumban, A.; Los, B.; Stehrer, R.; Vries, G. Slicing Up Global Value Chains. J. Econ. Perspect. 2014, 28, 99–118. [Google Scholar] [CrossRef] [Green Version]
- Porter, M. Competitive Advantage: Creating and Sustaining Superior Performance; The Free Press Macmilan: New York, NY, USA, 1985. [Google Scholar]
- Graham, S. Integrating the Supply Chains. Int. J. Phys. Distrib. Mater. Manag. 1989, 8, 3–8. Available online: https://pdfs.semanticscholar.org/792f/f5a74aac0672b52805198942a6051fd0caf1.pdf (accessed on 30 October 2021).
- Groeneweyen, J.; Beije, P. The French Communication Industry Defined and Analyzed through the Social Fabric Matrix, the Filiere Approach, and Network Analysis. J. Econ. Issues 1989, 23, 1059–1074. [Google Scholar] [CrossRef]
- Porter, M. Competitive Advantage of Nations; The Free Press: New York, NY, USA, 1990. [Google Scholar]
- Gereffi, G.; Korzeniewicz, M. Commodity Chains and Global Capitalism; Praeger: London, UK, 1994; Available online: https://dukespace.lib.duke.edu/dspace/bitstream/handle/10161/11457/1994_Gereffi_Role%20of%20big%20buyers%20in%20GCCs_chapter%205%20in%20CC&GC.pdf?sequence=1 (accessed on 30 October 2020).
- Ernst, D. From partial to systemic globalization: International production networks in the electronics industry. In UCAIS Berkeley Roundtable on the International Economy Working Paper Series; No.98; BRIE: Berkeley, CA, USA, 1997; Available online: https://brie.berkeley.edu/sites/default/files/wp_98.pdf (accessed on 30 October 2021).
- Gereffi, G.; Kaplinsky, R. Introduction: Globalisation, Value Chains and Development. IDS Bull. 2001, 32, 1–8. [Google Scholar] [CrossRef] [Green Version]
- Ernst, D.; Kim, L. Global production networks, knowledge diffusion, and local capability formation. Res. Policy 2002, 31, 1417–1429. [Google Scholar] [CrossRef]
- Backer, K.; Miroudot, S. Mapping global value chains. In ECB Working Paper; No. 1677; ECB: Frankfurt, Germany, 2014; Available online: https://papers.ssrn.com/sol3/papers.cfm?abstract_id=2436411 (accessed on 30 October 2021).
- Gereffi, G. The organization of buyer-driven global commodity chains: How U.S. retailers shape overseas production networks. In Commodity Chains and Global Capitalism; Gereffi, G., Korzeniewicz, M., Eds.; Praeger Publishers: Fairfield County, CT, USA, 1994; pp. 95–122. Available online: https://dukespace.lib.duke.edu/dspace/handle/10161/11457 (accessed on 30 October 2021).
- Gibbon, P. Upgrading Primary Production: A Global Commodity Chain Approach. World Dev. 2001, 29, 345–363. [Google Scholar] [CrossRef]
- Humphrey, J.; Schmitz, H. Governance in Global Value Chains. IDS Bull. 2001, 32, 19–29. [Google Scholar] [CrossRef] [Green Version]
- Sturgeon, T. How Do We Define Value Chains and Production Networks? IDS Bull. 2001, 32, 9–18. [Google Scholar] [CrossRef] [Green Version]
- Humphrey, J.; Schmitz, H. How does insertion in global value chains affect upgrading in industrial clusters? Reg. Stud. 2002, 36, 1017–1027. [Google Scholar] [CrossRef]
- Sturgeon, T. Modular production networks: A new American model of industrial organization. Ind. Corp. Chang. 2002, 11, 451–496. [Google Scholar] [CrossRef] [Green Version]
- Fold, N. Lead Firms and Competition in ‘Bi-polar’ Commodity Chains: Grinders and Branders in the Global Cocoa-chocolate Industry. J. Agrar. Chang. 2002, 2, 228–247. [Google Scholar] [CrossRef]
- Ó Riain, S. The politics of mobility in technology-driven commodity chains: Developmental coalitions in the Irish software industry. Int. J. Urban Reg. Res. 2004, 28, 642–663. [Google Scholar] [CrossRef] [Green Version]
- Ponte, S.; Gibbon, P. Quality standards, conventions and the governance of global value chains. Econ. Soc. 2005, 34, 1–31. [Google Scholar] [CrossRef]
- Gibbon, P.; Bair, J.; Ponte, S. Governing global value chains: An introduction. Econ. Soc. 2008, 37, 315–338. [Google Scholar] [CrossRef]
- Amador, J.; Cabral, S. Global value chains, labour markets and productivity. In The Age of Global Value Chains; Amador, J., Mauro, F., Eds.; CEPR: London, UK, 2015; pp. 107–120. Available online: http://voxeu.org/content/age-global-value-chains-maps-and-policy-issues (accessed on 30 October 2021).
- Amador, J.; Cabral, S. Networks of Value-added Trade. World Econ. 2016, 40, 1291–1313. [Google Scholar] [CrossRef]
- Cerina, F.; Zhu, Z.; Chessa, A.; Riccaboni, M. World Input-Output Network. PLoS ONE 2015, 10, e0134025. [Google Scholar] [CrossRef] [PubMed] [Green Version]
- Cingolani, I.; Panzarasa, P.; Tajoli, L. Countries’ positions in the international global value networks: Centrality and economic performance. Appl. Netw. Sci. 2017, 2, 21. [Google Scholar] [CrossRef] [PubMed]
- Criscuolo, C.; Timmis, J. GVCS and centrality: Mapping key hubs, spokes and the periphery. In OECD Productivity Working Papers; No. 12; OECD Publishing: Paris, France, 2018. [Google Scholar] [CrossRef]
- Criscuolo, C.; Timmis, J. GVC centrality and productivity: Are hubs key to firm performance? In OECD Productivity Working Papers; No. 14; OECD Publishing: Paris, France, 2018. [Google Scholar] [CrossRef]
- Ferrantino, M.; Taglioni, D. Global Value Chains in the Current Trade Slowdown. World Bank Econ. Premise 2014, 137, 30. Available online: http://documents1.worldbank.org/curated/ar/971291468149948311/pdf/862320BRI0EP1380Box385167B00PUBLIC0.pdf (accessed on 30 October 2021).
- Jouanjean, M.-A.; Gourdon, J.; Korinek, J. GVC participation and economic transformation: Lessons from three sectors No. 207. In OECD Trade Policy Papers; OECD Publishing: Paris, France, 2017. [Google Scholar] [CrossRef]
- Shepherd, B. Infrastructure, trade facilitation, and network connectivity in Sub-Saharan Africa. J. Afr. Trade 2016, 3, 1–22. [Google Scholar] [CrossRef]
- Xing, L.; Dong, X.; Guan, J.; Qiao, X. Betweenness centrality for similarity-weight network and its application to measuring industrial sectors’ pivotability on the global value chain. Phys. A Stat. Mech. Appl. 2019, 516, 19–36. [Google Scholar] [CrossRef]
- Baldwin, R.; Tomiura, E. Thinking ahead about the trade impact of COVID-19. In Economics in the Time of COVID-19; Baldwin, R., Mauro, B.W., Eds.; CEPR Press—VoxEU.org: London, UK, 2020; pp. 59–71. Available online: https://daserste.ndr.de/panorama/cepr102.pdf#page=66 (accessed on 30 October 2021).
- Javorcik, B. Global supply chains will not be. In COVID-19 and Trade Policy; Baldwin, R., Evenett, S., Eds.; CEPR Press—VoxEU.org: London, UK, 2020; pp. 111–116. Available online: https://www.svensktnaringsliv.se/bilder_och_dokument/covid-19-and-trade-policy-28-aprilpdf_1005375.html/BINARY/Covid-19%20and%20trade%20policy%2028%20april.pdf#page=122 (accessed on 30 October 2021).
- Miroudot, S. Resilience versus robustness in global value chains: Some policy implications. In COVID-19 and Trade Policy; Baldwin, R., Evenett, S., Eds.; CEPR Press—VoxEU.org: London, UK, 2020; pp. 117–130. Available online: https://www.sches.org/wp-content/uploads/2020/05/Covid-19_and_Trade_Policy.pdf#page=128 (accessed on 30 October 2021).
- Strange, R. The 2020 Covid-19 pandemic and global value chains. J. Ind. Bus. Econ. 2020, 47, 455–465. [Google Scholar] [CrossRef]
- Ivanov, D. Predicting the impacts of epidemic outbreaks on global supply chains: A simulation-based analysis on the coronavirus outbreak (COVID-19/SARS-CoV-2) case. Transp. Res. Part E Logist. Transp. Rev. 2020, 136, 101922. [Google Scholar] [CrossRef]
- Verbeke, A. Will the COVID-19 Pandemic Really Change the Governance of Global Value Chains? Br. J. Manag. 2020, 31, 444–446. [Google Scholar] [CrossRef]
- O’Sullivan, A.; Sheffrin, S.M. Economics: Principles and Tools, 2nd ed.; Prentice Hall: Hoboken, NJ, USA, 2003. [Google Scholar]
- Alves, L.G.; Mangioni, G.; Rodrigues, F.; Panzarasa, P.; Moreno, Y. Unfolding the Complexity of the Global Value Chain: Strength and Entropy in the Single-Layer, Multiplex, and Multi-Layer International Trade Networks. Entropy 2018, 20, 909. [Google Scholar] [CrossRef] [PubMed] [Green Version]
- Angelidis, G.; Ioannidis, E.; Makris, G.; Antoniou, I.; Varsakelis, N. Competitive Conditions in Global Value Chain Networks: An Assessment Using Entropy and Network Analysis. Entropy 2020, 22, 1068. [Google Scholar] [CrossRef] [PubMed]
- Frenken, K. Entropy statistics and information theory. In Elgar Companion to Neo-Schumpeterian Economics; Hanusch, H., Pyka, A., Eds.; Edward Elgar Publishing: Cheltenham, UK, 2007; pp. 544–555. [Google Scholar]
- Frenken, K.; Van Oort, F.; Verburg, T. Related Variety, Unrelated Variety and Regional Economic Growth. Reg. Stud. 2007, 41, 685–697. [Google Scholar] [CrossRef] [Green Version]
- Timmer, M.; Erumban, A.; Gouma, R.; Los, B.; Temurshoev, U.; Vries, G.; Arto, I. The World Input-Output Database (WIOD): Contents, sources and methods. In IIDE Discussion Papers; No. 20120401; Institute for International and Development Economics: Rotterdam, The Netherlands, 2012; pp. 1–74. Available online: http://www.wiod.org/publications/papers/wiod10.pdf (accessed on 30 October 2021).
- Timmer, M.; Dietzenbacher, E.; Los, B.; Stehrer, R.; Vries, G. An Illustrated User Guide to the World Input–Output Database: The Case of Global Automotive Production. Rev. Int. Econ. 2015, 23, 575–605. [Google Scholar] [CrossRef]
- Timmer, M.; Los, B.; Stehrer, R.; Vries, G. An anatomy of the global trade slowdown based on the WIOD 2016 release. In GGDC Research Memorandum; No:162; Groningen Growth and Development Centre: Groningen, The Netherlands, 2016; Available online: http://www.rug.nl/ggdc/html_publications/memorandum/gd162.pdf (accessed on 30 October 2021).
- Johnson, R.; Noguera, G. Accounting for intermediates: Production sharing and trade in value added. J. Int. Econ. 2012, 86, 224–236. [Google Scholar] [CrossRef] [Green Version]
- Koopman, R.; Powers, W.; Wang, Z.; Wei, S.-J. Give credit where credit is due: Tracing value added in global production chains. In NBER Working Paper; No. 16426; NBER: Cambridge, MA, USA, 2010. [Google Scholar] [CrossRef]
- Johnson, R. Five facts about value-added exports and implications for macroeconomics and trade research. J. Econ. Perspect. 2014, 28, 119–142. [Google Scholar] [CrossRef] [Green Version]
- Koopman, R.; Wang, Z.; Wei, S.-J. Tracing value-added and double counting in gross exports. Am. Econ. Rev. 2014, 104, 459–494. [Google Scholar] [CrossRef] [Green Version]
- Aleskerov, F.; Ersel, H.; Piontkovski, D. Linear Algebra For Economistis; Springer: London, UK, 2011. [Google Scholar]
- Bapat, R.B.; Raghavan, T.E.S. Nonnegative Matrices And Applications; Cambridge University Press: Cambridge, UK, 1997. [Google Scholar]
- Xu, Υ.; Dietzenbacher, E. A structural decomposition analysis of the emissions embodied in trade. Ecol. Econ. 2014, 101, 10–20. [Google Scholar] [CrossRef]
- Miller, R.; Blair, P. Input–Output Analysis. Foundations and Extensions, 2nd ed.; Cambridge University Press: Cambridge, UK, 2009. [Google Scholar]
- Barrat, A.; Barthelemy, M.; Pastor-Satorras, R.; Vespignani, A. The architecture of complex weighted networks. Proc. Natl. Acad. Sci. USA 2004, 101, 3747–3752. [Google Scholar] [CrossRef] [Green Version]
- OECD. Measuring trade in value added. In Interconnected Economies: Benefiting from Global Value Chains; OECD Publishing: Paris, France, 2013; pp. 53–86. [Google Scholar] [CrossRef]
- Khinchin, A. Mathematical Foundations of Information Theory; Dover: New York, NY, USA, 1957. [Google Scholar]
- Yanglom, A.; Yanglom, I. Probability and Information; Reidel: Dordecht, The Netherlands, 1983. [Google Scholar]
- Shannon, C.; Weaver, W. The Mathematical Theory of Communication; University of Illinois Press: Urbana, IL, USA, 1949. [Google Scholar]
- Cover, T.M. Elements of Information Theory; John Wiley & Sons: Hoboken, NJ, USA, 1999. [Google Scholar]
Publisher’s Note: MDPI stays neutral with regard to jurisdictional claims in published maps and institutional affiliations. |
© 2021 by the authors. Licensee MDPI, Basel, Switzerland. This article is an open access article distributed under the terms and conditions of the Creative Commons Attribution (CC BY) license (https://creativecommons.org/licenses/by/4.0/).