Article

Attribute Service Performance Index Based on Poisson Process

1
Department of Industrial Engineering and Management, National Chin-Yi University of Technology, Taichung 411030, Taiwan
2
Department of Business Administration, Chaoyang University of Technology, Taichung 41349, Taiwan
3
Institute of Innovation and Circular Economy, Asia University, Taichung 41354, Taiwan
4
Department of Business Administration, Asia University, Taichung 41354, Taiwan
5
Department of Finance, National Taichung University of Science and Technology, Taichung 40401, Taiwan
*
Authors to whom correspondence should be addressed.
Mathematics 2021, 9(23), 3144; https://doi.org/10.3390/math9233144
Submission received: 8 November 2021 / Revised: 2 December 2021 / Accepted: 5 December 2021 / Published: 6 December 2021
(This article belongs to the Special Issue Fuzzy Applications in Industrial Engineering)

Abstract

:
The purpose of a shop enhancing customer satisfaction is to raise its total revenue as the rate of customer purchases in the shop increases. Some studies have pointed out that the amount of customer arrival at a shop is a Poisson process. A simple and easy-to-use evaluation index proposed for the Poisson process with the attribute characteristic will help various shops evaluate their business performance. In addition, developing an excellent and practical service performance evaluation method will be beneficial to the advancement of shop service quality as well as corporate image, thereby increasing the profitability and competitiveness of the shop. As the surroundings of the internet of things (IoT) are becoming gradually common and mature, various commercial data measurement and collection technologies are constantly being refined to form a huge amount of production data. Efficient data analysis and application can assist enterprises in making wise and efficient decisions within a short time. Thus, following the simple and easy-to-use principle, this paper proposes an attribute service performance index based on a Poisson process. Since the index had unknown parameters, this paper subsequently figured out the best estimator and used the central limit theorem to derive the confidence interval of the service efficiency index based on random samples. Then, we constructed the membership function based on the α - cuts of the triangular shaped fuzzy number. Finally, we came up with a fuzzy testing model based on the membership function to improve the accuracy of the test when the sample size is small in order to meet enterprises’ needs for quick responses as well as reducing the evaluation cost.

1. Introduction

Numerous studies have used questionnaires to conduct satisfaction surveys and identified service items that need to be improved by means of performance evaluation matrices. Improvements have been made to enhance customer satisfaction [1,2,3]. The purpose of a shop improving customer satisfaction is to raise the percentage of customers’ purchases in the shops so as to increase its total revenue. On the whole, the amount of customer arrival at a shop belongs to an attribute Poisson process [4,5]. A user-friendly evaluation index for the Poisson process of the attribute characteristic can assist a shop in assessing its business performance. An excellent and practical evaluation method for service performance can be of help for the improvement of the shop’s service quality as well as its image. Then, the shop can be profitable and competitive.
As noted by some study, the number of customers arriving at a shop gives a good answer for the performance measurement of a company since it immediately influences profitability and operating costs [6,7]. In early related research, Yang and Chen [8] proposed a performance index approach for controlling service quality based on the Poisson process. Some research pointed out that the number of customers arriving at a shop is a Poisson process [9,10,11]. Furthermore, Chen [5,12] used an operating performance index for the Poisson process and an exponential distribution to develop a fuzzy testing model based on confidence intervals. According to many scholars’ viewpoints, an index is a simple and unitless management tool, which is very convenient for management and communication [13,14,15]. Therefore, no matter whether it is the process quality index of the manufacturing industry or the service performance index of the service industry, it is a unitless and easy-to-use communication and management tool [16,17,18,19,20].
Based on the above-mentioned, this paper sets rules with an easy-to-use principle. Furthermore, this paper refers to the performance index proposed by Yang and Chen [8] to define an attribute service performance index based on the Poisson process. Since the index has unknown parameters, this paper then finds the uniformly minimum variance unbiased estimator (UMVUE) of the service performance index based on random samples. Additionally, the UMVUE is regarded as the test statistic to measure whether the shop’s operating performance reaches the required performance level.
Additionally, some studies have pointed out that various business data measurement and collection technologies are frequently rectified to generate massive production data, as internet of things (IoT) is growing more or more popular [21,22]. Efficient data analysis and application can help companies make smart and efficient decisions in a short period of time [23,24]. Based on some studies, data collection for the Poisson process is slow [4,5]. Furthermore, given enterprises’ needs for quick responses and cost considerations, the sample size n of the random samples is usually not too large in practice, so the accuracy of statistical inference will be affected [25,26]. In order to solve this problem, the fuzzy testing method proposed by this paper is built on traditional statistical laws as well as designed to incorporate the past production information or expert experience. Therefore, when the samples are small, it is hoped that the testing accuracy can be remained unchanged or improved. Additionally, another advantage of the fuzzy testing method based on the confidence interval is that the existing measurement of simple random sampling can be maintained during data collection, which is easier than the data collection of various fuzzy numbers; also, the calculation of the data is relatively easy [1,19]. It can be said that it takes into account the accuracy of the assessment and meets the needs of enterprises for quick responses. Obviously, the evaluation model of this article contains more evaluation information (e.g., the past production information or expert experience) than the traditional statistical test. Therefore, it is more effective and practical than the traditional statistical test in the case of a small sample size.
Furthermore, the evaluation model presented by this paper can grasp the timeliness. Therefore, when the evaluation result is that the service operation performance is poor, the opportunity for improvement can be immediately grasped. Since this fuzzy testing method is constructed by deriving the confidence interval of the index, it can not only reduce the risk of misjudgment due to sampling error, but also can be finally applied to a case provided by this paper to explain its use for the application of the industry.
The other sections of this paper are organized as follows. In Section 2, we propose an attribute service performance index based on the Poisson process and discuss its characteristics. Next, we discover the uniformly minimum variance unbiased estimator of the service performance index. In Section 3, we use the central limit theorem to derive the confidence interval of the service efficiency index, and a confidence-interval-based fuzzy testing method is proposed to assess the performance of the shop as well as determine whether the process needs to improve. In Section 4, we present an application example illustrating the applicability of the proposed approach. In Section 5, we make conclusions.

2. An Attribute Service Performance Index

As noted above, Yang and Chen [8] proposed a performance index approach for managing service quality. Based on Chen and Yang [4], the spirit of index setting is simple and easy to use. Owing to this concept, this paper proposes an attribute service performance index based on the Poisson process as follows:
S λ = λ N L ,
where λ is the process mean, and N L is the minimally required amount of customers entering into the shop in a unit of time. Obviously, the process mean λ is bigger than the minimally required number of customers N L , and then the value of attribute service performance index S λ is bigger than 1. When process mean λ is bigger, then the value of the attribute service performance index is bigger as well.
We assume that X 1 , , X j , , X n are independent, identically distributed random variables with a Poisson distribution process, denoted as X j ~ P ( λ ) . Then, the unbiased estimator of attribute service performance index S λ is expressed as follows:
S λ * = λ N L ,
where λ = T 0 / n = j = 1 n X j / n . The characteristic function of T 0 is
ϕ T 0 ( t ) = E e i t T 0 = E e i t j = 1 n X j = j = 1 n E e i t X j = ϕ X j t n = e x p λ e i t 1 n ,
then ϕ T 0 ( t ) = e x p n λ e i t 1 , and T 0 is distributed as a Poisson distribution, denoted as T 0 ~ P ( n λ ) . Obviously, the distribution of X j is a one-parameter exponential type p. d. f. of X j , and can be rewritten as
f X j ( x j ) = C ( λ ) e x p Q ( λ ) T ( x j ) h ( x j ) ,
where x j is the observed value of random variable X j and C ( λ ) = e λ , Q ( λ ) = l n λ , T ( x j ) = x j , and h ( x j ) = x j ! 1 are independent of λ , j =1, 2, …, n. Then, the exponential family is
g ( x 1 , x 2 , x n ; λ ) = C n ( λ ) e x p Q ( λ ) T * ( x 1 , x 2 , , x n ) h ( x 1 , x 2 , , x n ) ,
where h ( x 1 , x 2 , , x n ) = j h ( x j ) = j x j ! 1 and T * ( x 1 , x 2 , , x n ) = j = 1 n x j are complete and sufficient statistics for λ . In fact, S λ * is the function of T * ( x 1 , x 2 , , x n ) only,
E S λ * = E λ N L = E T 0 n N L = n λ n N L = S λ
and
E S λ * 2 = E T 0 2 n 2 N L 2 = E T 0 T 0 1 + E T 0 n 2 N L 2 = n 2 λ 2 + n λ n 2 N L 2 = S λ 2 + S λ n N L
Therefore, E S λ * 2 = S λ 2 + S λ / n N L < . Based on the Lehmann–Scheffé theorem, S λ * is the uniformly minimum variance unbiased estimators (UMVUE) of S λ .

3. Fuzzy Hypothesis Testing Based on Service Performance Index

Suppose that R is the requirement performance value of the index S λ . Then, we consider the problem of the hypothesis test as follows:
H 0 : S λ R
H 1 : S λ < R ,
at a desired level of significance level β . Let
Z = S λ * S λ S λ / n N L ,
where S λ is the expected value of S λ * and S λ / n N L is the standard deviation of S λ * . Then, by the central limits theorem (CLT), Z approximates the standard normal distribution when the sample size is large. Thus, the critical region is C = S λ * C 0 , where critical value C 0 is determined by
P S λ * C 0 S λ = R = P Z C 0 R R / n N L = β   .
Therefore, the critical value C 0 can be displayed as follows:
C 0 = R R n N L × z β   .
Let x 1 , , x j , , x n be the observed value of X 1 , , X j , , X n . Then, the observed value of S λ * is
S λ 0 * = λ 0 N L ,
where λ 0 = j = 1 n x j / n is the observed value of λ . Then, the statistical test decision rules are:
(1)
Reject H 0 if S λ 0 * C 0 , then the service performance needs to improve.
(2)
Do not reject H 0 if S λ 0 * > C 0 , then the service performance has no need to improve.
In practice, S λ of S λ / n N L is usually replaced by S λ * . Then, S λ * S λ / S λ * / n N L approximates the standard normal distribution when the sample size is large. Therefore, we have
1 α = p z α / 2 S λ * S λ S λ * / n N L z α / 2 = p S λ * z α / 2 × S λ * n N L S λ S λ * + z α / 2 × S λ * n N L .
Then, the 100 1 α % confidence intervals ( C I ) of S λ is
C I = S λ * z α / 2 × S λ * n N L S λ S λ * + z α / 2 × S λ * n N L .
The observed value of C I is shown as follows:
S λ 0 * z α / 2 × S λ 0 * n N L S λ S λ 0 * + z α / 2 × S λ 0 * n N L ,
where z α / 2 is the upper α / 2 quintiles of N 0 , 1 . Based on Yu et al. [26], the α - cuts of triangular shaped fuzzy number S ˜ λ is
S ˜ λ α = S λ 1 ( α ) , S λ 2 ( α ) ,   0 . 01 α 1 S λ 1 ( 0.01 ) , S λ 2 ( 0.01 ) ,   0 α 0.01
where
S λ 1 ( α ) = S λ 0 * z α / 2 × S λ 0 * n N L
and
S λ 2 ( α ) = S λ 0 * + z α / 2 × S λ 0 * n N L .
Therefore, the triangular shaped fuzzy number is S ˜ λ = Δ S L , S M , S R , where
S L = S λ 0 * z 0.005 × S λ 0 * n N L ,
S M = S λ 0 * ,
and
S R = S λ 0 * + z 0.005 × S λ 0 * n N L .
Consequently, the membership function of S ˜ λ is:
η ( x ) = 0 ,   i f   x < S L 2 × 1 Φ S λ 0 * x S λ 0 * / n N L ,   i f   S L x < S M 1 ,   i f   x = S M 2 × 1 Φ x S λ 0 * S λ 0 * / n N L ,   i f   S M < x S R 1 ,   i f   S R < x .
Similar to S ˜ λ , the α - cuts of triangular shaped fuzzy number C ˜ 0 is
C ˜ 0 α = C 01 ( α ) , C 02 ( α ) ,   0 . 01 α 1 C 01 ( 0.01 ) , C 02 ( 0.01 ) ,   0 α 0.01
where
C 01 ( α ) = C 0 z α / 2 × S λ 0 * n N L
and
C 02 ( α ) = C 0 + z α / 2 × S λ 0 * n N L .
Therefore, the triangular shaped fuzzy number is C ˜ 0 = Δ C L , C M , C R , where
C L = C 0 z 0.005 × S λ 0 * n N L ,
C M = C 0 ,
and
C R = C 0 + z 0.005 × S λ 0 * n N L .
Consequently, the membership function of C ˜ 0 is:
η ( x ) = 0 ,   i f   x < C L 2 × 1 Φ C 0 x S λ 0 * / n N L ,   i f   C L x < C M 1 ,   i f   x = C M 2 × 1 Φ x C 0 S λ 0 * / n N L ,   i f   C M < x C R 1 ,   i f   C R < x .
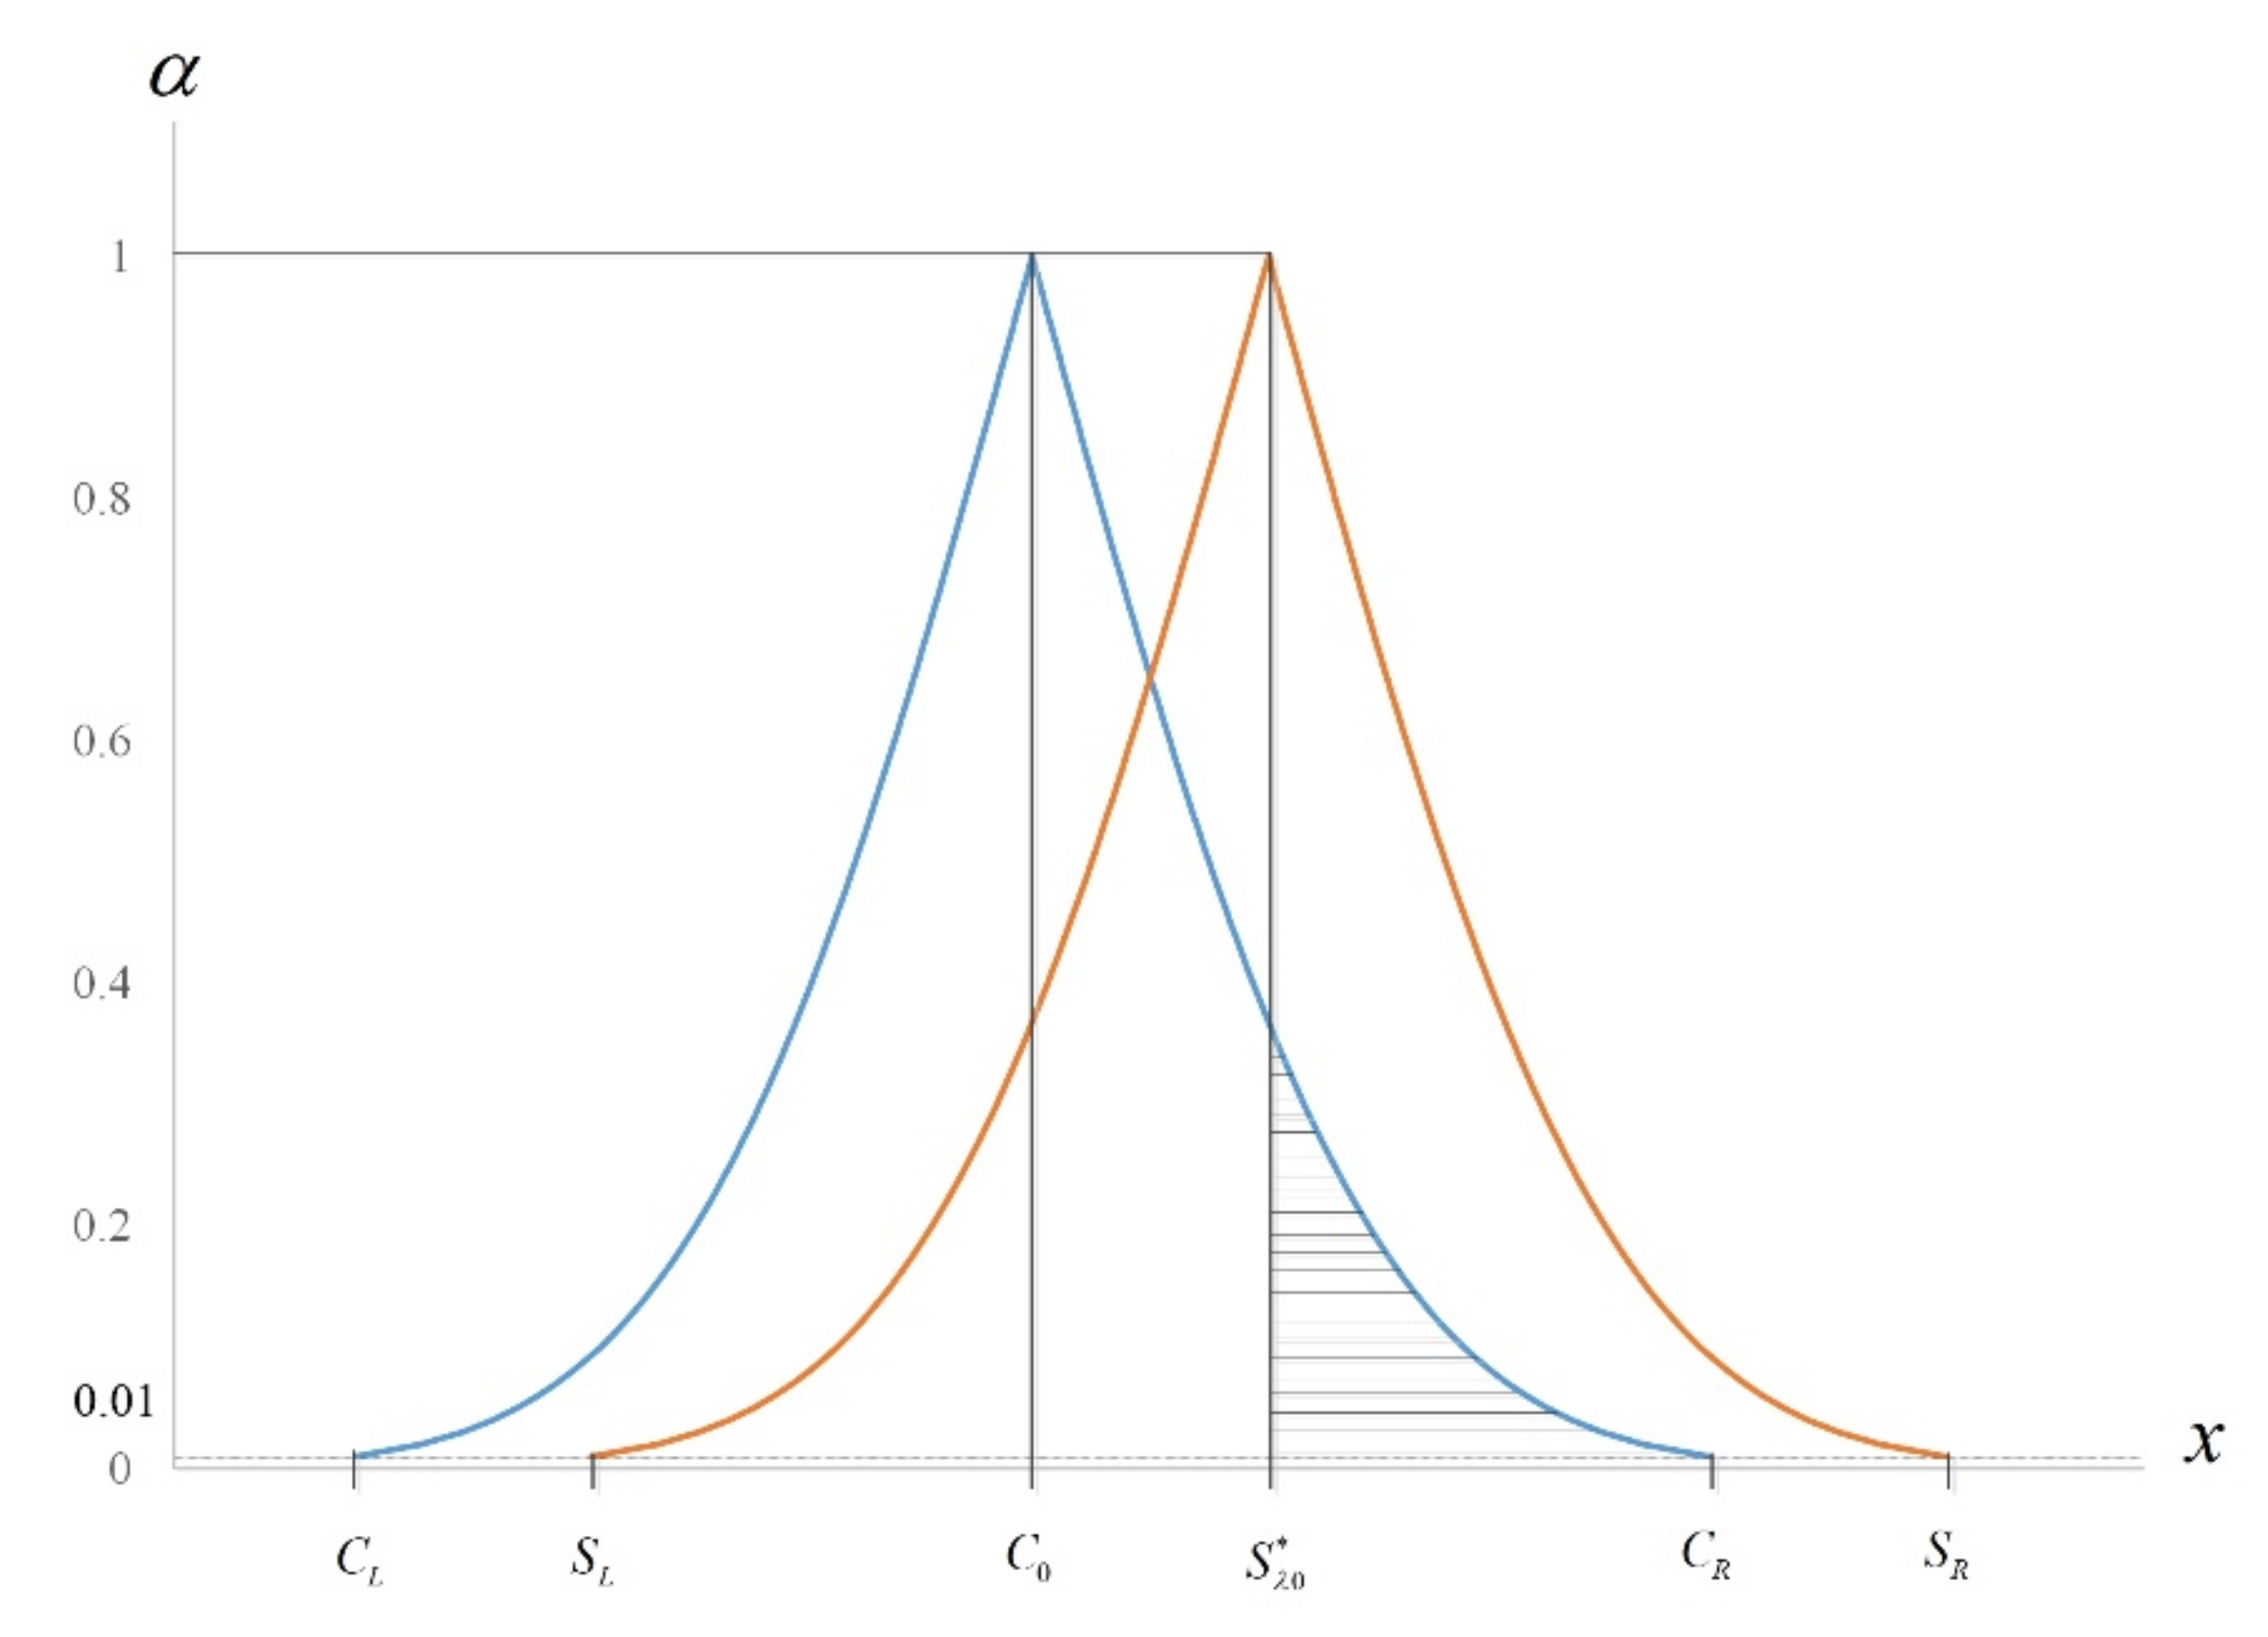
Subsequently, according to Equations (21) and (28), the diagram of η ( x ) and η ( x ) is presented below (see Figure 1).
Let set A T be the area in the graph of η ( x ) , such that
A T = x , α C 01 α x C 02 α , 0 α 1
As noted by Yu et al. [26], since the calculation of A T is complicated, this study uses d T to replace A T , where d T is the length of the bottom of A T , then d T = C R C L is as follows:
d T = 2 × z 0.005 × S λ 0 * n N L = 5.512 × S λ 0 * n N L
On the other hand, let set A R be the area in the graph of η ( x ) but to the right of the vertical line x = S λ 0 * , then
A R = x , α S λ 0 x C 02 α , 0 α a ,
where
a = 2 1 Φ C 0 S λ 0 S λ 0 / n N L ,
such that S λ 0 * = C 01 a = C 0 z a / 2 × S λ 0 * / n N L . Therefore, d R =   C R   S λ 0 * is as follows:
d R = C 0 + z 0.005 × S λ 0 * n N L S λ 0 * = 2.576 × S λ 0 * n N L + C 0 S λ 0 * .
Thus, the value of d S / d T can be calculated as follows:
d R d T = 2.576 × S λ 0 * / n N L + C 0 S λ 0 * 5.152 × S λ 0 * / n N L .
Note that we let 0 < ϕ 1 , ϕ 2 0.5, where the value of ϕ 1 and ϕ 2 can be determined based on the past accumulated production data or expert experience [1]. Therefore, we let 0   <   ϕ 1 < ϕ 2 < 0.5 . As noted by Huang et al. [27] and Buckley [28], we may obtain the following fuzzy testing rules:
(1)
If d R / d T ϕ 1 , then do not reject H 0 and assume that S λ R .
(2)
If ϕ 1 < d R / d T < ϕ 2 , then do not make any decision on whether to reject H 0 or not.
(3)
If ϕ 2 d R / d T < 0.5, then reject H 0 and assume that S λ < R .

4. A Practical Application

As mentioned earlier, the number of customers arriving at a shop provides a good solution for the performance measurement of a company and is distributed as a Poisson process. A shop sets the minimally required number of customers who enter into the shop as N L   = 10 in a unit of time. The required performance value of the index is bigger than or equal to 1 ( S λ 1), and the significance level is β   = 0.05. Therefore, the problem of the hypothesis test is listed as follows:
H 0 : S λ 1
H 1 : S λ < 1 .
To proceed the above statistical test, the simple random samples are surveyed in the shop of case study. The observed values of random samples with sample size n = 25 are shown as follows:
x 1 = 9 , x 2 = 7 , x 3 = 10 , x 4 = 6 , x 5 = 11 ,
x 6 = 9 , x 7 = 14 , x 8 = 7 , x 9 = 7 , x 10 = 6 ,
x 11 = 8 , x 12 = 10 , x 13 = 10 , x 14 = 9 , x 15 = 11 ,
x 16 = 9 , x 17 = 8 , x 18 = 12 , x 19 = 11 , x 20 = 8 ,
x 21 = 7 , x 22 = 10 , x 23 = 8 , x 24 = 7 , x 25 = 11 ,
then
λ 0 = j = 1 25 x j / 25 = 9.0 ,
S λ 0 * = λ 0 N L = 0.90 ,
and
C 0 = R R n N L × z β   = 1 1 25 × 10 × 1.645 = 0.896 .
Based on the statistical test decision rule, do not reject H 0 , and the service performance needs to improve. In fact, the value of S λ 0 * is equal to 0.9 or smaller than 1. However, the conclusion is S λ 1 because the sample size is relatively small, which leads to a longer confidence interval, that is to say, it is caused by the sampling error. According to the study of Chen [12], the probability of misjudgment is relatively high. Then, the fuzzy hypothesis testing method proposed in this study can be used to evaluate the service performance. Based on Equations (25)–(27), we have
C L = C 0 z 0.005 × S λ 0 * n N L = 0.896 2.576 × 0.90 25 × 10 = 0.741   ,
C M = C 0 = 0.896 ,
and
C R = C 0 + z 0.005 × S λ 0 * n N L = 0.896 + 2.576 × 0.90 25 × 10 = 1.051   .
Therefore, the membership function of C ˜ 0 with C 0   = 0.896 is:
η ( x ) = 0 ,   i f   x < 0.741 2 × 1 Φ 0.896 x 0.06 ,   i f   0.741 x < 0.896 1 ,   i f   x = 0.896 2 × 1 Φ x 0.896 0.06 ,   i f   0.896 < x 1.051 1 ,   i f   C R < 1.051 .
Similarly, based on Equations (18)–(20), we have
S L = S λ 0 * z 0.005 × S λ 0 * n N L = 0.90 2.576 × 0.90 25 × 10 = 0.745 ,
S M = S λ 0 * = 0.90 ,
and
S R = S λ 0 * + z 0.005 × S λ 0 * n N L = 0.90 + 2.576 × 0.90 25 × 10 = 1.054 .
Consequently, the membership function of S ˜ λ with S λ 0 * = 0.90 is:
η ( x ) = 0 ,   i f   x < 0.745 2 × 1 Φ 0.90 x 0.06 ,   i f   0.745 x < 0.90 1 ,   i f   x = 0.90 2 × 1 Φ x 0.90 0.06 ,   i f   0.90 < x 1.054 1 ,   i f   1.054 < x
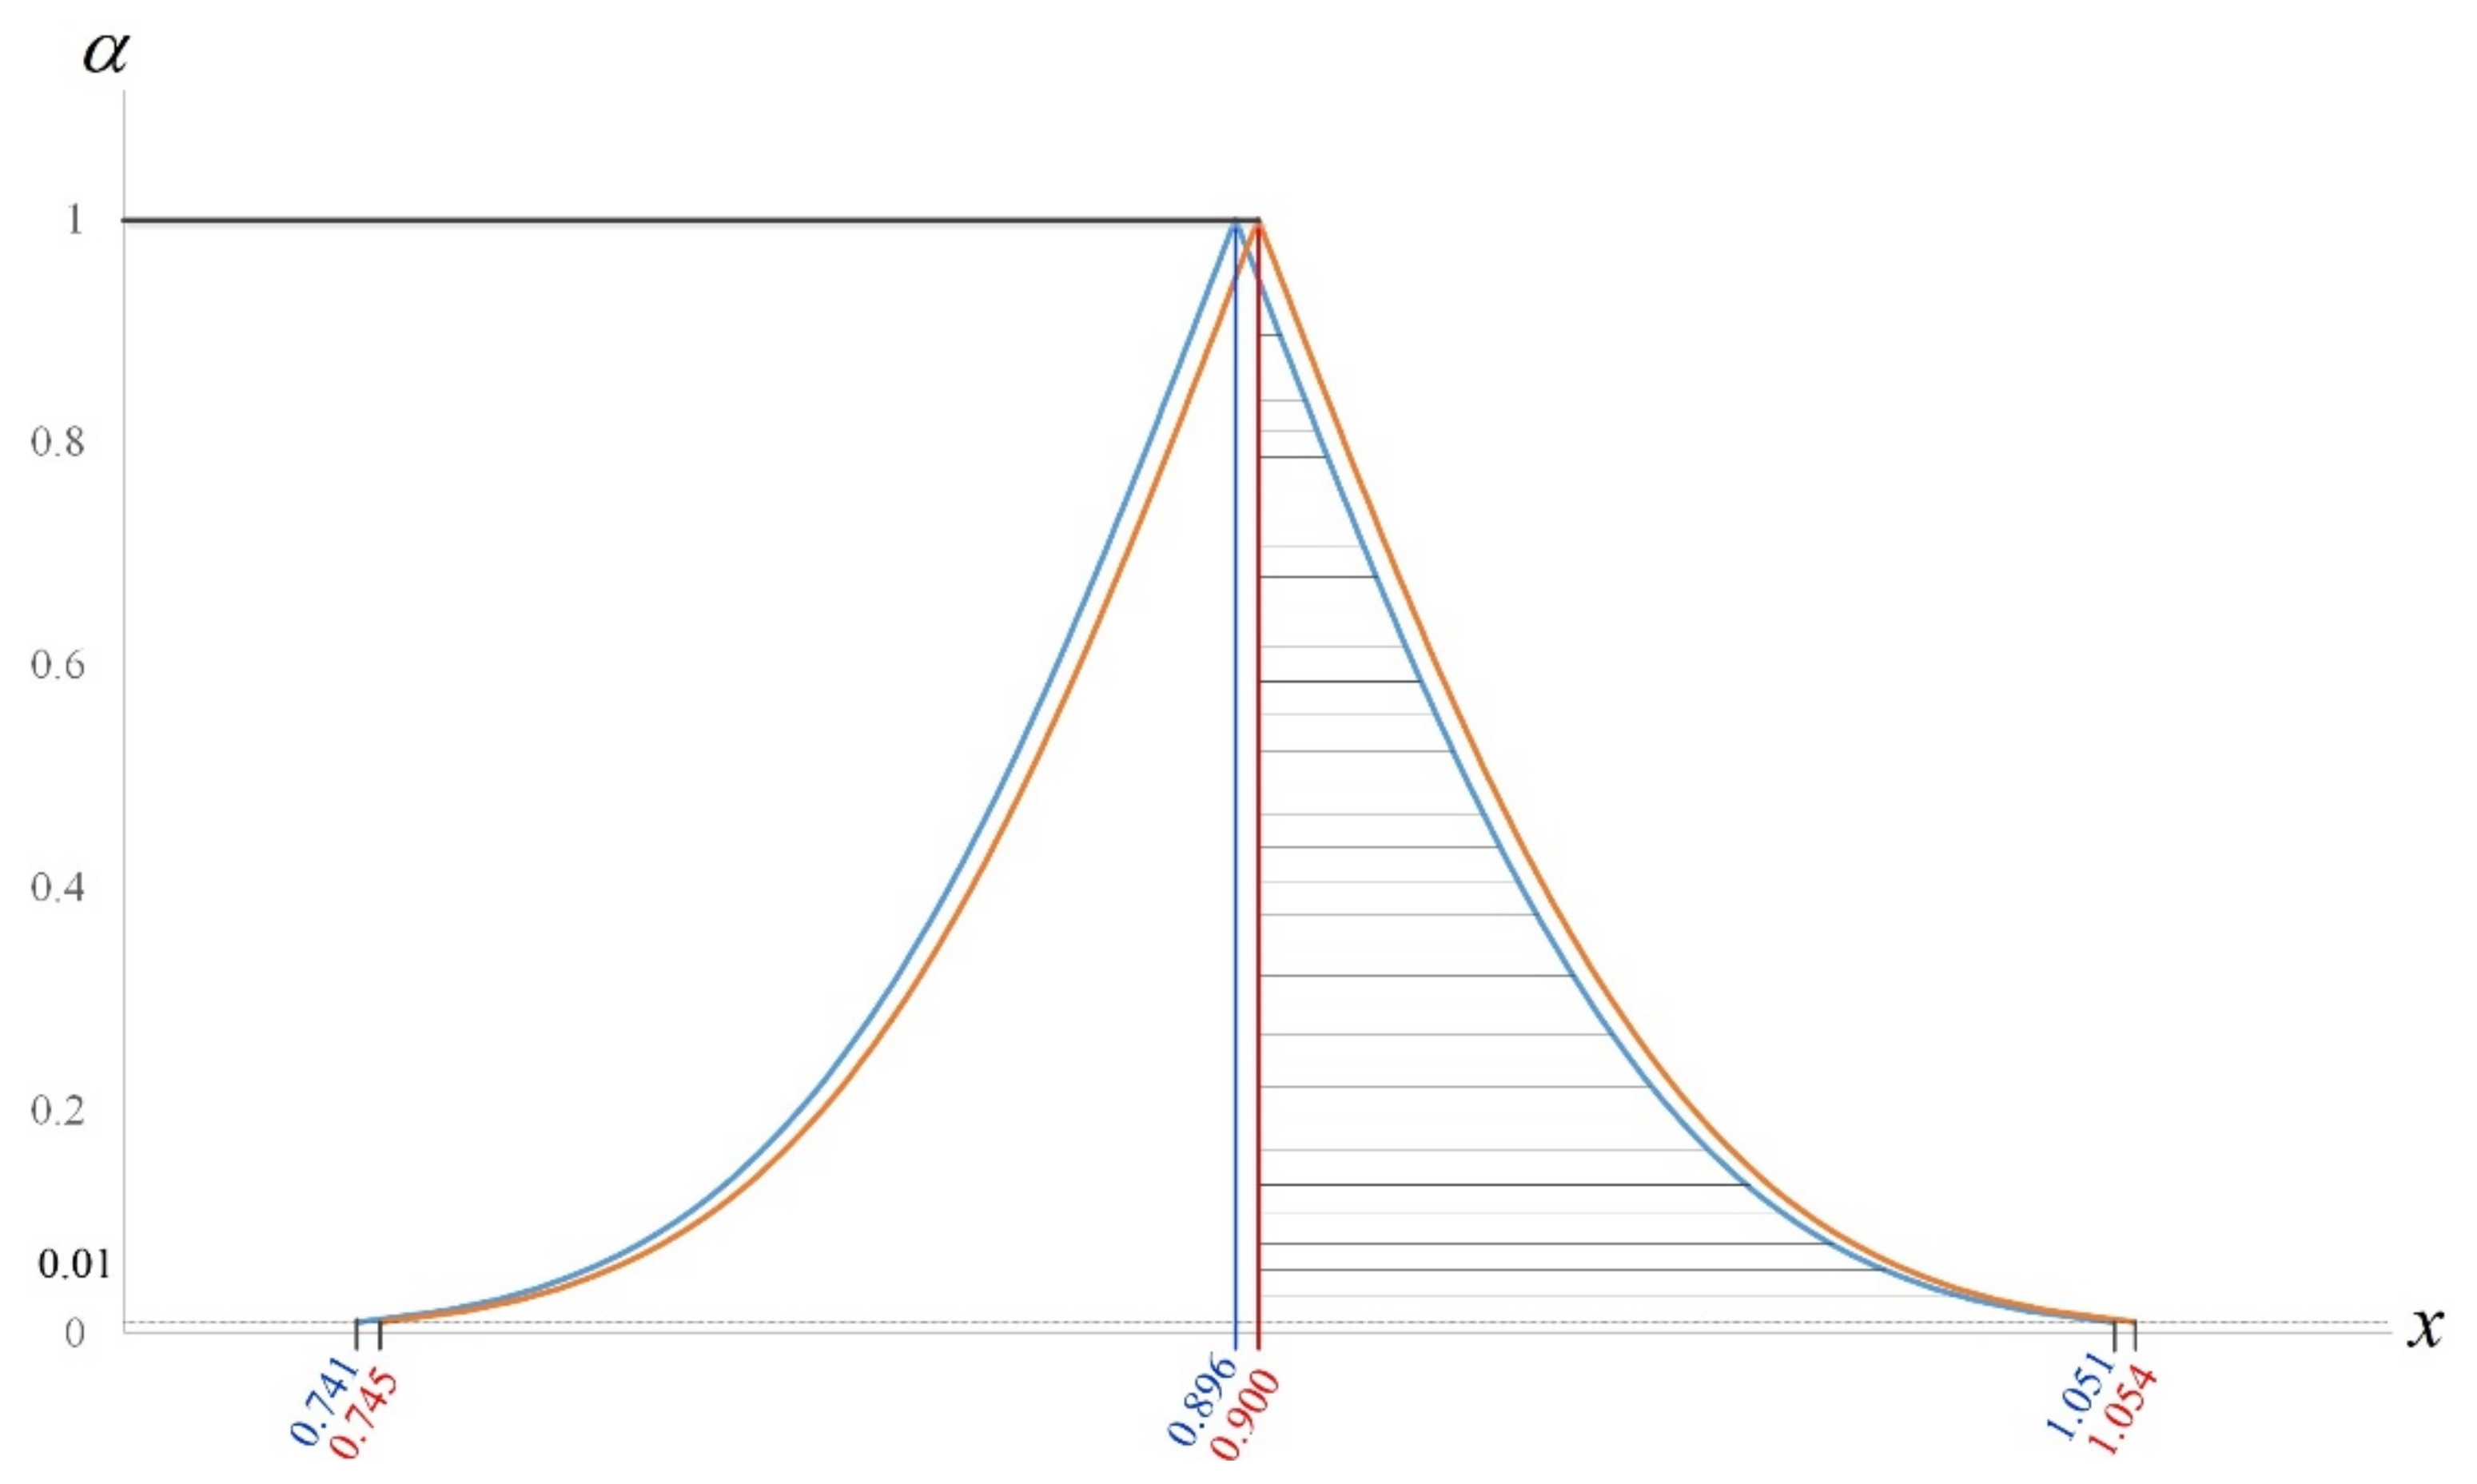
Therefore, the membership functions diagram of η ( x ) with C 0   = 0.896 and η ( x ) with S λ 0 *   = 0.90 is presented below (see Figure 2):
Therefore,
d R = C R S λ 0 * = 1.051 0.900 = 1.151
and
d T = C R C L = 1.051 0.741 = 0.310
Thus, the value of d R / d T can be calculated as follows:
d R d T = 0.151 0.310 = 0.487
Based on the past accumulated production data and expert experience, we take ϕ 1 = 0.2 and ϕ 2   = 0.4. Then, according to the fuzzy testing rules, since d R / d T = 0.487 < 0.5, we reject H 0 and conclude that S λ < 1 . Based on the statistical test decision rule, do not reject H 0 , and the service performance has no need to improve. In fact, the value of S λ 0 * is equal to 0.9 but smaller than 1. However, the conclusion is S λ 1 ; this is because the sample size is so small that the confidence interval becomes longer. That is to say, the probability of misjudgment is relatively high because of the relatively large sampling error. Therefore, through the fuzzy testing model proposed by this study, it seems that the traditional statistical test is more reasonable from a practical point of view.

5. Conclusions

According to the principle of arranging an easy-to-use index, this paper proposed an attribute service performance index built on a Poisson process. Because the service performance index contained untraced parameters, this paper discussed the nature of the index in Section 2 and found its best estimator from the random samples so that it could be used as a test statistic. To satisfy enterprises’ needs for rapid responses and cost considerations, in practice, the sample size n of random samples is usually not too large. Therefore, it will affect the accuracy of the statistical test. In order to solve this problem, this paper proposed a confidence-interval-based fuzzy testing model for a service performance index. Since this method can be integrated into the past accumulated data experience, it can maintain the accuracy of the evaluation when the sample size n is not large. Moreover, because this method is built on the confidence interval, it can diminish the risk of misjudgment caused by sampling errors. From the practical cases mentioned in this paper, it is clearly seen that the fuzzy testing model proposed by this paper seems to be more reasonable than the traditional statistical test method.

6. Limitations and Future Research

The fuzzy testing method proposed by this paper is designed to determine the value of ϕ 1 and ϕ 2 by integrating the past production information or expert experience. Nevertheless, we are not sure which method is used to analyze the past production information, and the expert experience cannot judge whether it is reliable. Hence, that shows that the research limit of this paper is also the direction for future research.

Author Contributions

Conceptualization, K.-S.C. and C.-H.H.; methodology, K.-S.C. and C.-H.H.; software, T.-H.H.; validation, T.-H.H.; formal analysis, K.-S.C. and C.-H.H.; data curation, T.-H.H.; writing—original draft preparation, K.-S.C., C.-H.H. and T.-H.H.; writing—review and editing, K.-S.C. and C.-H.H.; visualization, T.-H.H.; supervision, K.-S.C.; project administration, C.-H.H. All authors have read and agreed to the published version of the manuscript.

Funding

This research received no external funding.

Institutional Review Board Statement

Not applicable.

Informed Consent Statement

Not applicable for studies not involving humans.

Conflicts of Interest

The authors declare no conflict of interest.

References

  1. Chen, K.S.; Yu, C.M. Fuzzy test model for performance evaluation matrix of service operating systems. Comput. Ind. Eng. 2020, 140, 106240. [Google Scholar] [CrossRef]
  2. Martínez-Caro, E.; Cegarra-Navarro, G.J.; Cepeda-Carrión, G. An application of the performance-evaluation model for e-learning quality in higher education. Total Qual. Manag. Bus. Excell. 2015, 26, 632–647. [Google Scholar] [CrossRef]
  3. Wu, J.; Wang, Y.; Zhang, R.; Cai, J. An approach to discovering product/service improvement priorities: Using dynamic importance-performance analysis. Sustainability 2018, 10, 3564. [Google Scholar] [CrossRef] [Green Version]
  4. Chen, K.S.; Yang, C.M. Developing a performance index with a Poisson process and an exponential distribution for operations management and continuous improvement. J. Comput. Appl. Math. 2018, 343, 737–747. [Google Scholar] [CrossRef]
  5. Chen, K.S. Fuzzy testing of operating performance index based on confidence intervals. Ann. Oper. Res. 2019. [Google Scholar] [CrossRef]
  6. Kruk, L.; Lehoczky, J.; Ramanan, K.; Shreve, S. Heavy traffic analysis for EDF queues with reneging. Ann. Appl. Probab. 2011, 21, 484–545. [Google Scholar] [CrossRef] [Green Version]
  7. Battiti, R.; Brunato, M.; Battiti, F. RoomTetris in room committing: Why the role of minimum-length-of-stay requirements should be revisited. Int. J. Contemp. Hosp. Manag. 2021, 33, 4017–4034. [Google Scholar] [CrossRef]
  8. Yang, H.H.; Chen, K.S. A performance index approach to managing service quality. Manag. Serv. Qual. 2000, 10, 273–278. [Google Scholar] [CrossRef] [Green Version]
  9. Manou, A.; Canbolat, P.G.; Karaesmen, F. Pricing in a transportation station with strategic customers. Prod. Oper. Manag. 2017, 26, 1632–1645. [Google Scholar] [CrossRef]
  10. Hung, Y.F.; Lee, T.Y. Capacity rationing decision procedures with order profit as a continuous random variable. Int. J. Prod. Econ. 2010, 125, 125–136. [Google Scholar] [CrossRef]
  11. Canbolat, P.G. Bounded rationality in clearing service systems. Eur. J. Oper. Res. 2020, 282, 614–626. [Google Scholar] [CrossRef]
  12. Chen, K.S. Two-tailed Buckley fuzzy testing for operating performance index. J. Comput. Appl. Math. 2019, 361, 55–63. [Google Scholar] [CrossRef]
  13. Gutierrez, D.M.; Scavarda, L.F.; Fiorencio, L.; Martins, R.A. Evolution of the performance measurement system in the logistics department of a broadcasting company: An action research. Int. J. Prod. Econ. 2015, 160, 1–12. [Google Scholar] [CrossRef]
  14. Rodriguez, R.R.; Saiz, J.J.A.; Bas, A.O. Quantitative relationships between key performance indicators for supporting decision-making processes. Comput. Ind. 2009, 60, 104–113. [Google Scholar] [CrossRef]
  15. Kucukaltan, B.; Irani, Z.; Aktas, E. A decision support model for identification and prioritization of key performance indicators in the logistics industry. Comput. Hum. Behav. 2016, 65, 346–358. [Google Scholar] [CrossRef] [Green Version]
  16. Pearn, W.L.; Chen, K.S. A Bayesian-like estimator of Cpk. Commun. Stat. Simul. Comput. 1996, 25, 321–329. [Google Scholar] [CrossRef]
  17. Nikzad, E.; Amiri, A.; Amirkhani, F. Estimating total and specific process capability indices in three-stage processes with measurement errors. J. Stat. Comput. Simul. 2018, 88, 3033–3064. [Google Scholar] [CrossRef]
  18. De-Felipe, D.; Benedito, E. Monitoring high complex production processes using process capability indices. Int. J. Adv. Manuf. Technol. 2017, 93, 1257–1267. [Google Scholar] [CrossRef] [Green Version]
  19. Yu, C.M.; Luo, W.J.; Hsu, T.H.; Lai, K.K. Two-Tailed Fuzzy Hypothesis Testing for Unilateral Specification Process Quality Index. Mathematics 2020, 8, 2129. [Google Scholar] [CrossRef]
  20. Sanchez-Marquez, R.; Jabaloyes Vivas, J. Building a cpk control chart—A novel and practical method for practitioners. Comput. Ind. Eng. 2021, 158, 107428. [Google Scholar] [CrossRef]
  21. Liu, H.; Luo, Y.; Geng, J.; Yao, P. Research hotspots and frontiers of product R&D management under the background of the digital intelligence era-bibliometrics based on citespace and histcite. Appl. Sci. 2021, 11, 6759. [Google Scholar]
  22. Zhang, K. Design and implementation of smart classroom based on internet of things and cloud computing. Int. J. Inf. Technol. Syst. Approach 2021, 14, 38–51. [Google Scholar] [CrossRef]
  23. Sarosh, P.; Parah, S.A.; Bhat, G.M.; Muhammad, K. A security management framework for big data in smart healthcare. Big Data Res. 2021, 25, 100225. [Google Scholar] [CrossRef]
  24. Lee, T.S.; Wang, C.H.; Yu, C.M. Fuzzy Evaluation Model for Enhancing E-Learning Systems. Mathematics 2019, 7, 918. [Google Scholar] [CrossRef] [Green Version]
  25. Wu, C.H.; Hsu, Y.C.; Pearn, W.L. An improved measure of quality loss for notching processes. Qual. Reliab. Eng. Int. 2021, 37, 108–122. [Google Scholar] [CrossRef]
  26. Yu, C.H.; Liu, C.C.; Chen, K.S.; Yu, C.M. Constructing fuzzy hypothesis methods to determine critical-to-quality service items. Mathematics 2020, 8, 573. [Google Scholar] [CrossRef] [Green Version]
  27. Huang, C.C.; Chang, T.C.; Chen, B.L. Fuzzy assessment model to judge quality level of machining processes involving bilateral tolerance using crisp data. J. Chin. Inst. Eng. 2021, 44, 1–10. [Google Scholar] [CrossRef]
  28. Buckley, J.J. Fuzzy statistics: Hypothesis testing. Soft Comput. 2005, 9, 512–518. [Google Scholar] [CrossRef]
Figure 1. Membership functions of η ( x ) and η ( x ) .
Mathematics 09 03144 g001
Figure 2. Membership functions of η ( x ) with C 0   = 0.896 and η ( x ) with S λ 0 *   = 0.900.
Mathematics 09 03144 g002
Publisher’s Note: MDPI stays neutral with regard to jurisdictional claims in published maps and institutional affiliations.

