Article

Reliability Analysis of High Concrete-Face Rockfill Dams and Study of Seismic Performance of Earthquake-Resistant Measures Based on Stochastic Dynamic Analysis

1
Faculty of Infrastructure Engineering, School of Hydraulic Engineering, Dalian University of Technology, Dalian 116024, China
2
School of Water Conservancy Engineering, Zhengzhou University, Zhengzhou 450001, China
3
State Key Laboratory of Coastal and Offshore Engineering, Dalian University of Technology, Dalian 116024, China
*
Author to whom correspondence should be addressed.
Mathematics 2021, 9(23), 3124; https://doi.org/10.3390/math9233124
Submission received: 19 October 2021 / Revised: 28 November 2021 / Accepted: 1 December 2021 / Published: 4 December 2021

Abstract

:
The randomness of earthquake excitation has a significant impact on the seismic performance of high earth-rock dams. In this paper, the seismic performance of geosynthetic-reinforced soil structures (GRSS) of high concrete face rockfill dams (CFRDs) is evaluated from the stochastic perspective. Multiple groups of seismic ground motions are generated based on spectral expression-random function non-stationary model. Taking Gushui CFRD as an example, this study calculates the failure probability of each damage level of non-reinforce slopes and reinforce slopes based on generalized probability density evolution method (GPDEM) and reliability analysis is presented though multiple evaluation indicators. The result shows that GRSS can reduce the mild damage of CFRDs during earthquake and restrain the moderate and severe damage. The influence of vertical spacing and length of GRSS on the seismic performance is obtained, which provides a reference for the seismic design and risk analysis of CFRDs.

1. Introduction

In recent years, the high earth-rock dams under construction or proposed in China are mainly distributed in the western regions, where earthquakes occur frequently. Once a dam breaks, it could cause immeasurable losses. According to domestic and international experimental results [1,2] and existing earthquake experiences [3,4] with earth-rock dams, the safety of earth-rock dams is closely related to the stability of the dam slope downstream.
Geosynthetic-reinforced soil structures (GRSS) perform well during strong earthquakes, in comparison with other earthquake-resistant measures, in maintaining the stability of slope rockfill [5,6]; therefore, the study of GRSS should receive greater attention. Li et al. [7] used the Newmark sliding block displacement method to evaluate the effect of reinforcement technology on dam crest rockfill, and Noorzad and Omidvar [8] performed a parametric analysis to study the effect of reinforcements on the seismic behavior of reinforced dams. The results showed that reinforcement measures can reduce dam settlement and maximum shear strain, but increase the maximum horizontal peak acceleration. Zhu et al. [9] analyzed the influence of various parameters of GRSS on seismic performance, based on the Fast Lagrangian Analysis of Continuum (FLAC) method. Yang [10] evaluated the seismic stability of reinforced earth-rock dams, based on the upper-bound theorem of limit analysis, and studied the influence of geogrid length on seismic performance. Glovatsky et al. [11] developed the theoretical foundations for the modeling and design of test stands in the study of volumetric models of dams of large channels made of reinforced soil, and evaluated the influence of reinforcement on the bearing capacity of earth-rock dams.
Indeed, variable associated seismic ground motions are filled with uncertainties and threaten the dynamic stability of GRSS [12]. However, the aforementioned studies were based on single ground motion, without considering the randomness of earthquake excitation, with respect to which it is difficult to calculate the probability of failure accurately, and which may even lead to calculation results that are significantly different from the facts. As reliability analysis theory has advanced, scholars have paid more and more attention to the role of this theory with respect to the seismic safety of dams. The Monte Carlo method, the generalized probability density method, the response surface method, and other methods have been used for risk analysis [13] and seismic safety evaluation [14,15] from the perspective of probability. However, relatively few studies have targeted the earthquake-resistant measures of high earth-rock dams from the perspective of random dynamics.
Based on the above, this paper adopted a seismic ground motion generation method and the generalized probability density evolution theory for random dynamic analysis of high concrete face rockfill dams (CFRDs), in considering the randomness of seismic ground motions. First, the finite element model of CFRDs was established, followed by the stochastic dynamic analysis of the dam non-reinforced slopes and reinforced slopes. Second, the seismic performance of the proposed measure was evaluated from the perspective of dynamic reliability. Third, the changes in the length and vertical spacing of GRSS were analyzed to provide a reference for the actual engineering design.

2. Reliability Analysis Method Based on Stochastic Dynamics

The reliability analysis of engineering has made great progress in the field of earthquake-resistant engineering research in recent years [16,17]. The system of reliability analysis of earthquake-resistant measures has four main steps: (1) multiple groups of random ground motion processes are generated, based on the non-stationary ground motion model; (2) the finite element model and the input the generated groups of random ground motions are utilized for batch computing; (3) the probability density function (PDF) and the cumulative distribution function (CDF) are obtained for dam safety performance indices, combined with the generalized probability density evolution theory; and (4) based on these steps, a probability model is constructed to analyze the reliability of a dam before and after the application of earthquake-resistant measures, so seismic performance may be evaluated.

2.1. Non-Stationary Ground Motion Model

In this paper, the spectral expression-random function non-stationary ground motion model [18] was established, based on the improved Clough-Penzien power spectrum model [19], and used for the generation of multiple groups of random ground motion.
The acceleration time series of the stochastic seismic ground motions are generated based on the spectral representation of the random function method of non-stationary stochastic processes [20]. This ground motion generation method has good applicability in the calculation considering the randomness of ground motions [21]. The random process of non-stationary ground motion acceleration with zero mean can be generated by the following formula:
X g ( t ) = k = 1 N 2 S X g ( t , ω k ) Δ ω [ cos ( ω k t ) X k + sin ( ω k t ) Y k ] ,
where ω k = k Δ ω ( Δ ω = ω / N ). { X k , Y k }     ( k = 1 , 2 , , N ) are the standard orthogonal random variables with an interval frequency of Δ ω = 0.15 rad/s, N is the number of the truncated items with N = 1600 here [18]. S X ¨ g is the bilateral evolutionary power spectral density function, and the expression is as follows [18]:
S X ¨ g ( t , ω ) = A 2 ( t ) ω g 4 ( t ) + 4 ξ g 2 ( t ) ω g 2 ( t ) ω 2 [ ω 2 ω g 2 ( t ) ] 2 + 4 ξ g 2 ( t ) ω g 2 ( t ) ω 2 ω 4 [ ω 2 ω f 2 ( t ) ] 2 + 4 ξ f 2 ( t ) ω f 2 ( t ) ω 2 S 0 ( t ) ,
where A(t) is the intensity modulation function and calculated as:
A ( t ) = [ t c exp ( 1 t c ) ] d ,
where c is the average time of peak ground acceleration (PGA) emergence, d is the shape control index of A(t). In this paper, c is taken as 4 s and d is taken as 2, according to [18]. In the evolutionary power spectral density function, the frequency modulation function can be determined by the following parameters:
ω g ( t ) = ω 0 a t T ,   ξ g ( t ) = ξ 0 + b t T ,
ω f ( t ) = 0.1 ω g ( t ) ,   ξ f ( t ) = ξ g ( t ) ,
where ω0 and ξ0 are the initial angular frequency and the initial damping ratio of the site soil; a and b are parameters determined on the basis of the field classification and seismic design categories; and T is the duration of the ground motion acceleration time history, which differs according to different sites. In this study, the site type used was I1, and the parameter values ω0, ξ0, a, b, and T were 25 (rad/s), 0.45, 3.5, 0.3, and 15 (s), respectively, in accordance with the China Hydraulic Seismic Design Code (NB 35047-2015).
The spectral parameters S 0 ( t ) in Equation (2) reflecting the spectral intensity can be expressed as:
S 0 ( t ) = a ¯ m a x 2 γ 2 π ω g ( t ) [ 2 ξ g ( t ) + 1 / ( 2 ξ g ( t ) ) ] ,
where a ¯ m a x is the mean value of PGA with a ¯ m a x = 0.340   g , which is the checking ground motion of Gushui CFRD; and γ is the equivalent peak factor, depended on the sort of seismic site, taken here to be 2.6 according to [18].
When ω = 0 , the following equation should be satisfied:
S X ¨ g ( t , ω 0 ) = S X ¨ g ( t , 0 ) = 0 .
In Equation (1), the variables { X k , Y k }   ( k = 1 , 2 , ,   N ) are standard orthogonal random variables, which are uniquely determined by the orthogonal basis function constructed based on the idea of random function through mapping, and meet the following basic conditions:
E [ X k ] = E [ Y k ] = 0 ,
E [ X j Y k ] = 0 ,   E [ X j X k ] = E [ Y j Y k ] = δ j k ,
where E [•] represents mathematical expectation and δjk is the Kronecker delta.
The method of constructing standard orthogonal random variables is as follows:
Suppose X ¯ n and Y ¯ n   ( n = 1 , 2 , ,   N ) are two independent random variables respectively Θ1 and Θ2, then the random function can be recorded as:
X ¯ n = cas ( n Θ 1 ) , Y ¯ n = cas ( n Θ 2 ) ,  
where cas ( x ) = cos ( x ) + sin ( x ) is the Hartley orthogonal basis function [22], basic random variables Θ1 and Θ2 are distributed uniformly and independent in the interval [0, 2π], which can usually be obtained by number-theoretic method. After certain deterministic mapping, they become the standard orthogonal random variables required by the Equation (1).
The mean square error of the above non-stationary ground motion acceleration process simulation can be expressed as:
ε ( N ) = 1 0 ω u 0 T S X g ( t , ω ) d t d ω 0 0 T S X g ( t , ω ) d t d ω ,
where ωu = NΔω is the truncation frequency, and generally the mean square error of peak acceleration is limited to far less than 1.0 [20].

2.2. Generalized Probability Density Evolution Theory

The generalized probability density evolution method (GPDEM) was proposed by Li et al. [23]. Starting from random events, the theory combines the decouple system’s physical equations, based on the principle of conservation of probability, to obtain the generalized probability density evolution equation and to establish the relationship between each physical quantity of interest in the project and in the dynamic system through constitutive relations and deformation coordination relations. Thus, the theory is expressed as a function of basic random variables, and then the probability density function of the studied physical quantity is solved by combining the initial conditions and the boundary conditions. In recent years, the theory has made good progress in the analysis of uncertainty reliability and in the application of large-scale nonlinear structures [24,25].
The motion equation of n degree of freedom system can be expressed as:
M ¯ ( Θ ) X ¨ + C ( Θ ) X ˙ + G ( Θ , X ) = Γ F ( Θ , t ) ,
where M ¯ , C are the n × n order mass and damping matrix, G (·) is the linear or nonlinear restoring force vector, X ¨ , X ˙ and X are the acceleration, velocity and displacement vectors of the structural response respectively, the Γ is n × r order excitation influence matrix and the F ( Θ , t ) is r order excitation vector. And n is the number of degrees of freedom of the system and r is the order of external excitation here.
For a general well posed dynamic system, the physical solution of Equation (12) exists, uniquely and continuously depends on the basic parameters, so the solution of Equation (12) can be expressed as:
X = H ( Θ , t ) .
The speed process can be expressed as:
X ˙ = h ( Θ , t ) .
The information of other physical quantities Z = ( Z 1 , , Z m ) T in practical engineering can also be expressed as a function of basic random variables by establishing relations with X ¨ and X ˙ through constitutive relations and deformation coordination relations:
Z = H Z ( Θ , t ) .
The time change rate (speed) can be expressed as:
Z ˙ = h Z ( Θ , t ) .
Since Equation (16) itself can be considered as a random dynamic process, the randomness comes entirely from Θ . The extended random process ( Z t , Θ ) is described according to the random event of probability conservation in the whole evolution process. The generalized probability density evolution equation can be obtained, considering the arbitrariness of Ω Θ [26]:
p Z Θ ( z , θ , t ) t + l = 1 m Z ˙ l ( θ , t ) p Z Θ ( z , θ , t ) z l = 0 ,
where p Z Θ ( z , θ , t ) refers to the joint PDF of ( Z , Θ ), in which the source random factors are completely described by Θ . Z refers to the physical quantity studied. The augmented system composed of ( Z , Θ ) is a conservative probability system, which follows the law of probability conservation.
It is worth pointing that the dimension m of this equation is the number of physical quantities studied. When only a certain response physical quantity is considered, the equation can further degenerate into a one-dimensional partial differential equation:
p Z Θ ( z , θ , t ) t + Z ˙ ( θ , t ) p Z Θ ( z , θ , t ) z = 0 .
Equation (18) has only partial differential for z and t, while θ is in the form of a parametric equation. Therefore, a series of deterministic values can be obtained, that is, for a given Θ = θq  ( q = 1 , 2 , , n s e l ) , where q represents different ground motion processes, and nsel = 89 in this paper. Derivative (velocity) Z j ( θ q , t m ) ( j = 1 , 2 , , m ) of the required physical quantity and θq can be obtained by solving the physical equation. When the random parameters are determined by selecting points in the probability space, the partial differential equation of the random dynamic system is transformed into a set of deterministic dynamic equations. The engineering structure can be solved by various numerical simulation methods such as finite element method and finite difference method, and Equation (18) becomes the following series of equations:
p Z Θ ( z , θ q , t ) t + j = 1 m Z ˙ l ( θ q , t ) p Z Θ ( z , θ q , t ) z j = 0 , q = 1 , 2 , , n s e l .
The initial condition of Equation (19) is:
p Z Θ ( z , θ q , t ) | t = t 0 = δ ( z z 0 ) P q .
The boundary conditions of Equation (19) are:
p Z Θ ( z , θ q , t ) | z j ± = 0 , j = 1 , 2 , , m .
The discrete numerical solutions p Z Θ ( z , θ q , t ) can be obtained by bringing in the initial conditions and boundary conditions. The solutions p Z ( z , t ) can be obtained by accumulating all the above discrete numerical solutions, and the result when m = 1 is as follows:
p Z ( z , t ) = q = 1 n s e l p Z Θ ( z , θ q , t ) .

2.3. Reliability Calculation Based on GPDEM

The dynamic reliability of engineering structures usually includes two kinds of problems: first exceedance probability failure and cumulative damage failure reliability, which can be obtained by constructing a virtual random process and solving the corresponding generalized probability density evolution equation [27].
Taking a random process X ( Θ , t ) (random ground motions in this study) as an example, its extreme value can be expressed as follows [28]:
Y X = m a x ( X ( Θ , t ) , t [ 0 , T ] ) .
The extreme value or cumulative value depends on the source random vector Θ and the random variables of the time period [0, T], so a virtual process can be constructed:
Z X ( τ ) = ψ [ Y X , τ ] .
Obviously, the condition Equation (25) can be met:
Z X ( τ ) | τ = 0 = 0 , Z X ( τ ) | τ = 1 = Y X .
For Equation (24), the derivative of τ is:
Z X = Z X τ = W X ( Θ , T ) .
Since the randomness of the virtual random process Z X ( τ ) comes entirely from Θ, ( Z X ( τ ) , Θ ) constitutes a probabilistic conservative system. According to the GPDEM, the joint PDF of ( Z X ( τ ) , Θ ), that is p Z Θ ( z , θ , t ) , satisfies the following generalized probability density evolution equation:
p Z Θ ( z , θ , t ) t + W X ( θ , T ) p Z Θ ( z , θ , t ) z = 0 .
The equation is solved to obtain the cumulative distribution curve of the studied physical quantity based on the solution method in Section 2.2, so as to obtain the transcendence probability corresponding to each value.

2.4. Calculation Indexes of Reliability Analysis of Concrete Face Rockfill Dam

At present, the finite element dynamic time history analysis method is used for the stability analysis of the dam body, and the indexes include cumulative time of Fs < 1.0 and cumulative slip. In this paper, the two indexes are used to judge the damage grade of the dam body.

2.4.1. Overall Stability Index

(1)
Safety factor
The safety factor is the ratio of the maximum shear strength provided by the soil on the potential sliding surface to the actual shear stress generated by the external load. The pre-earthquake stress of the dam and the instantaneous dynamic stress during the earthquake are calculated by the finite element method. The stability of the dam is calculated based to the static and dynamic superposition results of the element based on Newmark method [29,30], and the safety factor is calculated with the following formula:
F s = i = 1 n ( c i + σ i t a n φ i ) l i i = 1 n τ i l i ,
where c i and φ i are the cohesion and internal friction angle of the soil in the ith cell respectively; l i is the length of the slip arc through the ith cell; σ i and τ i are the normal stress and tangential stress on the slip arc surface of the ith cell, which are obtained by superposition of pre-earthquake stress and dynamic stress.
(2)
Cumulative time of Fs < 1.0
The time cumulative time of Fs < 1.0 in the whole earthquake process is obtained by determining and judging the minimum safety factor at each time and cumulative addition. In this paper, the criteria for classifying the damage level according to cumulative time is taken as: it is considered that slight damage occurs when the cumulative time is greater than 0 s. The time of 0.5 s is the moderate failure limit, 1.5 s is the severe failure limit, and 2 s is the local non dam break limit according to [31].

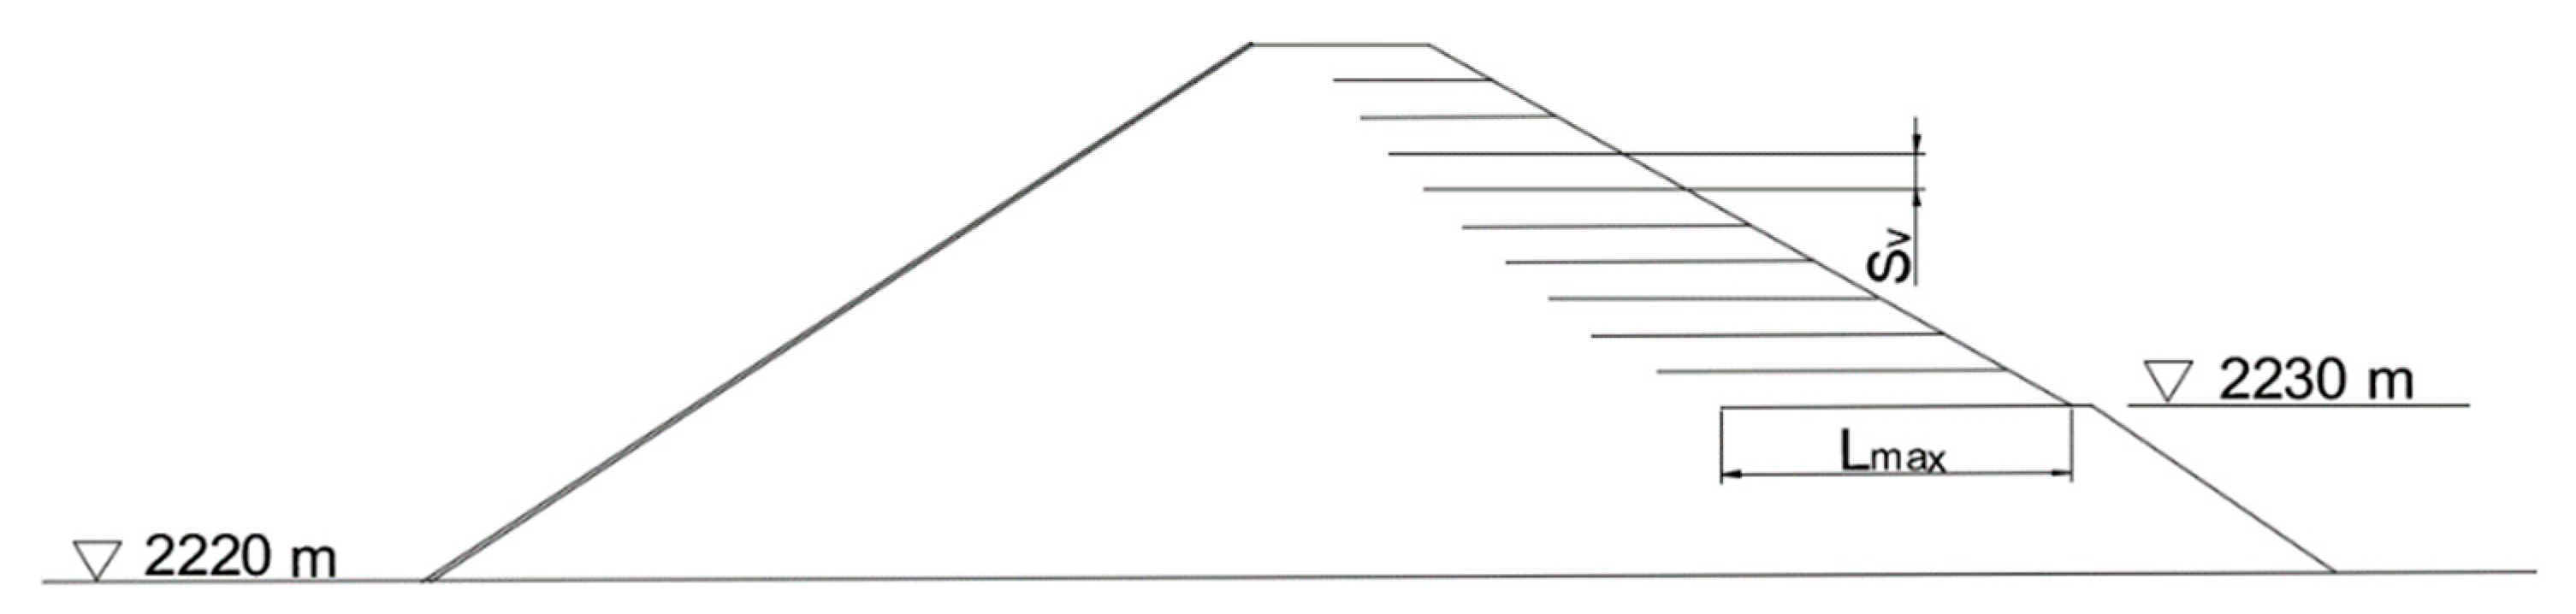
2.4.2. Local Sliding Failure Index

In this paper, the cumulative slip is used as the index to evaluate the local slip failure degree of the dam body. Based on the existing research [32,33] and the China Hydraulic Seismic Design Code (NB 35047-2015), the evaluation criteria of the cumulative slip index used in this paper are as follows: when the slip begins, it is judged as mild failure; 20 cm is the moderate failure limit, 100 cm is the severe failure limit, and 150 cm is the local non dam break limit.
For any sliding arc, the sliding angular velocity of the slider around the center of the circle can be calculated by Equation (29) [30]:
α ( t ) = M I ,
M = [ i = 1 n τ i l i i = 1 n ( c i + σ i t a n φ i ) l i ] R ,
where, I is the moment of inertia of the sliding body; α ( t ) is the sliding angular velocity of the sliding body after instantaneous instability; M is the rotational moment acting on the sliding body, and R is the slip arc radius.
When an instantaneous slip occurs in a slip arc at a certain time, the slip amount of the slip arc is:
D i k = R k α i k d t .
Multiple instantaneous sliding may occur in the whole time period, and the cumulative sliding amount is:
D k = i = 1 n D i k .
Maximum slip of dam slope is the maximum cumulative slip of all possible slip arcs:
D m a x = m a x ( D 1 , D 2 , , D k , , D m ) .

2.5. Reliability Analysis

This paper mainly selects two characteristic physical quantities: safety factor cumulative time of Fs < 1.0 and cumulative slip to determine the stability of the dam body, and carries out reliability analysis by calculating the failure probability of different grades of the dam body. The state function of the structure can be expressed as:
U = R S = g ( X 1 , X 2 , , X n ) ,
where U is the structural state function, which is used to represent the safe state of the structure. At that time U = 0, it means that the structure reaches the failure limit state, when U < 0, it means that the structure is damaged, when U > 0, it means that the structure is safe; R indicates the comprehensive resistance of the structure (i.e., the allowable failure state of the structure in this paper), and S indicates the bearing effect of the structure (i.e., the calculated maximum value). If expressed as a function, R and S can be comprehensively expressed as functions of basic random variables (such as strength parameters, seismic load, displacement response, etc.).
The reliability analysis of the structures (i.e., the calculation formula of failure probability) is following:
P f = P ( Z < 0 ) = 0 f ( Z ) d Z ,
where P f is failure probability. In this paper, it represents the probability that the calculated values of indicators exceed the allowable values for the specified failure level.

3. Example Analysis

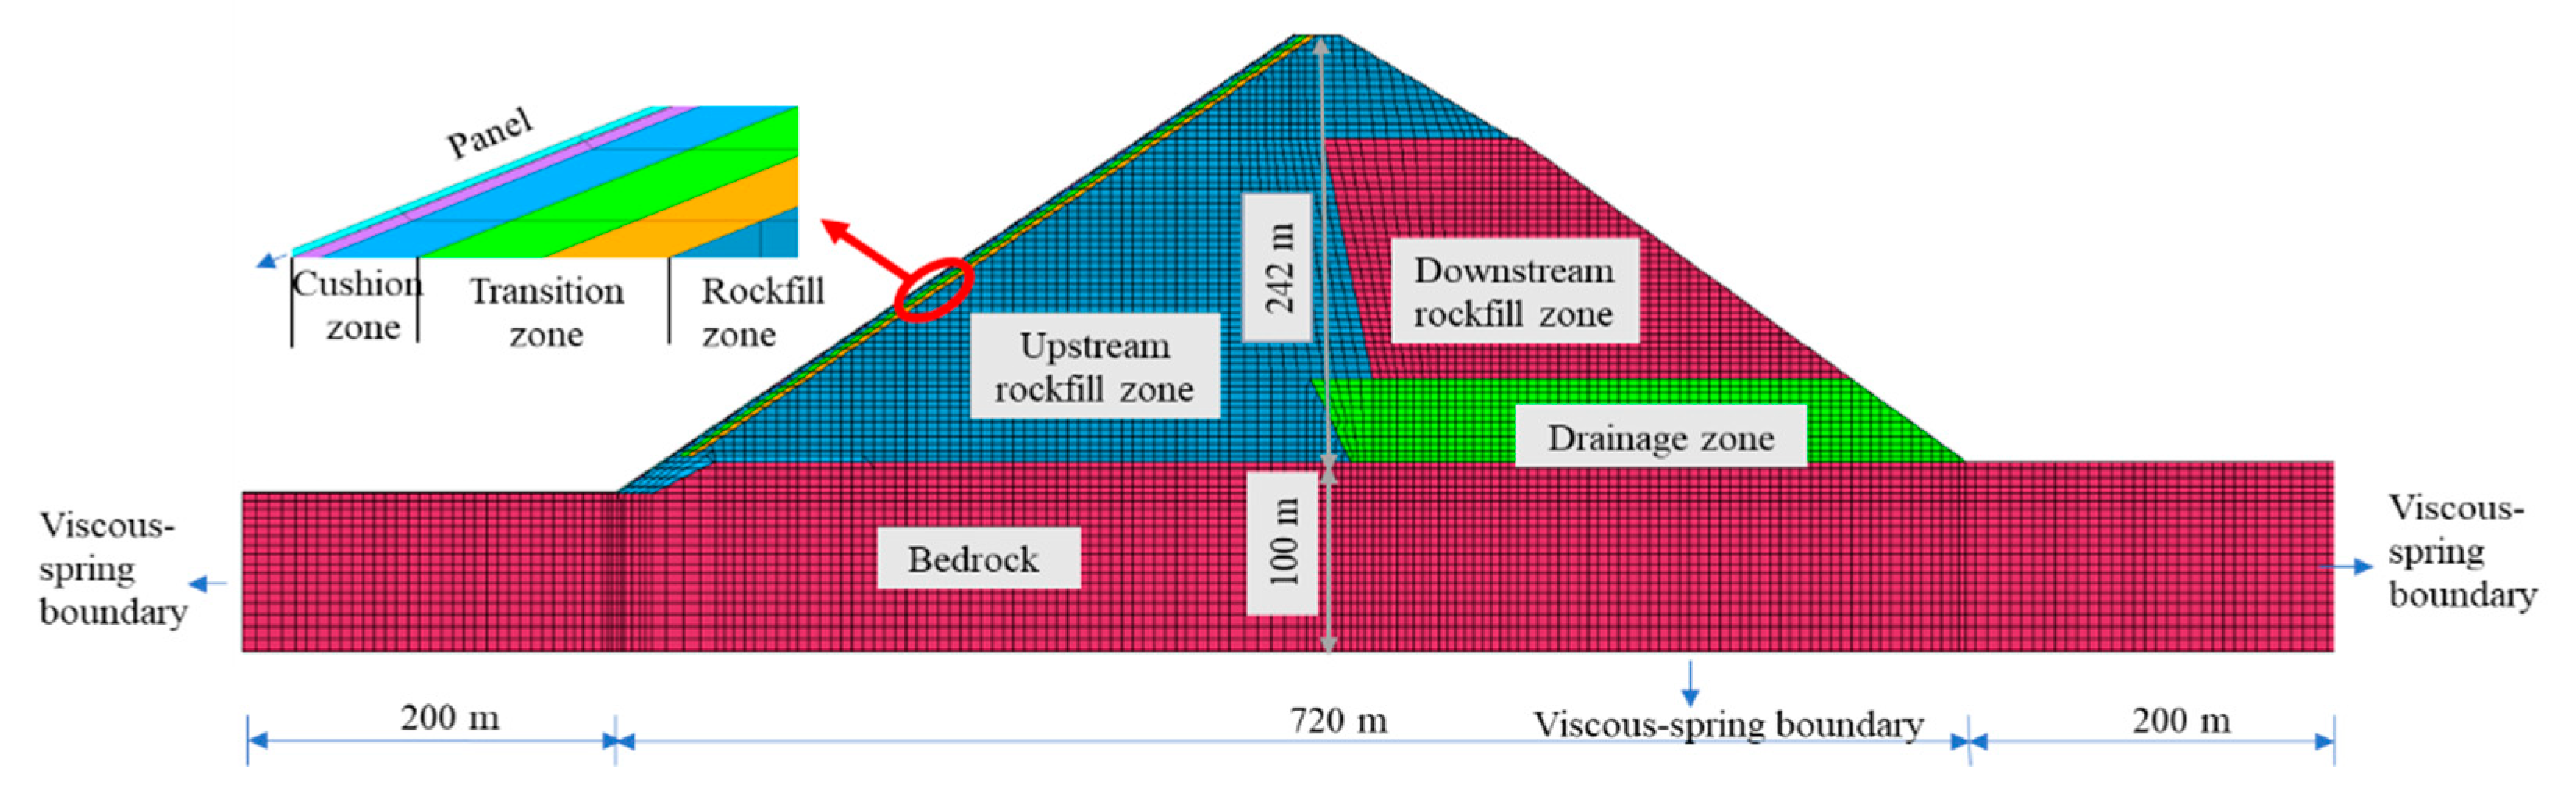
3.1. Model Establishment

This paper has used the Gushui CFRD as an example [34]. The elevation of the dam crest is 2287 m; the elevation of the dam bottom is 2042 m; the dam height is 242 m (the wave wall is not considered); the upstream dam slope is 1:1.5; the downstream dam slope above the path is 1:1.6; and the slope below the path is 1:1.5. The width of the dam crest is 20 m and the length of the dam crest is 437 m. The cushion zone and the transition zone are set under the face slab. The width of the cushion zone is 4 m, the total thickness of the transition zone is 8 m, and the face slab thickness is 0.4 m~1.24 m. The face slab was poured in three phases to 2167 m, 2235 m, and 2285 m, respectively, and the water storage was stored in two phases to 2267 m (the designed normal water level). The model was densified at the upper part of the dam, where the vertical spacing was set at 1m, considering the dam size, the research purpose, and existing studies [35,36], so the number of model nodes was 8432 and the number of elements was 8277 (Figure 1) before the application of GRSS for the dam slope. The setting of earthquake-resistant measures is shown in Figure 2. The dam element was simulated by the quadrilateral isoparametric element, which is a continuous medium block isoparametric element. The non-thickness Goodman element was used for the indirect contact surface between the panel and the cushion zone, based on the assumption that the two contact surfaces were connected by countless tiny tangential and normal springs. The contact surface and adjacent contact surface elements only had force connected at the node. The above two element types are often used in the field of earth-rock dams [37], and the accuracy meets engineering needs. After filling and water storage, static, dynamic, and two-dimensional stability calculations were carried out. The hydrodynamic pressure on the panel was simulated by the added-mass method [38].

3.2. Constitutive Model and Material Parameters

In this paper, the static calculation of rockfill is simulated by Duncan-Chang E-B model [39]. Based on Duncan Chang E-μ, volume modulus B is used instead of Poisson’s ratio ν t as the calculation parameter in Duncan-Chang E-B model, solving the problem which is quite different from the actual situation in the hyperbolic assumption. The dynamic calculation is analyzed by equivalent linear analysis method based on equivalent visco-elastic model [40]. In this paper, the static, dynamic and stability calculation are based on GEODYNA, which has good performance in the calculation of large-scale nonlinear structures [41]. Based on the dam site conditions and specifications, the static and dynamic material parameters of dam rockfill are as show in Table 1 and Table 2, comprehensively considering the existing studies [34,42,43,44,45]. The density of GRSS is taken as 2.6 × 10³ kg/m3, and the ultimate strength is 85 kN/m.

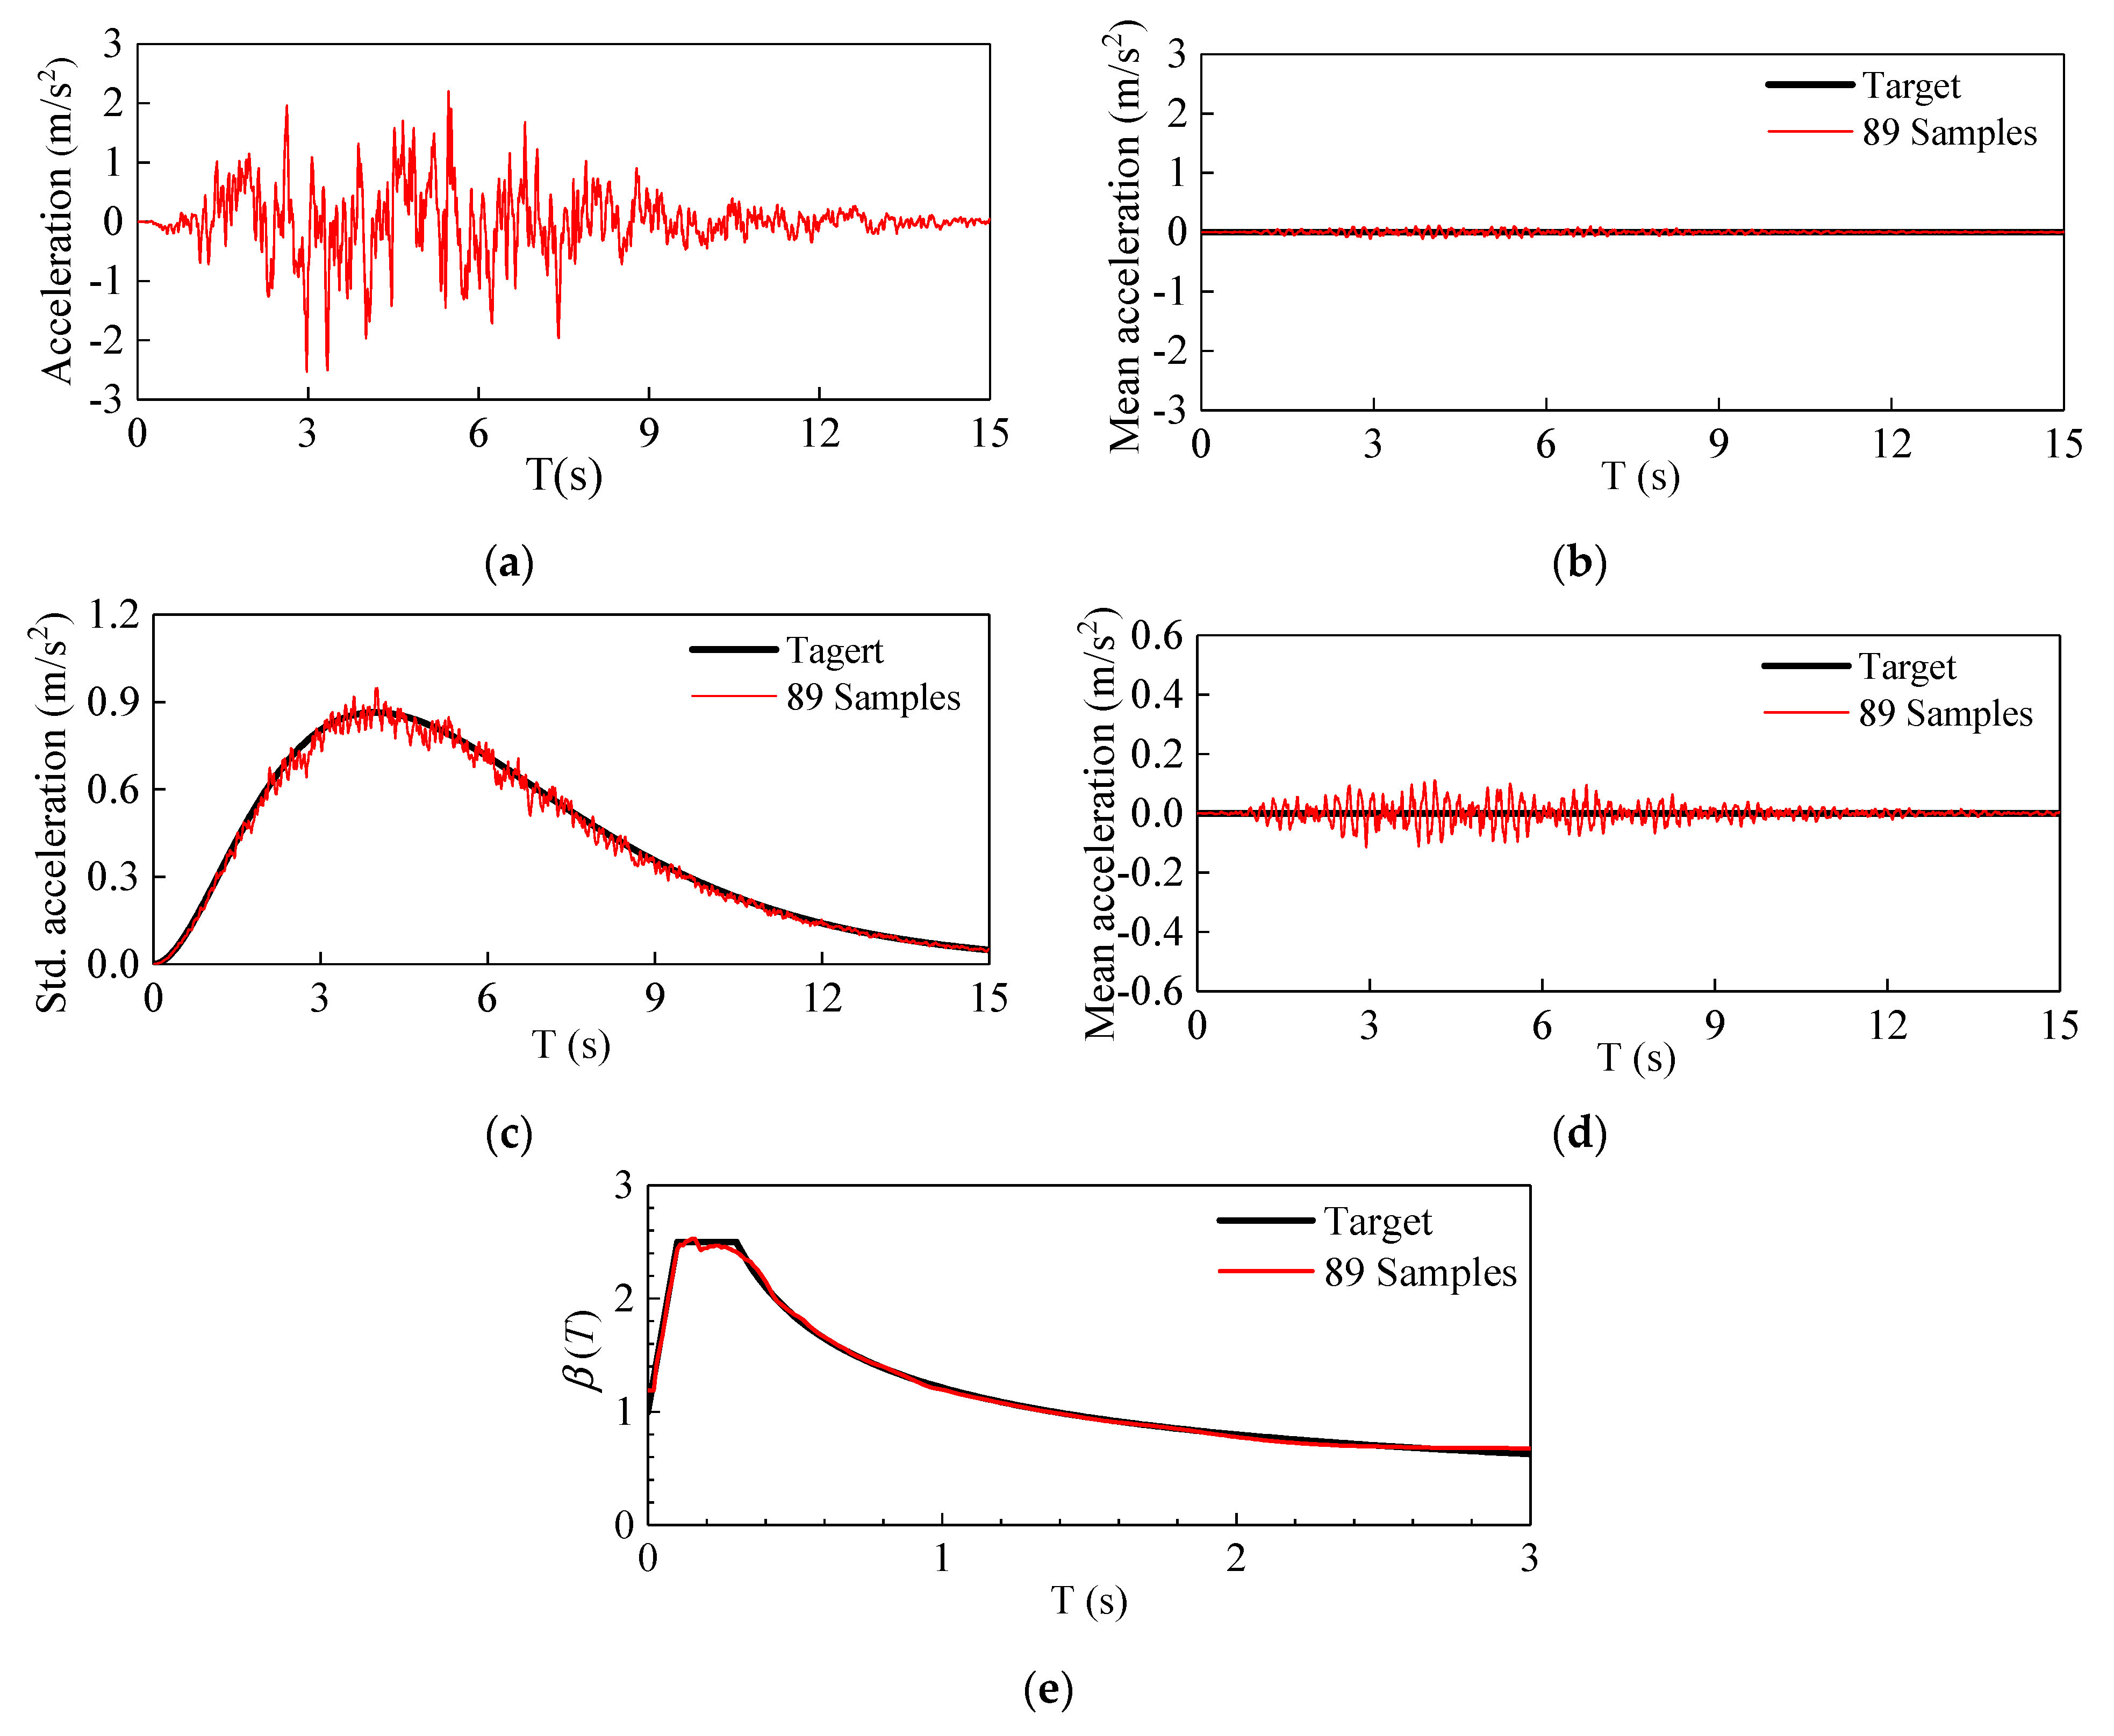
3.3. Ground Motions Input

Viscoelastic artificial boundary and equivalent node load are used for wave input [46,47] to realize ground motion input considering the radiation damping effect of infinite foundation and the influence of traveling wave effect. The horizontal PGA is 0.340 g. The vertical PGA is 2/3 of the horizontal acceleration.
This chapter uses the aforementioned spectral expression-random function non-stationary random ground motion model to generate the seismic input of 89 different action processes due to the difference of ground motions in the magnitude of ground motion frequency, the height of peak and valley value and the duration of fluctuation mode. When 89 sample acceleration time histories are generated, the error between the mean value of peak acceleration and the target value (zero) is 8.0%. The results show that the characteristics of the sample set are consistent with the target in the second-order numerical statistical sense [20]. Figure 3 shows the seismic acceleration time series information of the generated ground motion samples. Figure 3b,c show the mean and standard deviation of the generated ground motion samples. Figure 3e shows that the mean of response spectrum of 89 samples coincides with the specification spectrum in China Hydraulic Seismic Design Code (NB 35047-2015). It can be seen that the ground motions generated by the spectral expression-random function non-stationary ground motion model fit well with the target earthquake motion.

3.4. Seismic Response Analysis

In order to study the influence of GRSS on the stability of dam slope during earthquakes, based on the existing research [9,10,11] and with reference to the common parameter settings in engineering [48], the vertical spacing of GRSS layers (Sv) was set at 4 m and the length (Lmax) was set at 50 m, for comparison with the original dam slope as a typical work condition. The random dynamic response of the dam slope was analyzed, and the seismic performance of the proposed measure was evaluated from the perspective of reliability.
Eighty-nine groups of safety factor history curves were obtained by calculating the dynamic response of the high CFRD under 89 groups of random ground motions. The safety factor probability density surface (Figure 4b and Figure 5b) was solved by the finite difference method (FDM) in TVD format [26] to reflect the transmission information of the safety factor in space and time, based on the GPDEM. The PDF of the safety factor fluctuated in time and space, and the safety factor gradually concentrated with increases in time. The comparison between the two figures showed that GRSS have no significant impact on the shape of PDF as a dam safety factor.
Figure 6 shows the probability density information of the minimum safety factor before and after the application of earthquake-resistant measures, obtained by solving the equivalent extreme-value event. Before GRSS measures were taken, the average value of the minimum safety factor was 0.944 and the standard deviation was 0.131. After the measures were taken, the average value of the minimum safety factor increased to 1.003 and the standard deviation decreased to 0.105 (Figure 6a). The calculation results of the reinforced slopes showed that the minimum safety factor not only improved in value, but also reduced in dispersion, which indicated that GRSS can not only maintain the stability of a dam body when encountering earthquakes, but also improve the stability of the overall response of the dam body when encountering different ground motions. Similar conclusions were also reached in Figure 6b; that is, GRSS are conducive to improving the reliability of a dam under random ground motions.

3.5. Reliability Analysis of Dam

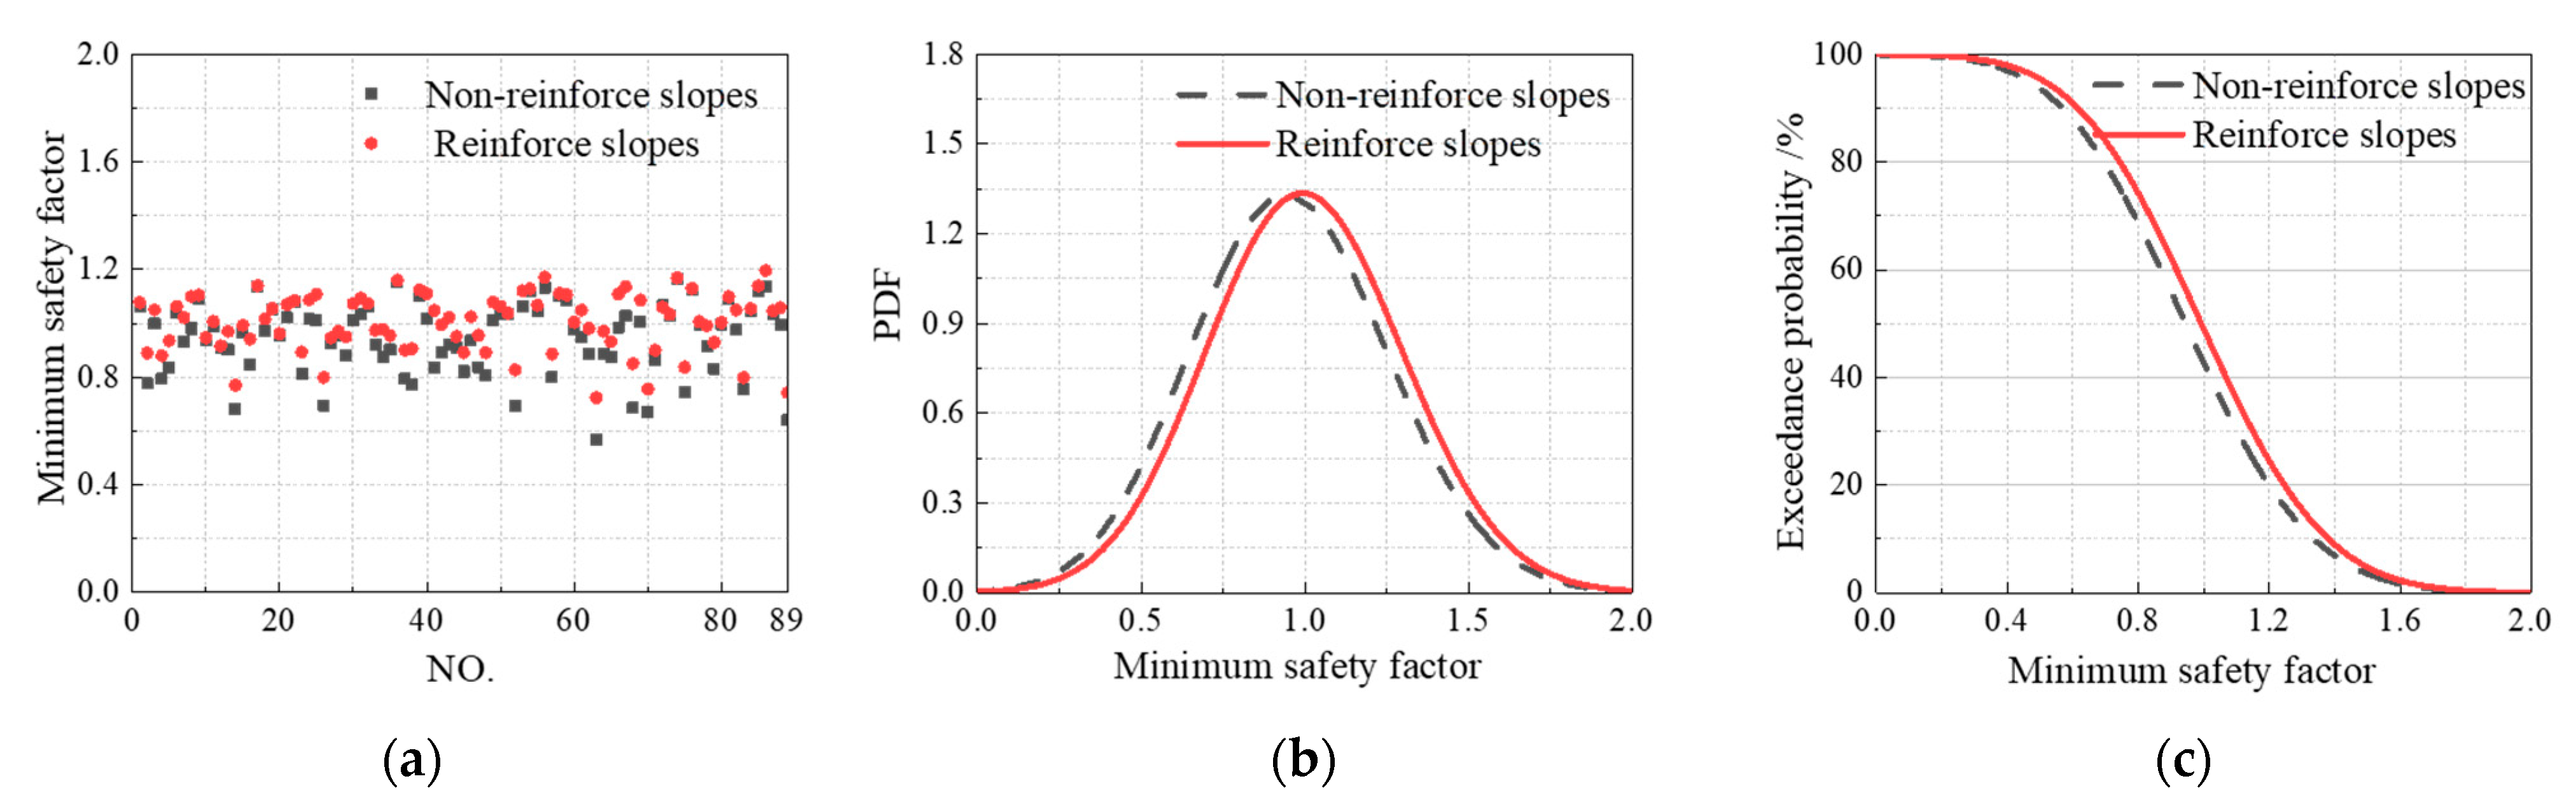
3.5.1. Overall Stability Analysis of Dam Body

In this section, the probability density function of the cumulative time of Fs < 1.0 was solved by constructing a virtual random process to analyze the stability of non-reinforced slopes and reinforced slopes, based on the 89 groups of random ground motions referred to in Section 3.3. Under different seismic ground motions, the maximum value of the cumulative time of the original dam body was 1.43 s, which was quite different from the minimum value of 0 s (Figure 7a); the seismic performance of the proposed measure in reducing cumulative time was inconsistent, indicating the need to analyze the seismic performance of earthquake-resistant measures from the stochastic perspective.
According to the aforementioned standard, the probability of a mild failure of the original dam slopes was large, up to more than 50%, while it was not easy to cause moderate or severe damage, as GRSS have an obvious effect in maintaining the stability of the dam slope (Table 3).

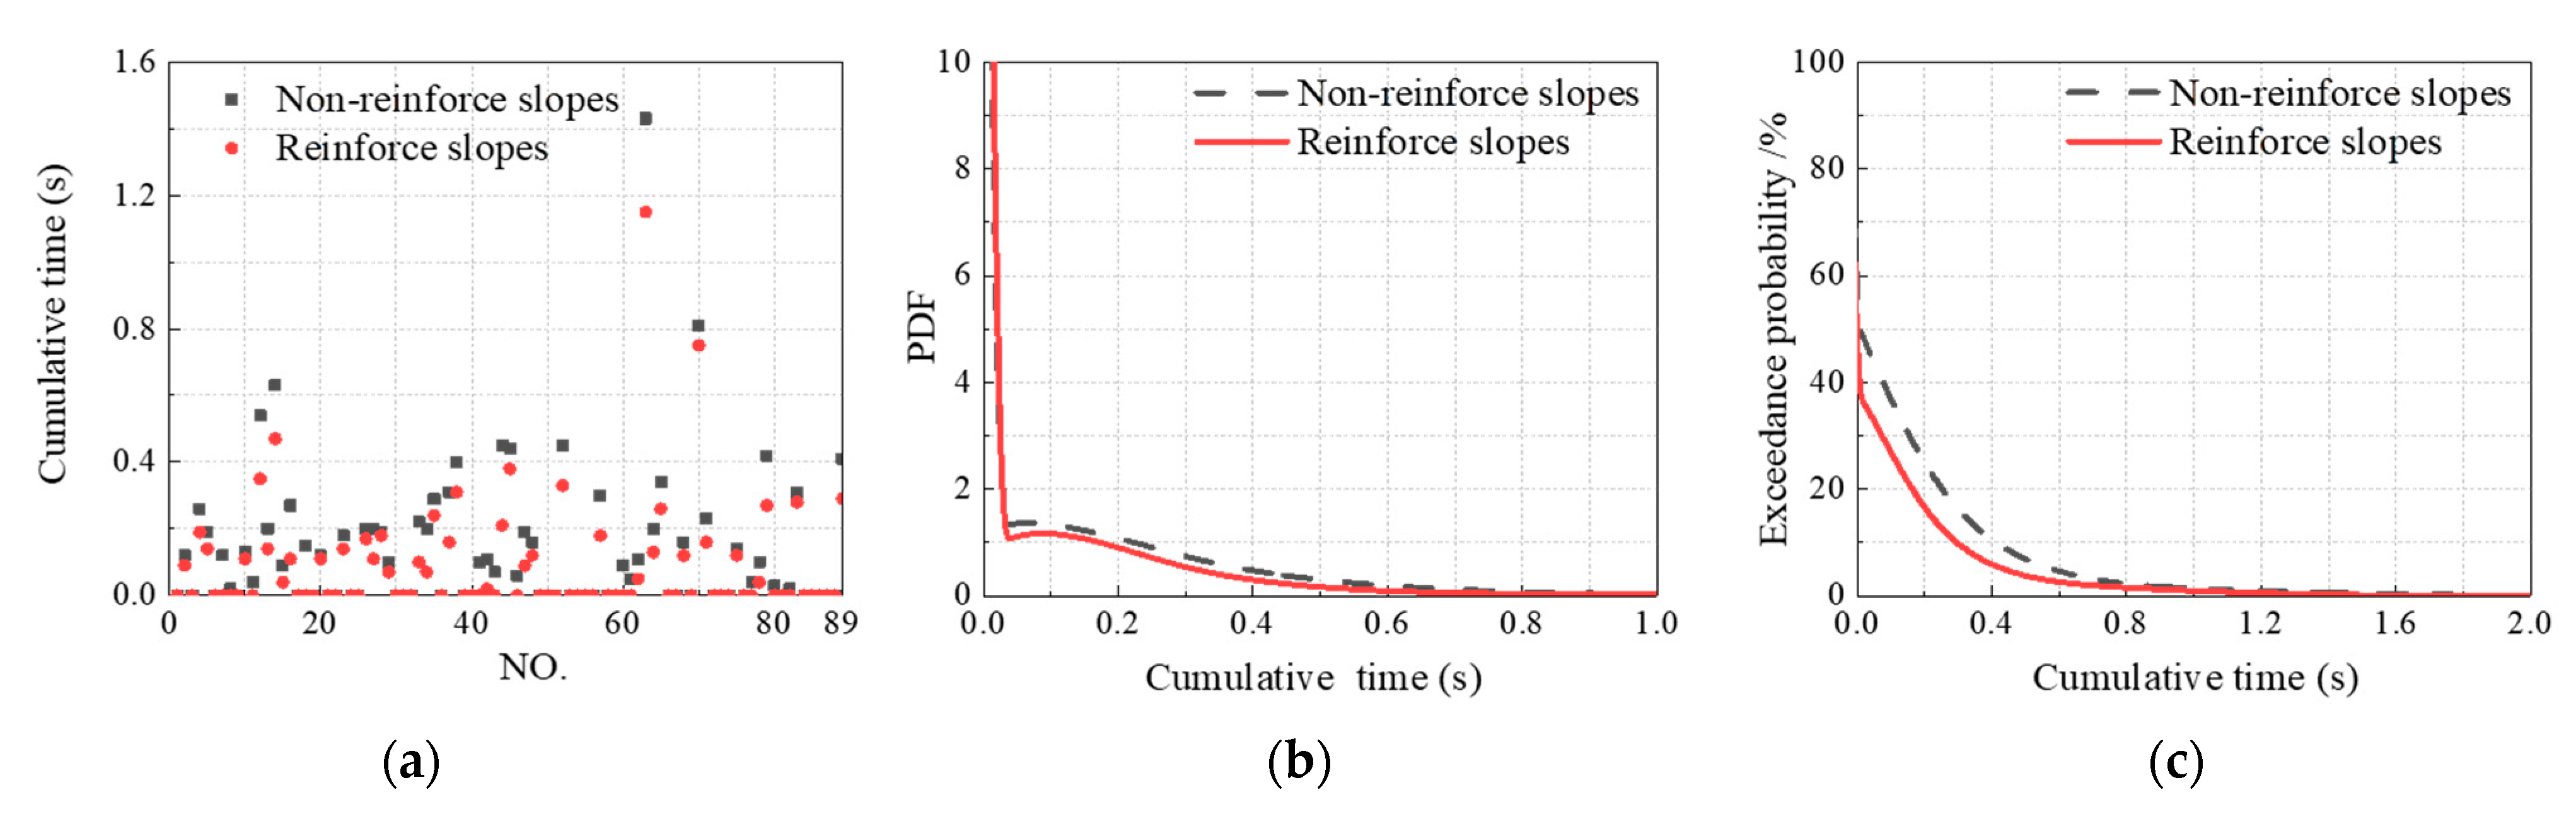
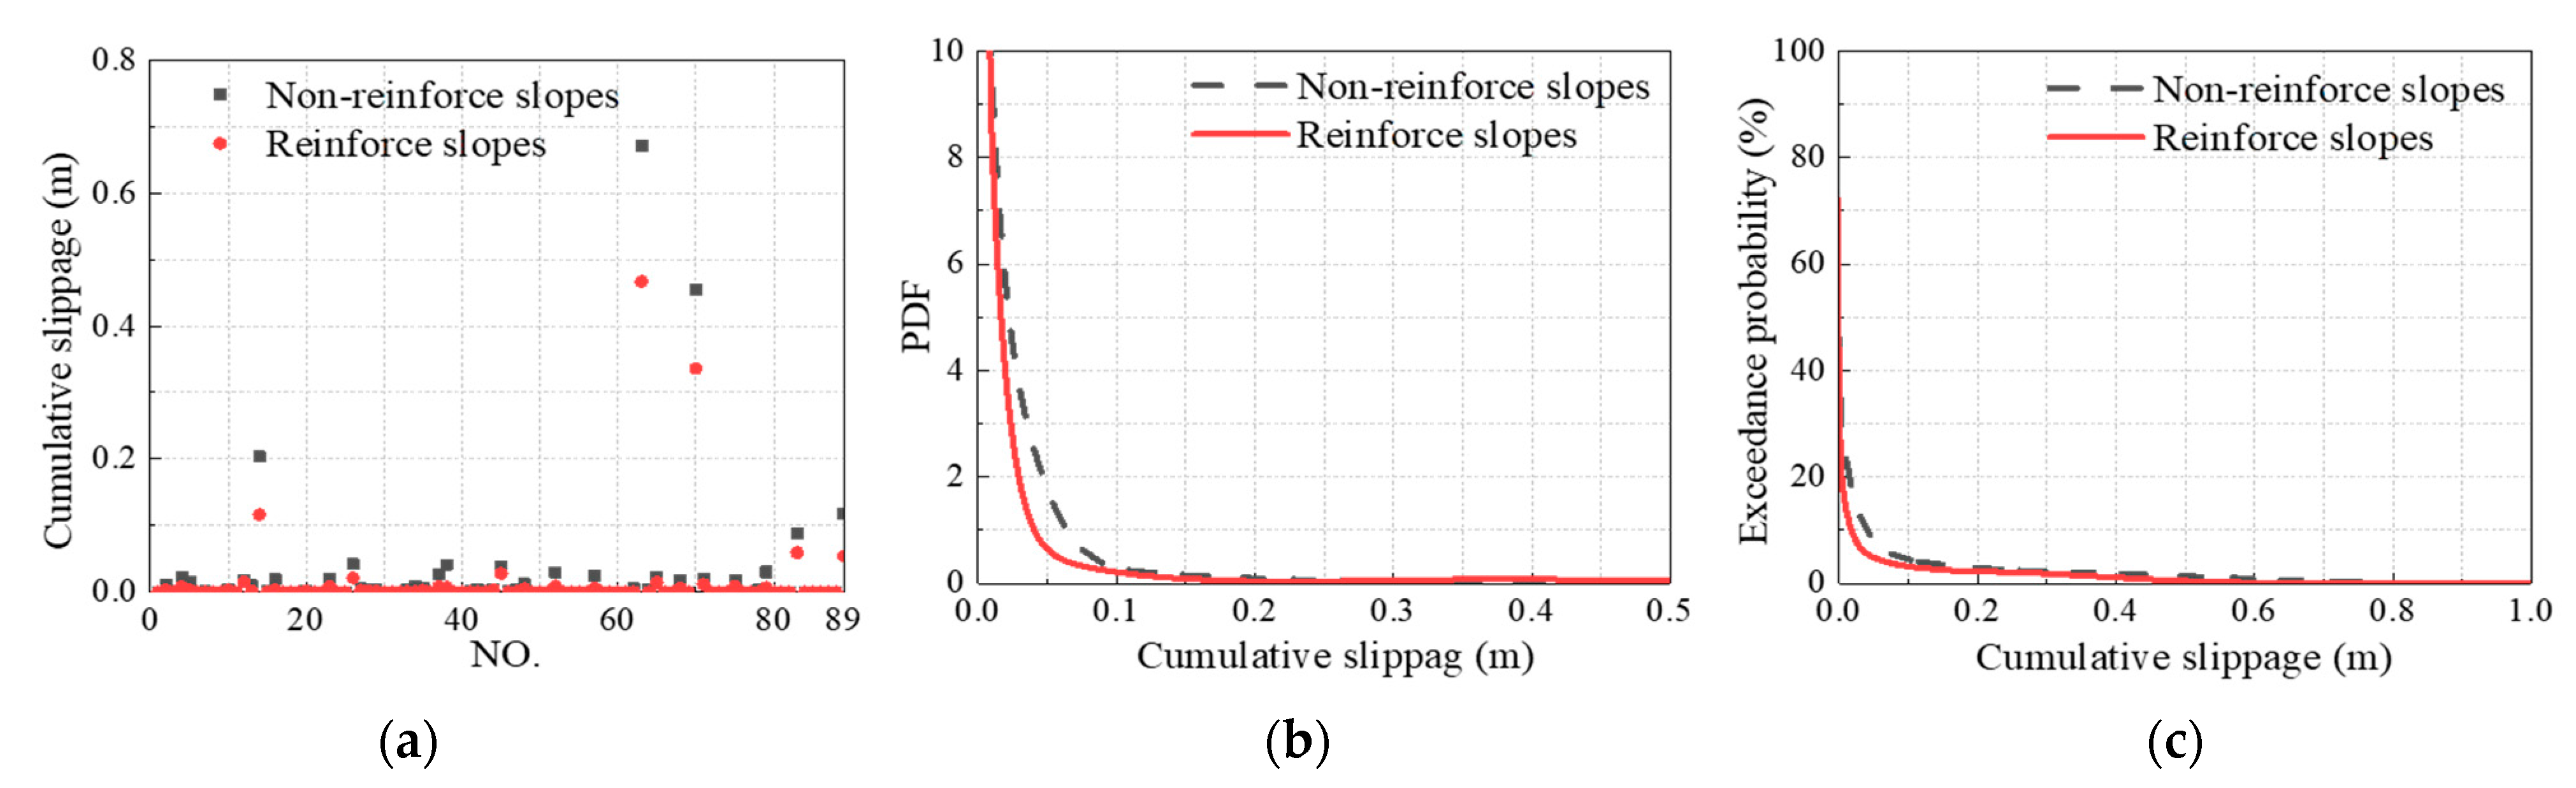
3.5.2. Analysis of Local Sliding Failure of Dam Slope

Figure 8 and Table 4 show the probability information of cumulative slippage of dam slopes under random ground motions. According to the calculated results, smaller parts of ground motions will generate local sliding of a CFRD under proposed seismic ground motions, and the failure probability of moderate or severe sliding of the dam slope is small. From the perspective of reliability, the proposed measure has an obvious inhibitory effect on the local sliding of the dam slope.

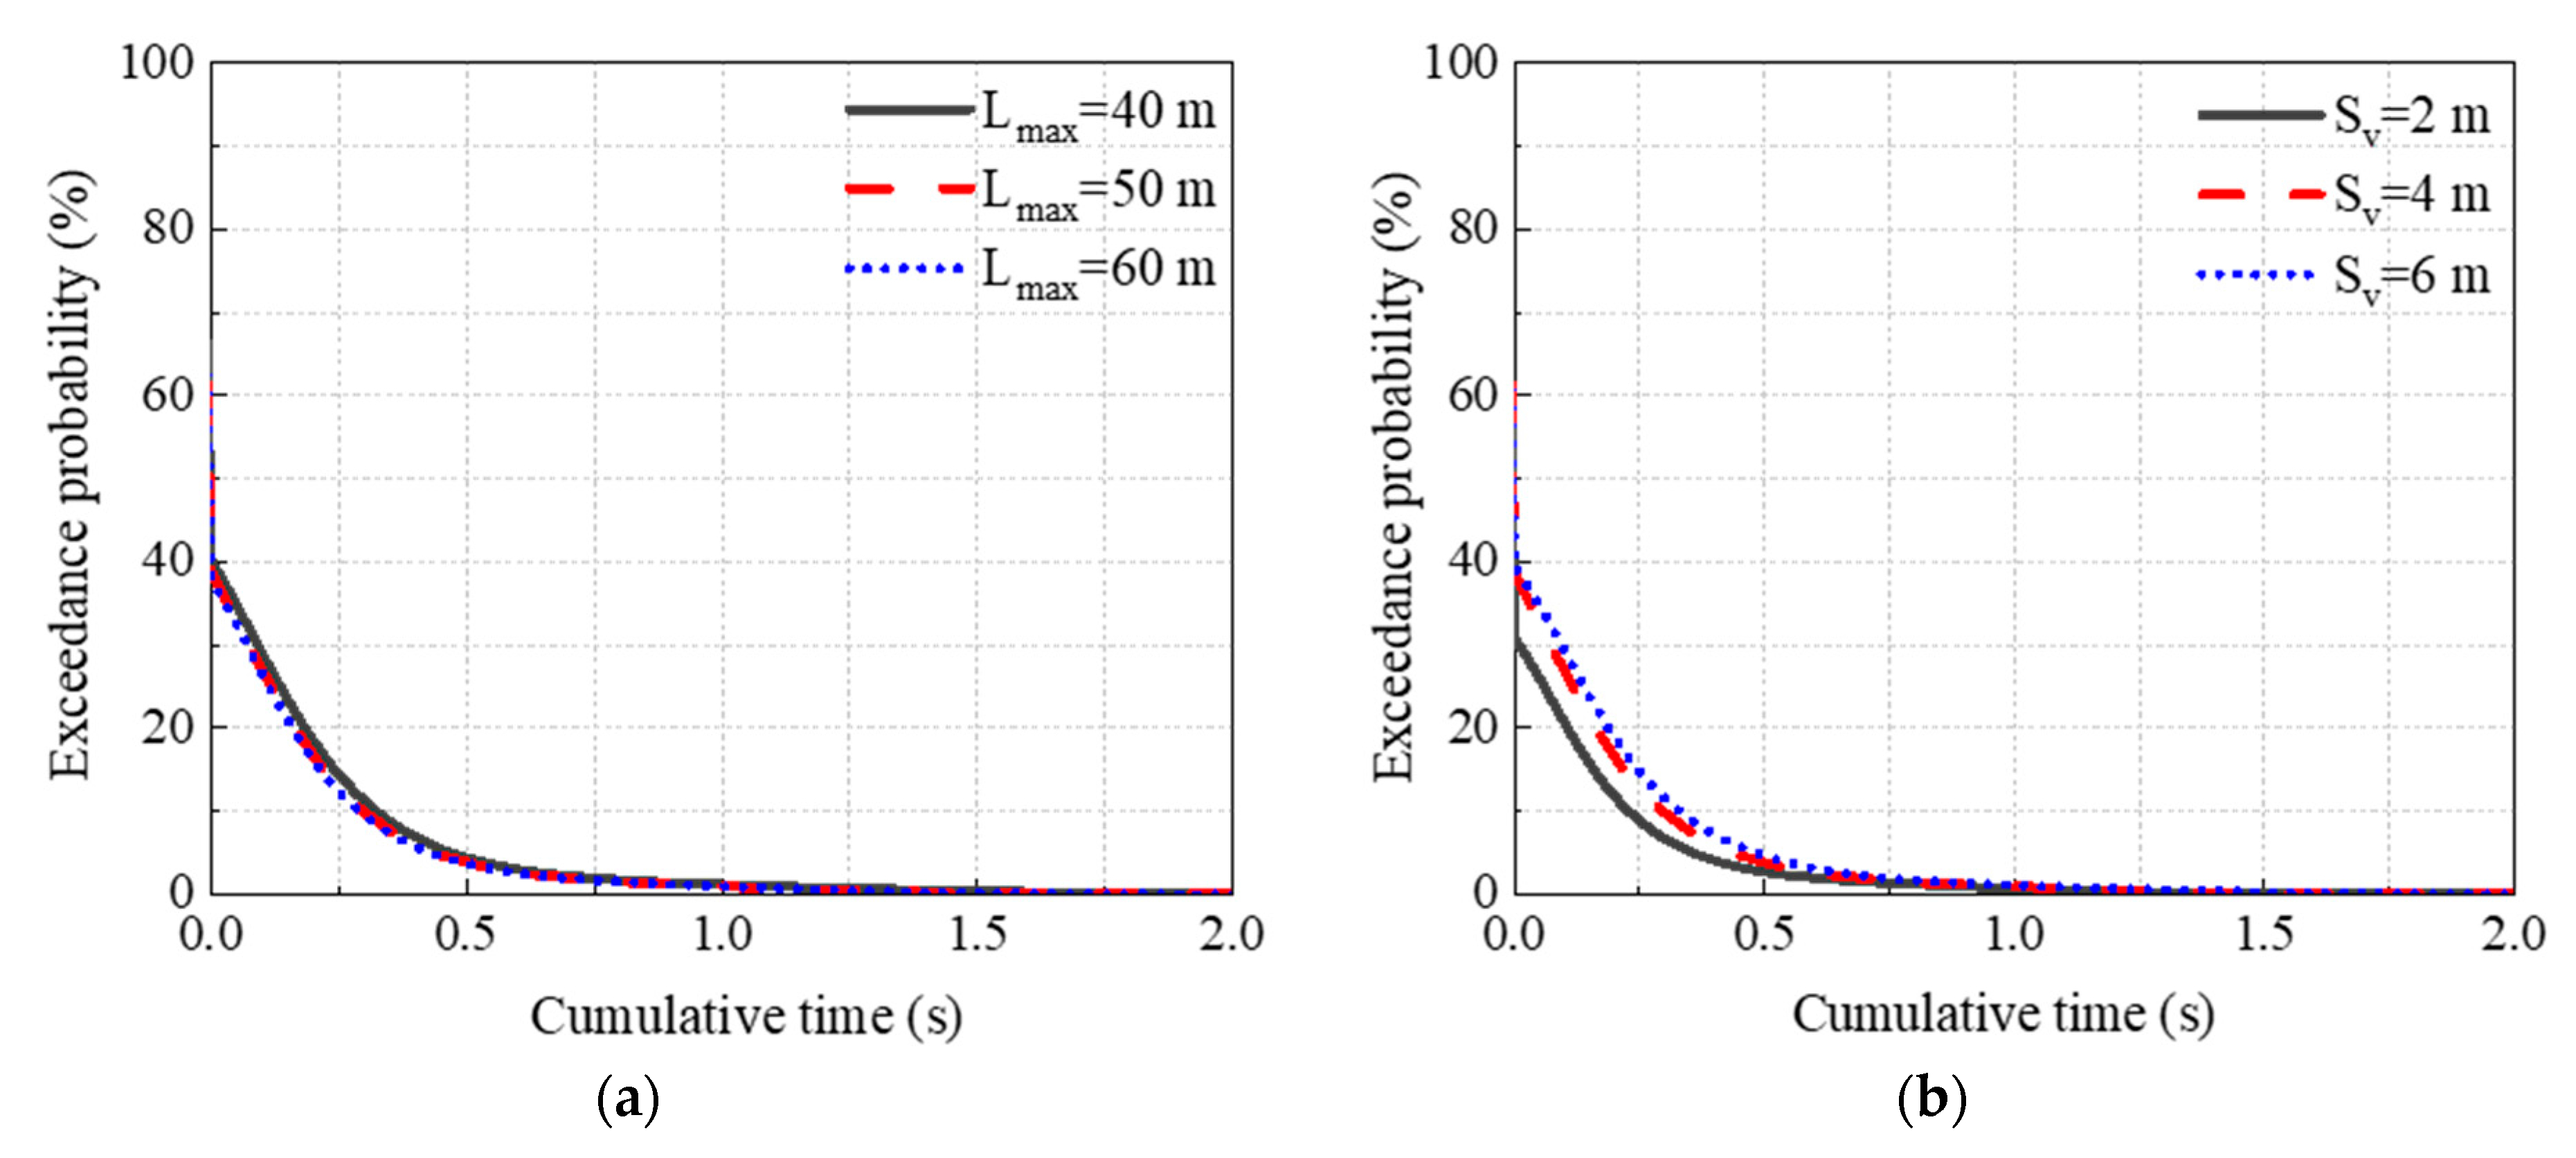
3.6. Analysis on Influenceing Factors of GRSS Performance

In this section, failure probability was calculated by adjusting the length and vertical spacing of reinforcement based on the 89 groups of random ground motions as described in Section 3.3. The influence of reinforcement-setting on the seismic performance of GRSS was considered, to find the optimal GRSS setting from the perspective of reliability, which can be used to provide a reference for the design of earthquake-resistant measures, considering both project costs and effects.

3.6.1. Impact on Maintaining Overall Stability

In order to analyze the influence of the length and vertical spacing of reinforcement on the stability of CFRD slopes, this section kept other factors unchanged, while different characteristic lengths (Lmax = 40 m, 50 m, and 60 m) and characteristic vertical spacings (Sv = 2 m, 4 m, and 6 m) of GRSS were selected according to previous engineering experience and the research of previous literature [11,12]. The equivalent extreme values were calculated based on the GPDEM for the cumulative time of Fs < 1.0 (as shown in Figure 9). The results showed that with other factors unchanged, the reliability of CFRD increased with the increase in reinforcement length and decreased with the increase in reinforcement vertical spacing. The probability of mild failure of dam slope followed an order of 40.10%, 37.96%, and 37.80%, with the increases in the length of reinforcement. It can be seen that when the length increased to more than 50 m, the stability reliability of dam slope did not increase significantly. With the increase in vertical spacing, the probability of mild failure of dam slope was 30.73%, 37.96%, and 39.47%, respectively. Other failure conditions were similar, proving that the stability of dam slope decreases significantly when reinforcement spacing is expanded from 2 m to 4 m (Table 5).
Table 5 compares and analyzes the consistency risk of various working conditions based on performance. Taking working condition 1 (with GRSS vertical spacing of 2 m and length of 50 m) as an example, under random ground motion with a GPA of 0.340 g, the probability of mild failure, moderate failure, and severe failure of the dam slope followed an order of 30.73%, 2.69%, and 0.06%, respectively. The probability basically did not reach the situation of local dam-break, which implied that the overall stability reliability of the dam slope was high when the vertical spacing of the geogrid reinforcement was 2 m and the length was 50 m. Even if damage occurred, it was mild and easy to repair, and had little economic or social impact under condition 1. The analysis of other working conditions is similar. These findings can provide a reference for the reliability analysis of GRSS in engineering.

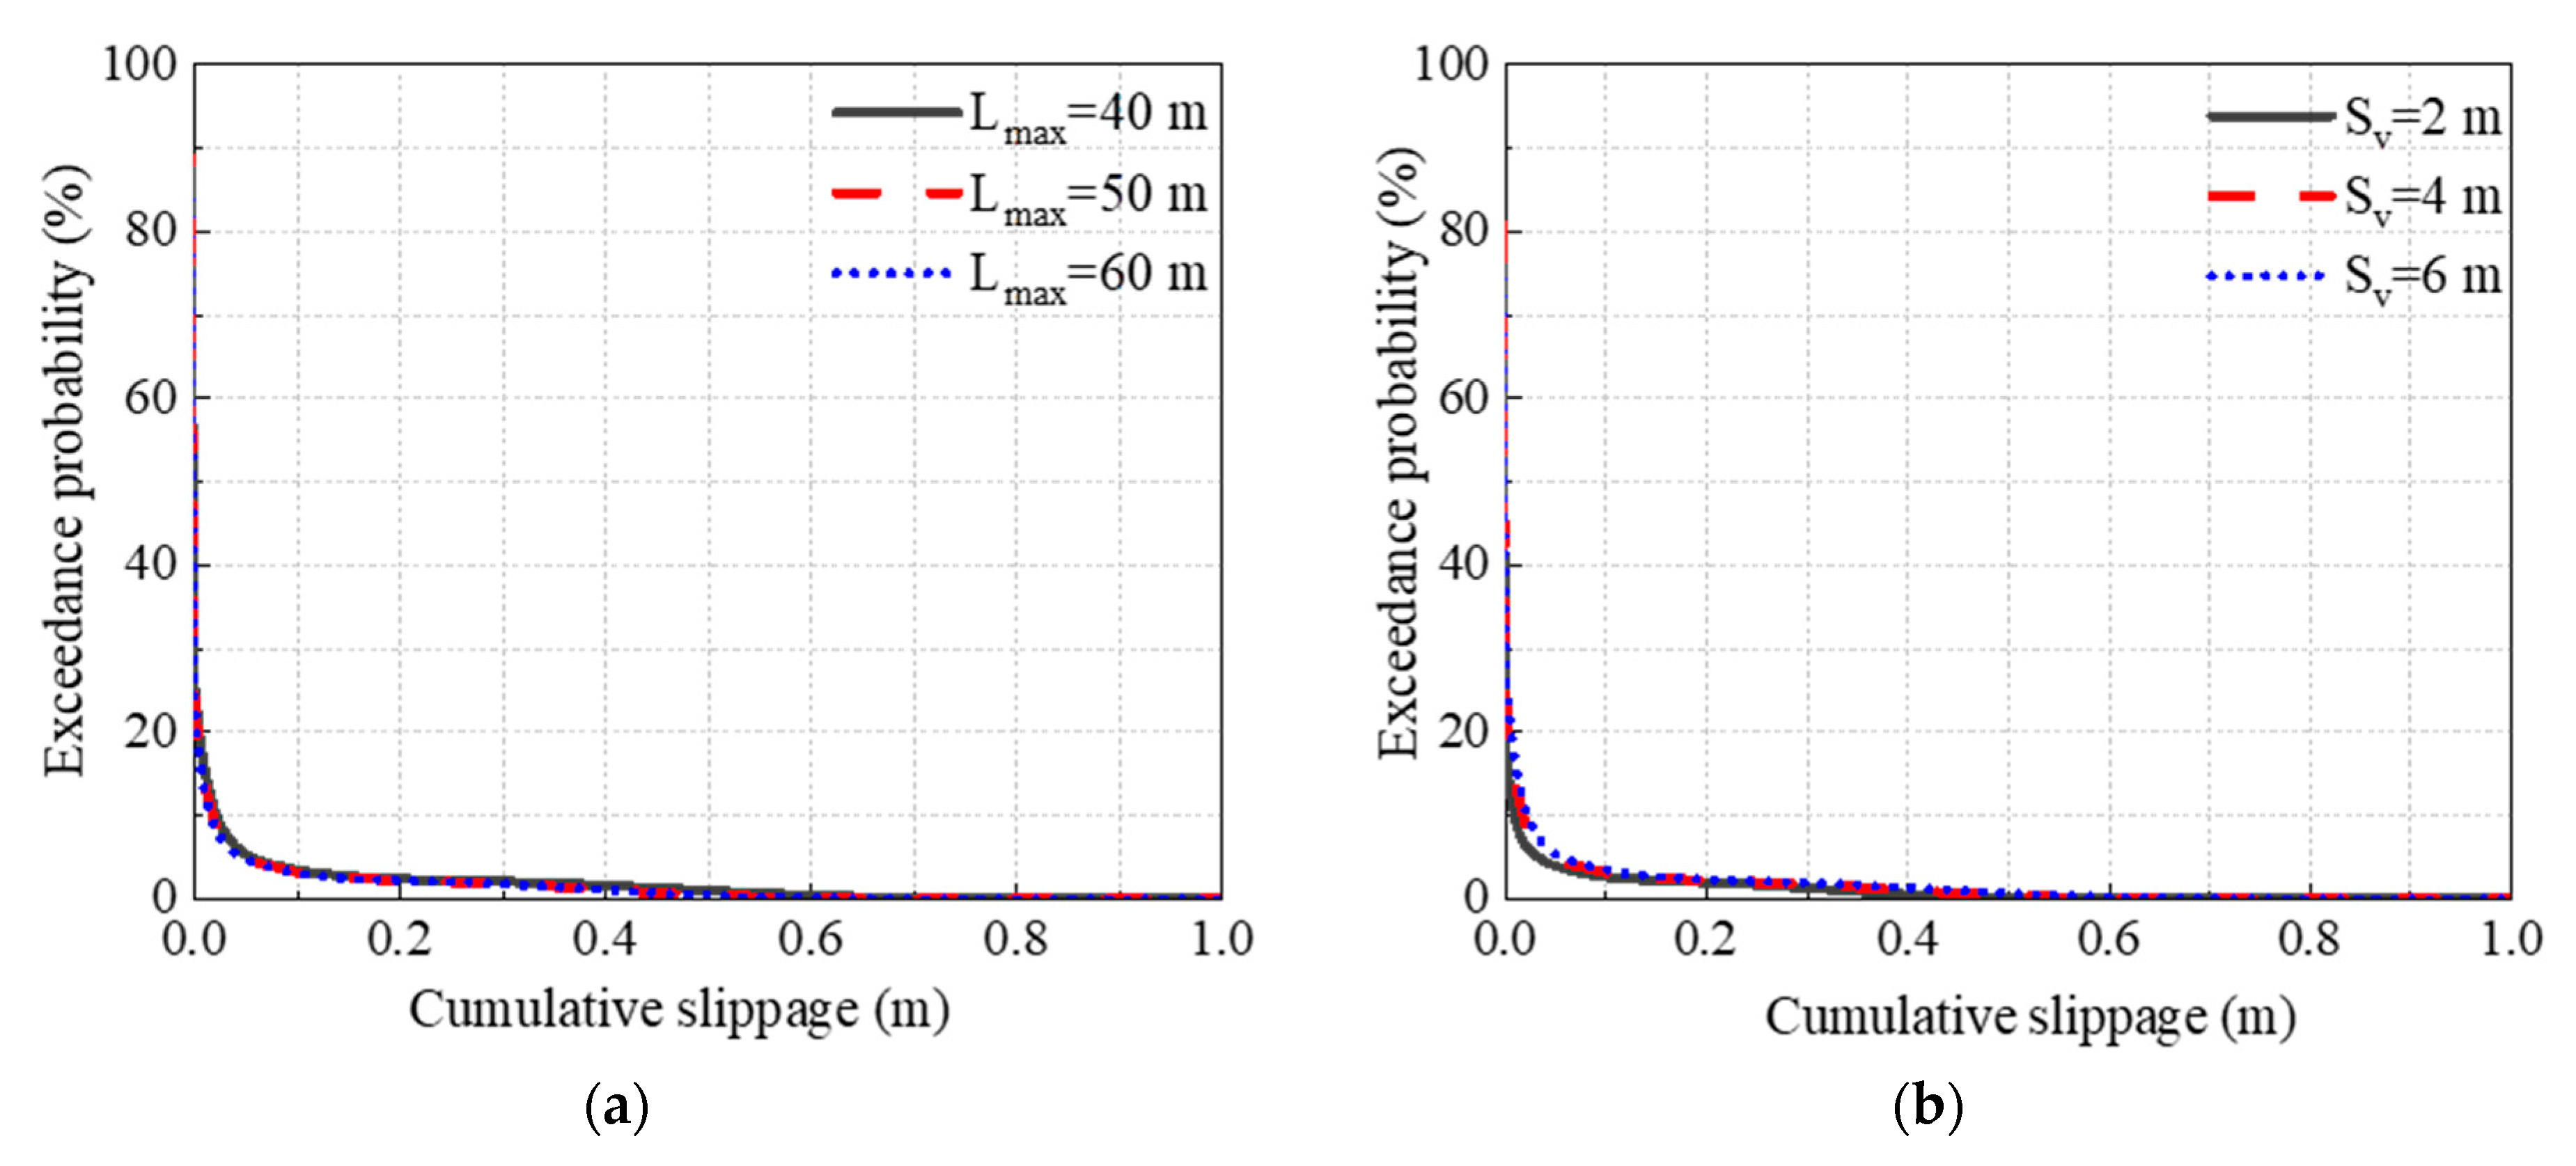
3.6.2. Influence on Restraining Local Sliding Failure

Similarly, in order to study the influence of adjusting the length and vertical spacing of GRSS on the local sliding of concrete-face rockfill dams subjected to earthquakes, different lengths and vertical spacings of geogrid reinforcement were adopted in this section, and the cumulative sliding index was then calculated. Taking mild failure as an example, with an increase in reinforcement length, the probability of mild failure of dam slope followed an order of 25.41%, 23.63%, and 23.07% under the random ground motions with GPA of 0.340 g. With increases in reinforcement vertical spacing, the probability was 18.05%, 23.63%, and 26.52%, respectively. Moderate failure was similar, indicating that the local sliding failure probability of CFRD decreases with an increase in reinforcement length and increases with an increase in reinforcement spacing (Figure 10 and Table 6).

4. Conclusions

In this paper, the reliability of the seismic performance of GRSS was evaluated from the perspective of probability and the influence of factors on performance. The conclusions were as follows:
(1)
A set of reliability analysis systems of high CFRDs was established by combining a non-stationary ground motion model, a generalized probability density evolution theory, and multi-evaluation indicators, providing a method for the evaluation of seismic performance of earthquake-resistant measures.
(2)
GRSS can not only maintain the stability of a dam body during an earthquake; it can also improve the stability of the overall response of a dam under different ground motions.
(3)
The dam slope of the Gushui CFRD is more susceptible to slight damage under random ground motions with a PGA of 0.340 g, with a certain probability of moderate damage and a lower probability of severe damage. The calculation results showed that the seismic performance of GRSS can inhibit mild damage of 20–30% of ground motion samples and avoid severe damage with a high probability.
(4)
With an increase in geogrid reinforcement length and a decrease in vertical spacing, the seismic performance in maintaining dam slope stability increases due to strong constraints. However, the increase in reinforcement length has little influence on the performance of GRSS. When reinforcement vertical spacing is reduced from 4 m to 2 m, the reduction in the earthquake-resistant effect of GRSS is relatively obvious. This is conducive to actual engineering design, considering economics and seismic performance.

Author Contributions

Data curation, X.D.; Methodology, B.X.; Writing—original draft, Z.R.; Writing—review & editing, X.Y. All authors have read and agreed to the published version of the manuscript.

Funding

This research was supported by the Natural Science Foundation of China (No. 51809034, 51779034), Open Found of State Key Laboratory of Coastal and Offshore Engineering, Dalian University of Technology (No. LP2014), China Postdoctoral Science Foundation (No. 2021M692938) and Henan Postdoctoral Foundation (No. 202002022).

Data Availability Statement

All data, models, and code generated or used during the study appear in the submitted article.

Conflicts of Interest

The authors declare no conflict of interest.

References

  1. Chen, S.; Fu, Z.; Wei, K.; Han, H. Seismic Responses of High Concrete Face Rockfill Dams: A Case Study. Water Sci. Eng. 2016, 9, 195–204. [Google Scholar] [CrossRef] [Green Version]
  2. Zhou, Y.; Zhang, Y.; Pang, R.; Xu, B. Seismic Fragility Analysis of High Concrete Faced Rockfill Dams Based on Plastic Failure with Support Vector Machine. Soil Dyn. Earthq. Eng. 2021, 144, 106587. [Google Scholar] [CrossRef]
  3. Zhang, J.M.; Yang, Z.; Gao, X.; Zhang, J. Geotechnical Aspects and Seismic Damage of the 156-m-High Zipingpu Concrete-Faced Rockfill Dam Following the Ms 8.0 Wenchuan Earthquake. Soil Dyn. Earthq. Eng. 2015, 76, 145–156. [Google Scholar] [CrossRef]
  4. Liu, H.; Chen, Y.; Yu, T.; Yang, G. Seismic Analysis of the Zipingpu Concrete-Faced Rockfill Dam Response to the 2008 Wenchuan, China, Earthquake. J. Perform. Constr. Facil. 2015, 29, 04014129. [Google Scholar] [CrossRef]
  5. Ling, H.I.; Leshchinsky, D.; Perry, E.B. Seismic Design and Performance of Geosynthetic-Reinforced Soil Structures. Géotechnique 1997, 47, 933–952. [Google Scholar] [CrossRef]
  6. Ling, H.I.; Leshchinsky, D. Effects of Vertical Acceleration on Seismic Design of Geosynthetic-Reinforced Soil Structures. Géotechnique 1998, 48, 347–373. [Google Scholar] [CrossRef]
  7. Li, H.J.; Chi, S.C.; Li, G. Seismic Stability Analysis of Reinforced Slope of High Core Rockfill Dam. Chin. J. Geotech. Eng. 2007, 29, 1881–1887. (In Chinese) [Google Scholar] [CrossRef]
  8. Noorzad, R.; Omidvar, M. Seismic Displacement Analysis of Embankment Dams with Reinforced Cohesive Shell. Soil Dyn. Earthq. Eng. 2010, 30, 1149–1157. [Google Scholar] [CrossRef]
  9. Zhu, Y.; Kong, X.; Zou, D.; Zhu, S. Dynamic Elastoplastic Analysis of Geogrid Reinforced High Earth Rockfill Dam. J. Hydraul. Eng. 2012, 43, 1478–1486. (In Chinese) [Google Scholar]
  10. Yang, X.; Chi, S.; Lu, X. Upper Limit Analysis of Seismic Stability of Reinforced Earth Rock Dam Slope. J. Hydraul. Eng. 2014, 45, 304–311. (In Chinese) [Google Scholar] [CrossRef]
  11. Glovatsky, O.; Hamdamov, B.; Bekchanov, F.; Saparov, A. Strengthening Technology and Modeling of Dams from Reinforced Soil. IOP Conf. Ser. Mater. Sci. Eng. 2021, 1030, 012155. [Google Scholar] [CrossRef]
  12. Peng, M.; Sun, R.; Chen, J.-F.; Zhang, L.-M.; Yu, S.-B. Stochastic Seismic Analysis of Geosynthetic-Reinforced Soil Slopes Using the Probability Density Evolution Method. Comput. Geotech. 2021, 140, 104485. [Google Scholar] [CrossRef]
  13. Hariri-Ardebili, M.A. Risk, Reliability, Resilience (R 3) and beyond in Dam Engineering: A State-of-the-Art Review. Int. J. Disaster Risk Reduct. 2018, 31, 806–831. [Google Scholar] [CrossRef]
  14. Kartal, M.E.; Bayraktar, A.; Başağa, H.B. Seismic Failure Probability of Concrete Slab on CFR Dams with Welded and Friction Contacts by Response Surface Method. Soil Dyn. Earthq. Eng. 2010, 30, 1383–1399. [Google Scholar] [CrossRef]
  15. Li, Y.; Tang, W.; Wen, L.; Wang, J. Study on Seismic Failure Probability of High Earth-Rock Dam Considering Dam Body Deformation and Slope Stability. Eur. J. Environ. Civ. Eng. 2020, 1–15. [Google Scholar] [CrossRef]
  16. Zai, D.; Pang, R.; Xu, B.; Fan, Q.; Jing, M. Slope System Stability Reliability Analysis with Multi-Parameters Using Generalized Probability Density Evolution Method. Bull. Eng. Geol. Environ. 2021, 80, 8419–8431. [Google Scholar] [CrossRef]
  17. Pang, R.; Xu, B.; Zhou, Y.; Song, L. Seismic Time-History Response and System Reliability Analysis of Slopes Considering Uncertainty of Multi-Parameters and Earthquake Excitations. Comput. Geotech. 2021, 136, 104245. [Google Scholar] [CrossRef]
  18. Pang, R.; Xu, B.; Zou, D.; Kong, X. Stochastic Seismic Performance Assessment of High CFRDs Based on Generalized Probability Density Evolution Method. Comput. Geotech. 2018, 97, 233–245. [Google Scholar] [CrossRef]
  19. Deodatis, G. Non-Stationary Stochastic Vector Processes: Seismic Ground Motion Applications. Probabilistic Eng. Mech. 1996, 11, 149–167. [Google Scholar] [CrossRef]
  20. Liu, Z.; Liu, W.; Peng, Y. Random Function Based Spectral Representation of Stationary and Non-Stationary Stochastic Processes. Probabilistic Eng. Mech. 2016, 45, 115–126. [Google Scholar] [CrossRef]
  21. Zhou, Y.; Xu, B.; Pang, R.; Zou, D.; Kong, X. Stochastic Seismic Response and Stability Reliability Analysis of a Vertical Retaining Wall in Front of the Pumping Station of a Nuclear Power Plant Using the Probability Density Evolution Method. Nuclear Eng. Design 2018, 334, 110–120. [Google Scholar] [CrossRef]
  22. Jacobson, R.A.; Bracewell, R.N. The Hartley Transform. Math. Comput. 1987, 48, 847. [Google Scholar] [CrossRef]
  23. Li, J.; Chen, J.B. Probability Density Evolution Method for Dynamic Response Analysis of Structures with Uncertain Parameters. Comput. Mech. 2004, 34, 400–409. [Google Scholar] [CrossRef]
  24. Li, J.; Chen, J. The Number Theoretical Method in Response Analysis of Nonlinear Stochastic Structures. Comput. Mech. 2007, 39, 693–708. [Google Scholar] [CrossRef]
  25. Li, J. Probability Density Evolution Method: Background, Significance and Recent Developments. Probabilistic Eng. Mech. 2016, 44, 111–117. [Google Scholar] [CrossRef]
  26. Li, J.; Chen, J. The Principle of Preservation of Probability and the Generalized Density Evolution Equation. Struct. Saf. 2008, 30, 65–77. [Google Scholar] [CrossRef]
  27. Pang, R.; Xu, B.; Kong, X.; Zhou, Y.; Zou, D. Seismic Performance Evaluation of High CFRD Slopes Subjected to Near-Fault Ground Motions Based on Generalized Probability Density Evolution Method. Eng. Geol. 2018, 246, 391–401. [Google Scholar] [CrossRef]
  28. Li, J.; Chen, J.; Fan, W. The Equivalent Extreme-Value Event and Evaluation of the Structural System Reliability. Struct. Saf. 2007, 29, 112–131. [Google Scholar] [CrossRef]
  29. Newmark, N.M. Effects of Earthquakes on Dams and Embankments. Géotechnique 1965, 15, 139–160. [Google Scholar] [CrossRef] [Green Version]
  30. Ling, H.I.; Leshchinsky, D.; Mohri, Y. Soil Slopes under Combined Horizontal and Vertical Seismic Accelerations. Earthq. Engng. Struct. Dyn. 1997, 26, 1231–1241. [Google Scholar] [CrossRef]
  31. Softening of Rockfill Based on Generalized Probability Density Evolution Method. Soil Dyn. Earthq. Eng. 2018, 107, 96–107. [CrossRef]
  32. Ozkan, M.Y. A Review of Considerations on Seismic Safety of Embankments and Earth and Rock-fill Dams. Soil Dyn. Earthq. Eng. 1998, 17, 439–458. [Google Scholar] [CrossRef]
  33. Darbre, G.R. Swiss Guidelines for the Earthquake Safety of Dams. In Proceedings of the 13th WCEE 2004, Vancouver, BC, Canada, 1–6 August 2004. [Google Scholar]
  34. Feng, Y.L.; Chen, Y.; Lei, H.J. Research Results on Safety Index and Design Engineering Measures of Gushui High Face Rockfill Dam. In Technology for Earth-Rockfill Dam; China Electric Power Press: Beijing, China, 2015. (In Chinese) [Google Scholar]
  35. Kong, X.; Zhou, Y.; Zou, D. Numerical analysis of dislocations of the face slabs of the Zipingpu Concrete Faced Rockfill Dam during the Wenchuan earthquake. Earthq. Eng. Eng. Vib. 2011, 10, 9. [Google Scholar] [CrossRef]
  36. Zhu, Y.; Peng, N.; Zuo, C.; Dong, Y. Study on Presettlement Control Measures for High Concrete-Faced Rockfill Dams. Eur. J. Environ. Civil Eng. 2021, 1–14. [Google Scholar] [CrossRef]
  37. Li, Y.; Pang, R.; Xu, B.; Wang, X.; Fan, Q.; Jiang, F. GPDEM-Based Stochastic Seismic Response Analysis of High Concrete-Faced Rockfill Dam with Spatial Variability of Rockfill Properties Based on Plastic Deformation. Comput. Geotech. 2021, 139, 104416. [Google Scholar] [CrossRef]
  38. Westergaard, H.M. Water Pressures on Dams During Earthquakes. Trans. Asce 1933, 98, 418–432. [Google Scholar] [CrossRef]
  39. Duncan, J.M.; Byrne, P.; Wong, K.S. Strength, Stress-strain and Bulk Modulus Parameters for Finite Element Analysis of Stress and Movements in Soil Masses. J. Consult. Clin. Psychol. 1981, 49, 67–554. [Google Scholar]
  40. Clough, G.W.; Duncan, J.M. Finite Element Analyses of Retaining Wall Behavior. Soil Mech. Found. Div. J. 1971, 97, 1657–1673. [Google Scholar] [CrossRef]
  41. Pang, R.; Xu, B.; Zhou, Y.; Zhang, X.; Wang, X. Fragility Analysis of High CFRDs Subjected to Mainshock-Aftershock Sequences Based on Plastic Failure. Eng. Struct. 2020, 206, 110152. [Google Scholar] [CrossRef]
  42. Wang, S.; Tang, Y.; Li, X.; Du, K. Analyses and Predictions of Rock Cuttabilities under Different Confining Stresses and Rock Properties Based on Rock Indentation Tests by Conical Pick. Trans. Nonferrous Met. Soc. China 2021, 31, 1766–1783. [Google Scholar] [CrossRef]
  43. Wang, S.; Tang, Y.; Wang, S. Influence of Brittleness and Confining Stress on Rock Cuttability Based on Rock Indentation Tests. J. Cent. South Univ. 2021, 28, 2786–2800. [Google Scholar] [CrossRef]
  44. Cai, X.; Cheng, C.; Zhou, Z.; Konietzky, H.; Song, Z.; Wang, S. Rock mass watering for rock-burst prevention: Some thoughts on the mechanisms deduced from laboratory results. Bull. Eng. Geol. Environ. 2021, 80, 8725–8743. [Google Scholar] [CrossRef]
  45. Xu, B.; Pang, R.; Zhou, Y. Verification of Stochastic Seismic Analysis Method and Seismic Performance Evaluation Based on Multi-Indices for High CFRDs. Eng. Geol. 2020, 264, 105412. [Google Scholar] [CrossRef]
  46. Jingbo, L.; Yandong, L. A Direct Method for Analysis of Dynamic Soil-Structure Interaction Based on Interface Idea. In Developments in Geotechnical Engineering; Elsevier: Amsterdam, The Netherlands, 1998; Volume 83, pp. 261–276. ISBN 978-0-444-50035-9. [Google Scholar]
  47. Zou, D.; Han, H.; Liu, J.; Yang, D.; Kong, X. Seismic Failure Analysis for a High Concrete Face Rockfill Dam Subjected to Near-Fault Pulse-like Ground Motions. Soil Dyn. Earthq. Eng. 2017, 98, 235–243. [Google Scholar] [CrossRef]
  48. Yang, G.; Li, H.; Yu, Y.; Lv, H. Study on Seismic Measures of Nuozhadu High Core Rockfill Dam. J. Hydroelectr. Eng. 2008, 27, 89–93. (In Chinese) [Google Scholar]
Figure 1. Finite element mesh of the dam.
Mathematics 09 03124 g001
Figure 2. GRSS setting.
Mathematics 09 03124 g002
Figure 3. Comparison of the seismic acceleration time series between the samples and target: (a) Typical non-stationary seismic acceleration time series; (b) Mean acceleration time series; (c) Standard deviation acceleration time series; (d) Magnifying view of the mean acceleration time series; (e) Response spectrum.
Mathematics 09 03124 g003
Figure 4. Probability density evolution information of safety factor before reinforcement: (a) Probability density function at typical time; (b) Probability density function evolution surface; (c) Probability density function contour.
Mathematics 09 03124 g004
Figure 5. Probability density evolution information of safety factor after reinforcement: (a) Probability density function at typical time; (b) Probability density function evolution surface; (c) Probability density function contour.
Mathematics 09 03124 g005
Figure 6. Discrete point distribution and probability information of minimum safety factor: (a) Discrete point distribution; (b) Probability density distribution function; (c) Exceedance probability.
Mathematics 09 03124 g006
Figure 7. Discrete point distribution and probability information of cumulative time: (a) Discrete point distribution; (b) Probability density distribution function; (c) Exceedance probability.
Mathematics 09 03124 g007
Figure 8. Discrete point distribution and probability information of cumulative slippage: (a) Discrete point distribution; (b) Probability density distribution function; (c) Exceedance probability.
Mathematics 09 03124 g008
Figure 9. Cumulative time-exceedance probability curve under various working conditions: (a) Change of reinforcement length; (b) Change of reinforcement vertical spacing.
Mathematics 09 03124 g009
Figure 10. Cumulative slippage-exceedance probability curve under various working conditions: (a) Change of reinforcement length; (b) Change of reinforcement vertical spacing.
Mathematics 09 03124 g010
Table 1. Parameters of Duncan-Chang E~B model for static analysis.
Materialρ (kg/m3)φ0 (°)Δφ (°)nRfKbmK
Upstream rockfill221455.511.313500.280.807800.18
Downstream rockfill221453.011.010000.260.797000.16
Drainage zone221455.012.213000.310.798000.12
Transition material222253.510.712500.310.787200.16
Cushion material225854.410.612000.300.756800.15
Table 2. Parameters of equivalent visco-elastic model for dynamic analysis.
MaterialKn
Upstream rockfill26600.444
Downstream rockfill49970.298
Drainage zone31150.396
Transition material38280.345
Cushion material52970.33
Table 3. Relationship table of cumulative time-exceedance probability.
Exceedance
Probability (%)
Non-Reinforce SlopesReinforce SlopesReduced ValueRelative
Reduction Value
Cumulative time (s)050.1137.9612.1524.25
0.224.9216.558.3733.59
0.56.863.773.0945.04
1.01.360.940.4230.88
1.50.470.160.3165.96
2.00.06-0.06100.00
Table 4. Relationship table of cumulative slippage-exceedance probability.
Exceedance
Probability (%)
Non-Reinforce SlopesReinforce SlopesReduced ValueRelative
Reduction Value
Cumulative slippage (m)033.7923.6310.1630.07
0.22.882.230.6522.57
0.51.390.440.9568.35
1.0----
1.5----
Table 5. Relationship table of cumulative time-exceedance probability under various working conditions.
Exceedance
Probability (%)
Sv (m)Lmax (m)Cumulative Time (s)
00.51.01.52.0
Condition 125030.732.690.690.06-
Condition 244040.104.421.150.360.03
Condition 345037.963.770.940.16-
Condition 446037.803.670.940.16-
Condition 565039.474.631.090.280.02
Table 6. Relationship table of cumulative slippage-exceedance probability under various working conditions.
Exceedance
Probability (%)
Sv (m)Lmax (m)Cumulative Slippage (m)
00.20.51.01.5
Condition 125018.052.010.12--
Condition 244025.412.380.99--
Condition 345023.632.230.44--
Condition 446023.072.200.42--
Condition 565026.522.370.71--
Publisher’s Note: MDPI stays neutral with regard to jurisdictional claims in published maps and institutional affiliations.

