Article

Rockburst Interpretation by a Data-Driven Approach: A Comparative Study

School of Mines, Key Laboratory of Deep Coal Resource Mining, Ministry of Education of China, China University of Mining and Technology, Xuzhou 221116, China
*
Author to whom correspondence should be addressed.
Mathematics 2021, 9(22), 2965; https://doi.org/10.3390/math9222965
Submission received: 26 September 2021 / Revised: 12 November 2021 / Accepted: 18 November 2021 / Published: 20 November 2021

Abstract

:
Accurately evaluating rockburst intensity has attracted much attention in these recent years, as it can guide the design of engineering in deep underground conditions and avoid injury to people. In this study, a new ensemble classifier combining a random forest classifier (RF) and beetle antennae search algorithm (BAS) has been designed and applied to improve the accuracy of rockburst classification. A large dataset was collected from across the world to achieve a comprehensive representation, in which five key influencing factors were selected as the input variables, and the rockburst intensity was selected as the output. The proposed model BAS-RF was then validated by the dataset. The results show that BAS could tune the hyperparameters of RF efficiently, and the optimum model exhibited a high performance on an independent test set of rockburst data and new engineering projects. According to the ensemble RF-BAS model, the feature importance was calculated. Furthermore, the accuracy of the proposed model on rockburst prediction was higher than the conventional machine learning models and empirical models, which means that the proposed model is efficient and accurate.

1. Introduction

Rock stability in deep underground conditions is seriously affected by rockburst, which still attracts a lot of attention nowadays [1,2]. In civil engineering and mining engineering, rockburst events normally occur suddenly, causing a loss of money in working facilities. Accurately evaluating the rockburst intensity has been a significant task as it can be a guideline in this area and guide managers to design carefully [3,4].
Rockburst cases occur in different conditions, such as tunneling and mining [5,6,7]. For instance, in the deep traffic tunnel in China, there are different grades of rockburst, which have caused different types of damage to the tunnel. Slight rockburst causes some cracks in the concrete in the tunnel face, and moderate rockburst affects the arc cavity pits, with depths of about 1 m, while intense rockburst affects the arc and wedge-shaped pits with depths of about 2 m, and the extremely intense rockburst almost destroyed the working condition, causing the depth of the pits to be about 3 m. Therefore, classifying and predicting the rockburst intensity plays a significant role in working safety.
Nowadays, the mechanism of rockburst is still not clear, but the basic laws of it are known as instantaneous slip and instantaneous fracturing. To control the rockburst, different methods have been proposed, such as temporary and permanent rock support systems; however, these approaches are not efficient as the rockburst intensity is difficult to know properly. Thus, some monitoring methods, such as a microseismic monitoring system, were applied to record and analyze the rockburst events [8]. The microseismic monitoring system records the rockburst intensity after the rockburst events, and it cannot predict the rockburst in advance. Hence, estimating and predicting rockburst intensity before its occurrence is of importance. Different models have been proposed, such as stress criteria, including the Barton, Hoek and Brown, Hou, Russenes, and Turchaninov criteria. Furthermore, the existing prediction approaches can be regarded as short-term and long-term predictions. In short-term predictions, the rockburst occurrence is based on in-situ site testes; however, the long-term prediction is basically according to the fundamental methods, such as strength theory and energy theory, which are similar to simulation, machine learning, and empirical knowledge methods [9].
Due to the uncertainties of rockburst and the unclear mechanism of occurrence, a curtained model or method is not suitable for the accurate prediction of rockburst. The method should consider more influencing factors related to rockburst occurrence, with random, fuzzy, or even both mechanisms, and thus, the artificial intelligence method can perfectly solve the problem [10,11]. For instance, there are various machine learning methods for predicting long-term rockburst hazards, such as support vector machines, artificial neural networks, and decision trees. The previous studies are summarized in Table 1. It can be noted that the prediction accuracy of rockburst intensity is affected by the number of data and different machine learning algorithms. Therefore, developing a high-performance and less-time-consuming ensemble classifier for the larger dataset is quite important.
Random forest (RF) has been applied in rockburst classification [27]. However, the relevant studies are fewer [14,24,28], by which their accuracy is limited by the hyperparameters, i.e., the number of the trees and the minimum leaf node. To optimize the structure of RF, there are some global optimization algorithms, such as the firefly algorithm (FA) and particle swarm optimization (PSO). However, these algorithms are time-consuming, and therefore, a new global algorithm should be proposed. Beetle Antennae Search (BAS), is a biologically inspired, intelligent optimization algorithm, which is inspired by the foraging principle of longicorn beetles. Furthermore, it has been used for tuning the hyper-parameters of ML algorithms in recent years.
This research aims to develop a machine learning-based model to study rockburst classification. The BAS algorithm was employed to tune the hyper-parameters of the RF algorithm. The performance of the ensemble BAS-RF model has been compared with other machine learning algorithms: the support vector machine, k-nearest neighbors, and decision tree algorithms. Furthermore, the BAS-RF has been tested against empirical criteria as well as previously published RF models, which were developed to address the rockburst problem.

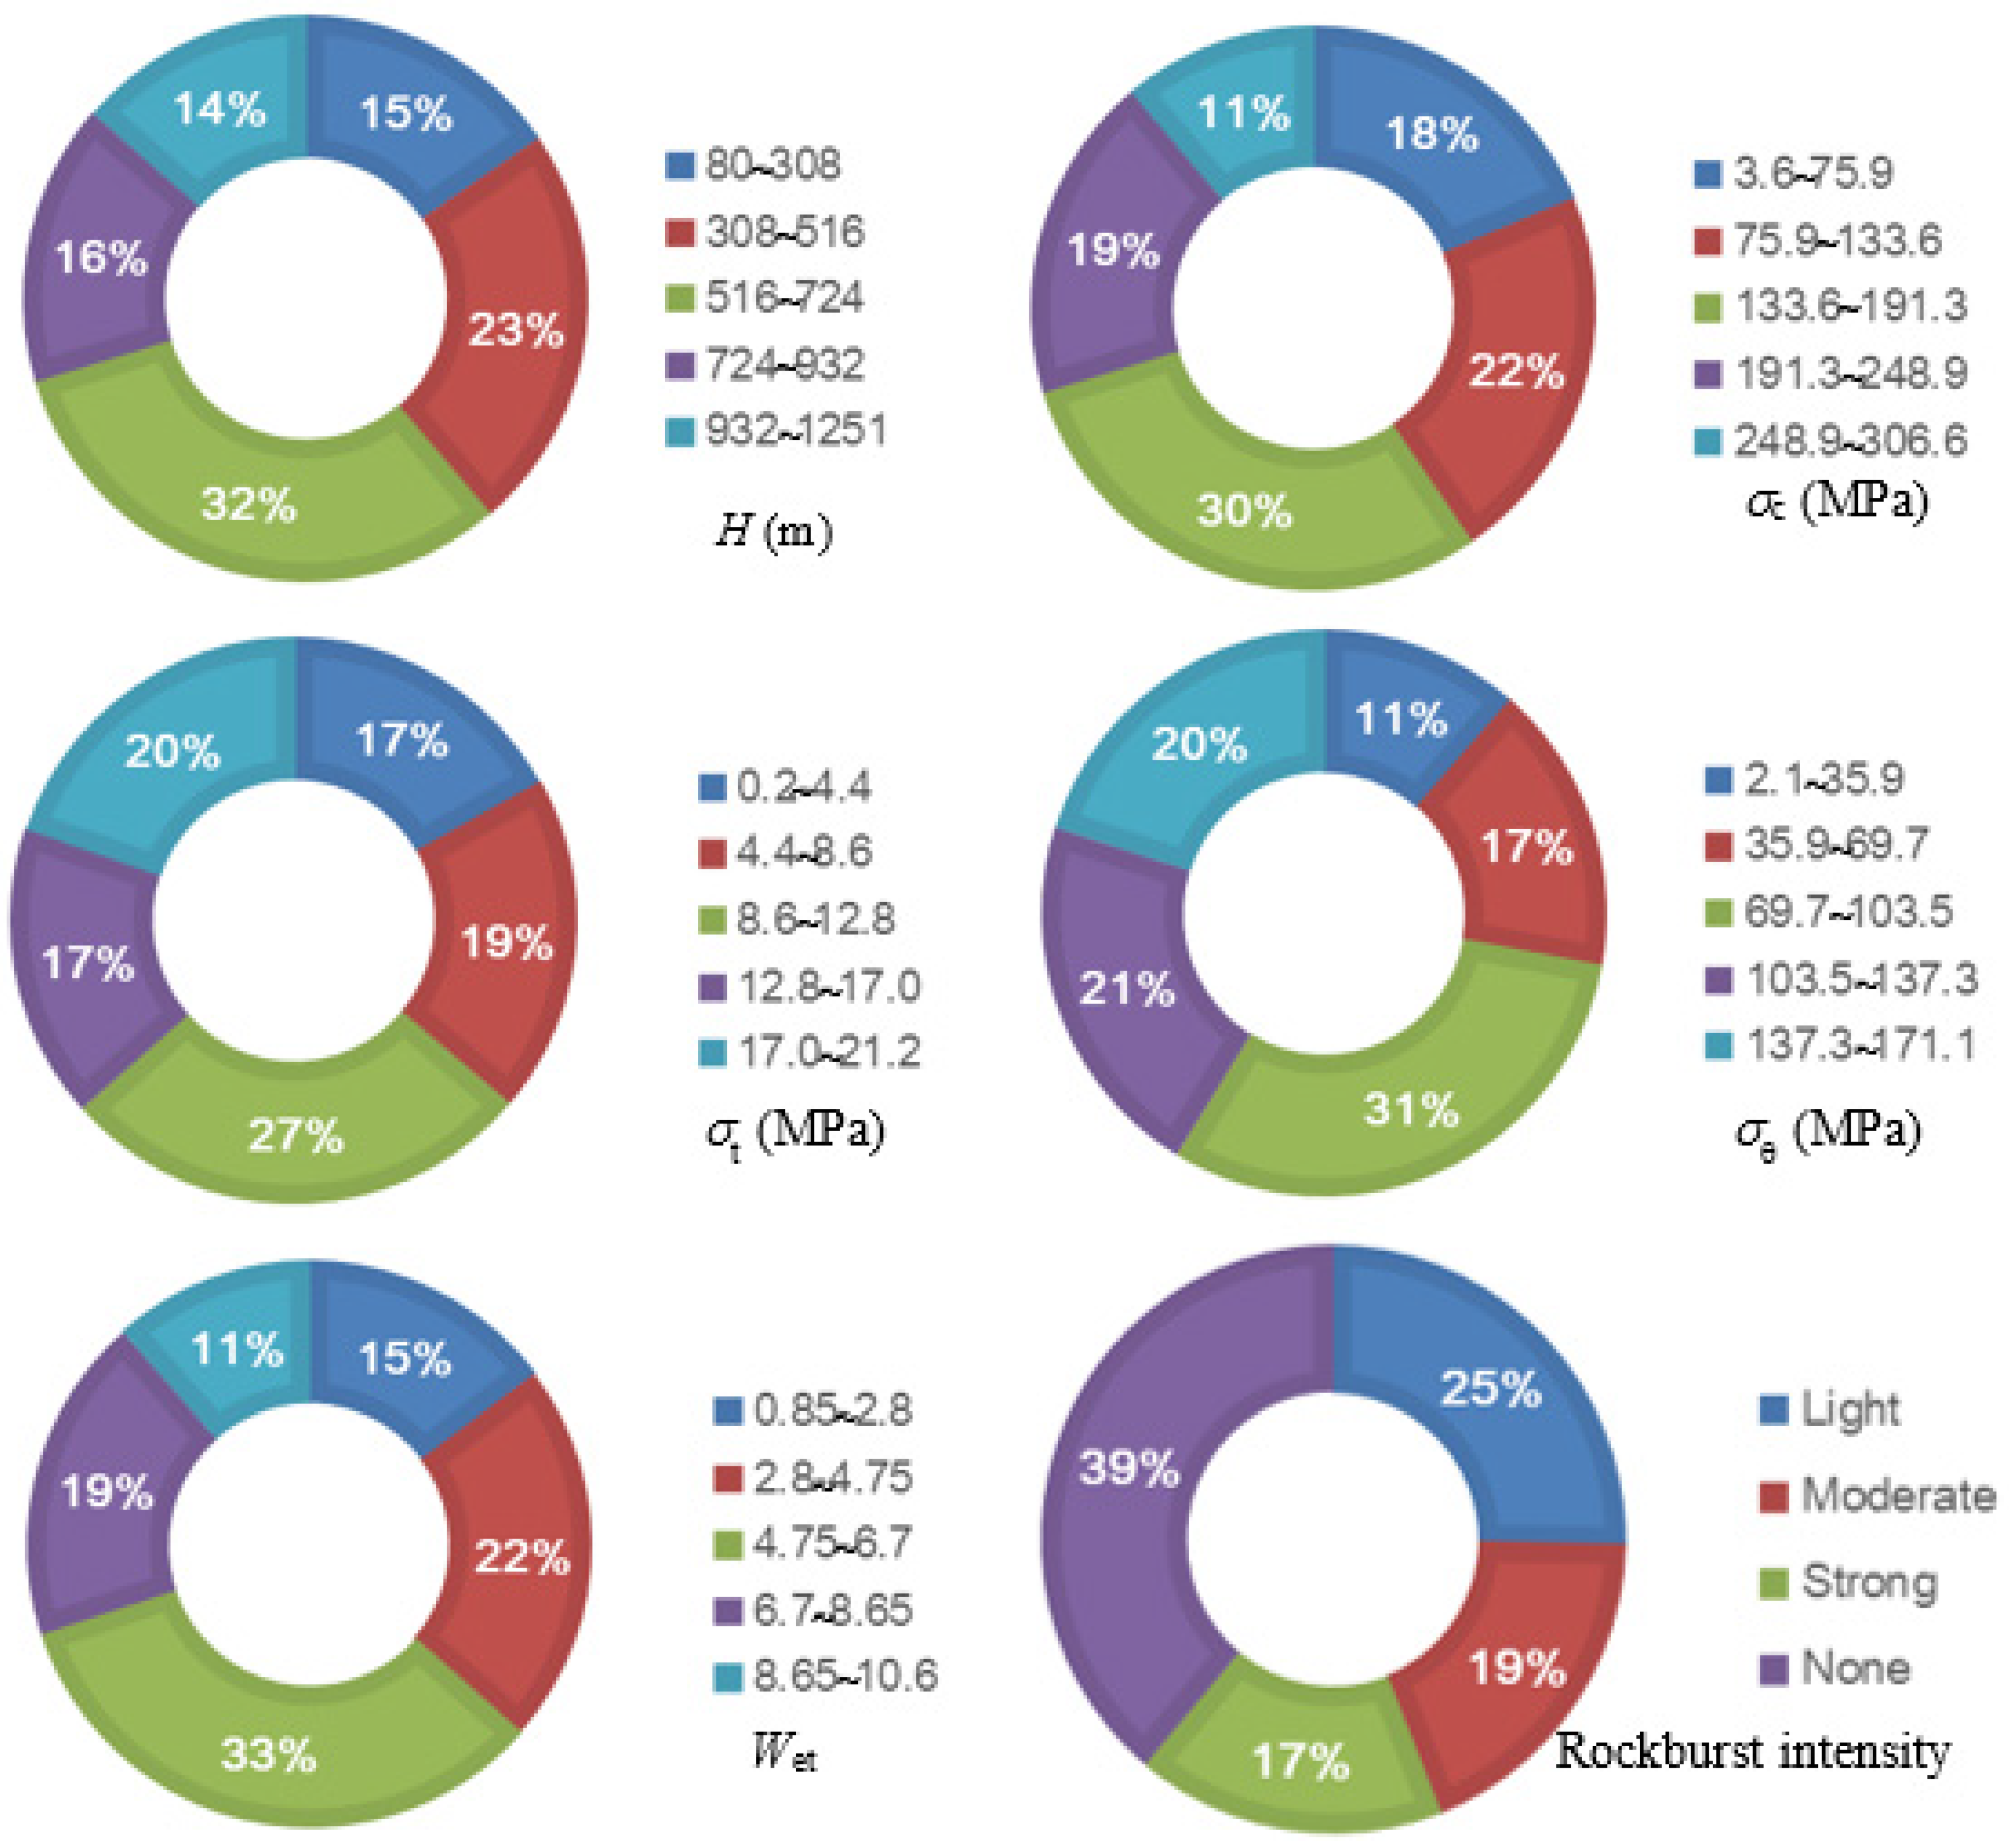
2. Dataset Preparation

A total of 279 cases of rockburst events reported in the literature were collected to build a dataset [14,26,29,30,31,32]. The dataset included five influencing variables, with the buried depth of opening (H), the maximum tangential stress of the excavation boundary (σθ), the uniaxial compressive strength of rock ( σ c ), the tensile rock strength ( σ t ), and the elastic energy index (Wet) as input parameters and rockburst intensity as the output. These input variables are commonly applied in rockburst classification and can provide fundamental understandings about rockburst occurrence in underground conditions. According to rock failure properties, the output parameter, i.e., rockburst intensity, contains four different classes, namely none, light, moderate, and strong. The frequency of each input parameter is depicted in Figure 1. The statistics of the input parameters are summarized in Table 2.

3. Algorithm Background and Ensemble Model

3.1. Algorithms Description

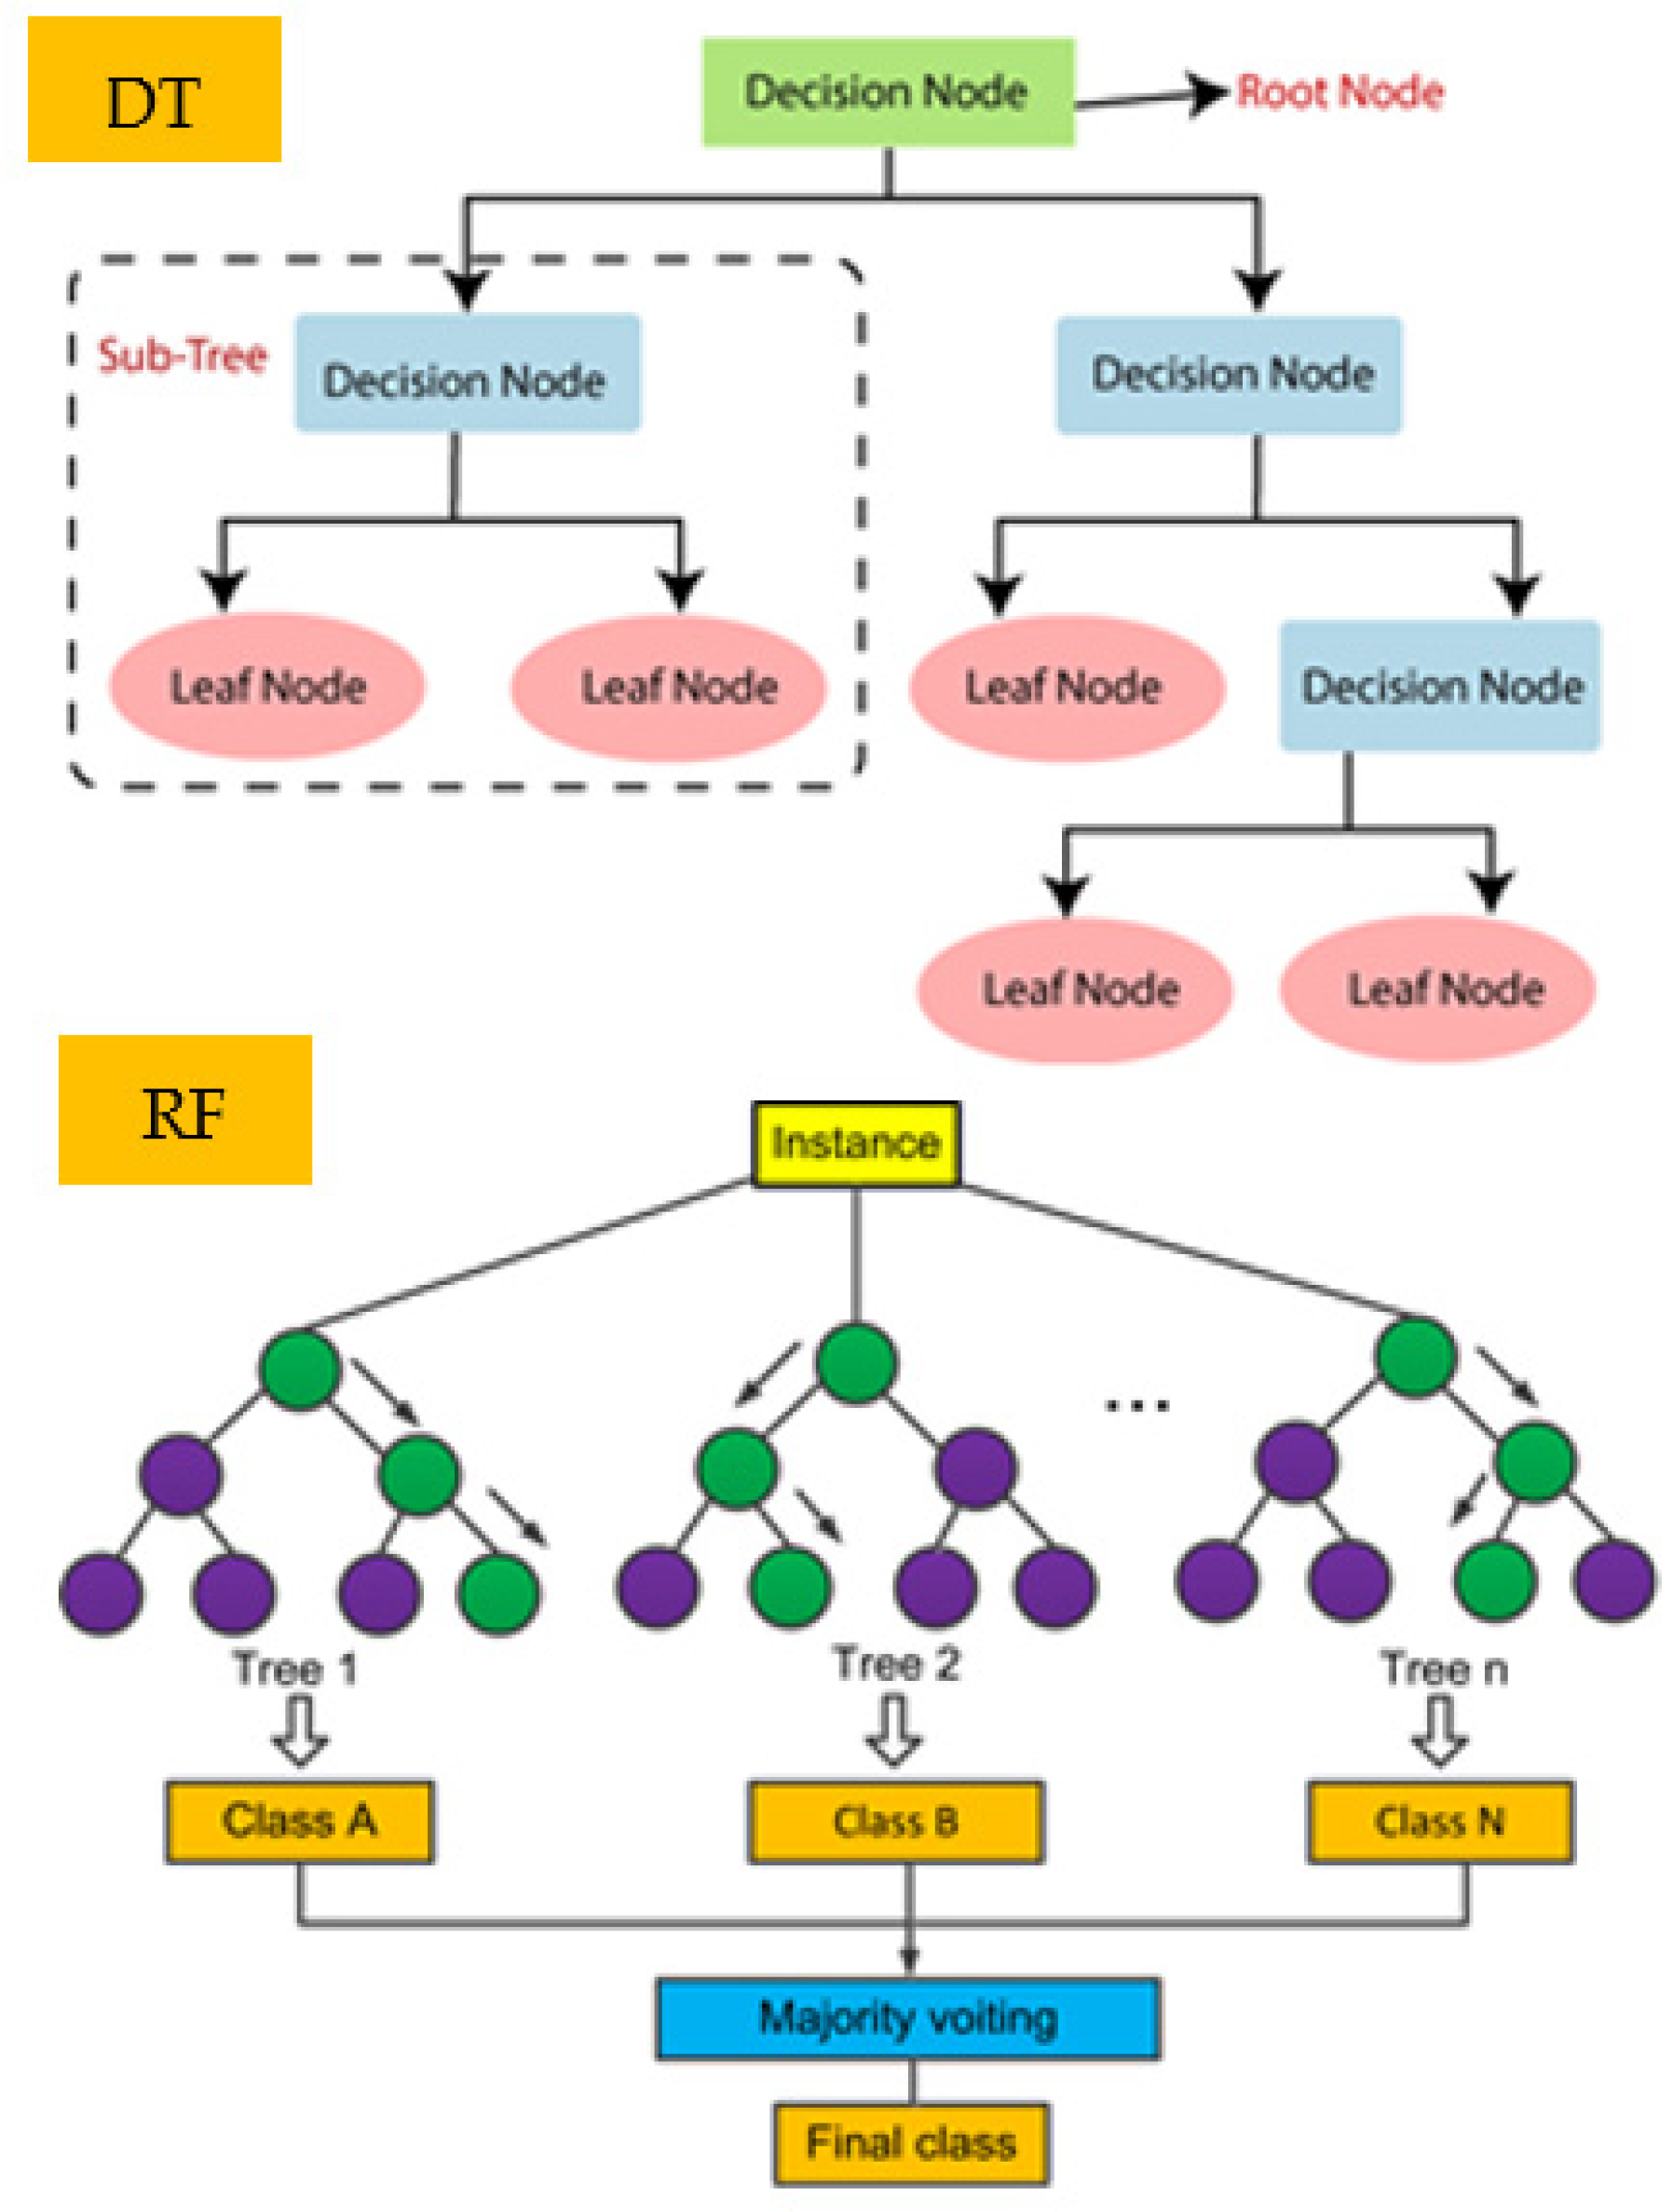
3.1.1. Decision Tree and Random Forest

The Decision Tree (DT) and Random Forest (RF) both have tree structures. In contrast to the DT, the random forest uses the method of majority votes. The normal structure of DT and RF is shown in Figure 2.
The C 4.5 algorithm in this study was applied for the attribute selection process, which can be expressed as follows:
G a i n R a t i o   ( S , A )   =   G a i n   ( S , A ) S p l i t I n f o   ( A )
where S is the training set; A is the attribute; S p l i t I n f o   ( A ) is given by
S p l i t I n f o   ( A )   =   v ϵ D o m a i n   ( A ) | S v A | | S | · log 2 | S v A | | S |
The necessary steps are (1) selecting random K data points from the training set, (2) building the decision trees associated with the selected data points, (3) choosing the number of decision trees, (4) repeating steps 1 and 2, (5) finding the predictions of each decision tree for new data points, and assigning new data points to the category having the majority of votes.

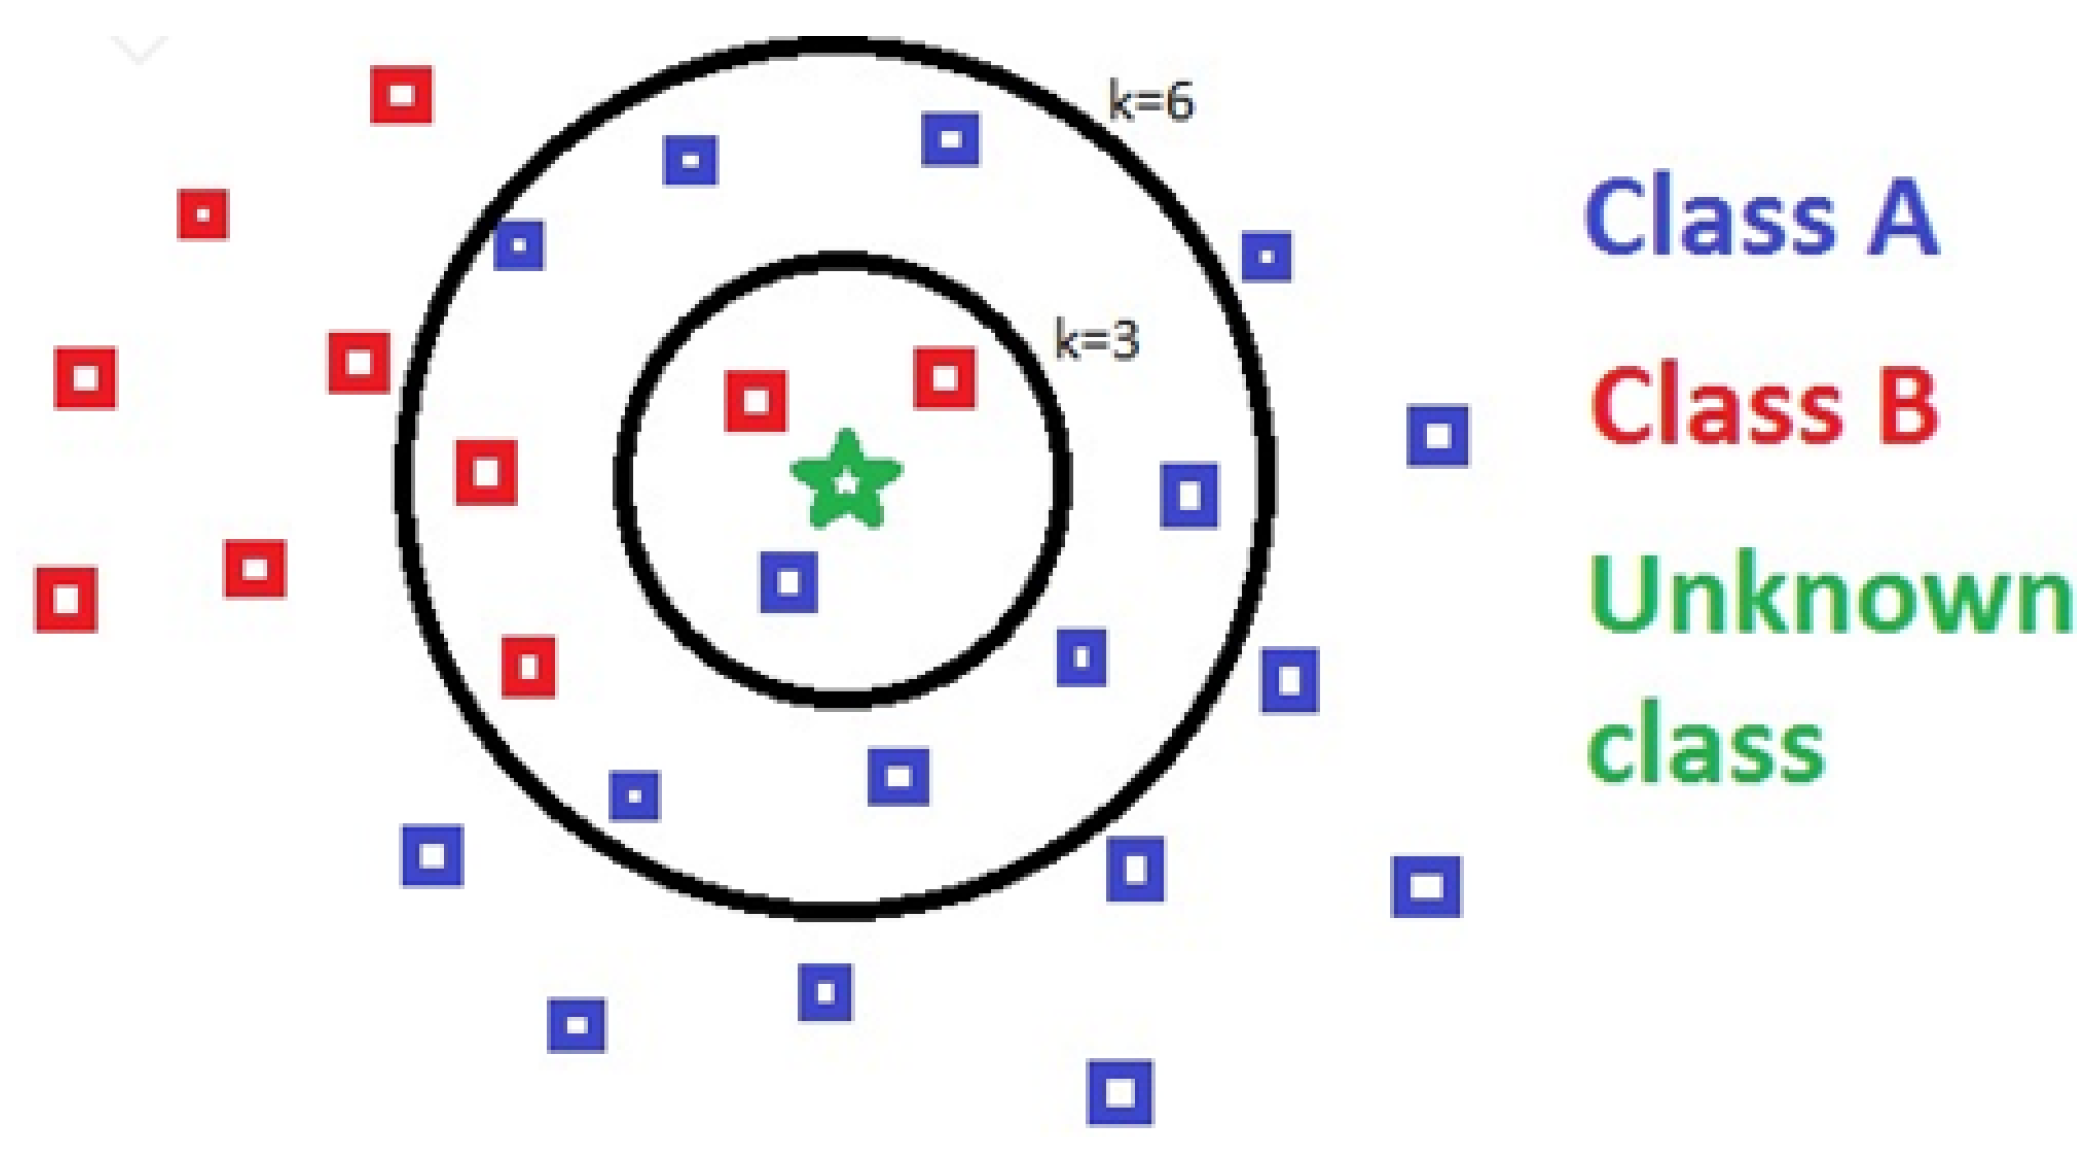
3.1.2. K-Nearest Neighbor

The K-Nearest Neighbor (KNN) is a non-parametric and lazy learning algorithm. K is the number of nearest neighbors. The number of neighbors is the core deciding factor. There are some basic steps, i.e., calculate the distance, find the closest neighbors, and vote for labels. The structure of KNN is depicted in Figure 3.

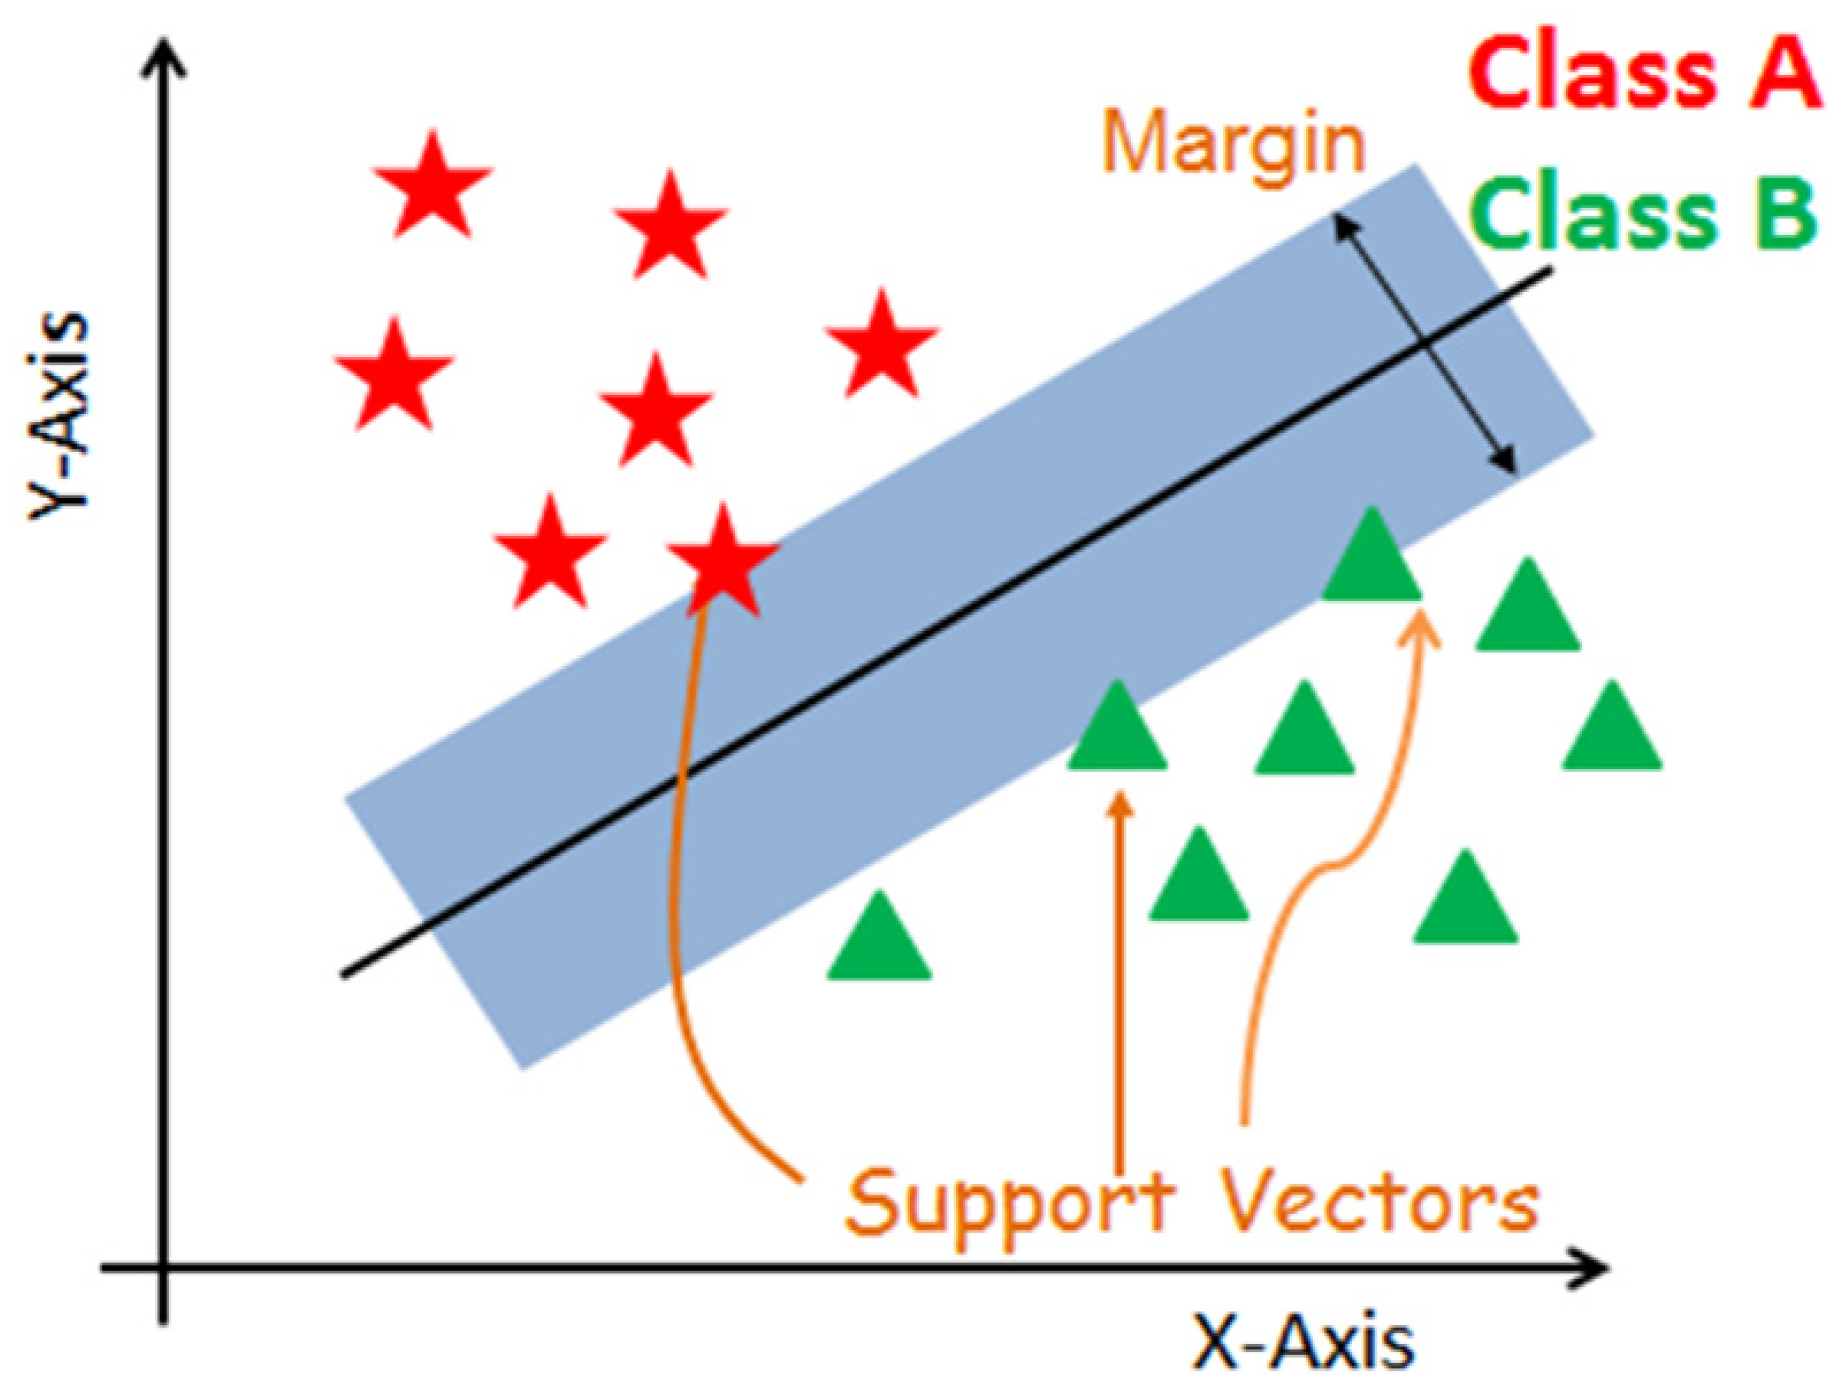
3.1.3. Support Vector Machines

Support Vector Machines (SVM) are considered to be a classification approach by constructing a hyperplane in a multidimensional space to separate different classes. They include the following steps: generate hyperplanes and select the right hyperplane with the maximum segregation. The structure of SVM is shown in Figure 4.

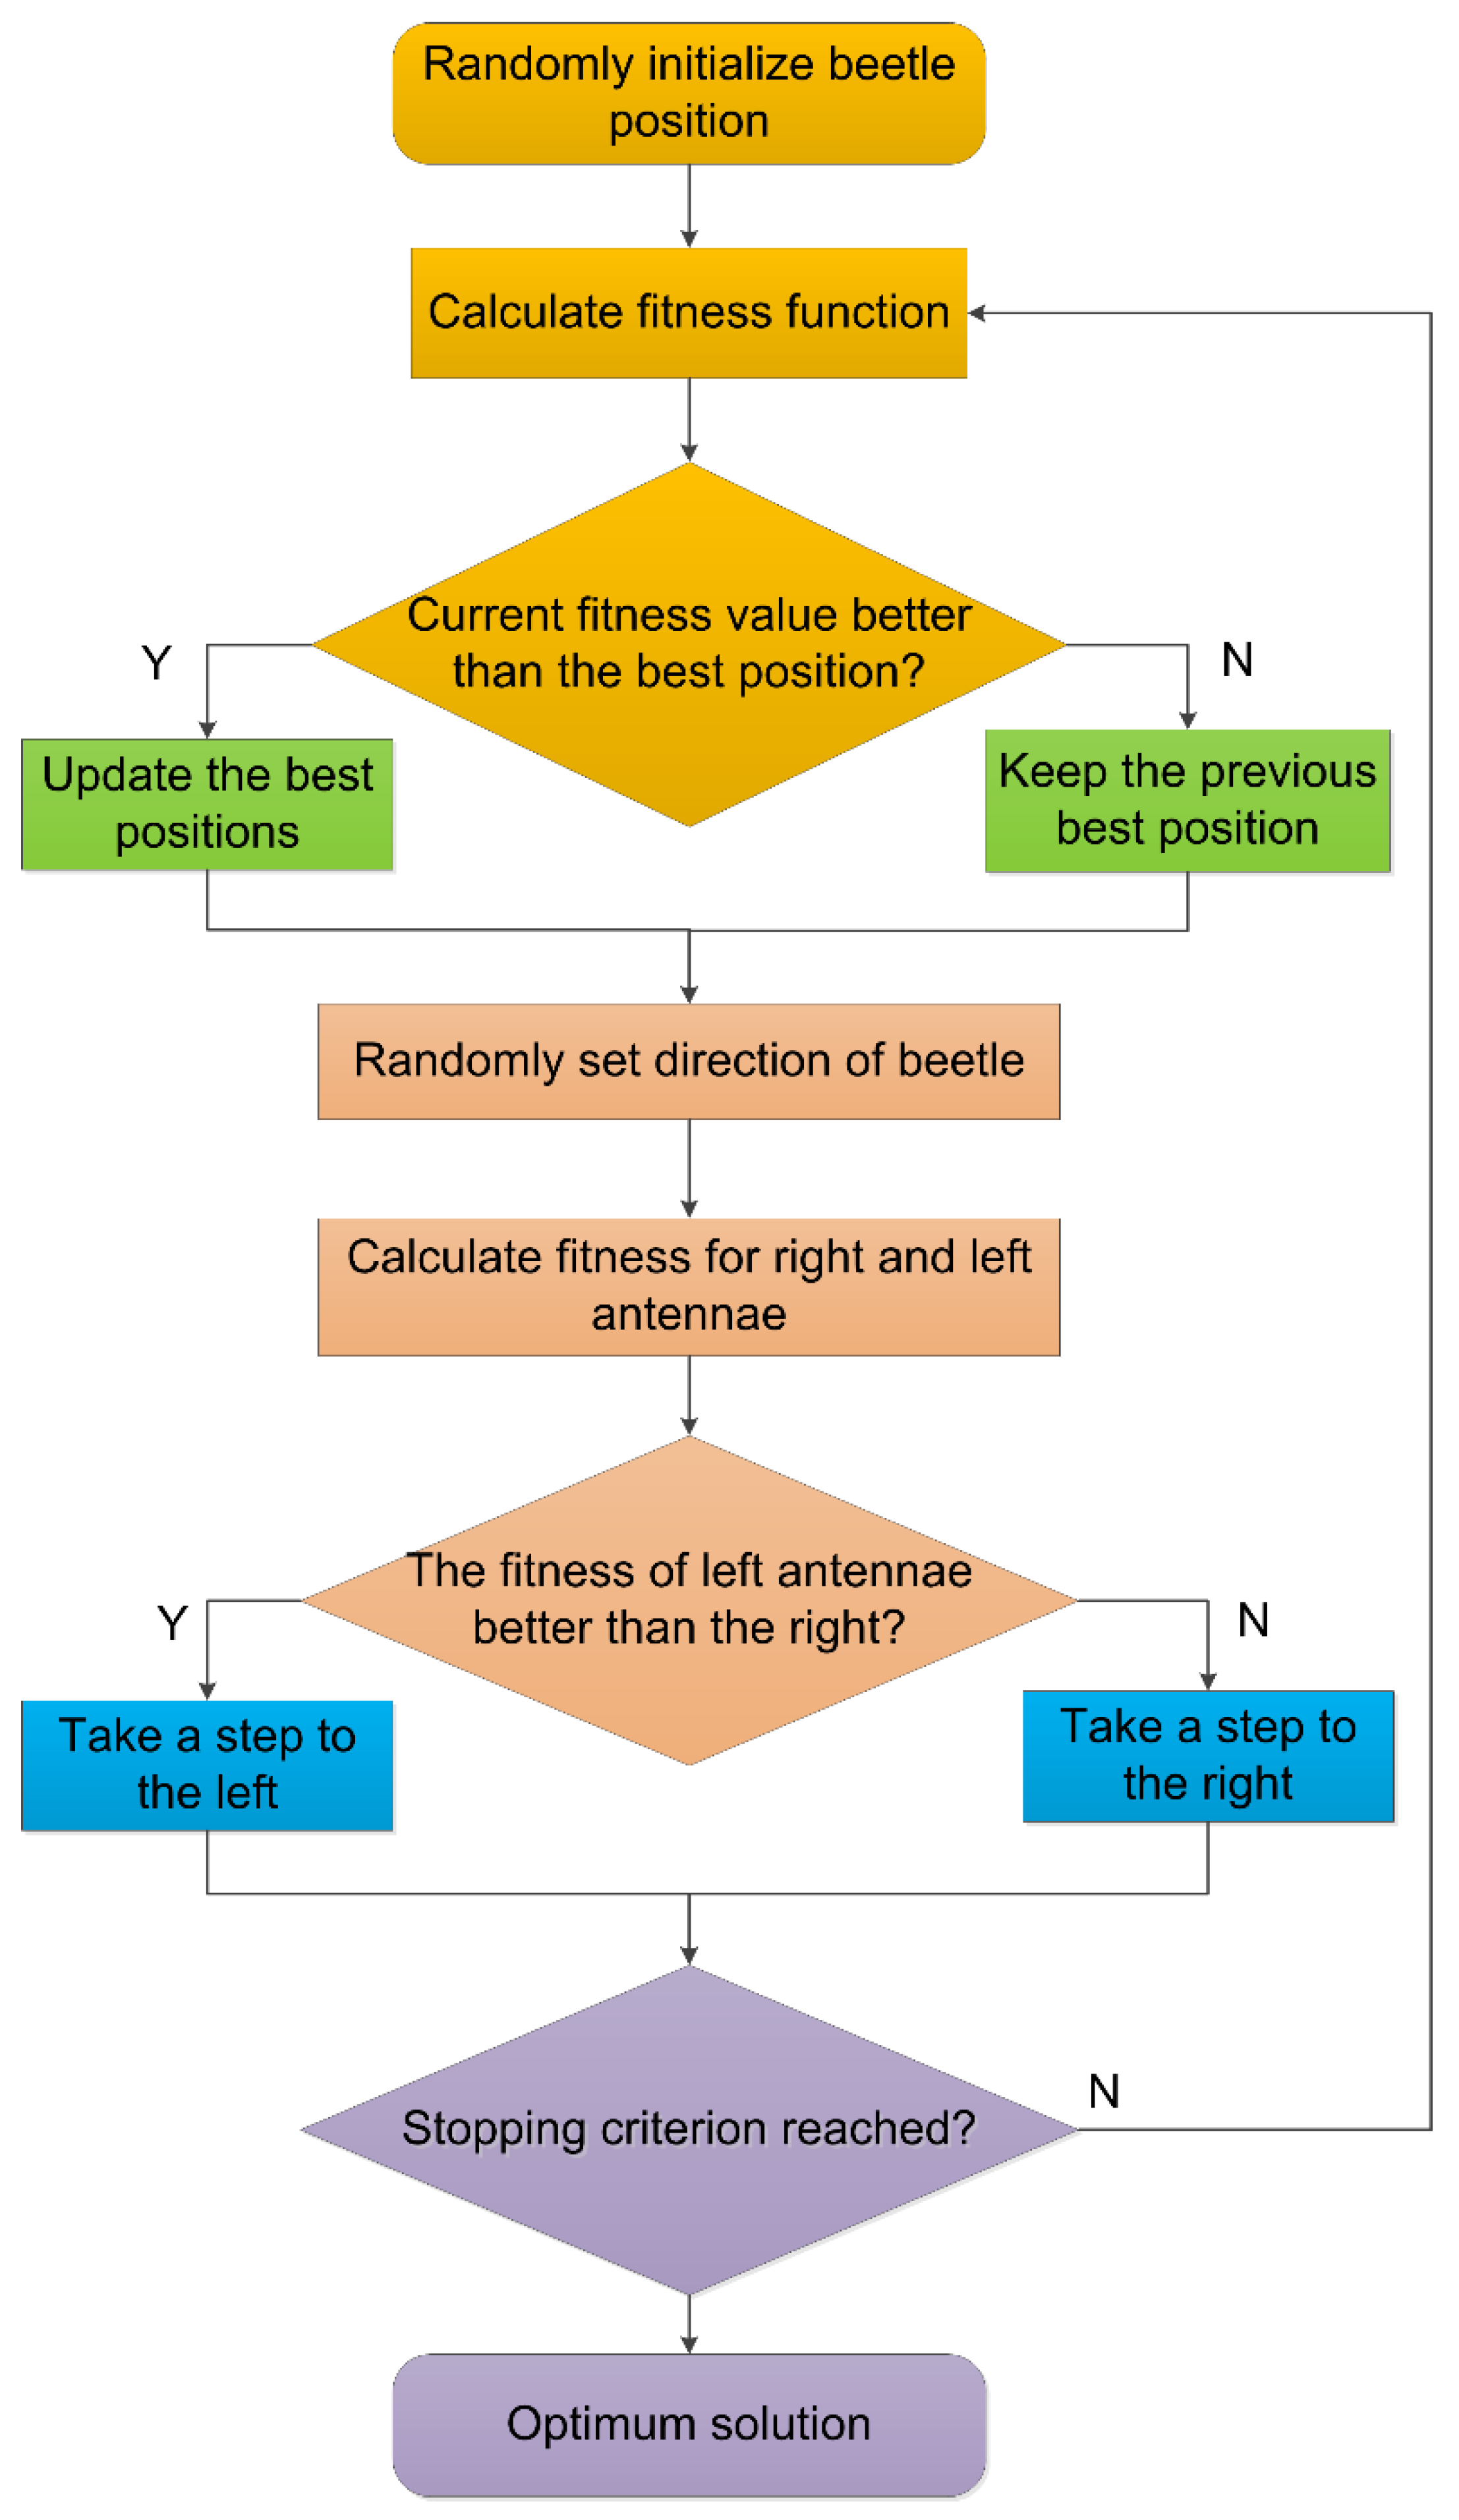
3.1.4. Beetle Antennae Search Algorithm

The Beetle Antennae Search algorithm (BAS) is an intelligent optimization algorithm, proposed by Jiang et al. in 2017. Different from other bionic algorithms, the Beetle Antenna Search algorithm is a monomer search algorithm with the advantages of a simple principle, fewer parameters, and less computation. It has great advantages in dealing with low-dimensional optimization objectives, such as low time complexity and strong searchability. The flow chart of BAS is given in Figure 5. In this study, the iteration of BAS was set as 50, and the step factor was set as 0.95. All algorithms were developed by Matlab software.

3.2. The Methodology of Ensemble RF-BAS Model

There are several procedures for constructing an ensemble model.
Step 1: Splitting the dataset into a train dataset and test dataset, and normally, the proportion is 70% and 30%, respectively. It should be pointed out that due to the rockburst intensity being classed into four classes, the train and test dataset should also be divided into four subsets accordingly.
Step 2: Initialing the parameters of BAS, i.e., the beetle’s position in the space, in which the dimension of the position vector is the number of hyperparameters of the algorithm.
Step 3: Training the model and calculating the fitness value on the remaining subset of the training set.
Step 4: The BAS will tune the hyper-parameters by decreasing the fitness value. When the iteration of 50 is reached, the optimal hyperparameters can be found.
Step 5: The above process is repeated five times, and it can be called a fivefold cross-validation (CV) (shown in Figure 6). The full procedure is depicted in Figure 7.

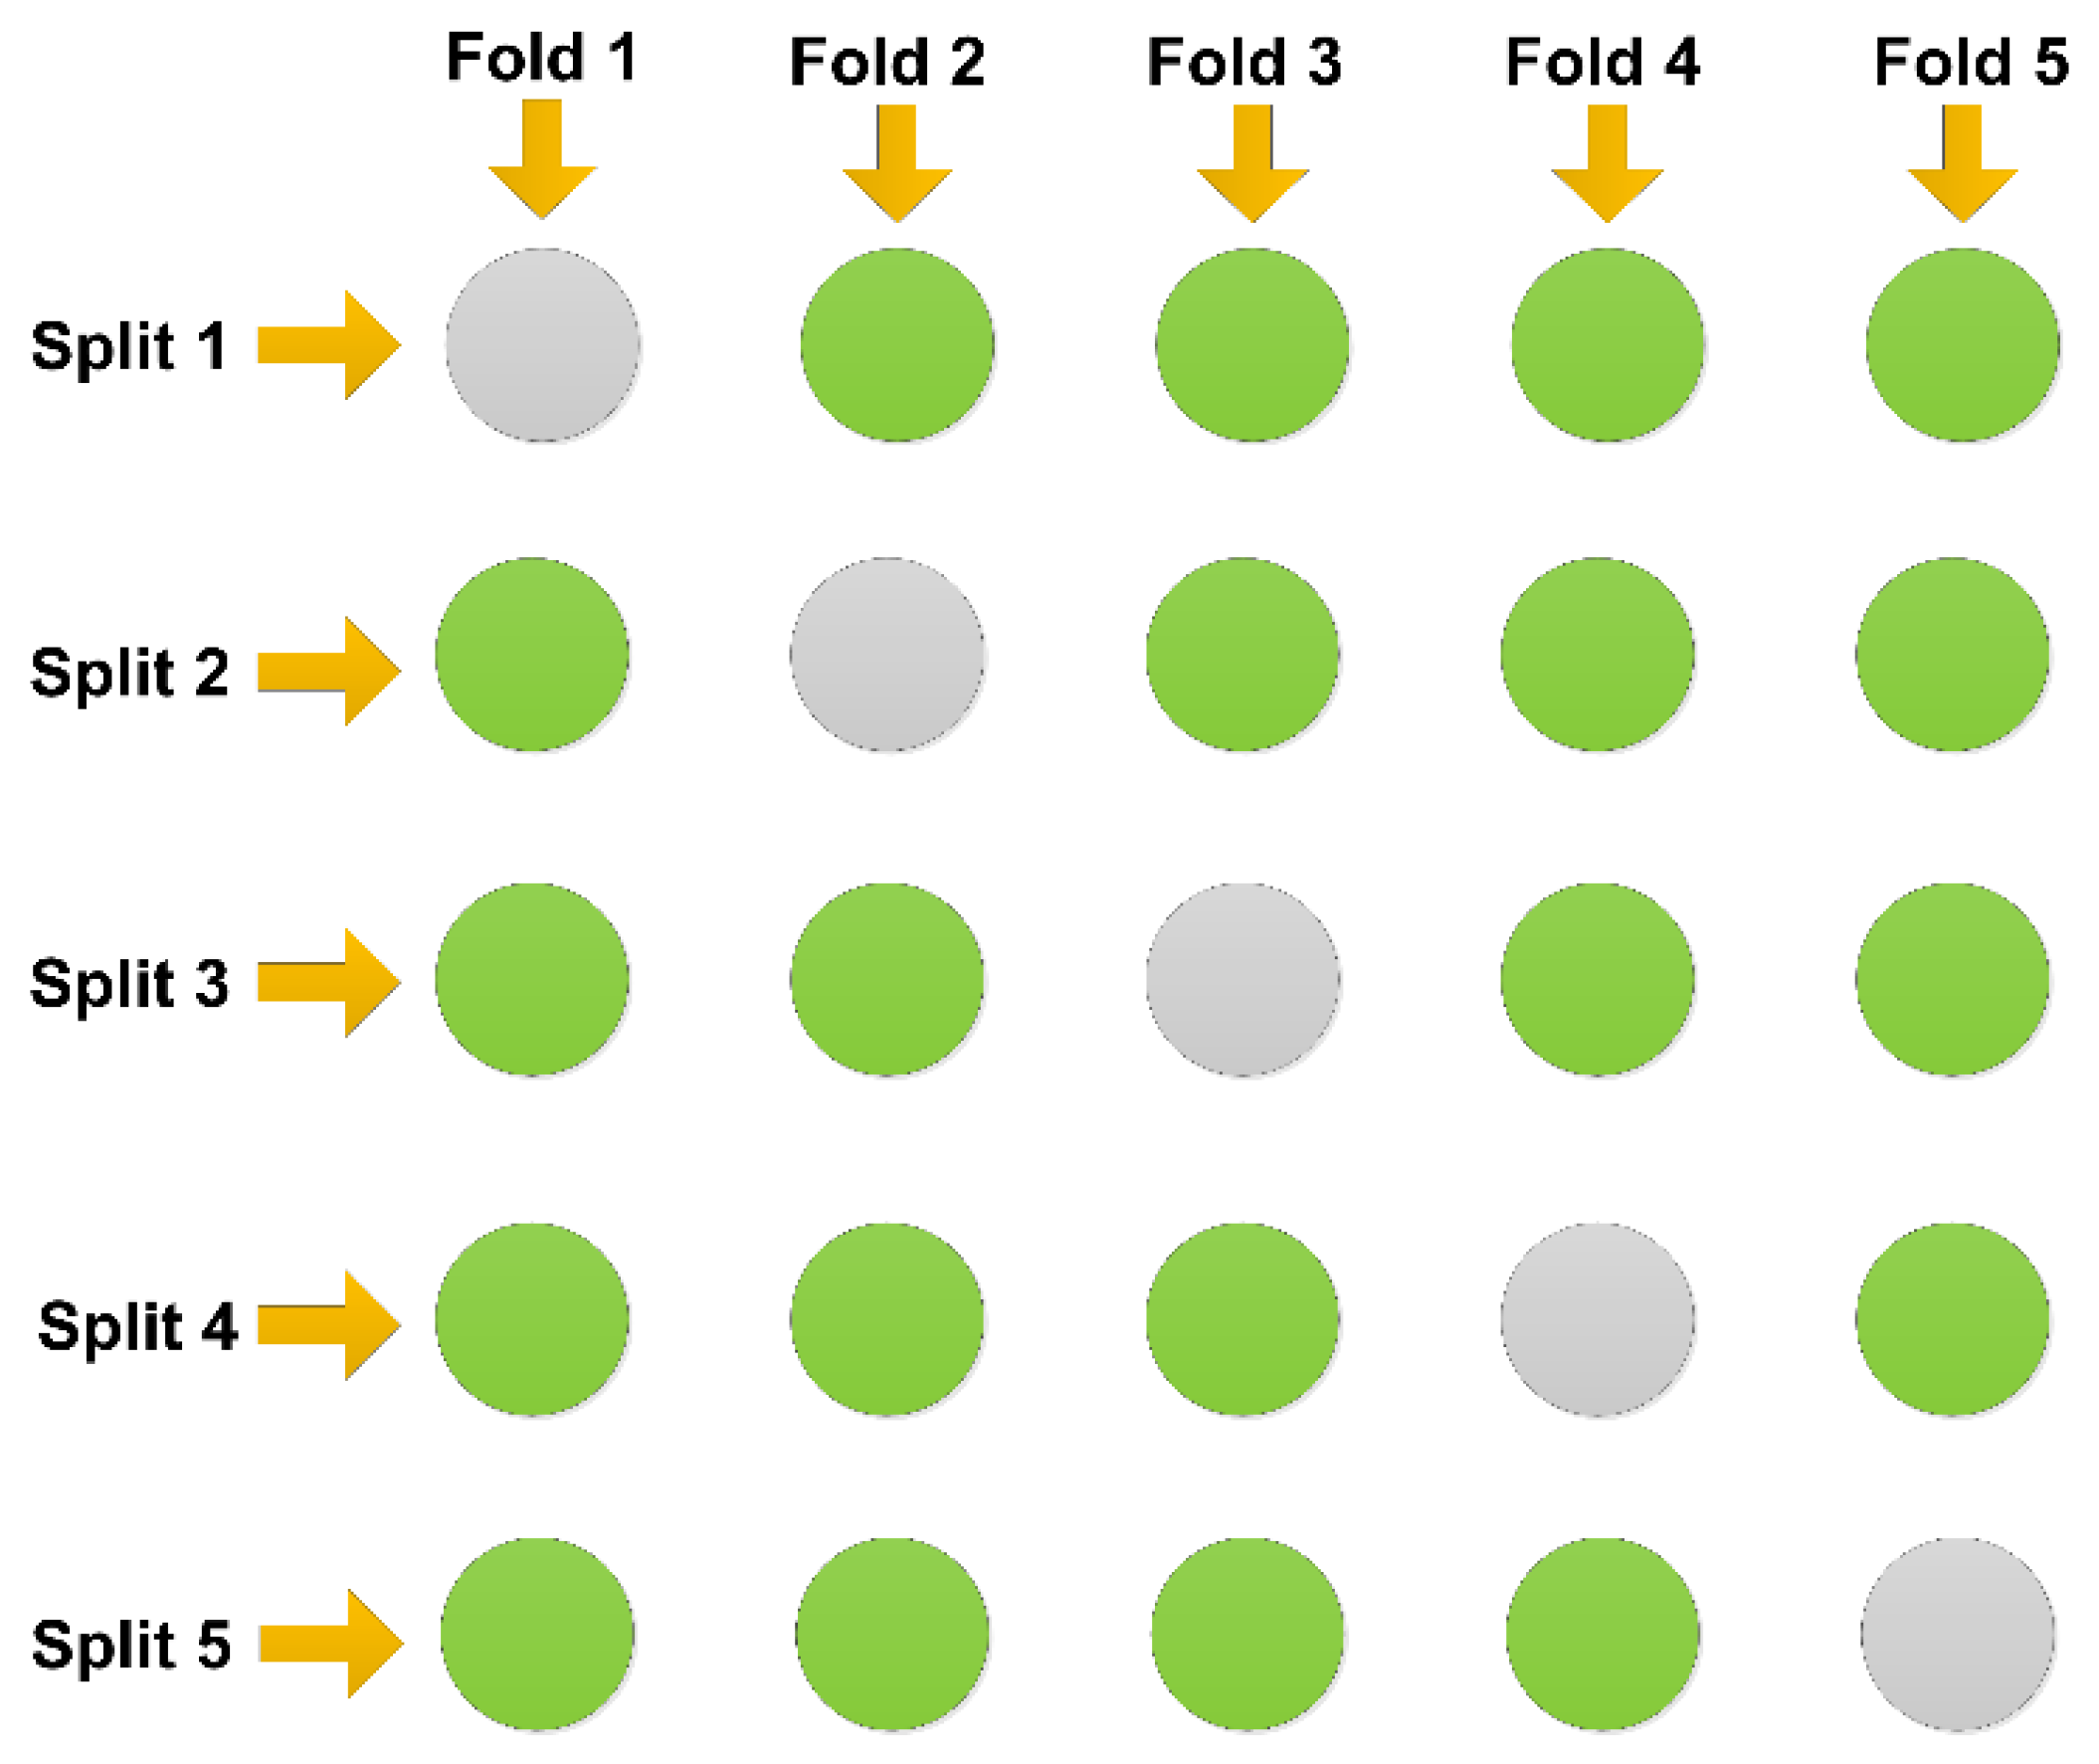
3.3. Performance Evaluation Methods

In this study, we applied the classical methods for model evaluation. The receiver operating characteristic (ROC) curve and the AUC curve (the area under the ROC) were used in the evaluation of rockburst classification. The horizontal axis is the false positive rate (FPR); however, the vertical axis represents the true positive rate (TPR) in the ROC curve.

4. Results

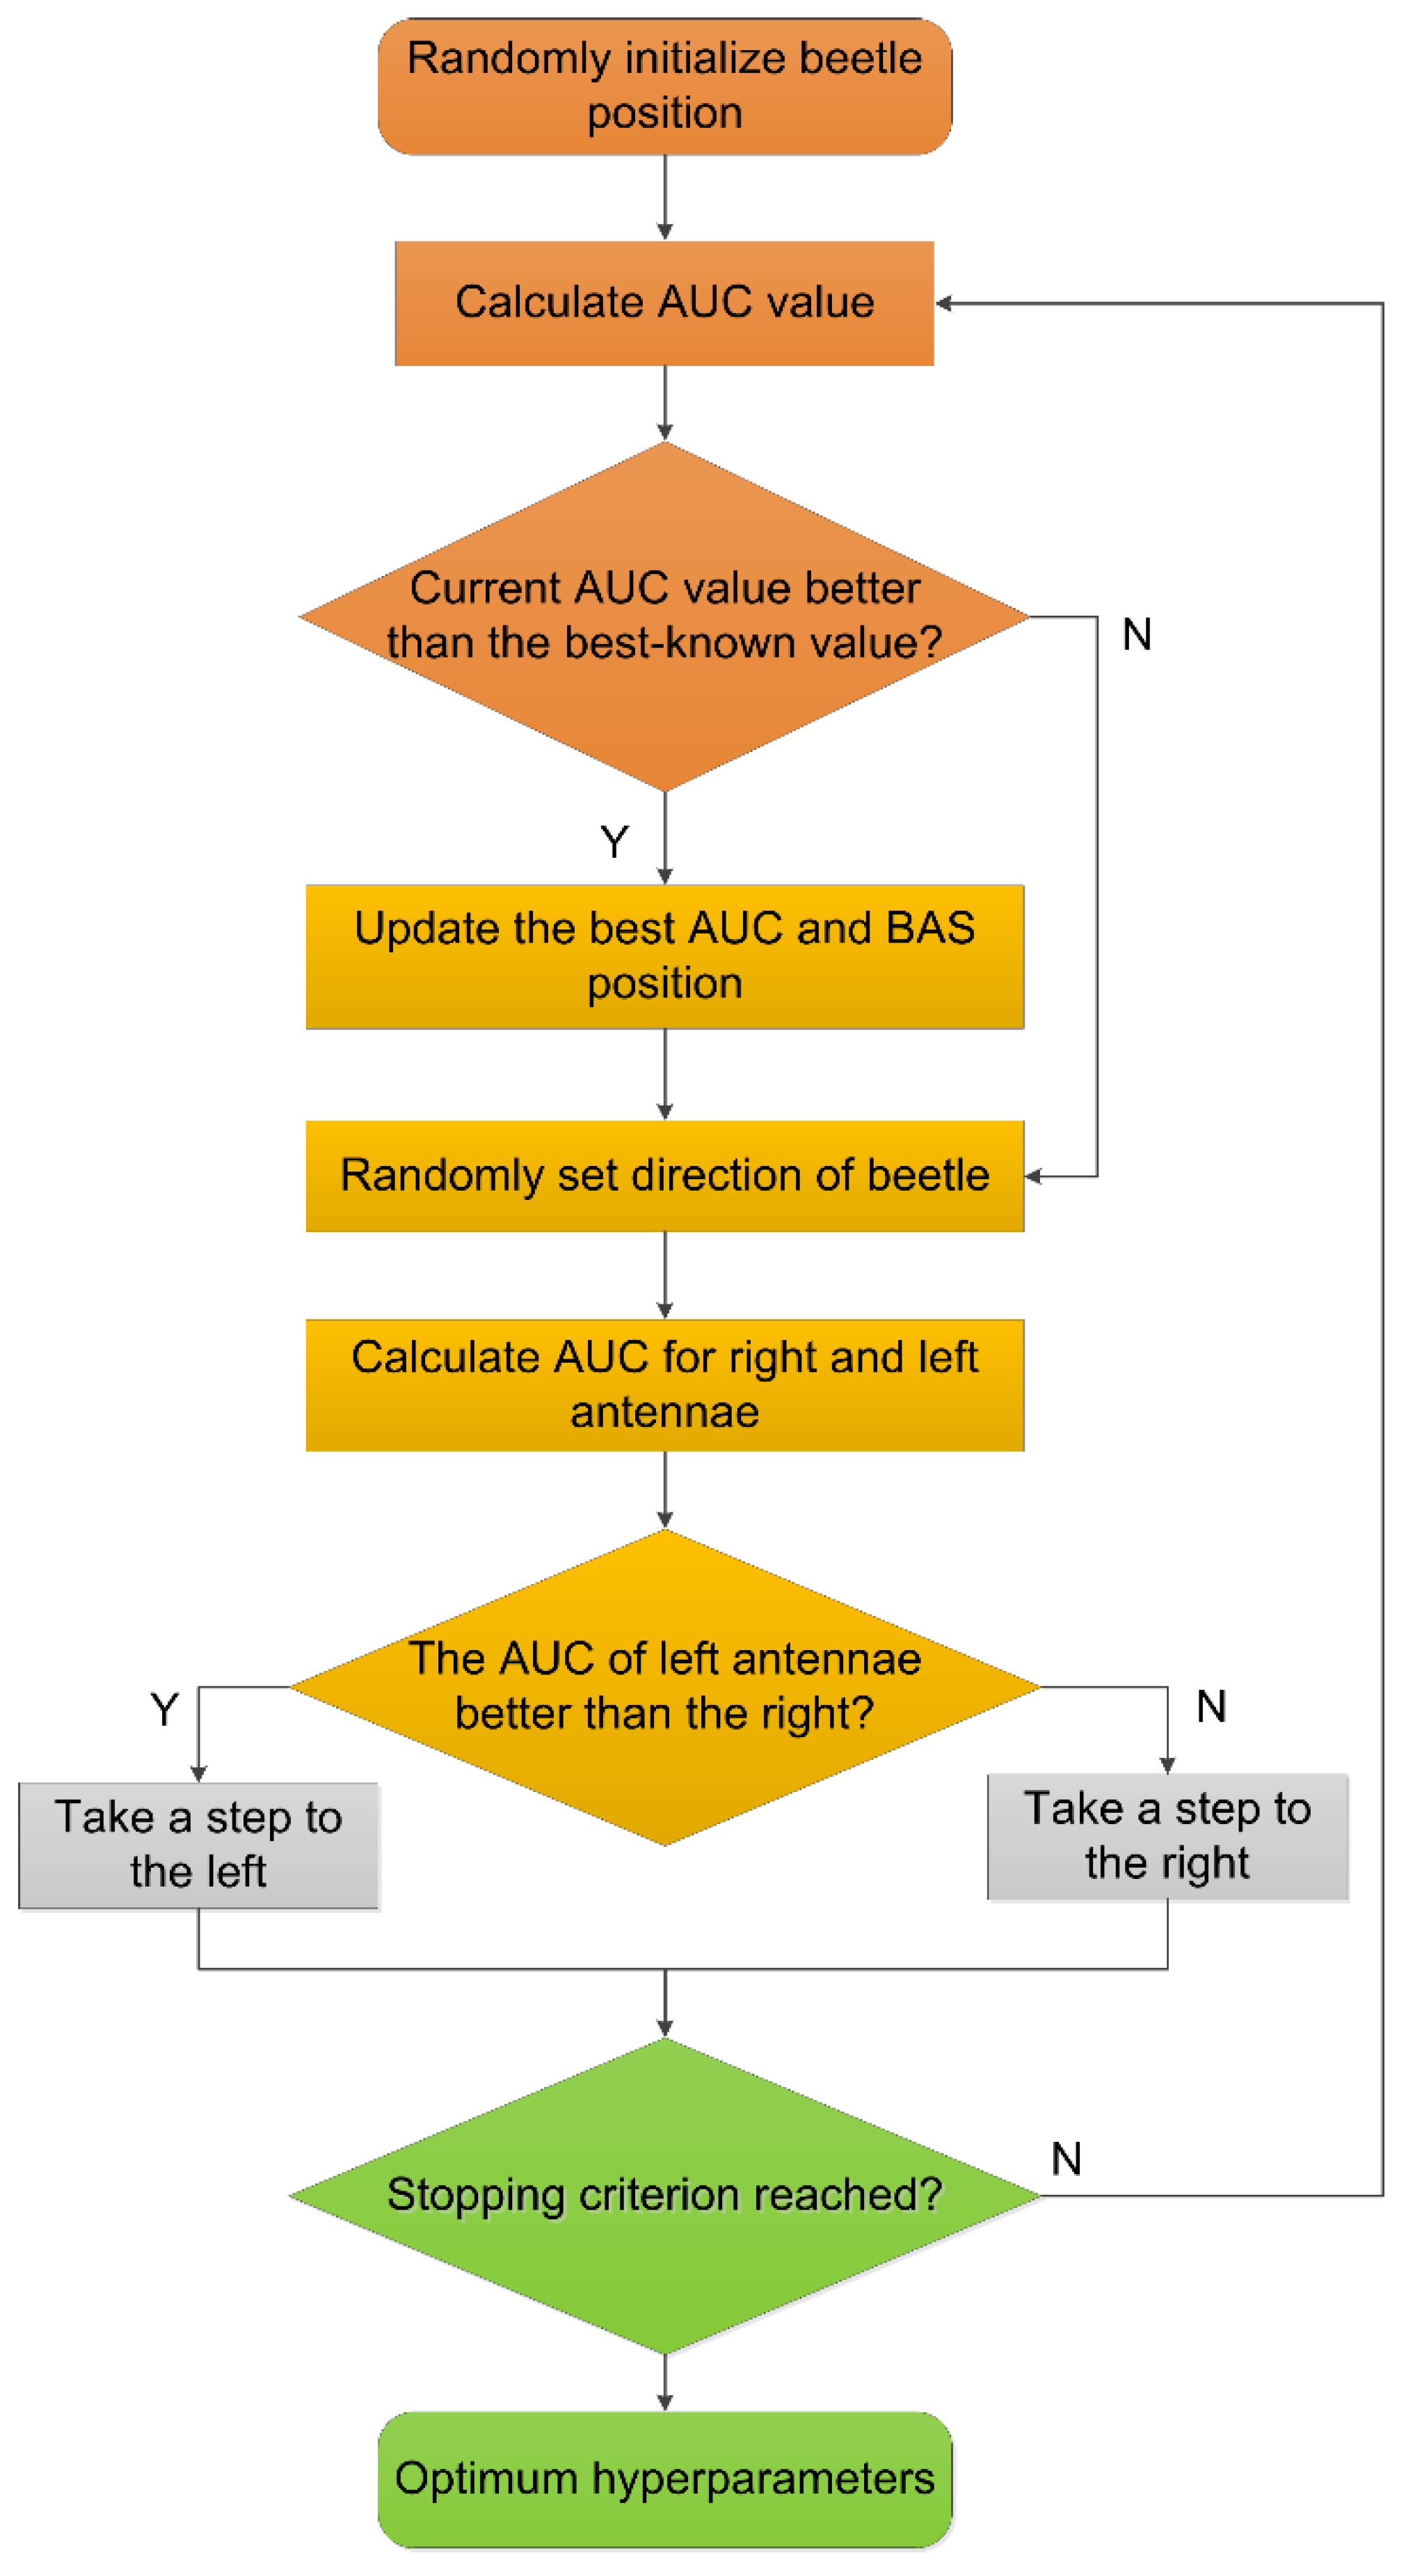
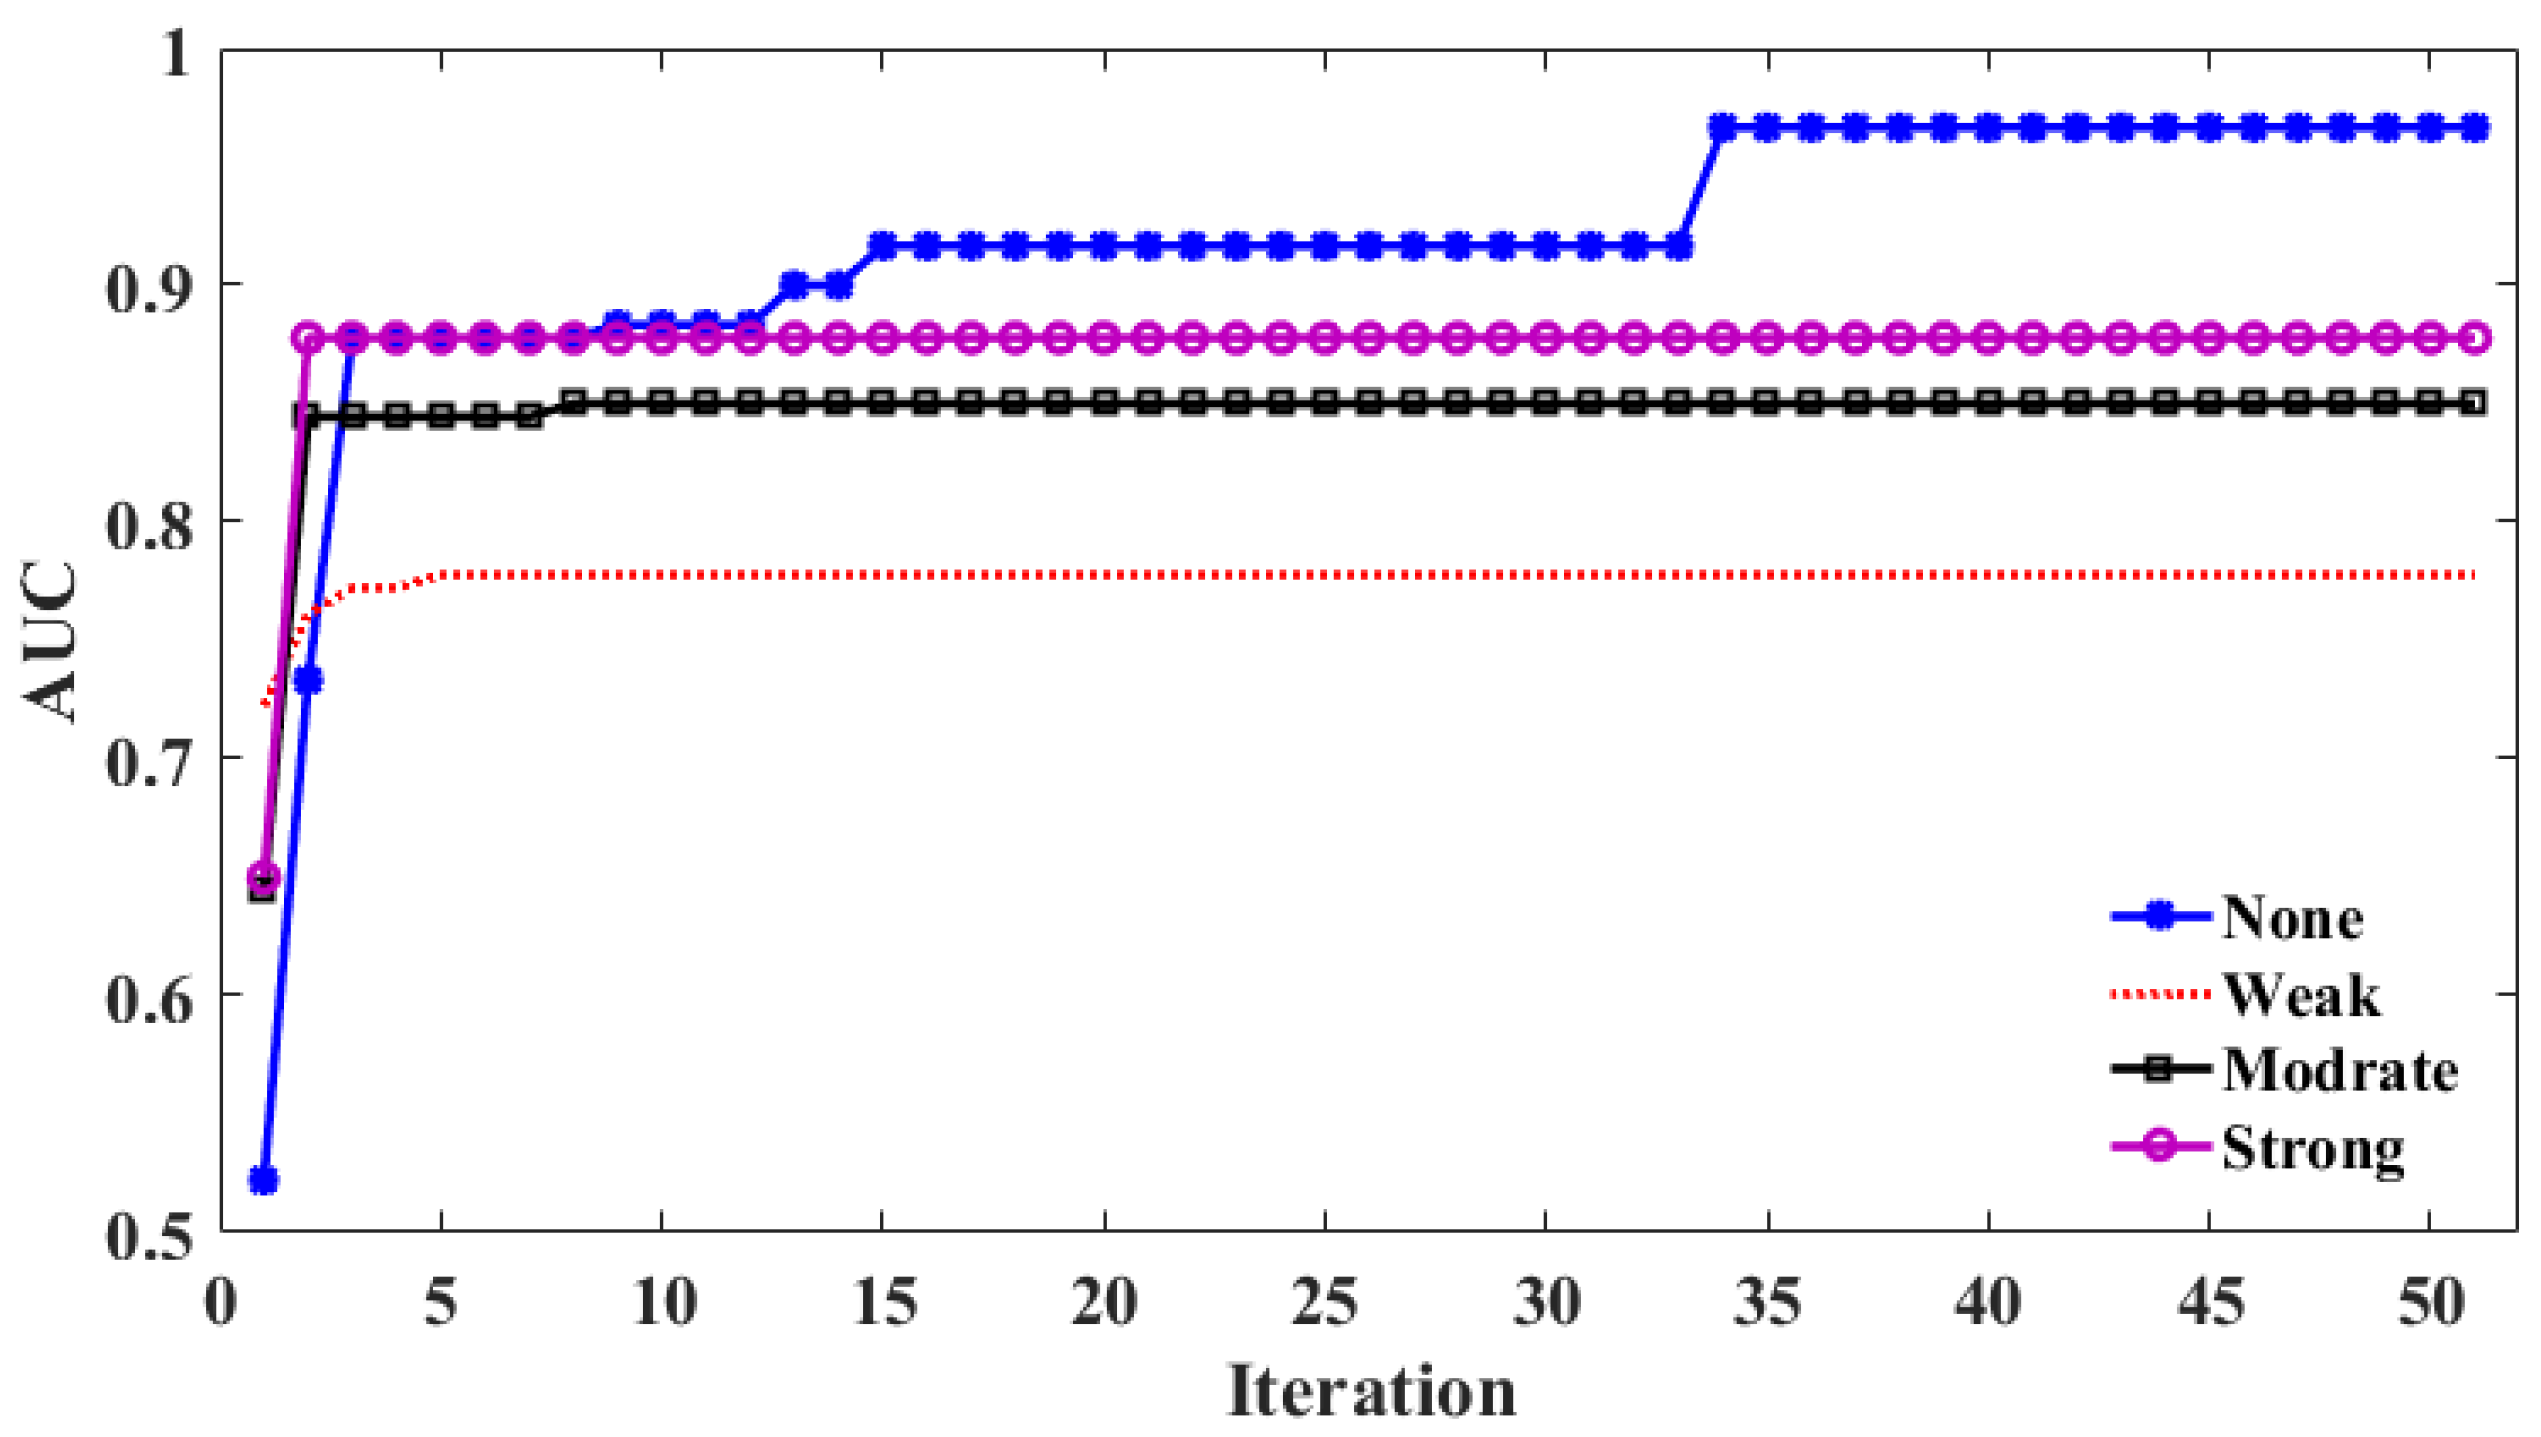
4.1. Hyper-Parameter Tuning

In this procedure, AUC was set as the objective function, and the hyper-parameters of RF, i.e., (the number of the trees and the minimum required samples at a leaf node) were tuned by BAS. Then, in the test process, four BAS-RF models were used to classify the unknown samples. The AUC values and convergence showed different patterns with different classes (given in Figure 8). With the increase of iteration, the average AUC values increased sharply before five iterations, meaning that the BAS could tune the hyper-parameters quickly and effectively. The hyper-parameters of RF were given in Table 3.

4.2. Validation of BAS-RF

In the testing dataset, the proposed BAS-RF model was applied to validate the accuracy on that dataset. The final results are given in Table 4. As can be seen, the accuracy was over 0.90, which means that the proposed model could be used for a new dataset.

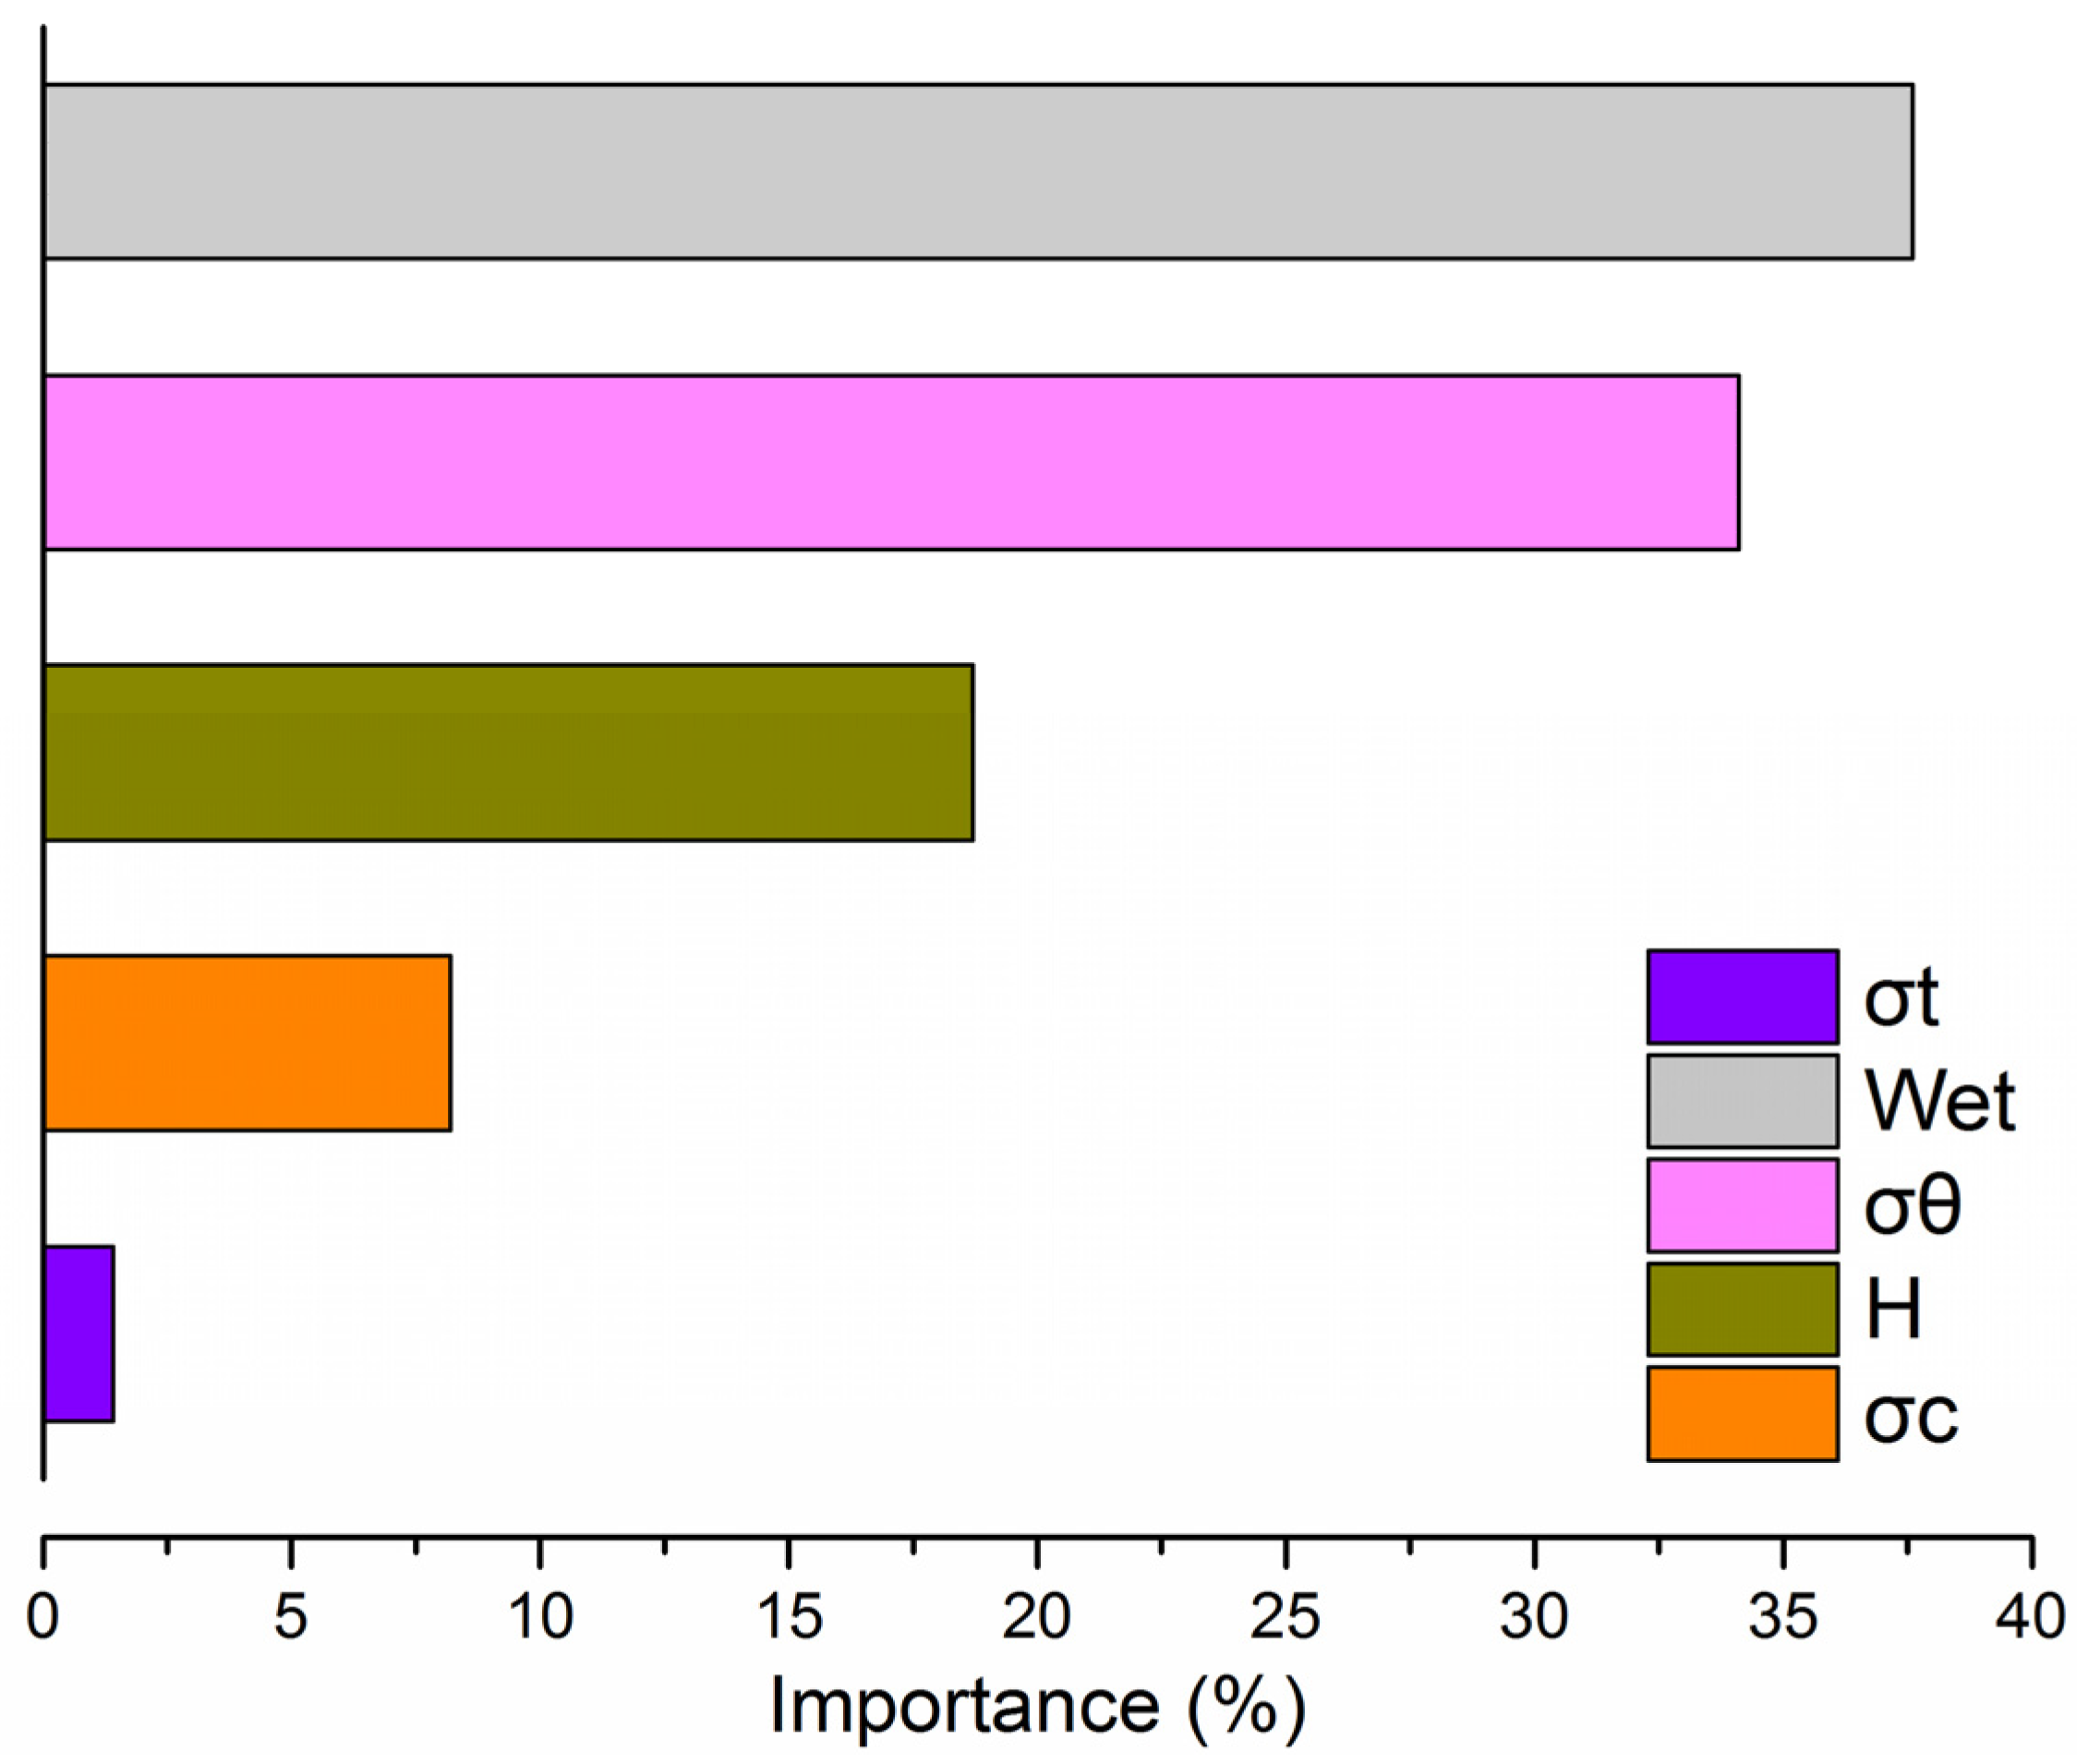
4.3. The Rank of Influencing Variables

The ranking influence of each input variable on the rockburst is depicted in Figure 9. Wet was the most important variable influencing rockburst intensity, followed by σ θ , H, σ c , and σ t . The results indicate that more attention should be given to Wet, σ θ , and H in engineering projects. Although some parameters, i.e., σ c , and σ t , have a lower influence on rockburst intensity, they should still be taken into account when analyzing rockburst events.

5. Discussion

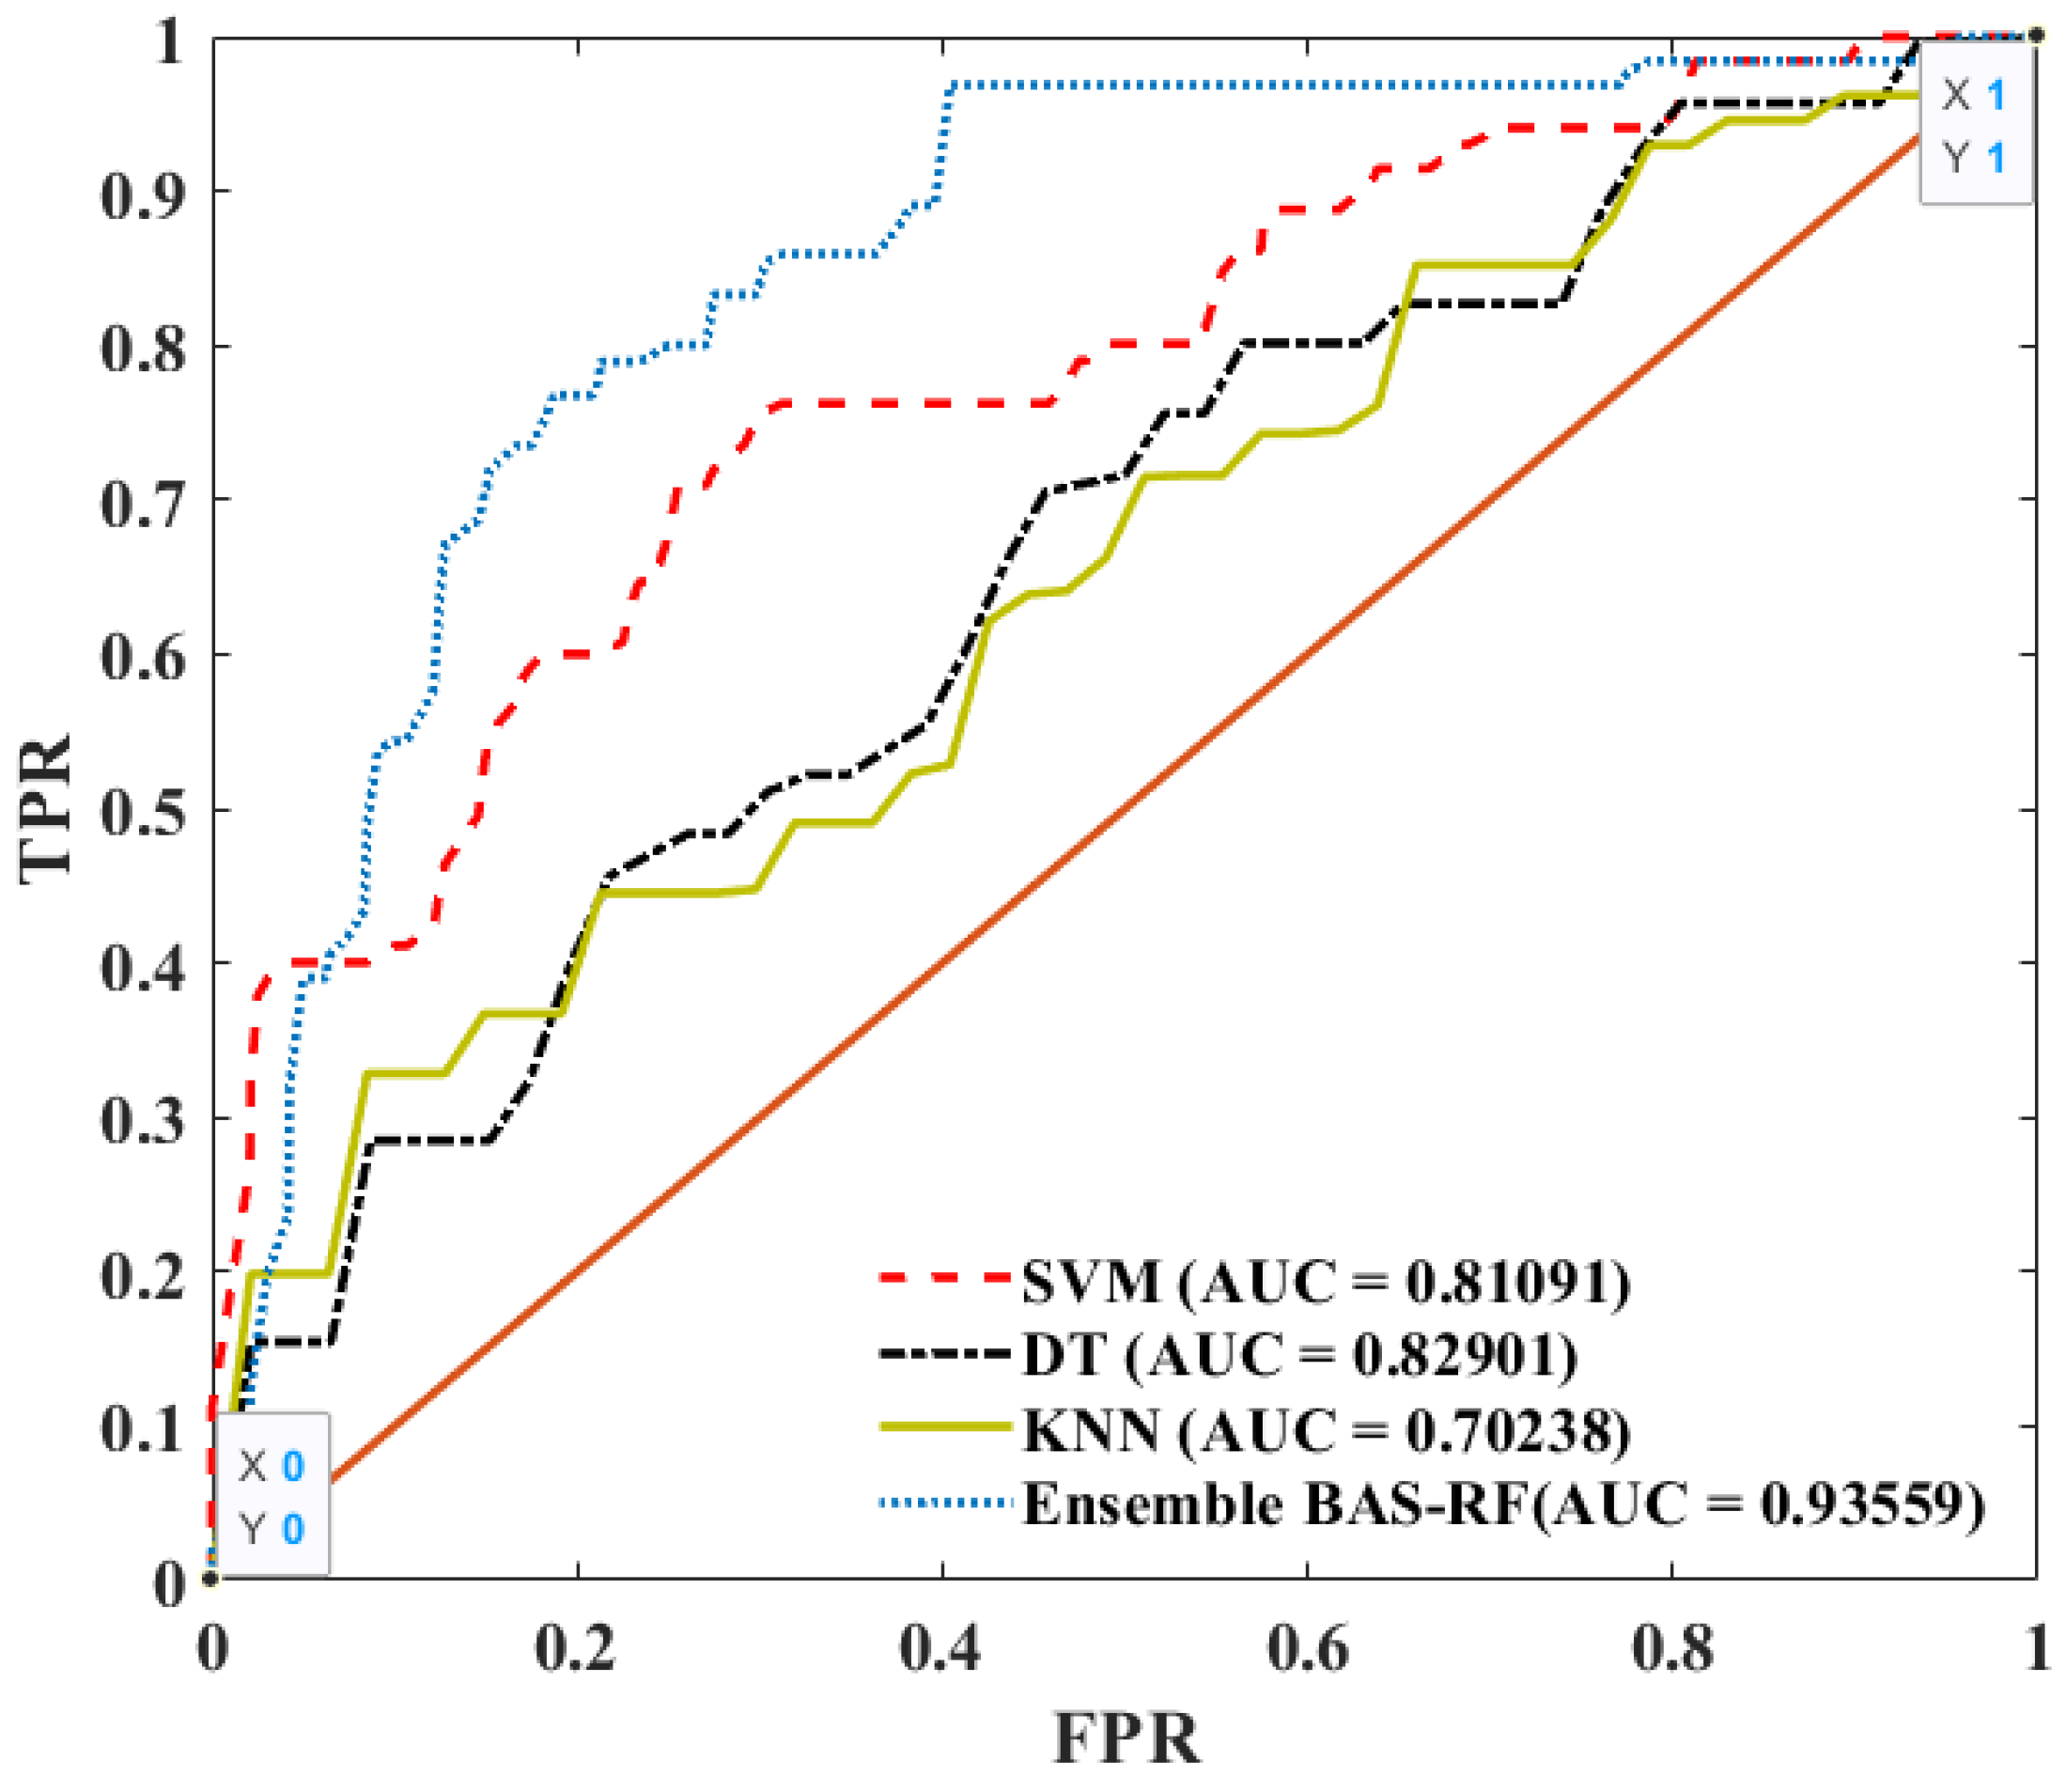
5.1. Comparison of the BAS-RF with Baseline Models

The performance of the BAS-RF model was evaluated with SVM, DT, and KNN machine learning models. The BAS-RF model was the most accurate model, having an accuracy of 0.92 (Table 5). The DT, SVM, and KNN models had accuracies of 0.84, 0.76, and 0.71, respectively. The comparison analysis confirmed that the proposed BAS-RF model achieved a better performance than the other machine learning classifiers. Furthermore, the conventional RF models on rockburst assessment in previous studies were compared with BAS-RF; the accuracy performance of BAS-RF was higher than existing RF models. Few studies have already applied the conventional RF model for rockburst assessment. In this section, the proposed ensemble classifier BAS-RF was compared with the findings of the previous studies. Zhou et al. (2016) compared the performance of 10 machine learning algorithms to analyze rockburst events. They used 246 cases and considered seven input variables. Lin et al. (2018) investigated rockburst events using machine learning models. They investigated 246 rockburst cases, considering six input variables. The accuracy performances of the RF model developed by Zhou et al. (2016) and Lin et al. (2018) were 0.73 and 0.61, respectively. The BAS-RF model performed much better compared to the existing RF models. The model was developed using a larger dataset, and thus, it can be applied over a wider range of conditions. Although both models developed by Zhou et al. (2016) and Lin et al. (2018), respectively, considered seven and six input variables, they still led to a lower prediction accuracy. Furthermore, we compared the results (summarized in Table 5) with conventional empirical models, such as the rock brittleness coefficient criterion, burst proneness index, and Russenes criterion. The BAS-RF model performed better than the empirical models.
The TPR (True Positive Rate) and AUC values calculated for all classifiers shown in Figure 10 indicate that the ensemble classifier BAS-RF provided the most accurate classification. The ensemble BAS-RF led to an AUC value of 0.95, followed by DT, SVM, and KNN. The AUC values of DT, SVM and KNN were 0.82, 0.81, and 0.7, respectively.

5.2. Cases Application

Eight rockburst events in four different tunnel and mining projects were predicted by the BAS-RF model. The field data were collected from available literature, including the Calling tunnel, Dongguashan mine [37], Duoxiongla tunnel [38], and Daxiangling tunnel [30]. The prediction outcomes are summarized in Table 6, which indicated that the rockburst intensity for all cases was predicted correctly. The results of this study confirm that the BAS-RF model is a robust alternative tool for the rockburst assessment, and it can be successfully applied in various geotechnical engineering projects.

6. Summary and Conclusions

A novel ensemble classifier combining the random forest (RF) and Beetle Antennae search algorithm (BAS) was proposed to classify rockburst intensity in underground projects. The BAS algorithm was applied to tune hyperparameters of the RF. The performance of the proposed model (BAS-RF) was evaluated by its accuracy, precision, and recall criteria. Additionally, the ROC curve and AUC values were used to assess the rockburst intensity. The conclusions can be summarized as follows:
  • The BAS algorithm could tune hyperparameters of the RF model effectively, leading to a satisfactory performance of the BAS-RF model in rockburst classifications.
  • The BAS-RF model performed much better compared to the other classifier. The BAS-RF was the most accurate model, followed by DT, SVM, and KNN models.
  • Analyzing the relative importance of input variables based on the BAS-RF model demonstrated that Wet has a substantial influence on rockburst.
  • The BAS-RF model provided the most accurate classification as compared to the existing RF model as well as the empirical criteria.
  • We successfully applied the BAS-RF model for predicting rockburst events in new projects. The proposed model had a high generalization ability, which facilitates its future application in rockburst intensity assessments.
  • It should be pointed out that the generalization could have been improved if we had used a large dataset to train the model.

Author Contributions

Conceptualization by Y.S., G.L. and S.Y.; writing—original draft preparation, Y.S. and G.L.; writing—review and editing, G.L. and S.Y.; supervision, G.L.; funding acquisition, G.L. All authors have read and agreed to the published version of the manuscript.

Funding

This research was supported by the projects of “the Fundamental Research Funds for the Central Universities (2020ZDPY0221, 2021QN1003)”, “National Natural Science Foundation of China (52104106, 52174089)”, and “Basic Research Program of Xuzhou (KC21017)”.

Institutional Review Board Statement

Not applicable.

Informed Consent Statement

Not applicable.

Data Availability Statement

The data presented in this study are available on request from the corresponding author. The data are not publicly available due to privacy.

Acknowledgments

Special thanks to Zuqi Wang for her encouragements.

Conflicts of Interest

The authors declare no conflict of interest.

References

  1. Kaiser, P.K.; McCreath, D.R.; Tannant, D.D. Rockburst Support Handbook; Geomechanics Research Centre, Laurentian University of Canada: Sudbury, ON, USA, 1996. [Google Scholar]
  2. Ortlepp, W. RaSiM Comes of Age—A Review of the contribution to the understanding and control of mine rockbursts. In Proceedings of the Sixth International Symposium on Rockburst and Seismicity in Mines, Perth, Australia, 9–11 March 2005; pp. 3–20. [Google Scholar]
  3. Cai, M. Principles of rock support in burst-prone ground. Tunn. Undergr. Space Technol. 2013, 36, 46–56. [Google Scholar] [CrossRef]
  4. Kie, T.T. Rockbursts, case records, theory and control. In Proceedings of the International Symposium on Engineering in Complex Rock Formations, Beijing, China, 3–7 November 1988; Elsevier BV: Cham, Switzerland, 1988; pp. 32–47. [Google Scholar]
  5. Zhou, J.; Li, X.; Mitri, H.S. Evaluation method of rockburst: State-of-the-art literature review. Tunn. Undergr. Space Technol. 2018, 81, 632–659. [Google Scholar] [CrossRef]
  6. He, M.; Ren, F.; Liu, D. Rockburst mechanism research and its control. Int. J. Min. Sci. Technol. 2018, 28, 829–837. [Google Scholar] [CrossRef]
  7. Dehghan, S.; Shahriar, K.; Maarefvand, P.; Goshtasbi, K. 3-D modeling of rock burst in pillar No. 19 of Fetr6 chromite mine. Int. J. Min. Sci. Technol. 2013, 23, 231–236. [Google Scholar] [CrossRef]
  8. Lu, C.-P.; Dou, L.-M.; Liu, B.; Xie, Y.-S.; Liu, H.-S. Microseismic low-frequency precursor effect of bursting failure of coal and rock. J. Appl. Geophys. 2012, 79, 55–63. [Google Scholar] [CrossRef]
  9. Wang, S.; Li, X.; Yao, J.; Gong, F.; Li, X.; Du, K.; Tao, M.; Huang, L.; Du, S. Experimental investigation of rock breakage by a conical pick and its application to non-explosive mechanized mining in deep hard rock. Int. J. Rock Mech. Min. Sci. 2019, 122, 104063. [Google Scholar] [CrossRef]
  10. Wang, S.; Sun, L.; Li, X.; Wang, S.; Du, K.; Li, X.; Feng, F. Experimental investigation of cuttability improvement for hard rock fragmentation using conical cutter. Int. J. Geomech. 2021, 21, 6020039. [Google Scholar] [CrossRef]
  11. Sun, Y.; Li, G.; Zhang, N.; Chang, Q.; Xu, J.; Zhang, J. Development of ensemble learning models to evaluate the strength of coal-grout materials. Int. J. Min. Sci. Technol. 2021, 31, 153–162. [Google Scholar] [CrossRef]
  12. Zhao, H.-B. Classification of rockburst using support vector machine. Rock Soil Mech. 2005, 26, 642–644. [Google Scholar]
  13. Zhu, Y.H.; Liu, X.R.; Zhou, J.P. Rockburst prediction analysis based on v-SVR algorithm. J. China Coal Soc. 2008, 33, 277–281. [Google Scholar]
  14. Zhou, J.; Li, X.; Mitri, H.S. Classification of Rockburst in Underground Projects: Comparison of Ten Supervised Learning Methods. J. Comput. Civ. Eng. 2016, 30, 04016003. [Google Scholar] [CrossRef]
  15. Adoko, A.C.; Gokceoglu, C.; Wu, L.; Zuo, Q.J. Knowledge-based and data-driven fuzzy modeling for rockburst prediction. Int. J. Rock Mech. Min. Sci. 2013, 61, 86–95. [Google Scholar] [CrossRef]
  16. Haijun, L.C.; Dexin, S.N. Prediction of rockburst by artificial neural network. Chin. J. Rock Mech. Eng. 2003, 22, 762. [Google Scholar]
  17. Guo, L.; Li, X.; Yan, X.; Xiong, L. Rock Burst Prediction Methods Based on BP Network Theory. Ind. Saf. Dust Control 2005, 10. [Google Scholar]
  18. Faradonbeh, R.S.; Taheri, A. Long-term prediction of rockburst hazard in deep underground openings using three robust data mining techniques. Eng. Comput. 2019, 35, 659–675. [Google Scholar] [CrossRef]
  19. Liu, Z.; Shao, J.; Xu, W.; Meng, Y. Prediction of rock burst classification using the technique of cloud models with attribution weight. Nat. Hazards 2013, 68, 549–568. [Google Scholar] [CrossRef]
  20. Zhou, K.-P.; Lin, Y.; Deng, H.-W.; Li, J.; Liu, C.-J. Prediction of rock burst classification using cloud model with entropy weight. Trans. Nonferrous Met. Soc. China 2016, 26, 1995–2002. [Google Scholar] [CrossRef]
  21. Li, N.; Jimenez, R. A logistic regression classifier for long-term probabilistic prediction of rock burst hazard. Nat. Hazards 2017, 90, 197–215. [Google Scholar] [CrossRef]
  22. Afraei, S.; Shahriar, K.; Madani, S.H. Statistical assessment of rock burst potential and contributions of considered predictor variables in the task. Tunn. Undergr. Space Technol. 2018, 72, 250–271. [Google Scholar] [CrossRef]
  23. Li, N.; Feng, X.; Jimenez, R. Predicting rock burst hazard with incomplete data using Bayesian networks. Tunn. Undergr. Space Technol. 2017, 61, 61–70. [Google Scholar] [CrossRef]
  24. Sun, Y.; Li, G.; Zhang, J. Developing Hybrid Machine Learning Models for Estimating the Unconfined Compressive Strength of Jet Grouting Composite: A Comparative Study. Appl. Sci 2020, 10, 1612. [Google Scholar] [CrossRef]
  25. Pu, Y.; Apel, D.B.; Lingga, B. Rockburst prediction in kimberlite using decision tree with incomplete data. J. Sustain. Min. 2018, 17, 158–165. [Google Scholar] [CrossRef]
  26. Sun, Y.; Li, G.; Zhang, J.; Huang, J. Rockburst intensity evaluation by a novel systematic and evolved approach: Machine learning booster and application. Bull. Eng. Geol. Environ. 2021, 80, 8385–8395. [Google Scholar] [CrossRef]
  27. Breiman, L. Random forests. Mach. Learn. 2001, 45, 5–32. [Google Scholar] [CrossRef] [Green Version]
  28. Dong, L.-J.; Li, X.-B.; Peng, K. Prediction of rockburst classification using Random Forest. Trans. Nonferrous Met. Soc. China 2013, 23, 472–477. [Google Scholar] [CrossRef]
  29. Afraei, S.; Shahriar, K.; Madani, S.H. Developing intelligent classification models for rock burst prediction after recognizing significant predictor variables, Section 2: Designing classifiers. Tunn. Undergr. Space Technol. 2018, 84, 522–537. [Google Scholar] [CrossRef]
  30. Long, L.; Chen, J. Fuzzy Comprehensive Assessment Method Adopted to Predict Rock Burst in Daxiangling Tunne. Xiandai Suidao Jishu 2010, 47, 23–27. [Google Scholar]
  31. Li, N.; Jimenez, R.; Feng, X. The Influence of Bayesian Networks Structure on Rock Burst Hazard Prediction with Incomplete Data. Procedia Eng. 2017, 191, 206–214. [Google Scholar] [CrossRef]
  32. Zhou, J.; Li, X.; Shi, X. Long-term prediction model of rockburst in underground openings using heuristic algorithms and support vector machines. Saf. Sci. 2012, 50, 629–644. [Google Scholar] [CrossRef]
  33. Lee, P.; Tsui, Y.; Tham, L.; Wang, Y.; Li, W. Method of fuzzy comprehensive evaluations for rockburst prediction. Chin. J. Rock Mech. Eng. 1998, 17, 493–501. [Google Scholar]
  34. Kidybiński, A. Bursting liability indices of coal. Int. J. Rock Mech. Min. Sci. Géoméch. Abstr. 1981, 18, 295–304. [Google Scholar] [CrossRef]
  35. Russenes, B.F. Analysis of Rock Spalling for Tunnels in Steep Valley Sides; Norwegian Institute of Technology: Trondheim, Norway, 1974; Volume 247. [Google Scholar]
  36. Singh, S. Classification of mine workings according to their rockburst proneness. Min. Sci. Technol. 1989, 8, 253–262. [Google Scholar] [CrossRef]
  37. Jia, Y.; Lv, Q.; Shang, Y. Rockburst prediction using particle swarm optimization algorithm and general regression neural network. Chin. J. Rock Mech. Eng. 2013, 32, 343–348. [Google Scholar]
  38. Tang, Z.; Xu, Q. Rock burst prediction based on nine machine learning algorithms. Chin. J. Rock. Mech Eng. 2020, 161. [Google Scholar]
Figure 1. The statistics of input and output in the rockburst dataset.
Mathematics 09 02965 g001
Figure 2. The structure of DT and RF.
Mathematics 09 02965 g002
Figure 3. The structure of KNN.
Mathematics 09 02965 g003
Figure 4. The structure of SVM.
Mathematics 09 02965 g004
Figure 5. The flowchart of BAS.
Mathematics 09 02965 g005
Figure 6. Fivefold cross-validation (CV).
Mathematics 09 02965 g006
Figure 7. The procedures of hyperparameter tuning of RF by BAS.
Mathematics 09 02965 g007
Figure 8. The evolution of AUC values with different dataset classes by BAS tuning.
Mathematics 09 02965 g008
Figure 9. The relative importance of variables.
Mathematics 09 02965 g009
Figure 10. ROC curve of the proposed ensemble BAS-RF, SVM, DT, KNN.
Mathematics 09 02965 g010
Table 1. Previous studies on rockburst prediction with different machine learning methods.
AlgorithmsAccuracy (%)DataReferences
SVM10016Zhao et al. [12]
93.845Zhu et al. [13]
51.7–67.2246Zhou et al. [14]
ANFIS66.5–95.6174Adoko et al. [15]
ANN72.218Chen et al. [16]
10019Xiao et al. [17]
10010Feng et al. [10]
85.2134Faradonbeh et al. [18]
CM90–94.1164Liu et al. [19]
76.4–82209Zhou et al. [20]
71–76246Zhao et al. [14]
LR80.2–90.9135Li et al. [21]
88.3188Afraei et al. [22]
BN91.7135Li et al. [23]
53.9–65.8246Lin et al. [24]
KNN53.2–67.2246Zhou et al. [14]
50–65.9246Lin et al. [24]
DT81.5134Faradonbeh et al. [18]
73–93132Pu et al. [25]
89.2–90.2174Ghasemi al. [26]
Note: SVM, Support vector machines; ANFIS, adaptive neuron fuzzy inference system; ANN, Artificial neural network; LR, Logistic regression; CM, Cloud model; BN, Bayesian network; KNN, k-nearest neighbors; DT, Decision tree.
Table 2. The collected input variables.
ParametersMinMaxMeanStandard Deviation
H (m)801251682.2291.4
σ c (MPa)3.6306.6118.969.8
σ t (MPa)0.221.28.66.1
σ θ (MPa)2.1171.163.442.5
Wet0.8510.575.23.4
Table 3. The optimum hyperparameters in each class.
Number of Input VariablesHyperparameterDefinitionScopeClass
NoneLightModerateStrong
5tree_numThe number of the trees2–10042293417
min_sample_leafThe minimum required samples at a leaf node1–101121
Table 4. The confusion matrix of the proposed model on test validation.
RockburstActualPredictedPercentage CorrectAccuracy
NoneLightModerateStrong
None35321110.910.92
Light20119000.95
Moderate15011310.86
Strong14010130.92
Table 5. Classification accuracy of ensemble classifiers and baseline models.
ML ModelsEmpirical Models
BAS-RFSVMDTKNNConventional RFRock Brittleness Coefficient CriterionElastic Energy IndexRussenes CriterionBurst Proneness Index
0.920.760.840.710.73, Zhou et al. (2016) [14]; 0.61, Lin et al. (2018) [24]0.32, Wang et al. (1998) [33]0.41, Kidybinski (1981) [34]0.36, Russenes (1974) [35]0.21, Singh (1989) [36]
Table 6. Engineering application of the proposed BAS-RF model.
No.H (m)σθ (MPa)σc (MPa)σt (MPa)WetActualPredicted
1 [37]76832.81606.64.6LightLight
2 [37]76850.91607.55.3ModerateModerate
3 [37]730105.5190.317.14.0ModerateModerate
4 [38]70087.3137.79.627.14StrongStrong
5 [38]70087.394.49.163.57LightLight
6 [30]80845.61142.34.7ModerateModerate
7 [30]36225.659.71.31.7NoneNone
8 [30]98157.280.62.55.5StrongStrong
Publisher’s Note: MDPI stays neutral with regard to jurisdictional claims in published maps and institutional affiliations.

