1. Introduction
Currently, the spread of diseases through air transport has become an urgent topic because of COVID-19 increasing across the globe. To date, worldwide, more than 200 million people have been infected and about 4.5 million people have died [
1,
2]. The spread of the disease has been greatly increased by the number of air routes and mass transport airlines between countries. In recent years, air routes have become the largest means of mass transportation, with 38.3 million flights and more than 4.5 billion passengers in 2019 [
3].
An example of the spread of an infectious disease is SARS (severe acute respiratory syndrome) in 2003, which was identified in the city of Foshan, China. Worldwide, SARS infected 8448 people in 29 countries and killed 774 individuals. The spread of SARS occurred because of land transportation (neighboring communities) and airlines (to multiple countries) [
4]. SARS and travel were intricately interrelated, creating international anxiety because of the ease of transmission in certain settings and the speed of its spread through air travel. However, as entry points for travelers, airports are expensive when it comes to attempts to detect diseases, both in terms of equipment and health inspection personnel [
5,
6].
Influenza A (H1N1), in 2009–2010, was another example of a spread disease. This pandemic was caused by a variant of influenza virus A (H1N1 subtype). AH1N1 had 1,678,817 confirmed patients and 19,274 deaths in 205 countries over the course of a year. The mortality of AH1N1 was low, between 11% and 21%, despite its high level of spread [
7]. In this case, air mobility was a crucial means of contagion in generating the AH1N1 pandemic [
8]. These types of viruses are considered by the World Health Organization to seriously impact human health. Another study on AH1N1 is was carried out by Hsu and Shih [
9], which showed that 50 main world airports contributed a large percentage of the transmission of this disease. Notably, if there is no effective means of controlling these main airports, within 13 days, a spreading virus will reach most countries.
Nocilla Bellomo published an article in 2020 [
10] wherein he describes a mathematical model within a multiscale framework describing the interactions between cells and a virus, as well as a virus and the population in general. The study focuses on the behavior of the spread of the virus in the population (individuals: infected and recovered), as well as the spatial patterns of infection applying kinetic and lattice models. The research takes a multi-disciplinary point of view in the areas of virology, epidemiology and economics, oriented to social behavior. One of the most relevant aspects of the study is the infection and its relationship between the infectivity features of each individual and the existing distances (space homogeneity) between everyone in a group, based on the local population density. This makes possible determining that the ability to develop an immune defense is heterogeneously distributed throughout a population.
Very relevant research was presented by Daewa Kim in 2020 [
11], whose study considered a kinetic equation modeling crowd dynamics and game theory to describe infection. The simulation environment was modeled using the tools of game theory, where the test was coupled with a model of a problem involving a small crowd walking through a corridor. The most relevant aspects are presented in the results, wherein the simulation shows that the probability of an infection’s disease spreading is reduced when avoiding forcing several people into a corridor (confined environment) for sustained periods of time, wherein the distance and time interactions between people is important.
Concerning the current global COVID-19 health crisis, an algorithm has been developed to alert international airports to the spread of infectious diseases. This algorithm applies fuzzy logic for detecting airports and air routes with the highest probabilities of contagion. In addition, it uses population density and a virus’s reproduction rate, among other parameters. This algorithm is an intelligent control and monitoring mechanism for air routes that integrates information from various systems, hence, potentially preventing future points of disease spread.
The current article is structured as follows:
Section 2 presents a literature review of the most relevant research in applying fuzzy logic for decision making, Markov chains, and virus spread in air transport. In
Section 3, the materials and methods used as the basis for generating the proposed algorithm are presented. In
Section 4, the structure and operation of the algorithm are detailed, as well as the application of machine learning techniques and statistical methods. In
Section 5, the test, the results and a discussion of the data obtained from applying the algorithm are presented. Finally, in
Section 6, the conclusions obtained during the study and future lines of research are presented.
2. Literature Review
In this section, the most relevant papers published on the spread of infectious diseases are presented, describing their contributions and findings.
The research published by Gardner [
12] details a transport network model used to identify the level of risk of the spread of MERS–CoV by air travelers with an international destination. This model uses travel patterns to prioritize countries with the highest risk of importing the virus. The study presents the geographical areas connected with the countries with the MERS–CoV contagion. In addition, it calculates the risk of importation by and classification of the type of traveler. The results showed that India, Pakistan and Bangladesh are the countries with the highest contagion risk within the 50 countries reporting positive cases [
13].
Nakamura and Managi [
14] have produced similar research showing the relative risk of the import and export of the COVID-19 virus in all airports around the world. This index was determined by the cartographic and spatial information of the location of each of the national and international airports of each country. The results showed that China, Europe, the Middle East, East Asia, America and Australia are in danger of imminent spread. The author recommends a decrease in air traffic, which will lead to a gradual reduction in contagion.
Another research about risk of spread of COVID-19 by international flights is presented by Zhang [
15]. The research proposes a risk index related to the connectivity of international air routes and COVID-19 contagion data, updated by each country. This index can measure the risk by air route, country of destination, and province. Here, the restrictions imposed by China in March 2020 were very effective in reducing imported cases. From the results, the authors could conclude that a balance in travel restrictions based on the risk index helps minimize the cases of imported infections.
The research developed by Zhang [
16] analyzes the different propagation models of COVID-19 in China; here, considering the factors that influence the different modes of transport (aerial and train). The article explores variables such as speed and propagation pattern, frequency of flights or trains during the pandemic, and destination from the city of Wuhan to other cities in China. These variables are associated with the number of positive cases reported in the destination cities. A strong relationship has been identified between the speed of propagation and presence of an airport or train station in the city of origin. On the other hand, proximity to the city of Wuhan has a positive relationship with the number of reported cases.
Christidis and Christodoulou [
17], provide another way to predict the risk of COVID-19 spread based on travel patterns; this study details a methodology used during the first months of the COVID-19 pandemic, where this model applied values to air routes to measure the risk of spreading the virus outside of China. Applying the susceptible– infected–recovered (SIR) model and Richards’ curves to determine the growth of contagion in the population, the stochastic fluctuations of the factors affecting the spread of COVID-19 are directly related to air transport. This relationship between factors has high levels of uncertainty, which prevents predicting a spatial pattern optimal from propagation.
A clear example of air mobility is the research carried out by Katafuchi [
18], where the authors present a theoretical and empirical analysis during the COVID-19 pandemic. This study analyzes the behavior of travelers at international airports and the factors related to international transport policies. The research presents a mobility data model to identify air transport policies and health regulations on the spread of infectious diseases. In addition, the model considers the psychological factors of travelers during a state of health emergency. The results indicate that it is necessary to reach a balance in declaring a state of emergency because doing so has a positive and negative effect in reducing the number of people traveling (arrivals).
Nikolaou and Dimitriou [
19], have designed an epidemiological model based on the land transport network and airlines that is capable of simulating the epidemic spread of infectious diseases originating in distant parts of Europe. The simulations, which are run with COVID-19 as the disease, present mild and serious cases of spread, resulting in concrete evidence of the effectiveness of sanitary control at airports. As a guide, the results show the need to restrict entry to airports in the first days of alert of disease spread. This should be done to prevent massive contagion; otherwise, the disease will spread through multiple cities and countries of the European community in a few days.
Sun’s research [
20] about the spread of diseases through air transport is presented from a different perspective. This research focuses on the impact of existing air routes and networks around the world on the spread of COVID-19; the study analyzes the spatial-temporal evolutionary dynamics of contagion in air transport networks, where there are airports and countries that contain a concentration of routes to multiple destinations (they promote the spread). This analysis identifies the impact of COVID-19 on aviation from a monitoring point of view, here by applying a complex network science system. The results of the study show that of the 213 countries in the world, only 50 represent the largest share of air traffic. Also, these airports have routes with further destinations, which promote spread, compared with short air routes.
The spread of COVID-19 through airports has threatened public health worldwide [
21]. Dabachine [
21] focus on health risk management at airports and passenger flow, where a simulation model was established for Mohammed V International Airport. These simulations were conducted in multiple daily air traffic scenarios with a variety of circumstances. The authors could calculate the number of passengers being served at all counters, optimizing the number of passengers attending each airline based on the proposed sanitary measures. In addition, the model prevents unexpected events, such as avoiding congestion and long waiting times, where all health policies, such as social distancing and a small number of people, are guaranteed.
The research of Hwang [
22] presents a simulation of the spread of infectious diseases in an accelerated way through air travel (H1N1 influenza in 2009). This simulation was carried out by examining the appearance of H1N1 influenza in the US (2009) and its spread to 55 cities. The simulation considers the values of the contagion variable
, 1.70 and 1.90 of the virus, the susceptible–exposed–infectious–recovered (SEIR) model, and other empirical data on the H1N1 virus. The results allow for anticipating the entry of a person who is infected with the virus to the airport, in addition to assessing the risk of the spread in the population with optimal precision. The study reflects that the detection time for the entry of a virus through a US airport varies in the early stages of the pandemic, where 96% of the origins with
spread in less than 75 days.
Wang [
23] have generated a Markov decision process (MDP) model to analyze the scheduling strategies for the availability of medical supplies for emergencies, such as COVID-19. The MDP assumes a probability in an initial time period based on the Poisson distribution, the location (hospital or health center), and the priority of each hospital unit (critical, urgent, priority and routine). The proposed model is tested through a simulation in which the variables are identical to the extreme conditions of a hospital during the pandemic. The results show that the model is able to improve the rate of supply availability within the health system.
On the other hand, a variety of investigations have also been developed in the application of fuzzy logic for decision making in different areas of the airport network. A clear example is that of Loh [
24], where airports are identified and classified based on different criteria, such as airport charges, airport performance, growth opportunities, catchment area, and infrastructure. The information collected in the study is analyzed using the fuzzy analytical hierarchy process (FAHP). The results contribute to an optimal evaluation of airports and provide a frame of reference for each airport and its transport operations.
3. Materials and Methods
This section details the materials used in the current study, such as the databases of airports, the spread of COVID-19 around the world, and the population density per country. The methods, algorithms, and techniques used to develop the proposal are also described.
3.1. Materials
3.1.1. Airport Database
The data set used is a compilation of information from the airports of 193 countries, with 26,923 records from the flight connections portal [
25]. This information contains spatiotemporal data and other characteristics of the airports. The present study focuses on the spread of the COVID-19 virus from the city of Wuhan, China, to different countries through travelers who have used air routes. Each record has seven variables, where three describe the information of the airport, such as the codes [
26] of each origin and destination airport. In addition, the dataset has four attributes with the spatial location of each airport, as shown in
Table 1.
The present study uses information on 1,253 international airports and their passenger traffic, both for boarding and arrivals. For this, the data from [
27] is used, which describes the ranking, airport city, IATA code, passenger boarding, and arrivals in 2017 (as shown in
Table 2).
3.1.2. COVID-19 Contagion Database
This data set is obtained from John Hopkins University [
2], which has information reported for all countries from the beginning of the pandemic to the present. The database has 49,068 records from 20 January to 27 July 2020, which was the period during which COVID-19 spread 19 throughout the world. This information contains five variables, of which the first two describe the country and date of the report. The other four variables describe whether there are confirmed cases of contagion (confirmed), deaths (deaths), or recovered (recovered) from COVID-19, as shown in
Table 3.
3.2. Methods
3.2.1. Graph Theory
Graph theory, which is a branch of mathematics, is concerned with networks of points connected by lines. Graph theory originated in recreational math problems, but it has grown into a significant area of mathematical research, with applications in several sciences [
28].
Graph definition: A graph is an ordered pair
consisting of a nonempty set
(called the vertices) and a set
and
(called the edges) of two-element subsets of
, as shown [
29].
Directed graph: A directed graph or digraph is an ordered pair
comprising
, a set of vertices, and
and
, a set of edges, which are ordered pairs of vertices (i.e., an edge is associated with two distinct vertices) [
29].
3.2.2. Dijkstra’s Algorithm
This algorithm is used for finding the shortest paths between nodes in a graph, where the shortest path tree is found from a single source node by building a set of nodes that have a minimum distance from the source [
30]. This can be applied to both directed and undirected graphs. However, all edges must have nonnegative weights. The inputs are the weighted graph
and source vertex
, such that all edge weights are non-negative. The outputs are the lengths of the shortest paths from a given source vertex
to all other vertices [
31].
The following pseudocode Algorithm 1 shows the process for finding the shortest paths between the nodes in a graph.
| Algorithm 1 Dijkstra’s algorithm pseudocode [32] |
For all
do
While
Do
For all
Do if
Then
(if desired, add traceback code)
| (distance to source vertex is zero)
(set all other distances to infinity)
(S, the set of visited vertices is initially empty)
(Q, the queue initially contains all vertices)
(while the queue is not empty)
(select the element of Q with the min. distance)
(add u to list of visited vertices)
(if new shortest path found)
(set new value of shortest path) |
3.2.3. Euclidean Distance
The Euclidean distance has been widely used in various geocoding/reverse geocoding applications. For example, the Euclidean distance between the geocoded point and true address location can be computed to evaluate the positional accuracy of a geocoding procedure. The Euclidean distance can be used to calculate the distance between two points, as shown [
33]. If the points
and
are in two-dimensional space, then the distance between them is as follows:
3.2.4. Fuzzy Logic Theory
Fuzzy set theory (fuzzy logic) determines that an element
is a member of one or more sets, unlike classical set theory where the membership of a set is unique. This theory is defined as a mathematical form of the imprecision in information reality, that is, it expands the characteristics of classical set theory and allows values in partial or intermediate sets [
34]. In mathematical terms, where
is the universe set that contains several elements defined as
. Membership in classical set theory is given by a subset
within the universe
, where each element
or
. This membership is defined by the function
of Equation (2).
Within the fuzzy theory, the membership function is modified for graded memberships where they are transformed into a function (the ith set) of pertinence in a partial set by Equation (3).
On the other hand, for restricted fuzzy sets, the following is defined: (4):
The function
defines the membership probability of
x to the ith set; in addition, the possible sets
are possible. Equation (4) is not required in certain conditions. In the case, we have a fuzzy set without restrictions; this is when this restriction is eliminated. When there is the case of unrestricted fuzzy sets,
, these sets could represent the probability of being part of the set
. In multiple cases it can belong to several sets, where the information is ambiguous or missing, where the sum of
could exceed 1. Finally, different situations can be found where the sets
do not represent all the existing sets; in that case, the determined observation has a small probability of being part of belonging to one of the
sets, where the sum of
would be less than 1 [
35].
3.2.5. Markov Chain
In conditional probability theory, the Markov chain is a stochastic model that calculates the probability of the occurrence of events from one state,
, to another state,
. Markov chains have been used in many scientific areas, ranging from text generation to prediction routes models. A Markov chain is a stochastic process, but it must be “memory-less”; this process is the probability of future states and is not dependent on the steps leading to the present state (Markov property), as shown in Equation (5) [
36].
The knowledge of the previous state is all that is necessary to determine the probability distribution of the current state .
A transition matrix for the Markov chain at a time is defined by a matrix that has the probabilities of occurrence between the possible states, . This matrix, , presents the probabilities, given an order of the rows and columns within states , that the element of the matrix is given by .
Transition matrices have the property that the product of subsequent matrices can describe a transition along the time interval spanned by the transition matrices. That is, has in its position the probability that given that . In general, the position of is the probability .
The
-step transition matrix is
and, by the above, satisfies matrix Equation (6) [
37].
4. Algorithm for Preventing the Spread of Diseases by Air Routes (APSDAR)
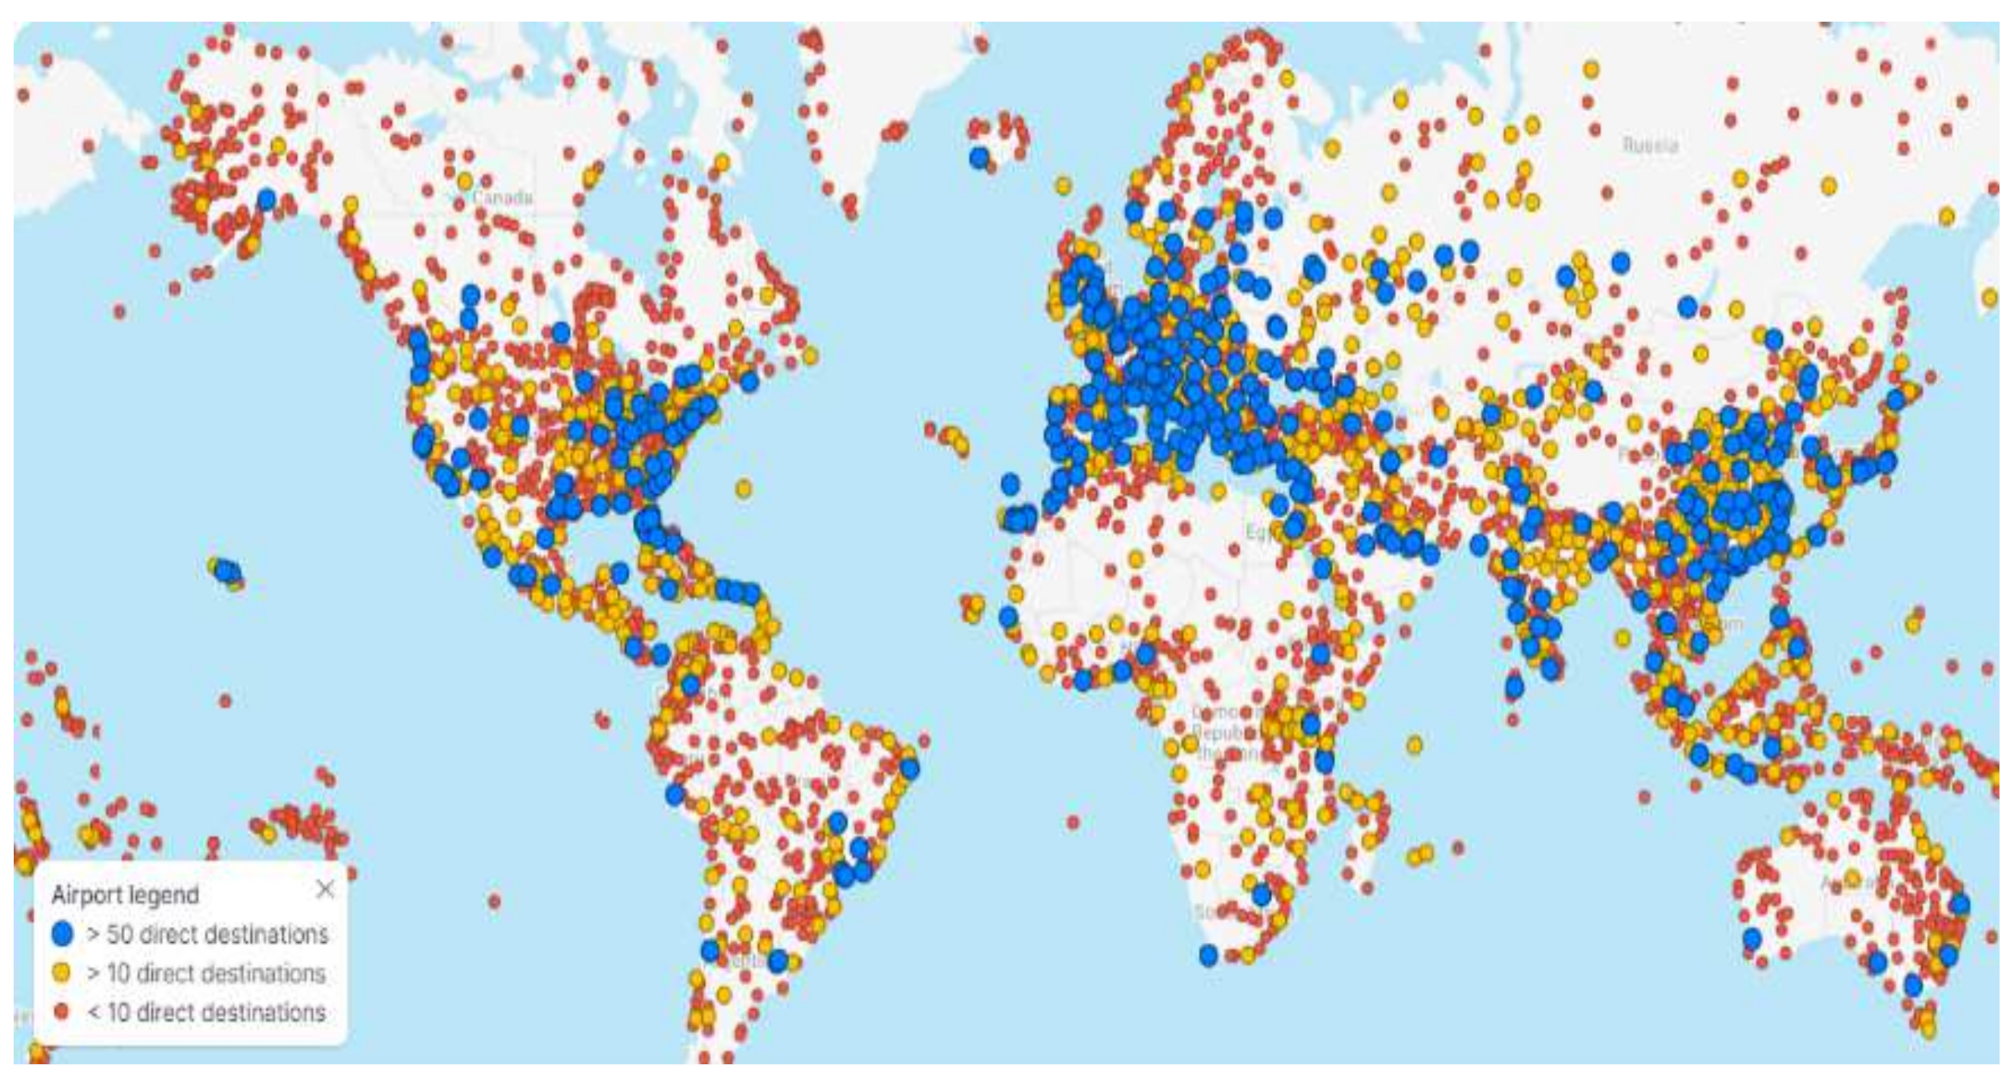
The present APSDAR algorithm alert the spread of diseases by airports around the world. In
Figure 1, all the airports in the world and their number of destinations are described. The red dots are airports with less than 10 destinations, and those with orange dots are airports with between 10 and 50 destinations. Finally, the blue dots are airports with more than 50 destinations.
The algorithm is structured in three stages: the first stage generates the airport network by applying graph theory and Dijkstra’s algorithm to generate the possible routes between the origin airport and destination airport. In the second stage, fuzzy logic is applied to determine the risk level of each airport. Finally, the third stage identifies the routes with the highest risk of disease spread by applying the results of the fuzzy system and the conditional probability by applying the Markov chain.
4.1. First Stage: Generation of Air Routes by Applying Dijkstra’s Algorithm
At this stage of the algorithm, the airport network is developed in a graph
; here, based on information from the international airports database in
Table 1. This information allows for spatially locating the geographic location of each airport, which is defined as
. On the other hand, the distances that separate the airports are defined as
, which can be calculated by applying Equation (1) between an origin airport
and destination airport
, as shown in
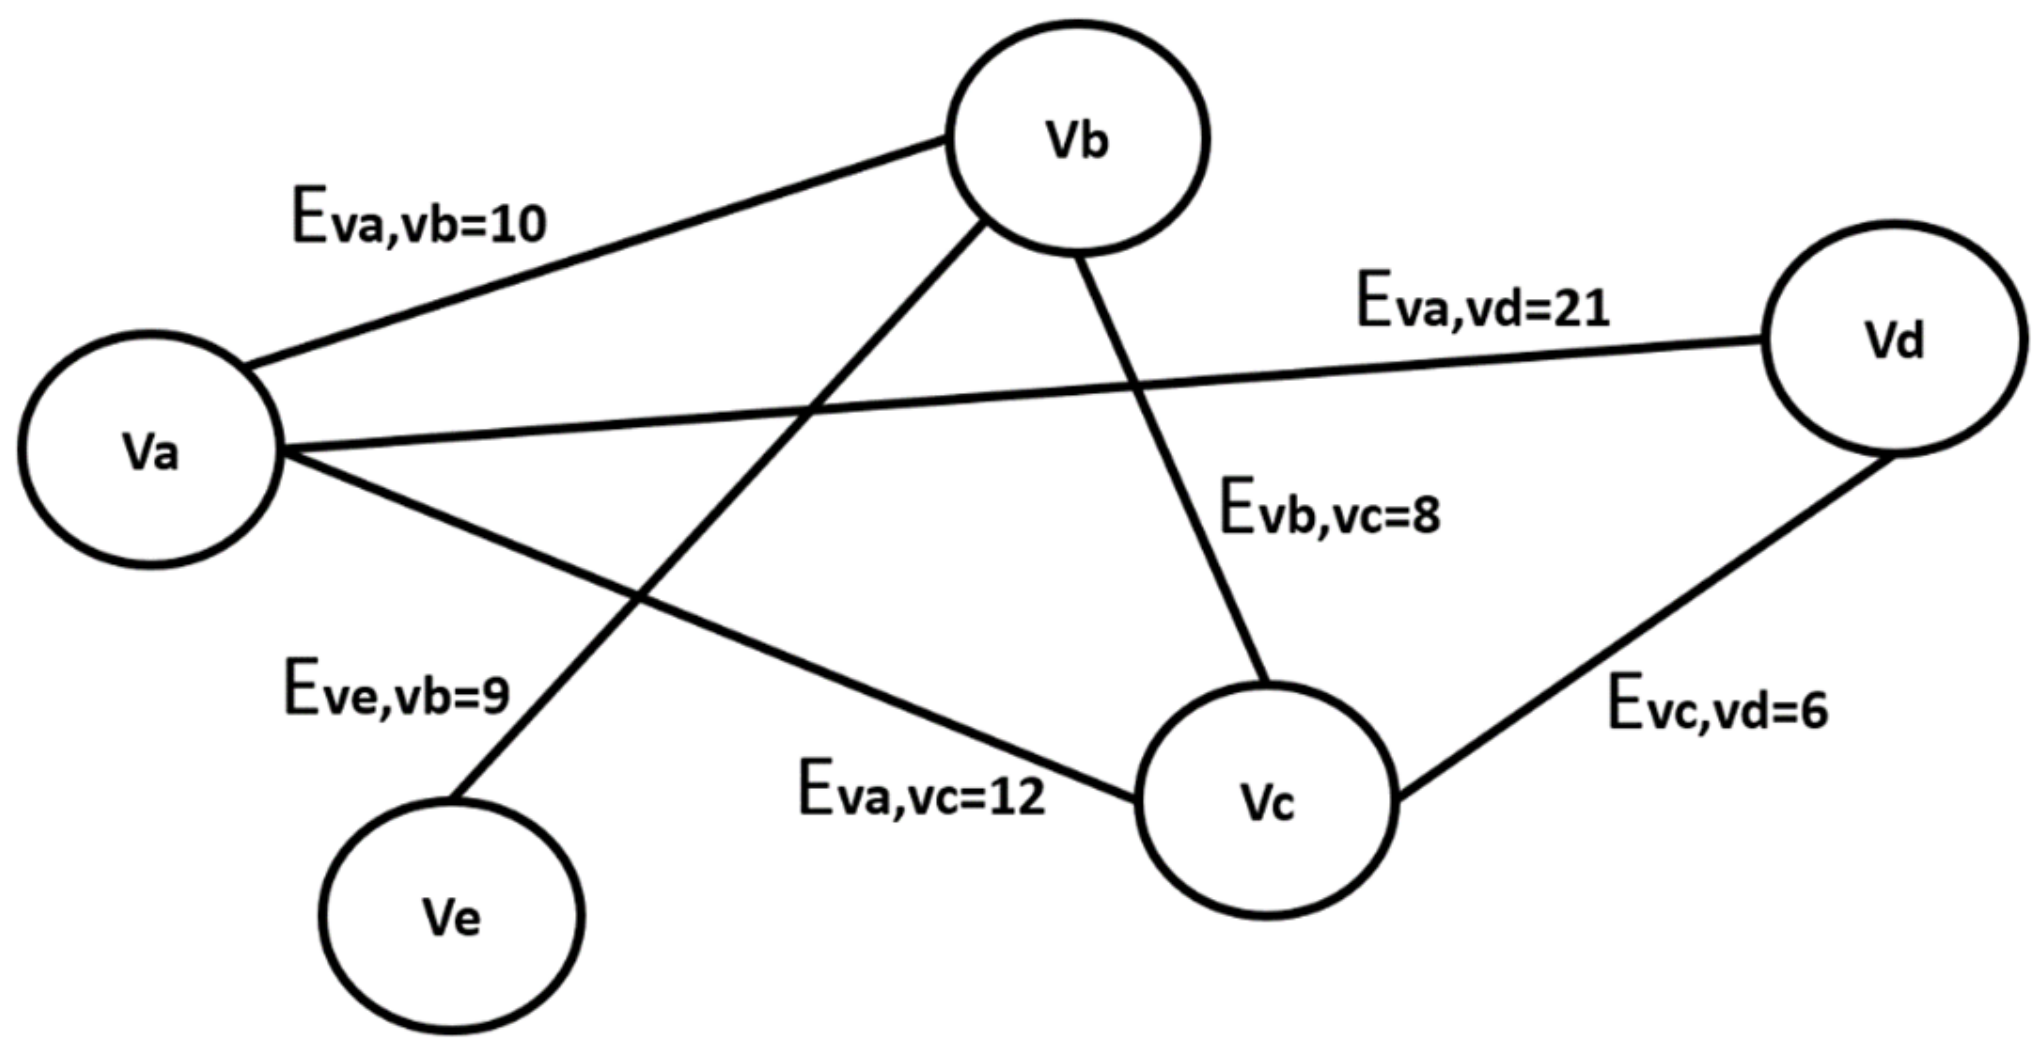
Figure 2.
Graph G represents the information on the origin and destination routes of the flights at each of the airports of the global network of international airports. With this information, routes can be generated and passengers can get from their airport of origin to their airport of destination.
An example is the distance between airport
and airport
, which is calculated by applying Equation (1), as follows:
With the international airport network
, the shortest route (
) between an origin airport
to a destination airport
is determined by applying Dijkstra’s algorithm and Algorithm (1). In this way, the possible stopovers that a route can make from its origin to its destination are determined. To illustrate an example using
Figure 2, the shortest route between airport
(origin airport) and
(destination airport) is determined.
Table 4 illustrates the possible routes generated by Dijkstra’s algorithm, where the most efficient result is
-
-
with
.
Dijkstra’s algorithm is used to simulate the behavior of a passenger who wants to travel from the origin airport, where they can use several airlines and stopovers, until the destination airport.
4.2. Second Stage: Diffuse System to Prevent the Spread of Diseases at Airports
The objective of this stage is to identify the airports with the highest risk index for the spread of an infectious disease, such as COVID-19. To do this, a fuzzy decision-making system that assesses a certain number of variables, such as population density (airport country), basic number of disease reproductions, amount of passenger traffic in the airport, and number of infections by country, is applied. Each of these parameters is obtained from the databases detailed in
Section 3.1.1,
Section 3.1.2 and
Section 3.1.2.
These parameters were selected based on article [
14], where the risk of COVID-19 import and export is calculated based on virus infection data (COVID-19 Map-Johns Hopkins Coronavirus Resource Center), transport network characteristics (IATA), population of the city and the GDP of each country. These data were obtained from a variety of sources such as:
www.oag.com (accessed on 12 August 2021).;
www.worldpop.org (accessed on 12 August 2021).; etc. This risk index calculates the travel flow from the airport of origin as the total number of confirmed COVID-19 cases by city where the airports are located, divided by the population of the city. The relationship between population and air travel is more evident with data from the World Tourism Organization (UNWTO), where, according to 2019 data (before the pandemic) the countries with the highest number of inhabitants have increased their international flights by 1.8% worldwide.
In
Figure 3, the fuzzy system that determines the risk of spread of each airport of the routes generated in
Section 4.1 is detailed.
4.2.1. Description of the Variables of the Fuzzy System of Airport Risk
This subsection details the input and output variables of the fuzzy system to determine the risk of spreading infectious diseases.
Population Density Per Country
The population density per country is an input variable to the fuzzy system and is defined as
, which refers to the average number of inhabitants in relation to a unit of land area in inhabitants per square kilometers. This information is directly related to the country where the airport is located and is very important when determining the risk of spreading an infectious disease if the disease reaches its territory. The variable
has the following fuzzy categories, which are defined as presented in Equation (7):
Basic Reproduction Number
is an epidemiological variable that describes the basic reproduction number of an infection. This biological value is an input variable to the fuzzy system that describes the average number of new cases generated by a given case throughout an determine period [
38]. When
, the value is defined as the infection dying after a long period of time. However, if
, the infection can spread widely among a population.
Table 5 shows the
of multiple diseases, including COVID-19 [
39].
The variable
has the following fuzzy categories, which are defined as presented by Equation (8):
In the current research, the value of will be taken because COVID-19 has a spread of four to five people (based on the Wuhan basic variant of the virus).
Passenger Traffic Rate Per Airport
The passenger traffic rate per airport is an input variable to the fuzzy system and is defined as
, where
, and where
is the number of passengers at an airport during a span of one year. The variable
is the number of routes of the airport. Finally, the variable
is the maximum value of passengers at the airport in one day. This information is described in
Section 3.1.2. The variable
has the following fuzzy categories, which are defined as presented by Equation (9):
Number of Infections Per Country
The number of positive infections in a country because of the virus is an input variable to the fuzzy system and is defined as
, where
is the number of positive cases because of the disease and where
is the country’s population based on the database in
https://worldpopulationreview.com/ (accessed on 12 August 2021). The variable
has the following fuzzy categories, which are defined as presented by Equation (10):
Risk of Spread Per Airport
The risk of spreading an infectious disease at an airport is an output variable to the diffuse system and is defined as
, where it can be determined whether the airport is at risk of receiving or transporting a passenger infected by a high-risk transmission disease. The risk is based on the input variables
, and
. The variable
has the following fuzzy categories, which are defined as presented by Equation (11):
4.2.2. Fuzzy System Rules
The fuzzy system requires a system of rules for decision making; here, by using the input variables
, and
and their respective thresholds to obtain a result for the output variable
. The fuzzy system rule set contains 56 rules, as shown in
Table 6. These rules have been defined through the expert knowledge of an airport health professional, who applies the health security policies that must be followed.
Figure 4 shows the highly nonlinear decision surface of this decision system for airport risk-level detection.
4.3. Third Stage: Detection of Spread Risks along Routes
At this stage of the algorithm, the risk of disease spread based on the number of airports that are identified as dangerous on all generated routes can be determined. In addition, the conditional probability of air traffic from the origin and destination airports of each air route is determined by applying a Markov chain.
4.3.1. Probability of Spread Risk Per Air Routes
The probability is calculated based on the fuzzy system responses of each of the airports that make up each of the routes from the origin and destination , determining the number of airports with “high_spread”. This probability is calculated by , where is the number of airports detected as “high_spread” and is the number of airports in the analyzed air route.
4.3.2. Probability of Air Routes
This value is the transit probability of air routes during a journey from an origin airport
, stopover airports
, and destination airport
. It is calculated by applying a Markov chain and applying the transition matrix Equation (6), where the number of routes
is determined from the origin airport
to destination airport
This information is obtained from the airport database described in
Section 3.1.1 (
Table 1). The number of stopovers
is determined in the first stage in the generation of possible routes. The result is obtained from the transition matrix
with the value
.
4.3.3. Risk-Level Detection Per Air Route
To identify the level of risk of the possible routes generated from the origin airport
and destination
, a rule has been defined to determine the spread risk level of the infectious disease. This rule has
and
to determine the risk level
faced by the destination airport
, which is the same as defined by Equation (12).
5. Results and Discussion
To perform an experiment using the APSDAR algorithm, air routes were generated from the city of Wuhan, China, to 10 international airports during the infectious period of the COVID-19 pandemic in the months of May and June 2020. The algorithm generates a limited number of routes from the origin airport to destination , the same one that automatically evaluates its results. In the current study, a maximum number of stopovers for each route has been taken as a constant, which makes it possible to define in a very approximate way the transfer of a passenger between countries.
The results are presented in
Table 7, where the first part of the algorithm shows the application of the fuzzy logic system, which evaluates each airport as “low spread” or “high spread” of each of the routes generated by Dijkstra’s algorithm. These results are grouped by airports with a high or low demand of passenger traffic. The results show that the fuzzy logic system has detected 56.54% (298 airports) as “low spread,” whereas 34.72% (183 airports) have low passenger traffic. This means that these airports have a lower possibility of spreading the virus because of their low number of passengers and air routes. The largest number of airports detected as “high spread” are in those airports with the highest air traffic because they have 25.23% (133 airports). Some important data presented in
Table 7 are the number of airports for each route because more than 20 airports can be included to reach a destination. This information demonstrates the complexity of the international air network and how difficult it can be to restrict the mobility of passengers from countries infected with any disease.
In the second part of
Table 7, the level of risk by air routes is presented, where the probability of risk is
with 43.35% (114 air routes) of dangerous routes. This shows that most international air routes have a large possibility of spreading COVID-19. The simulations show that travel routes are prone to stopovers at a dangerous airport and to transporting a person infected with the virus. On the other hand, 50.57% (133 air routes) have a probability of reaching their destination from Wuhan, even if several airports are restricted or closed because they can take alternative routes. Finally, the results of the algorithm show 30.80% (81 air routes) with a high risk of spreading COVID-19, which includes a large percentage of routes, airports, and people prone to infection and then spreading the virus.
Other results are the top 10 most visited airports during the simulations. This information shows that the airports of Incheon (ICN) in South Korea and Canton (CAN) in China are the airports with the highest traffic in Asia. These airports have 53 air routes, of which 20.75%s are identified as “High Risk” for the spread of COVID-19. In the same way, the airports of Frankfurt (Germany) and Paris-Charles de Gaulle have 34 air routes, of which 26.47% are at high risk of spreading the virus. These results are very similar to the results obtained in the article by Nakamura [
14], where high-risk airports are identified in the routes generated in the simulations, some examples are China, Spain and US.
The results show that the air transport network is one of the largest vectors for spreading diseases. This is detailed [
20], who showed there is a tendency for countries with high-traffic airports to be more actively connected with other countries with high-traffic airports. In addition, this study considered a list of countries that have the busiest airports in Europe, including France and Germany, which we show are among the top 10 air airports with a high risk of spreading COVID-19.
Fauver [
38], show that airline routes promote the spread of COVID-19 and that the international importation of infected people is more than 40% in airports with high passenger traffic. This is evidenced in the current simulation results, where 43.46% (229 airports) of the airports are identified as having a high level of spread of COVID-19.
According to the results presented by Nakamura [
14], there is a great and growing risk of infection in closed environment at air terminals, coinciding with the results identified by the APSDAR algorithm in
Table 8. Airports of
Table 8 are high risk due to the amount of people due to the influx of flights and long times of infection because of waiting in air connections. Considering all these, is very important to apply new models, systems and security policies that can prevent the spread of diseases with a large influx of people from different parts of the world. On the other hand, the simulations carried out by the APSDAR algorithm have managed to recreate in a large percentage the possible routes of spread of COVID-19 to cities in Europe (Madrid, Berlin, and Paris) and America (Mexico and New York), with some differences in connecting airports, some examples as shown below:
Wuhan (WUH)–Madrid (MAD): China (WUH)–China (CAN)–Thailand (BKK)–United Arab Emirates (DXB)–Italy (FCO)–Spain (MAD).
Wuhan (WUH)–Berlin (BER): China (WUH)–China–Turkey (IST)–(PEK)–Germany (FRA)–Germany (BER)
Wuhan (WUH)–France (CDG): China (WUH)–China (CAN)–Thailand (BKK)–United Arab Emirates (DXB)–France (CDG).
Wuhan (WUH)–Mexico City (MEX): China (WUH)–Incheon (ICN)–Thailand (BKK)–Italy (FCO)–Spain (MAD)–Mexico City (MEX).
Wuhan (WUH)–New York (JFK): China (WUH)–China (HKG)–US (JFK).
These results have shown an algorithm very close to being optimal in trying to simulate the possible routes that a virus can spread from its origin to a specific destination.
The main disadvantage of the proposed algorithm is the application of the Dijkstra algorithm to generate possible air routes by which the virus can spread between its origin, intermediate connections, and destination. Dijkstra’s application requires a large amount of memory space, processing resources, and calculation time to go through a graph of an airport network with such a large structure. In addition, the routes generated have a percentage of routes different from those established by the airlines.
6. Conclusions
The current research has proposed an algorithm to prevent the spread of infectious diseases on air routes and airports, where the information on airports, routes, population density, and spread characteristics of COVID-19 has been used. Graph theory has been applied to model the complex international air transport network and Dijkstra’s algorithm used for the generation of routes between terminals. In addition, a fuzzy logic system has been applied to evaluate each airport in the generated route (with biological, social, and demographic variables), where the level of risk of disease spread has been efficiently identified. This has been beneficial in determining the risk on an air route. Subsequently, a Markov chain has been efficiently applied to determine the conditional probability of the arrival of an infected passenger with the COVID-19 virus to other parts of the planet.
The results show very relevant information for monitoring and preventing the spread of diseases, such as COVID-19, as well as considerations for implementing security actions and policies at airports. The current study has corroborated the great complexity of the passenger air transport network to travel from one point to another, as there is a variety of possibilities layovers in dozens of airports. This complexity prevents adequate action to prevent the spread of diseases. An example is the restriction of the mobility of infected passengers because these individuals can travel to airports with less strict controls and reach airports with a large influx of air routes and passengers, causing a pandemic such as COVID-19. An important result of the investigation is the 25.23% of airports that are identified as “high spread.” This shows the importance of large airports in spread, which means they should adopt more health and mobility controls. Another worrying result is having 30.80% of air routes having a high risk of spread, which, in approximate calculations, can leave about 850,000 passengers infected with the virus in a month. These results have considered the number of passengers through airports, the routes flown, and the rate of the spread of the virus, . Finally, an interesting piece of information is that there are airports that concentrate their air routes within a continent, which would be important to consider when improving health policies in those airports. This shows a need to be exhaustive with the health regulations at destination airports, especially with passengers are coming from those airports.
One of the main limitations of our proposal is the generation of real routes for the spread of COVID-19, since updated information on infections from all countries in the world is required to apply the proposed algorithm. In the same way, information is required from each of the airports, such as the influx of passengers, enabled and not enabled routes so that the algorithm can be more realistic when generating possible infection routes. On the other hand, a large amount of information is required to be handled in parallel for the data processing and efficiency of the algorithm.
As future research, it is necessary to apply parallel processing algorithms and genetic neural networks for analyzing data from the ministries of health, airports, and social networks in each country [
40]. With these algorithms, the mobility of passengers can be better determined, and a passengers’ status and future location could be predicted with higher precision.
Author Contributions
Conceptualization, C.G. and D.B.; methodology, C.G.; software, C.G.; validation, C.G.; formal analysis, C.G.; investigation, C.G.; resources, C.G.; data curation, C.G.; writing—original draft preparation, C.G.; writing—review and editing, C.G.; visualization, C.G.; supervision, C.G.; project administration, C.G.; funding acquisition, C.G. All authors have read and agreed to the published version of the manuscript.
Funding
This work was supported by Universidad Tecnológica Indoamérica [project number: 151.097.2017; 2017–2021; Project: Artificial Intelligence and Interactive System- IASI].
Institutional Review Board Statement
Not applicable.
Informed Consent Statement
Not applicable.
Data Availability Statement
Not applicable.
Acknowledgments
With the consented and support from the AXA-ICMAT Chair in Adversarial Risk Analysis.
Conflicts of Interest
The authors declare no conflict of interest.
References
- Guevara, C.; Santos, M. Intelligent models for movement detection and physical evolution of patients with hip surgery. Log. J. IGPL 2020, 29, 874–888. [Google Scholar] [CrossRef]
- Johns Hopkins University. COVID-19 Map—Johns Hopkins Coronavirus Resource Center. 2021. Available online: https://coronavirus.jhu.edu/map.html (accessed on 12 August 2021).
- International Civil Aviation Organization (ICAO). The World of Air Transport in 2019. 2019. Available online: https://www.icao.int/annual-report-2019/Pages/the-world-of-air-transport-in-2019.aspx (accessed on 3 August 2021).
- Yang, B.; Liu, L.; Lan, M.; Wang, Z.; Zhou, H.; Yu, H. A spatio-temporal method for crime prediction using historical crime data and transitional zones identified from nightlight imagery. Int. J. Geogr. Inf. Sci. 2020, 34, 1740–1764. [Google Scholar] [CrossRef]
- Hollingsworth, T.D.; Ferguson, N.M.; Anderson, R.M. Will travel restrictions control the international spread of pandemic influenza? Nat. Med. 2006, 12, 497–499. [Google Scholar] [CrossRef] [PubMed]
- Wilder-Smith, A. The severe acute respiratory syndrome: Impact on travel and tourism. Travel Med. Infect. Dis. 2006, 4, 53–60. [Google Scholar] [CrossRef]
- Aras, S.; Aiyar, A.; Amedee, A.M.; Gallaher, W.R. Molecular character of influenza A/H1N1 2009: Implications for spread and control. Indian J. Microbiol. 2009, 49, 339–347. [Google Scholar] [CrossRef] [Green Version]
- Girard, M.P.; Tam, J.S.; Assossou, O.M.; Kieny, M.P. The 2009 A (H1N1) influenza virus pandemic: A review. Vaccine 2010, 28, 4895–4902. [Google Scholar] [CrossRef] [PubMed]
- Hsu, C.I.; Shih, H.H. Transmission and control of an emerging influenza pandemic in a small-world airline network. Accid. Anal. Prev. 2010, 42, 93–100. [Google Scholar] [CrossRef] [PubMed]
- Bellomo, N.; Bingham, R.; Chaplain, M.A.; Dosi, G.; Forni, G.; Knopoff, D.A.; Lowengrub, J.; Twarock, R.; Virgillito, M.E. A multiscale model of virus pandemic: Heterogeneous interactive entities in a globally connected world. Math. Models Methods Appl. Sci. 2020, 30, 1591–1651. [Google Scholar] [CrossRef]
- Kim, D.; Quaini, A. Coupling kinetic theory approaches for pedestrian dynamics and disease contagion in a confined environment. Math. Models Methods Appl. Sci. 2020, 30, 1893–1915. [Google Scholar] [CrossRef]
- Gardner, L.M.; Chughtai, A.A.; MacIntyre, C.R. Risk of global spread of Middle East respiratory syndrome coronavirus (MERS-CoV) via the air transport network. J. Travel Med. 2016, 23. [Google Scholar] [CrossRef] [PubMed] [Green Version]
- Park, J.-E.; Jung, S.; Kim, A. MERS transmission and risk factors: A systematic review. BMC Public Health 2018, 18, 1–15. [Google Scholar] [CrossRef] [Green Version]
- Nakamura, H.; Managi, S. Airport risk of importation and exportation of the COVID-19 pandemic. Transp. Policy 2020, 96, 40–47. [Google Scholar] [CrossRef] [PubMed]
- Zhang, L.; Yang, H.; Wang, K.; Zhan, Y.; Bian, L. Measuring imported case risk of COVID-19 from inbound international flights—A case study on China. J. Air Transp. Manag. 2020, 89, 101918. [Google Scholar] [CrossRef]
- Zhang, Y.; Zhang, A.; Wang, J. Exploring the roles of high-speed train, air and coach services in the spread of COVID-19 in China. Transp. Policy 2020, 94, 34–42. [Google Scholar] [CrossRef] [PubMed]
- Christidis, P.; Christodoulou, A. The Predictive Capacity of Air Travel Patterns during the Global Spread of the COVID-19 Pandemic: Risk, Uncertainty and Randomness. Int. J. Environ. Res. Public Health 2020, 17, 3356. [Google Scholar] [CrossRef] [PubMed]
- Katafuchi, Y.; Kurita, K.; Managi, S. COVID-19 with Stigma: Theory and Evidence from Mobility Data. Econ. Disasters Clim. Chang. 2020, 5, 71–95. [Google Scholar] [CrossRef]
- Nikolaou, P.; Dimitriou, L. Identification of critical airports for controlling global infectious disease outbreaks: Stress-tests focusing in Europe. J. Air Transp. Manag. 2020, 85, 101819. [Google Scholar] [CrossRef] [PubMed]
- Sun, X.; Wandelt, S.; Zhang, A. How did COVID-19 impact air transportation? A first peek through the lens of complex networks. J. Air Transp. Manag. 2020, 89, 101928. [Google Scholar] [CrossRef] [PubMed]
- Dabachine, Y.; Taheri, H.; Biniz, M.; Bouikhalene, B.; Balouki, A. Strategic design of precautionary measures for airport passengers in times of global health crisis COVID 19: Parametric modelling and processing algorithms. J. Air Transp. Manag. 2020, 89, 101917. [Google Scholar] [CrossRef] [PubMed]
- Hwang, G.M.; Mahoney, P.J.; James, J.H.; Lin, G.C.; Berro, A.D.; Keybl, M.A.; Goedecke, D.M.; Mathieu, J.J.; Wilson, T. A model-based tool to predict the propagation of infectious disease via airports. Travel Med. Infect. Dis. 2012, 10, 32–42. [Google Scholar] [CrossRef]
- Wang, X.; Liang, Z.; Zhu, K. Markov Decision Model of Emergency Medical Supply Scheduling in Public Health Emergencies of Infectious Diseases. Int. J. Comput. Intell. Syst. 2021, 14, 1155–1169. [Google Scholar] [CrossRef]
- Loh, H.S.; Yuen, K.F.; Wang, X.; Surucu-Balci, E.; Balci, G.; Zhou, Q. Airport selection criteria of low-cost carriers: A fuzzy analytical hierarchy process. J. Air Transp. Manag. 2020, 83, 101759. [Google Scholar] [CrossRef]
- Nl Company No. FlightConnections—All flights worldwide on a map! 2021. Available online: https://www.flightconnections.com/ (accessed on 12 August 2021).
- IATA. The International Air Transport Association (IATA). 2021. Available online: https://www.iata.org/ (accessed on 12 August 2021).
- Airports Council International—ACI. 2017 Passenger Summary—Annual Traffic Data—ACI World. 2018. Available online: https://aci.aero/data-centre/annual-traffic-data/passengers/2017-passenger-summary-annual-traffic-data/ (accessed on 12 August 2021).
- Gao, W.; Wu, H.; Siddiqui, M.K.; Baig, A.Q. Study of biological networks using graph theory. Saudi J. Biol. Sci. 2018, 25, 1212–1219. [Google Scholar] [CrossRef] [PubMed]
- Dehmer, M.; Emmert-Streib, F.; Shi, Y. Quantitative Graph Theory: A new branch of graph theory and network science. Inf. Sci. 2017, 418–419, 575–580. [Google Scholar] [CrossRef] [Green Version]
- Liu, S.; Jiang, H.; Chen, S.; Ye, J.; He, R.; Sun, Z. Integrating Dijkstra’s algorithm into deep inverse reinforcement learning for food delivery route planning. Transp. Res. Part E Logist. Transp. Rev. 2020, 142, 102070. [Google Scholar] [CrossRef]
- Wang, H.; Mao, W.; Eriksson, L. A Three-Dimensional Dijkstra’s algorithm for multi-objective ship voyage optimization. Ocean Eng. 2019, 186, 106131. [Google Scholar] [CrossRef]
- Bozyiǧit, A.; Alankuş, G.; Nasiboǧlu, E. Public transport route planning: Modified dijkstra’s algorithm. In Proceedings of the 2nd International Conference on Computer Science and Engineering, UBMK 2017, Antalya, Turkey, 5–7 October 2017; pp. 502–505. [Google Scholar] [CrossRef]
- Behrens, T.; Schmidt, K.; Rossel, R.A.V.; Gries, P.; Scholten, T.; MacMillan, R.A. Spatial modelling with Euclidean distance fields and machine learning. Eur. J. Soil Sci. 2018, 69, 757–770. [Google Scholar] [CrossRef]
- Prabakaran, G.; Vaithiyanathan, D.; Ganesan, M. Fuzzy decision support system for improving the crop productivity and efficient use of fertilizers. Comput. Electron. Agric. 2018, 150, 88–97. [Google Scholar] [CrossRef]
- Wu, B.; Cheng, T.; Yip, T.L.; Wang, Y. Fuzzy logic based dynamic decision-making system for intelligent navigation strategy within inland traffic separation schemes. Ocean Eng. 2020, 197, 106909. [Google Scholar] [CrossRef]
- Grewal, J.K.; Krzywinski, M.; Altman, N. Markov models—Markov chains. Nat. Methods 2019, 16, 663–664. [Google Scholar] [CrossRef] [PubMed]
- Chatterjee, S.; Diaconis, P. Speeding up Markov chains with deterministic jumps. Probab. Theory Relat. Fields 2020, 178, 1193–1214. [Google Scholar] [CrossRef]
- Fauver, J.R.; Petrone, M.E.; Hodcroft, E.B.; Shioda, K.; Ehrlich, H.Y.; Watts, A.G.; Vogels, C.B.F.; Brito, A.F.; Alpert, T.; Muyombwe, A.; et al. Coast-to-Coast Spread of SARS-CoV-2 during the Early Epidemic in the United States. Cell 2020, 181, 990–996. [Google Scholar] [CrossRef] [PubMed]
- Guerra, F.M.; Bolotin, S.; Lim, G.; Heffernan, J.; Deeks, S.L.; Li, Y.; Crowcroft, N.S. The basic reproduction number (R0) of measles: A systematic review. Lancet Infect. Dis. 2017, 17, e420–e428. [Google Scholar] [CrossRef]
- Yuan, Y.-P.; Tan, G.W.-H.; Ooi, K.-B.; Lim, W.-L. Can COVID-19 pandemic influence experience response in mobile learning? Telemat. Inform. 2021, 64, 101676. [Google Scholar] [CrossRef]
| Publisher’s Note: MDPI stays neutral with regard to jurisdictional claims in published maps and institutional affiliations. |
© 2021 by the authors. Licensee MDPI, Basel, Switzerland. This article is an open access article distributed under the terms and conditions of the Creative Commons Attribution (CC BY) license (https://creativecommons.org/licenses/by/4.0/).


