1. Introduction
The Trail Making Test (TMT) is a popular neuropsychological test, commonly used in clinical settings as a diagnostic tool for the evaluation of some frontal functions. It provides qualitative information on high order mental activities, including speed of processing, mental flexibility, visual spatial orientation, working memory and executive functions. Originally, it was part of the Army Individual Test Battery (1944) and subsequently was incorporated into the Halstead–Reitan Battery [
1]. In general terms, the test consists of a visual search of objects in an image, where the objects are arranged in sequences of loci called regions of interest (ROIs). While classical TMT requires an individual to draw lines sequentially connecting an assigned sequence of letters and/or numbers (the ROIs) with a pencil or mouse, the same task can be performed by using the eye-tracking technology and asking the subject to fixate the sequence of ROIs in the prescribed order [
2]. Poor performance is known to be associated with many types of brain impairment, in particular frontal lobe lesions. For instance, eye-tracking studies have proved their efficacy in the diagnosis of many common neurological pathologies, such as Parkinson’s disease, brain trauma and neglect phenomena [
3,
4,
5,
6].
The Visual Sequential Search Test (VSST) adopts the same principle as the TMT but is based on a precise geometry of the ROIs, being designed for the study of top-down visual search. Visual search can be quantified in terms of the analysis of the scan-path, which is a sequence of saccades and fixations. Thus, the identification of precise scores of the VSST may provide a measure of the subject’s visual spatial ability and high order mental activity. Specifically, we know that visual input from the external world is actively sampled for promoting appropriate actions during everyday life; this mechanism is dynamic and involves a continuous re-sampling of spatial elements of a visual scene. The VSST is a repeated search task, in which patients are asked to connect by gaze a logical sequence of numbers and letters.
The main objective of the research is to identify a reliable method for the analysis of the VSST and to investigate common/different characteristics inside and outside three different subjects’ classes. The first group includes patients with extrapyramidal disease who have well known difficulties in visual spatial exploration and executive functions. Thus, we predict low VSS performance in this group of patients. The second group is composed of patients suffering from chronic pain syndrome. This syndrome is not classically associated with cognitive deficits, but rather with mood changes. However, a possible deficit of attention has been suggested in patients suffering from chronic pain. If the prediction is true, the VSS performance in this group should be normal or less altered than extrapyramidal patients. The third, is a control group. The identification of a robust method of analysis and the detection of a reliable indicator for the VSST performance would allow to give a measure of executive functions in a clinical setting for diagnostic and prognostic purposes and eventually in clinical trials. Moreover, scoring the performance of such a VSST may have implications in the rehabilitation of cognitive functions and in general may be used for upgrading mental activity by exercise.
In the vast majority of the literature on eye movements, saccade amplitude or duration, number of fixations, fixation durations, or other close derivatives have been used as the main measures (see for instance the recent contribution in [
7]). Although saccades and fixations are fundamentally sequential, very few methods are available for treating their sequential properties. Among those taking into account the fixation order, the most widely applied method is based on the edit distance, i.e., minimum number of “edit” operations transforming a sequence into another [
8]. More advanced versions assign different weights to each operation. Such methods have been successfully used by a number of researchers to study saccade sequences (e.g., [
9,
10,
11,
12,
13]). These methods define a number of spatial ROIs in the scene being scanned and the fixation sequence is coded as a series of letters representing the fixated locations. Although the string edit method has proven to be a useful tool and is relatively fast to compute, one of its main drawbacks is that it does not take the relationship between ROIs into consideration, so that the algorithm cannot differentiate between close and distant ROIs. A second drawback of this kind of method is that they do not take the fixation duration into account; all fixations, however short or long, are treated equally. Instead, it is clear that the fixation duration is an important indicator of processing during a fixation [
14]. In [
15], Cristino et al. describe a new method, for quantitatively scoring two eye movement sequences: they show how the methodology of global sequence alignment (Needleman–Wunsch algorithm [
16]) can be applied to eye movements and then present three experiments in which the method is used.
In this paper, we follow the approach to take the fixation order, the fixation duration and the spatial distance from the ROIs into account. First, we pre-process the data recording the fixation sequence as a series of symbols (possible repeated) representing the fixated locations. Since the observed sequences (scan-paths) have a length quite different from each other, a global alignment is not suitable to evidence their similarity (if any) [
17]. Therefore, we at first propose to compare the expected scan-path with the observed scan-path using dot-plots. This provides a visual and hence a qualitative comparison between them but does not permit to evaluate it quantitatively.
From a different point of view, the problem we want to tackle is also related to the so-called episode matching [
18]. An episode is a collection of events that occur within a short time interval. In our case, an event corresponds to a fixation, and an episode to a scan-path. Usually, in the episode matching problem, given a long sequence of events, it can be useful to know what episodes occur frequently in the sequence.
A simplified version of this problem can be restated as an approximate string matching problem [
19]: Given a text
T, find its substrings containing the string
P as a subsequence. Conditions on the number of occurrences and/or on the length of the substrings of
T can be considered. Here, we investigate the problem in which
T is the obtained scan-path, and
P is the task scan-path.
In particular, for every obtained scan-path, we determine the first occurrence of P in T, and we score it. A novel scoring scheme is presented that takes into account the spatial relationship between ROIs (differentiate between close and far regions—distance matrix) and the fixation duration (repetitions of the letter corresponding to the ROI in a way that is proportional to the fixation). It also includes the guess that fixations outside the ROIs may be part of the exploration strategy.
The proposed score is validated by comparing the performance of the three different groups: the group of patients with extrapyramidal disease, the second one of patients suffering from chronic pain syndrome and the control group. Our results, as expected, confirm the worst performance of extrapyramidal patients than the chronic pain and control groups, in general. In particular, the medians of the three classes are significantly different from each other, so suggesting that our method can be employed as a measure of the performance in the VSST.
Summarizing, the main contributions of this paper are:
A new way to preprocess the VSST data, so as to represent them as sequences to which classical alignment methods can be applied;
A novel scoring scheme to evaluate the observed scan-path with respect to the target scan–path;
A preliminary experimental analysis on an original VSST dataset which highlights different pathological behaviours validated by human experts.
The method we propose is illustrated in the flowchart of
Figure 1. The paper is organized as follows. In the next section, the task that we want to pursue is described, together with the data pre-processing and the proposed alignment approach, based on a new ad hoc definition of the similarity score.
Section 3 collects experimental results that are discussed in the following
Section 4. Finally, in
Section 5, some conclusions are drawn and also open questions and future perspectives are described.
2. Material and Methods
2.1. Task Design
There exists several different TMT settings that can be adopted. For instance, a patient could be supposed to link ordered series of numbers or letters (which we will generally call
symbols in the following paragraphs) drawing with paper and pencil [
20] or onto an electronic device [
21,
22]. In other settings, tested people are required to sit in front of a monitor and interact with screen-based content, through an eye-tracker device [
23,
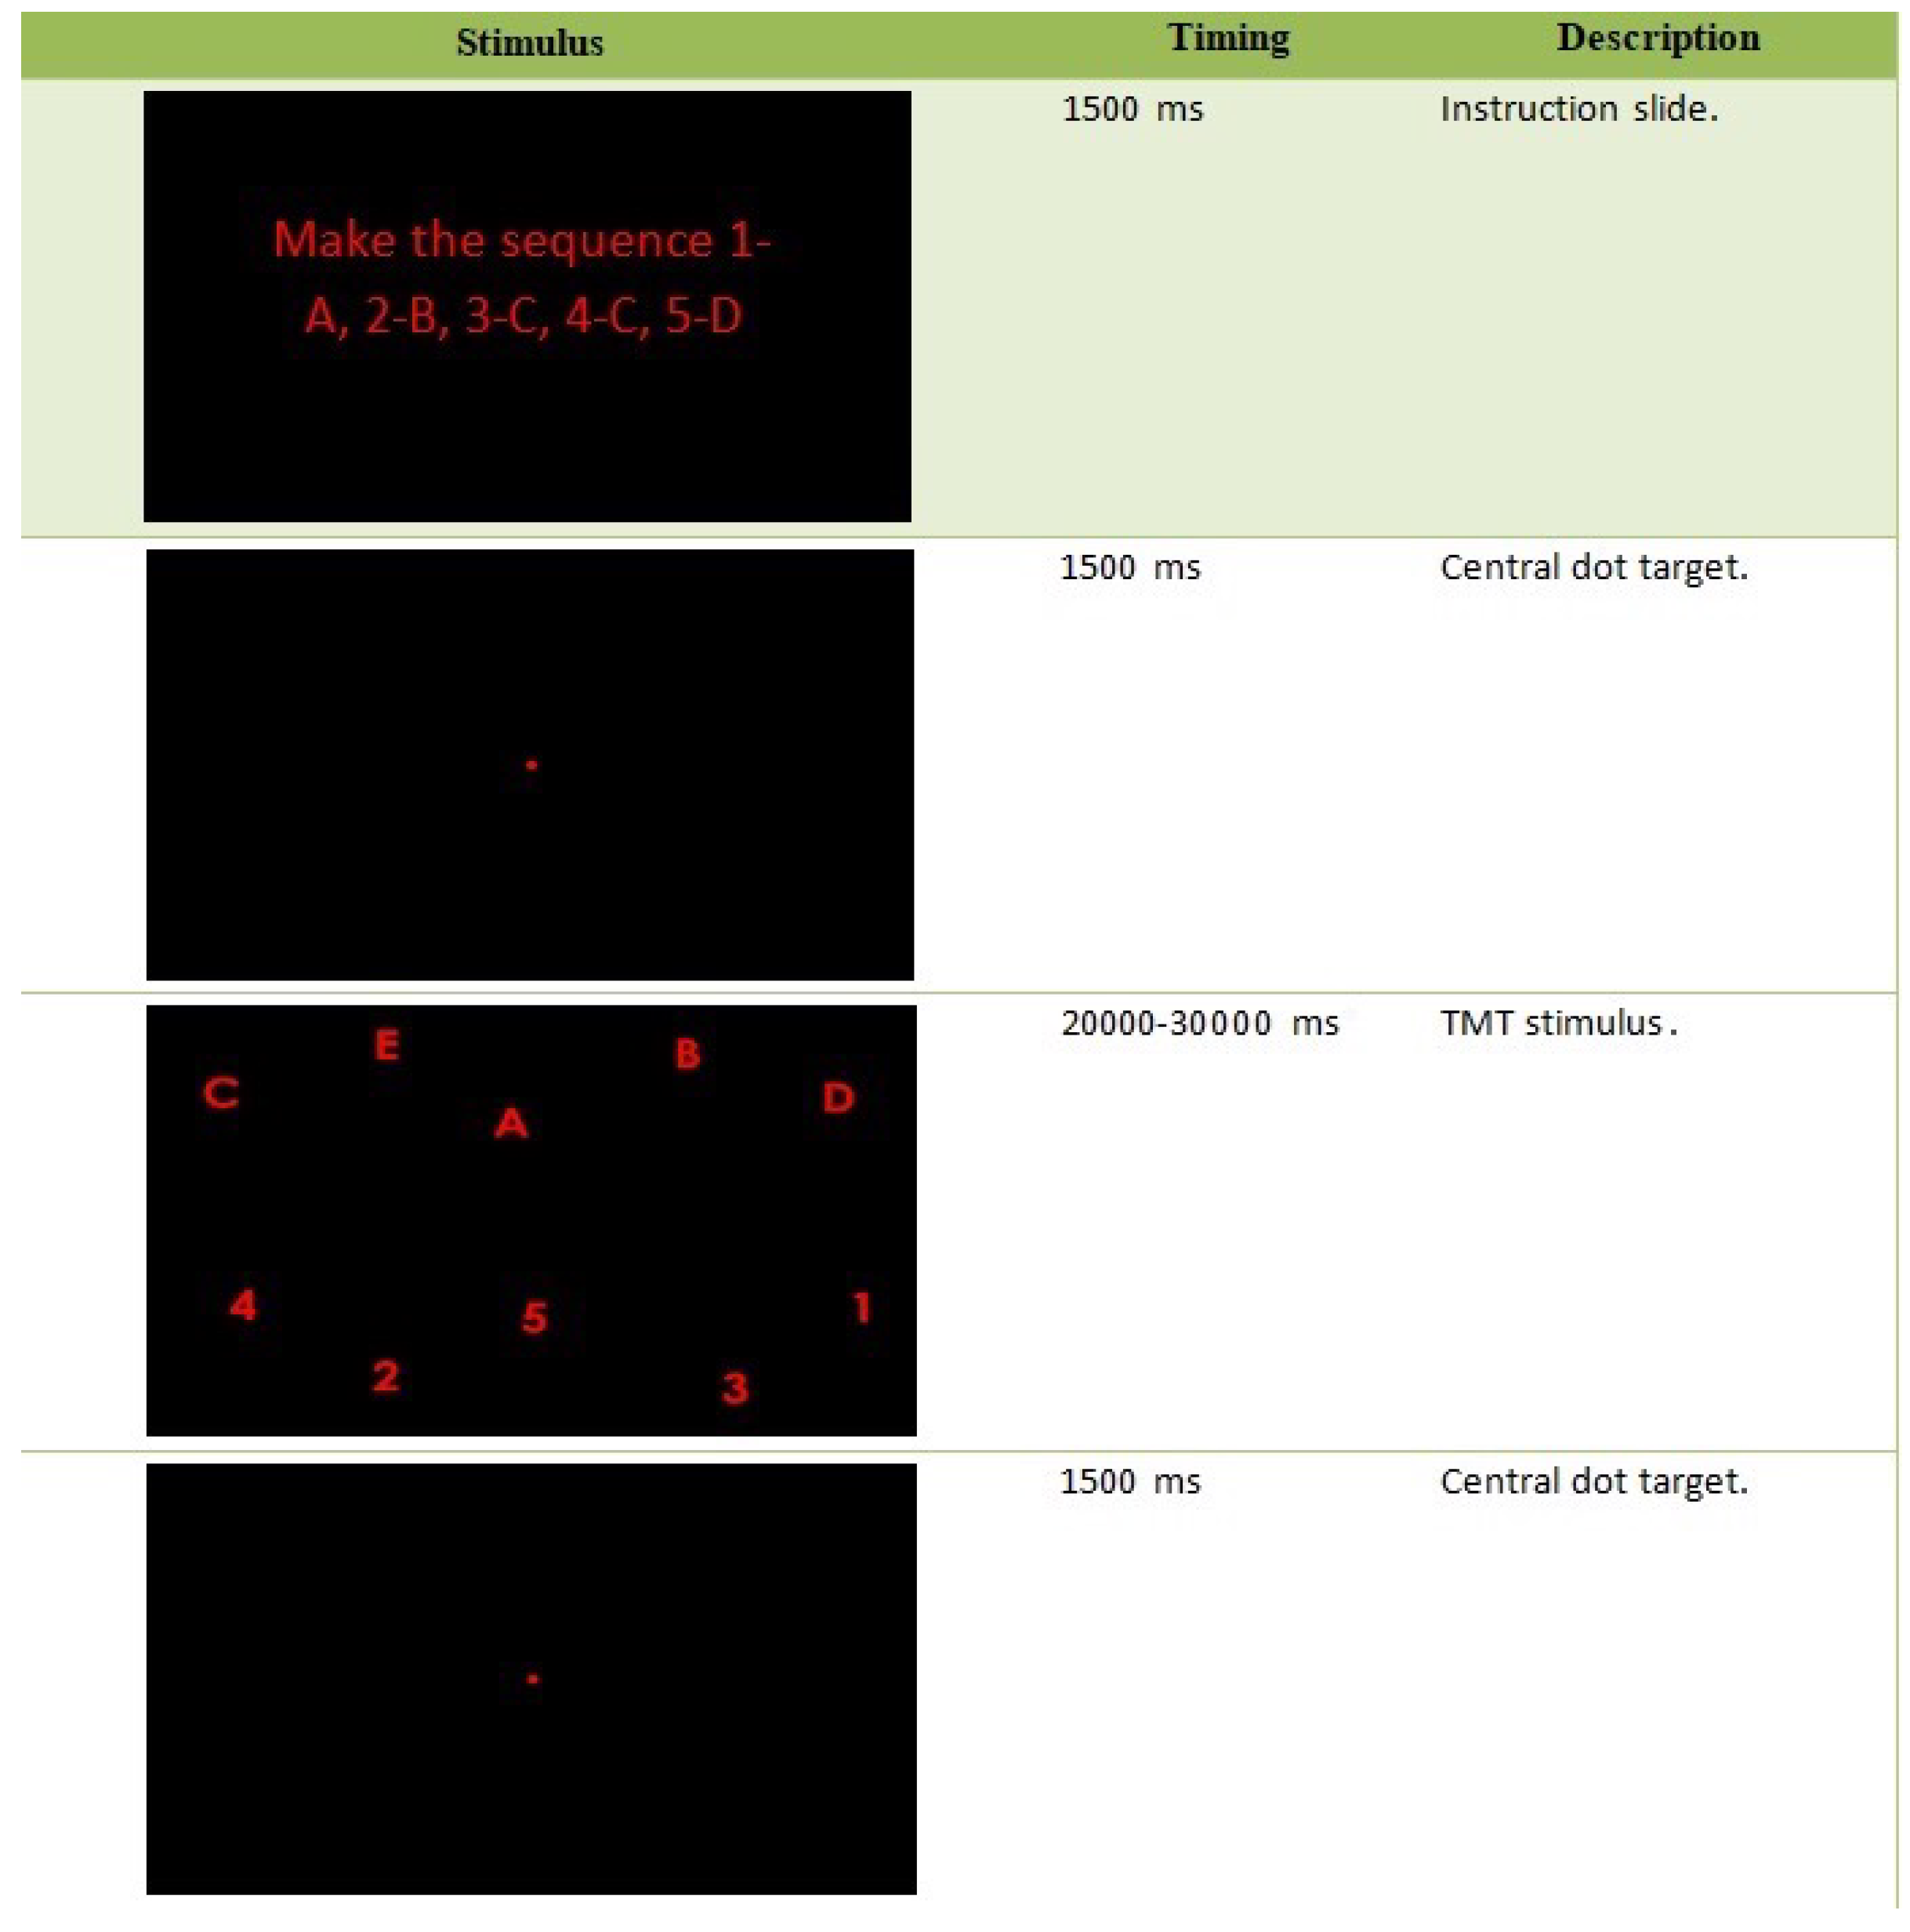
24]. Our study is carried out based on this last setting, which allows us to perform a Visual Sequential Search Test (VSST). In particular, the stimulus images submitted (in this order) to the patient are illustrated in
Figure 2, and the required task is to make the sequence 1-A-2-B-3-C-4-D-5-E at least once during the whole test time.
2.2. Data Preprocessing
2.2.1. Dataset
The data obtained by the eye-tracking experiments, for each person, provide the following information:
average gaze position (x) (pixels)
average gaze position (y) (pixels)
fixation ID (integer) (NaN = saccade)
pupil size (left eye)
pupil size (right eye)
timestamp (every 4 milliseconds)
stimulus (code of the image shown in the screen): the coding is described in the caption of
Figure 2.
Regular eye movements alternate between saccades and visual fixations. A fixation is the maintaining of the visual gaze on a single location. A saccade is a quick, simultaneous movement of both eyes between what happens among two or more phases of fixation in the same direction.
In case of blinking, the device loses the signal and it results in “NaN” (Not a Number) values either for the position on the screen and for the pupil sizes. Pupil sizes were not taken into account for the data processing described in the following.
The results of the eye-tracking experiments for 376 subjects were divided into three classes: 46 patients with extrapyramidal syndrome, 284 affected by chronic pain and 46 controls.
It is worth noting that the collected dataset is significantly unbalanced, a problem naturally attributable to the type of pathologies to be prognosed. In particular:
For extrapyramidal patients the diagnosis is based on objectivable clinical factors (i.e., a movement disorder), while a disability scale exists on which the severity of the disease can be objectively established;
Chronic pain represents a very variable pathology whose prognosis deeply depends on the personal judgement of human experts and that cannot objectified except through a subjective evaluation scale.
Therefore, an alteration in the scan-path for an extrapyramidal patient is invariably pathological, while a similar alteration evidenced in a patient affected by chronic pain must be treated with caution.
2.2.2. Generated Scan-Path Sequences
Starting from the data previously shown, we dealt with the generation of the scan-path sequences as follows.
The goal here is to use the information of the data to reconstruct the scan-path of an individual during the test as a sequence of symbols, associating a letter or a number for fixations on the ROIs accordingly, and the special character “!” for fixations outside the ROIs (black area). In other words, we generated a string over the alphabet . After having determined the centroids of each symbol in the TMT stimulus image, we have calculated the minimum distance between any pair of centroids, and we set a threshold equal to its half. Then, for every fixation ID, we computed the distance from the fixation area to the closer centroid, and we selected it as the associated symbol if the distance was less than the threshold, or “!” otherwise.
For instance, a generated sequence can have the following form:
| !5311AA22!DB3533ACC4!AB!C25DD!!!… |
Finally, we stacked subsequent repetitions of symbols in a vector of “weights”, associated to the non redundant sequence. Formally speaking, in a string where i s.t. , we replace with associating the corresponding weight , with . This can be easily done by scanning the string and counting the number of consecutive occurrences of the same symbol, in linear time with respect to the length of the string.
For the above sequence, we obtain as the result of the preprocessing of the data:
with the corresponding vector of weights:
2.3. VSST Data Analysis Method
We are going to formulate the VSST problem in terms of a pairwise sequence alignment, where both the target scan-path and the obtained scan-path are strings.
Let
be any string of length
n over the alphabet
, and let
. Given
T and
P, we look for the matches of
P in
T, that is the occurrences of symbols of
P in
T. Regions of identity (matches) can be visualized by the so-called dot-plot. A dot-plot is a
binary matrix
M such that the entry
if and only if
, otherwise
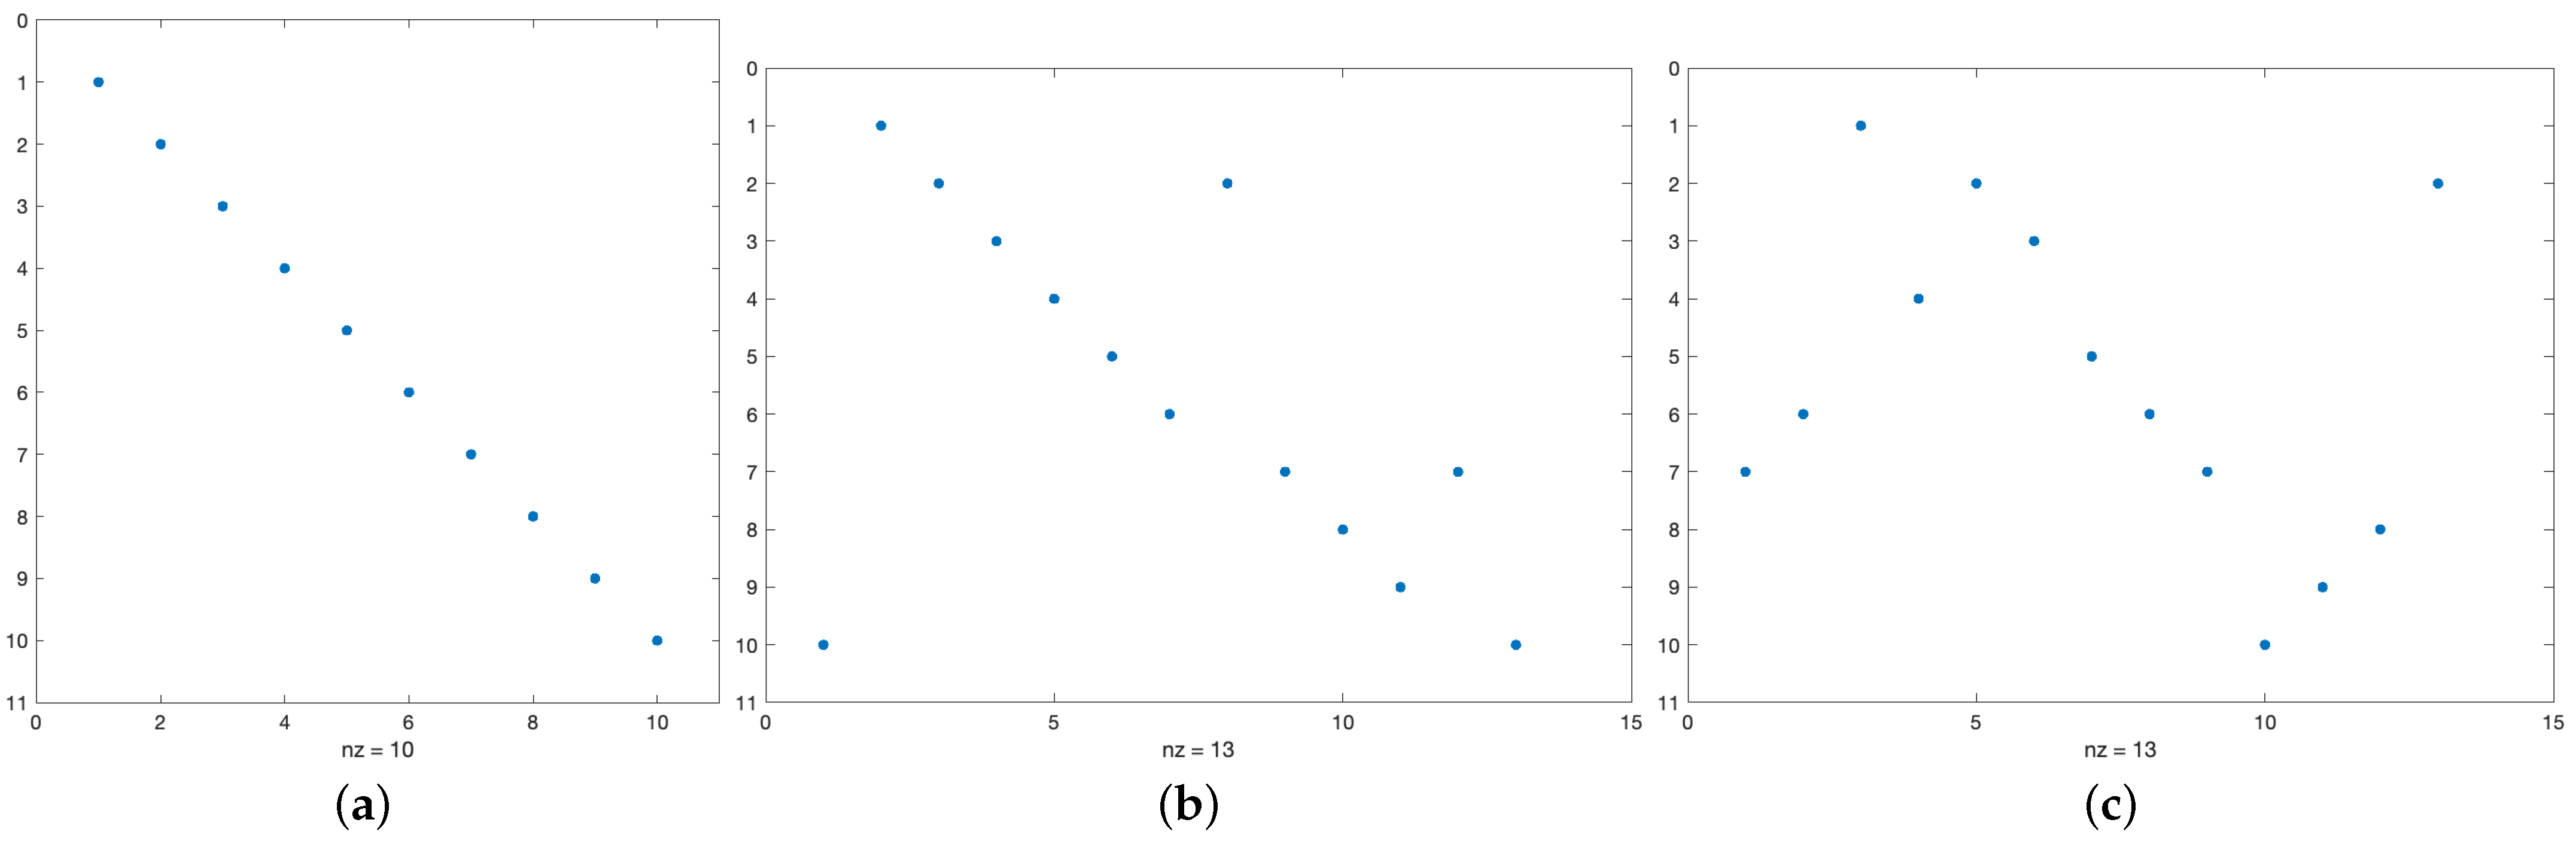
. Some toy examples are shown in
Figure 3 where the identity is visualized by a dot.
It is easy to see that “diagonals” of dots correspond to consecutive matches of P in T. This can be formalized as follows. A substring of T is a finite sequence of consecutive symbols of T, while in a subsequence symbols are not necessarily consecutive. Thus, P is a subsequence of T if there exist indices such that , , and is the substring of T containing P.
Let us define the VSST problem as an approximate string matching problem. The approximate string matching problem looks for those substrings of the text T that can be transformed into pattern P with at most h edit operations: a deletion of a symbol x of T changes the substring into ; an insertion of a symbol x changes the substring of T into ; a substitution of a symbol x of T with a symbol y changes the substring into . When deletion is the only edit operation allowed and we choose , the problem is equivalent to finding all substrings of T of length at most k that contain P of length m as a subsequence.
In the VSST problem we search for the first occurrence of P in T, i.e., we find the substring of T starting in the leftmost symbol in T containing P as a subsequence. This can be done in linear time in the size n of T with the naïve algorithm.
2.4. The Score Scheme
Let be the substring of T containing P. Next step consists of scoring the approximate matching between and P. Actually, provides a first evaluation of the distance between and P since they differ by h symbols. Note that this corresponds to defining a scoring system that assigns value 1 to each deletion and sums up each value. However, this measure is oversimple to provide a meaningful evaluation, and moreover we prefer to measure the complementary information, to calculate a “similarity score” between and P. Indeed our goal is to assign a final score assessing the performance of the patient in the VSS test. The first step in the definition of the scoring function is to assign a positive value (a reward) to each match, i.e., to each occurrence of a symbol of P in . On the contrary, each deletion of symbols of must be assigned a negative value (a penalty). We decided to weakly penalize a deletion of the symbol ! with respect to the deletion of any other symbol, since we consider a fixation of the background as an intermediate pause in the process, but not a true selection of an ROI. We refer to these three values as penalty scale constants.
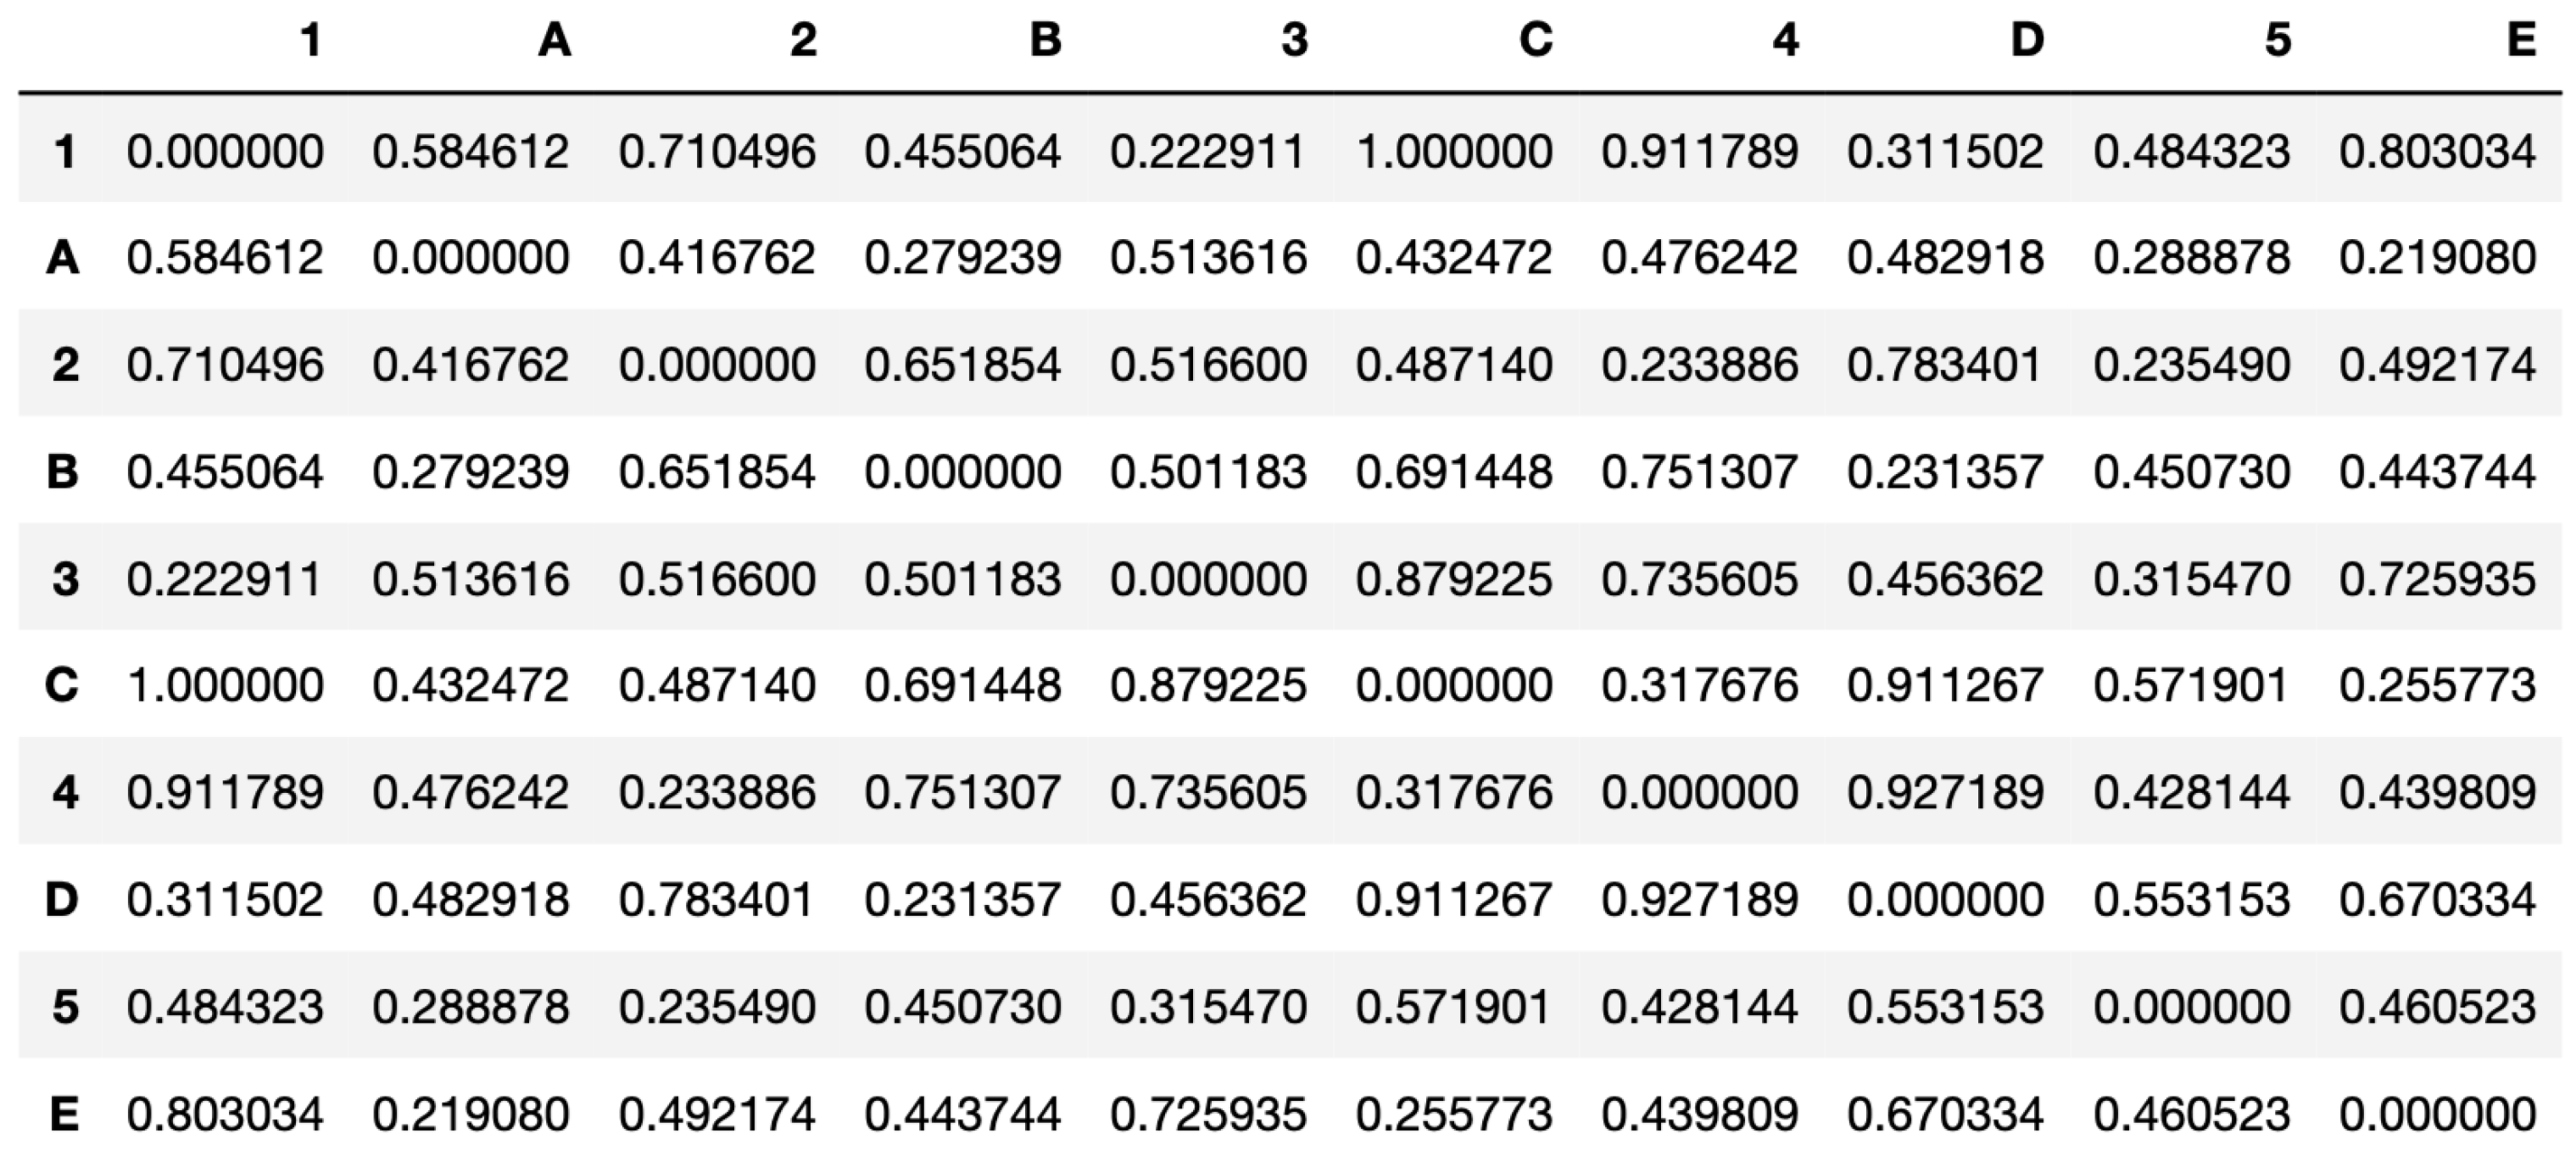
In addition, in the latter case (deletion of a symbol not ! in
), we compute the distance of the centroid of the ROI corresponding to the deleted symbol to the centroid of the ROI of the next expected symbol of
P, to take the spatial relation between the two ROIs. The set of the distances for each pair, normalized by the maximum distance, is then collected in a
distance matrix (
Figure 4).
Another factor included in the score is the duration of the fixation. We store the information in a parallel array as explained in
Section 2.2.2. We assume that the fixation duration is associated to hesitation in the VSST. Since duration corresponds to consecutive repetitions of any symbol, we define a function decreasing in the number of repetitions for scoring the match and increasing in the number of repetitions for scoring the deletion. We refer to it as the
duration function.
Finally, since the fixations outside the ROIs may be part of the exploration strategy, we compute the frequency of each symbol in the prefix ending there, to amplify the penalty: the frequency corresponds to the number of times that the symbol has been already fixed in the exploration so that it reflects the number of times needed to learn its position.
To summarize, the final score of
is the sum of the contributions to the score for each symbol in
where each score is obtained by the product of the following factors: the penalty scale constant
v, the duration function
f, and, in case of deletion of a symbol non !, an item of the distance matrix,
, and the frequency
of the symbol. The computation of the score is sketched in Algorithm 1.
| Algorithm 1 Similarity score evaluation |
| Require:
, w, , v, P, |
| Ensure:
|
| ▹ index for P |
| ▹ index for T’ |
|
|
| while
do |
| if then ▹ match |
| |
| |
| |
| else if then ▹ deletion |
| |
| else |
| |
| |
| end if |
| |
| |
| end while |
We remark that this algorithm uses three vectors: the substring , the vector w of the weights of size k and a vector of size , which stores the indices of the items of P such that iff , else . The algorithm scans based on the index i and P based on j. Initially . Then, it checks if i is equal to : if true, it scores the match ( is equal to ) and both indices are increased, otherwise it scores the deletion of and then increases i. In case of deletion, it checks if is equal to ! and, consequently, computes the appropriate score. Each access to the vectors takes and the algorithm scans the whole vector so that it runs in time.
3. Experimental Results
After the pre-processing phase described in
Section 2.2.2, the data consist of strings with their weights divided into three classes, depending on the individuals performing the test: 46 strings from patients with extrapyramidal syndrome, 284 from patients affected by chronic pain and 46 healthy participants. From now on, we refer to them as the Extrapyramidal (E), the Chronic (C) and the Healthy (H) classes.
For each member of the classes, we computed the score using the algorithm described in
Section 2.4. In particular we used
for the penalty constant vector, and the inverse of the weight of the symbol for the duration function
f.
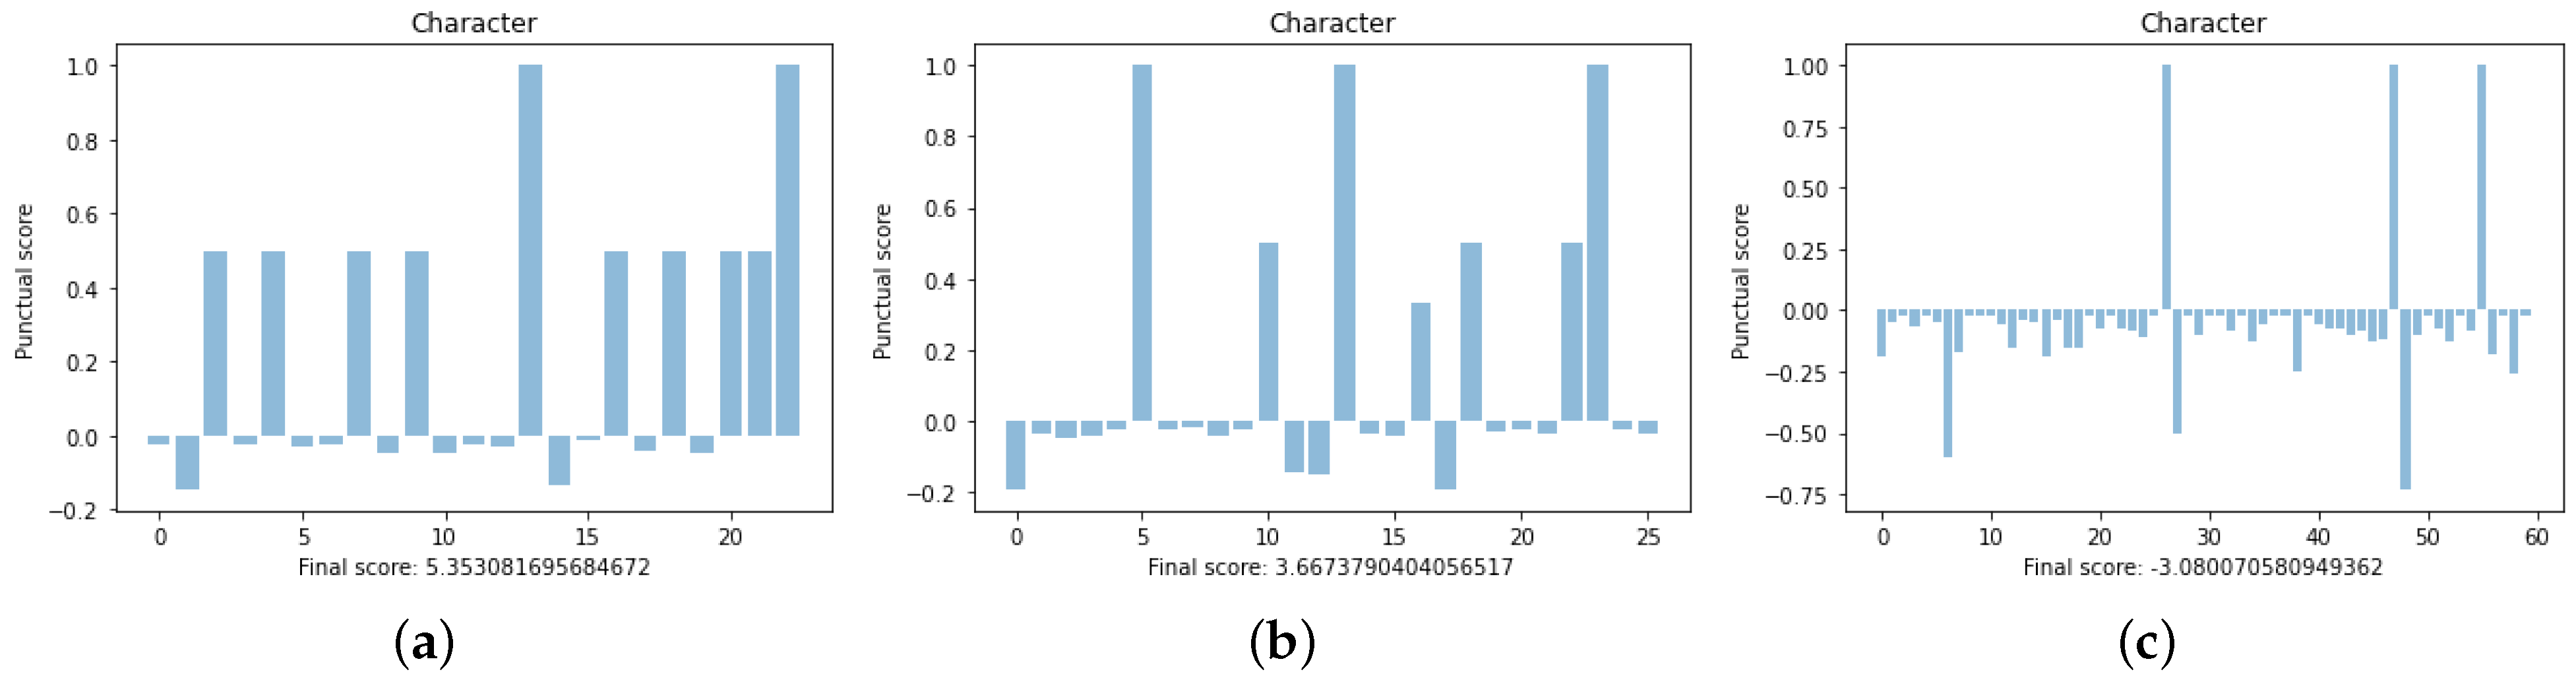
Figure 5 and
Figure 6 illustrate the dot-plots and the scores computed for a member of each class, respectively. We are going to show that these members are good “representatives” of their classes. At a glance, the dot-plots suggest that the first image corresponds to a performance better than the second, which in turn, looks better than the third.
In the images of
Figure 6, we illustrate the score as the bar graph obtained by visualizing each value assigned to each symbol of the sequences as a bar. Let us notice that bars of positive height correspond to the score of matches, whereas bars of negative height correspond to the score of deletions. Matches can be scored with values lower than 1, when repeated; deletions are scored differently depending on repetition, frequency, and distance from the next symbol objective.
Before the analysis, we dropped some outliers for each class, according to the Chebischev Theorem. Setting , we were sure to retain at least 75% for each class; such a dropping resulted in retaining 43 sequences out of 46 for the Healthy class, 265 out of 284 for the Chronic class and 44 out of 46 for the Extrapyramidal class.
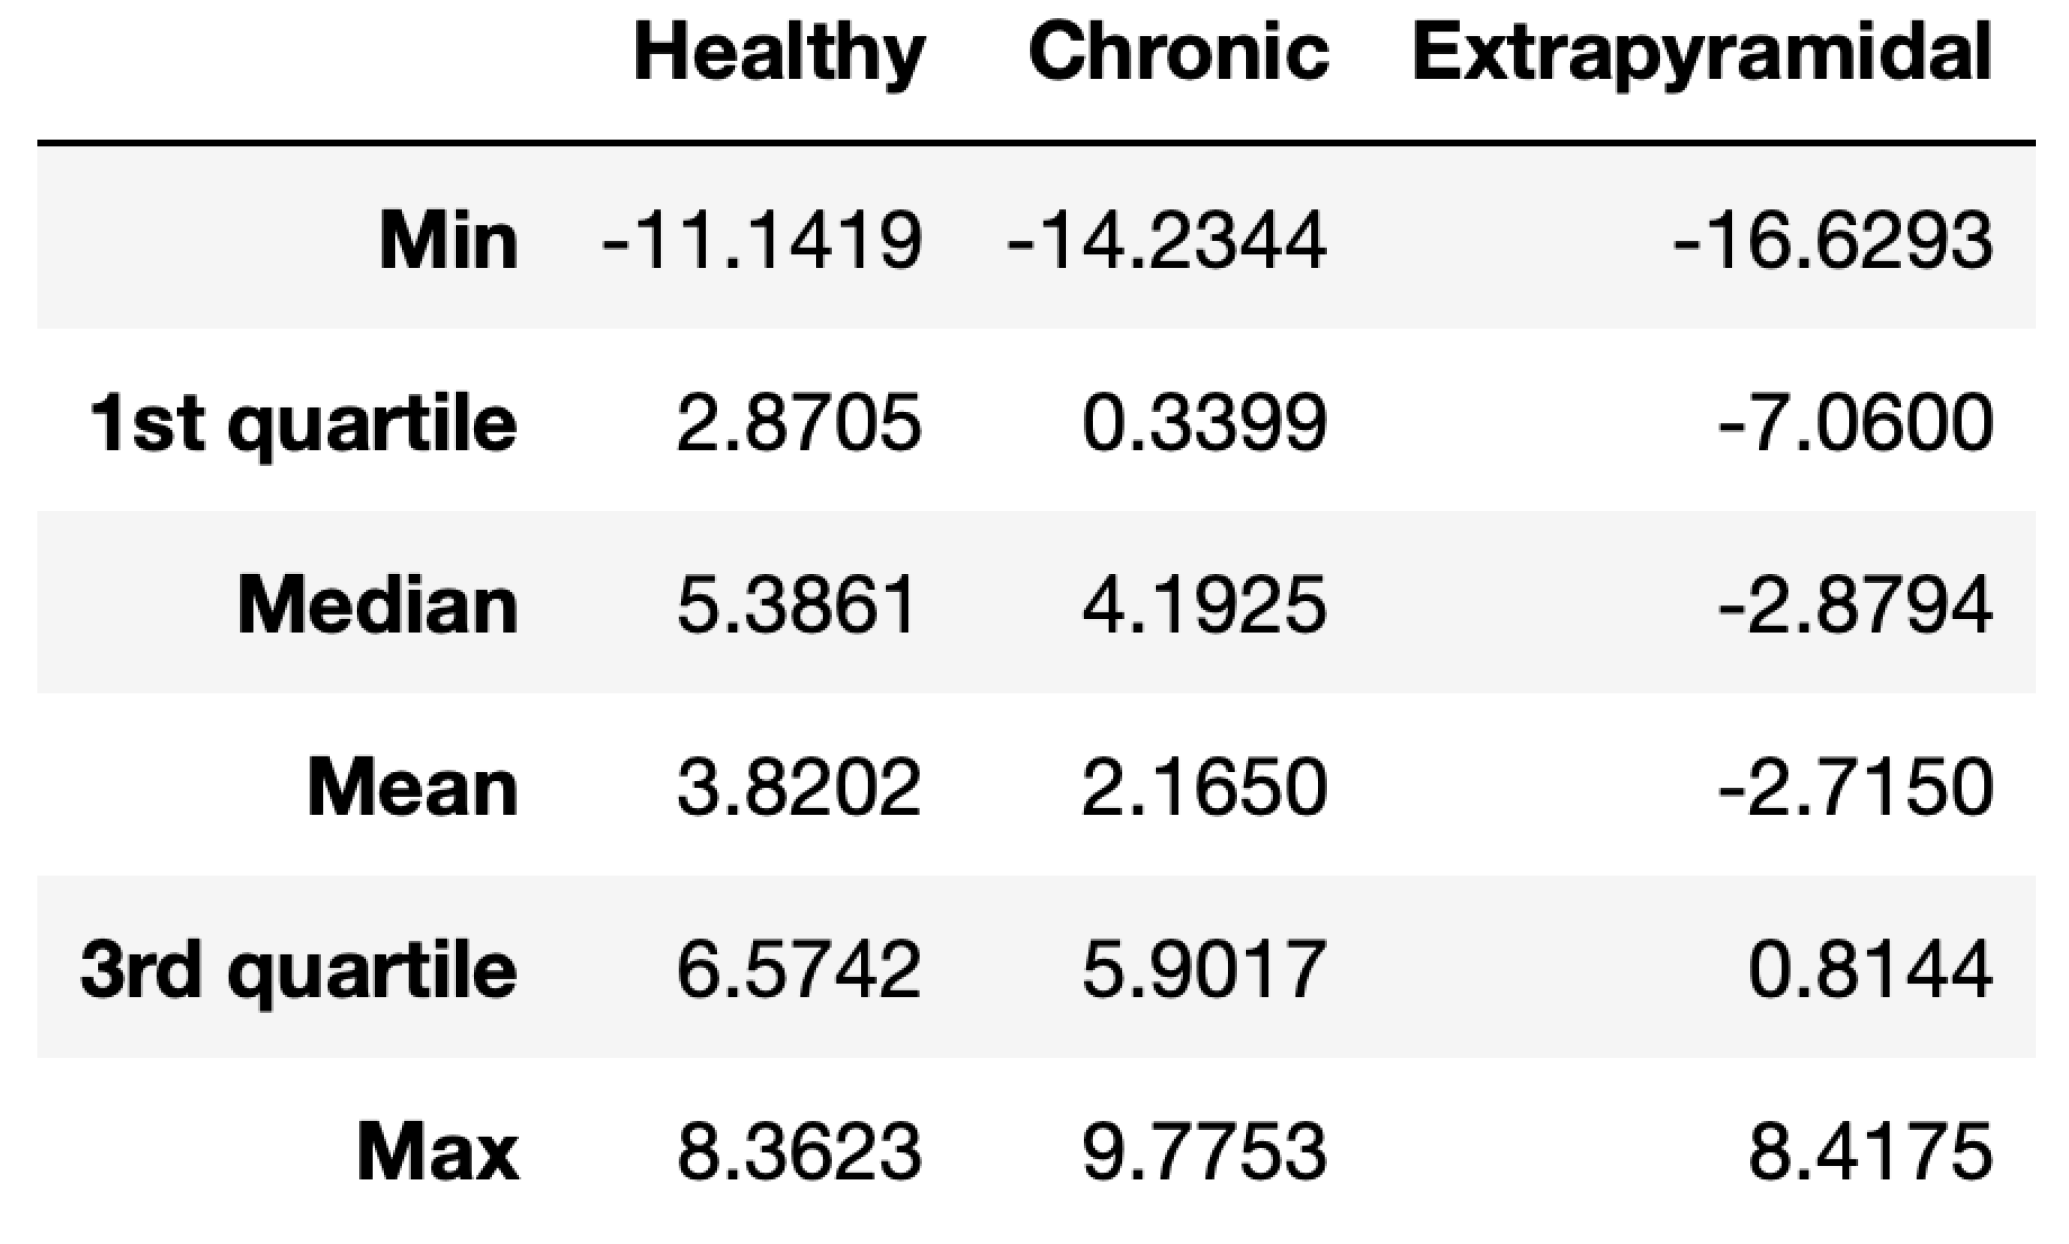
Therefore, we analysed the results using the R language for computing the basic statistics and graphics. A summary divided by the groups is shown in
Figure 7, while in
Figure 8 we report the box plots.
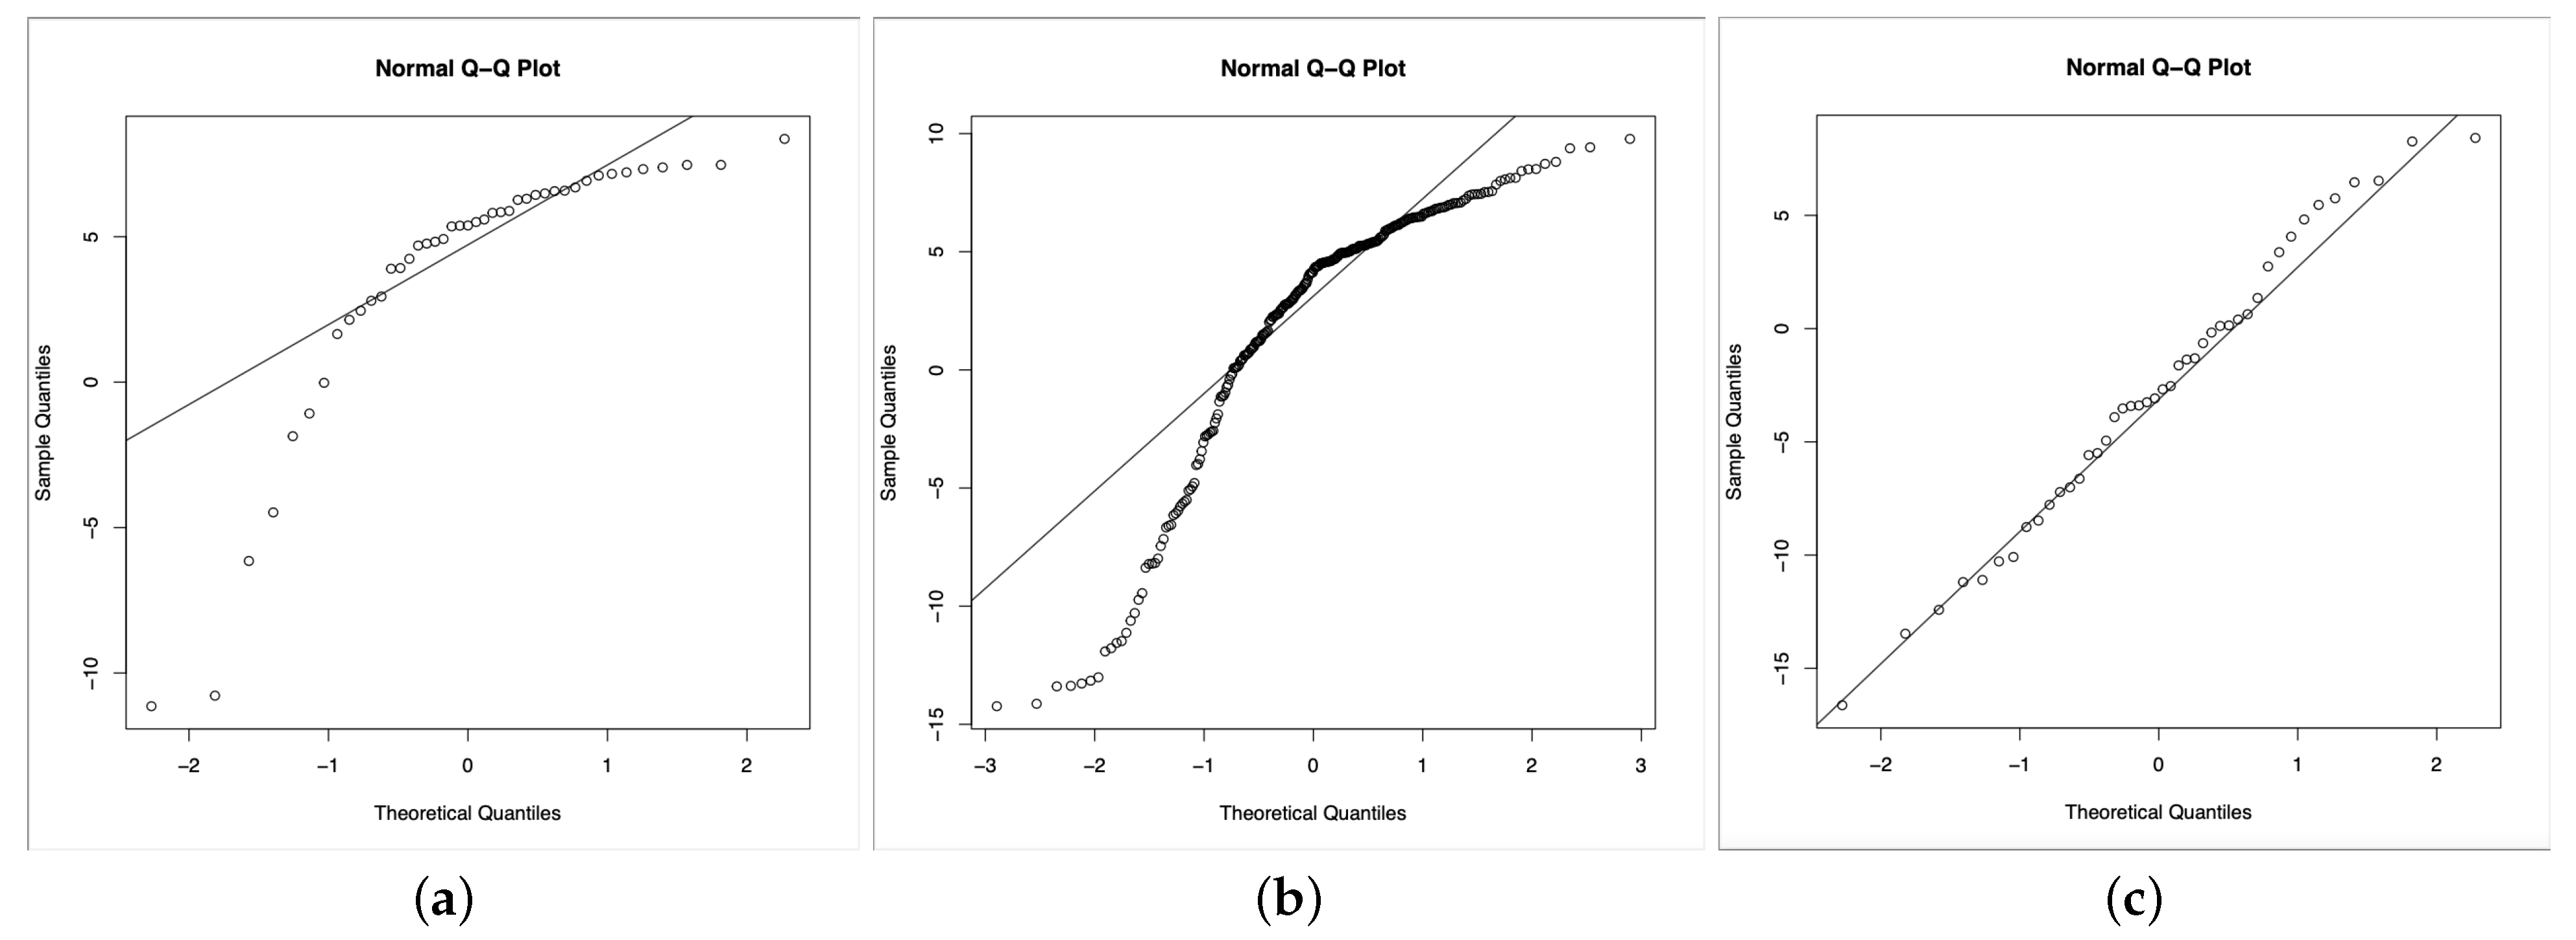
Based on the obtained results, we can notice that the data seems not to follow a normal distribution, as we can see from
Figure 9, at least for two of the three classes (the Healthy class and the Chronic one). Indeed we run the Kolgomorov–Smirnov test for comparison with the normal distribution on each class, obtaining
p-values, respectively, equal to
,
,
.
Thus, we used the non-parametric Kruskal–Wallis test by rank which extends the two-sample Wilcoxon test in the situation where there are more than two groups. It turns out that at 0.05 significance level, the medians of the data of the three groups are different. In particular, the
p-value for the Kruskal–Wallis test is
p-value =
. In order to know which pairs of groups are significantly different we used the function pairwise.wilcox.test() to calculate pairwise comparisons between group levels with corrections for multiple testing and Bonferroni correction. The results confirm that the pair exhibiting the most significant difference is the Healthy–Extrapyramidal as expected (see
Table 1). Indeed, patients with extrapyramidal disease have well known difficulties in visual spatial exploration and executive functions that result in difficulties from the subject to maintain a top-down (human intention) internal representation of the visual scene during task execution. This is reflected in a bad performance in the VSST. Differently, patients in the Chronic class are affected by several kinds of chronic pain syndromes so that they may have different behaviours in performing the task.
Nevertheless, note that, actually, all the pairs have p-values less than so that they are significantly different.
4. Discussion
In this study, we propose a method for the analysis of gaze in a top-down visual search task and find a score for the VSST performance. The whole pipeline for the process is illustrated in
Figure 1. The considered method and score have been validated by comparing the performance of three different subjects’ groups. The first group includes 46 patients with extrapyramidal disease, who have well known difficulties in visual spatial exploration and executive functions. The second group is composed of 238 patients suffering from chronic pain syndrome and the third, collecting 46 patients, is a control group.
The identification of a robust method of analysis and the detection of a reliable indicator for the VSST performance, would allow to give a measure of executive functions in a clinical setting for diagnostic and prognostic purposes and eventually in clinical trials. Moreover, scoring the performance of such a VSST may have implications in the rehabilitation of cognitive functions and in general may be used for upgrading mental activity by exercise.
Indeed, cognitive rehabilitation is an effective non–pharmacological treatment that consists of learning compensatory strategies and exploiting residual skills in order to counteract, for instance, cognitive impairments and degenerative diseases. In fact, as for dementia, unfortunately, there is no specific pharmacological treatment, being existing drugs able to counteract the symptoms of the disease, but do not change its course. Consequently, the disease progresses: there is a continuous and constant progressive decline of cognitive functions for the patient, which negatively affects the various daily skills. Instead, changing the course of the disease, “pushing forward” the degenerative progression allows the patient to maintain their autonomy for a longer time and reduces the disinterest, anxiety and depression that degenerative diseases entail. Finally, cognitive rehabilitation is also fundamental for maintaining cognitive functions in efficiency and to combat the consequences of normal aging. Similarly, it is possible to implement intellectual stimulation with a preventive purpose.
The main characteristic of VSST is that it forces the subject to perform a default and logic path using high level cognitive resources. In this task the target of the next fixation changes continuously and, thus, in order to perform an adequate eye movement, each fixation must contain the information on the current target position and the next target location [
25]. Previously, Veneri et al. [
26] suggested that the re-sampling of the spatial element in such a visual search task requires a ranking of each element of the sequence during fixations. To be effective, this process requires a maximization of the discrimination abilities of the peripheral vision. The comparison of the
expected scan-path with
the observed scan-path provides a valuable method to investigate how a task forces the subject to maintain a top-down (human intention) internal representation of the visual scene during task execution. The proposed method has proved to be really effective in distinguishing between healthy people and patients affected by extrapyramidal pathologies, and less sensitive to the differences among the other cohort combinations. Actually, patients with chronic pain syndrome may be affected by very different pathologies—from severe neoplasms to chronic migraines—not all equally disabling from a neurocognitive point of view, which makes this group of patients extremely heterogeneous and difficult to distinguish, for example, from healthy people. Anyway, the main advantage of the proposed VSS test, equipped with the automatic procedure to score its outcomes, lies in the possibility of standardizing the test—making the obtained results repeatable—as well as memorizing them permanently. In this way, for each patient, a historical series of their performance can reliably be collected and analysed, a suitable procedure for evaluating both the course of a disease or the recovery based on a cognitive rehabilitation process.
Some issues concerning the proposed method naturally arise:
we are aware of the approximation errors that could occur by converting gaze positions into symbols through the ROIs processing, as a threshold has been set to discriminate from region to region. Nevertheless, comparing the retrieved sequences to video analysis, our method seems to catch efficiently the sequence of symbols scanned during the test;
the proposed score algorithm takes into account some factors, such as the duration of the fixation, or the distance from the target symbol. Surely they are not the only factors linked to cognitive tasks involved in the test: improvements in building up the algorithm could be considered by taking into account other minor cognitive factors;
the weight function, applied on the stacked subsequent repetitions of single symbols, has been arbitrarily chosen as the inverse function. Future works could focus on designing a more appropriate weight function, which could take into account cognitive features associated with the repetitive behaviour.


 ,
, 


