1. Introduction
The term Big Data (BD) represents a huge amount of information [
1], which can be unstructured and structured. With regards to data processing, the great significance is the organization that employs this information [
2]. Nowadays, it can be extensively employed for outperforming peers and can be determined as variety, volume, and velocity. Variety refers to the data being structured or unstructured, volume refers to the amount of data produced, and velocity refers to the speed at which the data are being generated at. The significant advantages of BD are cost and time savings, large data processing, forecasting and analysis, and efficacy because of an innovative tool support [
3]. The adoption of data mining (DM) tools to solve BD problems might require the remodeling of the algorithm and its inclusion in parallel environments. Amongst the distinct alternatives is the MapReduce (MR) model [
4] and its distributed file systems, first presented by Google, which provides a robust and effective architecture for addressing the analysis of big datasets. Currently, this method is considered in DM models, instead of other parallelization systems such as Message Passing Interface (MPI), due to its simplicity and fault tolerance.
Several studies have concentrated on the parallelization of machine learning (ML) tools with the MR method [
5]. In recent times, more flexible and advanced tasks have emerged to expand the typical MR approaches, such as Apache Spark, effectively employed on several ML and DM challenges. Clustering and classification are the primary types of techniques in DM methods. Nevertheless, the performance of classification and clustering methods is greatly influenced by an increase in the dataset dimension, as algorithms in both categories operate on the dataset dimension. Moreover, the drawbacks of higher-dimension datasets include redundant information, degraded quality, and high model build time, which make the data analysis highly complex [
6].
For resolving these problems, the election of the feature is employed as a fundamental preprocessing step to select a subset of features from a huge dataset. This increases the accurate clustering and classification methods, which trigger foreign, ambiguous, and noisy data reduction. The method of feature selection (FS) depends on a search strategy and an efficient calculation of subsets. The initial phase employs tools for picking subsets of features in the search approach. Later, the values of the subset attained from the search approach are estimated by classification systems [
7]. The choice of feature should achieve two objectives: Eliminate/reduce the numbers of selected features and maximize the output precision performance. The elected feature is determined via several exploration approaches, such as depth, breadth, random, or a combination thereof. Nonetheless, an exhaustive search is not adequate for large datasets. When the feature size is d, the suitable subsets of a feature could hardly be selected from 2d alternatives.
Recently, an interesting proposal to apply the FS model to BD sets was proposed in [
8]. In this work, the author described a method capable of effectively handling ultrahigh dimension data sets and choosing smaller subsets of interesting features from them. However, the numbers of elected features are considered to be numerous orders of magnitude less than the overall features, and the algorithms are developed to be performed in a single machine. Thus, this method is not scalable to randomly huge datasets. A specific manner of addressing high-dimensional features is by employing an evolutionary algorithm [
9]. Generally, the group of features is encoded as a binary vector, in which every place defines whether the features are elected or not. This allows the implementation of FS models using the exploration abilities of evolutionary techniques. However, these techniques are lacking the scalability requirement for addressing big datasets (from millions of instances onward). Because of the properties of BD, the present FS method faces difficult problems in many stages, for example, tracing concept drifts, speed of data processing, and handling incomplete or noisy data. Therefore, exploring relevant FS methods for BD is of considerable urgency. Despite that the access method is highly accurate, how to extract useful data from BD based on analyzing and tackling them is still an open issue.
This study focuses on the design of metaheuristic optimization based on big data classification in a MapReduce (MOBDC-MR) environment. Moreover, the MOBDC-MR technique involves the design of a binary pigeon optimization algorithm (BPOA)-based FS technique for reducing the complexity and improving the accuracy. To classify Big Data, the beetle antenna search (BAS) with long short-term memory (LSTM) technique was applied. The presented MOBDC-MR technique was realized on Hadoop with the MR programming model. The experimental validation of the MOBDC-MR technique took place on the benchmark dataset, and the results were examined under several measures.
2. Existing Big Data Classification Approaches
This section performs a detailed review of existing FS-based Big Data classification models available in the literature. In Alweshah et al.’s study [
10], a new optimization method, the monarch butterfly optimization (MBO) model, was executed by a wrapper FS technique, which employs K-nearest neighbor (KNN) classifiers. Research has been conducted on eighteen standard datasets. El-Hasnony et al. [
11] presented a novel binary variant of the wrapper FS–grey wolf optimization (GWO) and particle swarm optimization (PSO). The KNN classifiers using Euclidean separation matric were employed for finding an optimum solution. A chaotic tent map helped in evading the approach from locked to optimal local problems. The sigmoid function was used to convert the search space from continual vectors to a binary one to be appropriate for the problems of the FS model, and cross-validation K-fold was employed for overcoming the over-fitting problem. BenSaid and Alimi [
12] presented an online FS model that resolves these problems. The presented optimal feature selection (OFS) method, named MOANOFS, examines the current developments of online ML methods and a conflict resolution method (automatic negotiation) to improve the classification performance of the ultrahigh-dimension database.
In Al-Sarem et al.’s study [
13], the ensemble method, CatBoost, RF, and XGBoost were employed for finding the primary feature for Parkinson’s Disease (PD) prediction. The effects of this feature using distinct thresholds were examined for obtaining optimal performance for the PD prediction. The result showed that CatBoost methods attained an optimal result. Wang et al. [
14] proposed a Big Data analytics (BDA) manner for the FS model for obtaining each explanatory factor of computation time (CT) to shed light on the fluctuation of CT. First, relative analysis was executed among two candidate factors using mutual data metrics for constructing an observed network. Next, the network deconvolutions were examined for inferring the direct dependencies among the candidate factors and the CT by eliminating the effect of transitive connections from the network.
Shehab et al. [
15] presented a new hybrid FS cloud-based model for imbalanced data based on the KNN method. The presented method integrates the Euclidean and firefly distance metrics employed in the KNN. The experimental results showed a better insight into feature weights and time usage in comparison to the weighted nearest neighbor. Li et al. [
16] integrated multimodal FS and grouped feature extraction and proposed a new faster hybrid reduction dimension technique, integrating their benefits of removing redundant and irrelevant data. First, the intrinsic dimension of the dataset was evaluated using the maximal probability model. The information Gain and Fisher score-based FS was employed as a multimodal method for removing inappropriate features. With the redundancy amongst the elected features as clustering conditions, they were grouped into a specific number of clusters.
Spencer et al. [
17] assessed the efficiency of the model acquired with the ML technique through a related FS model. The four generally employed heart disease datasets were estimated by a Chi-squared test, PCA model, symmetrical uncertainty, and ReliefF to make distinct feature sets. Next, several classification methods were employed for creating methods that were later related to search an optimum features combination, to enhance the accurate predictions of the heart condition. Abdel-Basset et al. [
18] introduced hybrid versions of the hybrid Harris Hawks optimization algorithm-based simulated annealing (HHOBSA) method to resolve the FS problems for classification purposes with the wrapper method. The two bitwise operations (OR and bitwise operations) could arbitrarily transmit the most informative feature from an optimal solution to others in the population to increase their quality. Simulated annealing (SA) boosts the performance of the HHOBSA model and helped to flee from the local optimal. A typical wrapper model KNN using Euclidean distance metric works as an evaluator for the novel solution.
In Mohammed et al.’s study [
19], a set of hybrid and effective genetic algorithm (GA) models were presented for solving FS problems, while the processed data had a huge feature size. The presented algorithm employs a novel gene-weighted method, which can adoptively categorize the feature into weak or redundant features, unstable features, and strong relative features in the evolution method. According to this classification, the presented method provides a weak featureless priority and a strong feature high priority, while producing a novel candidate solution. Alarifi et al. [
20] presented new BD and ML techniques to evaluate the SA process for overcoming these problems. The data are gathered from a large number of datasets, useful in efficient analyses of systems. The noise in the information is removed by pre-processing DM concepts. From the cleaned sentimental data, an efficient feature is elected by a greedy method, which selects an optimum feature handled by an optimum classifier named CSO-LSTMNN.
3. The Proposed Model
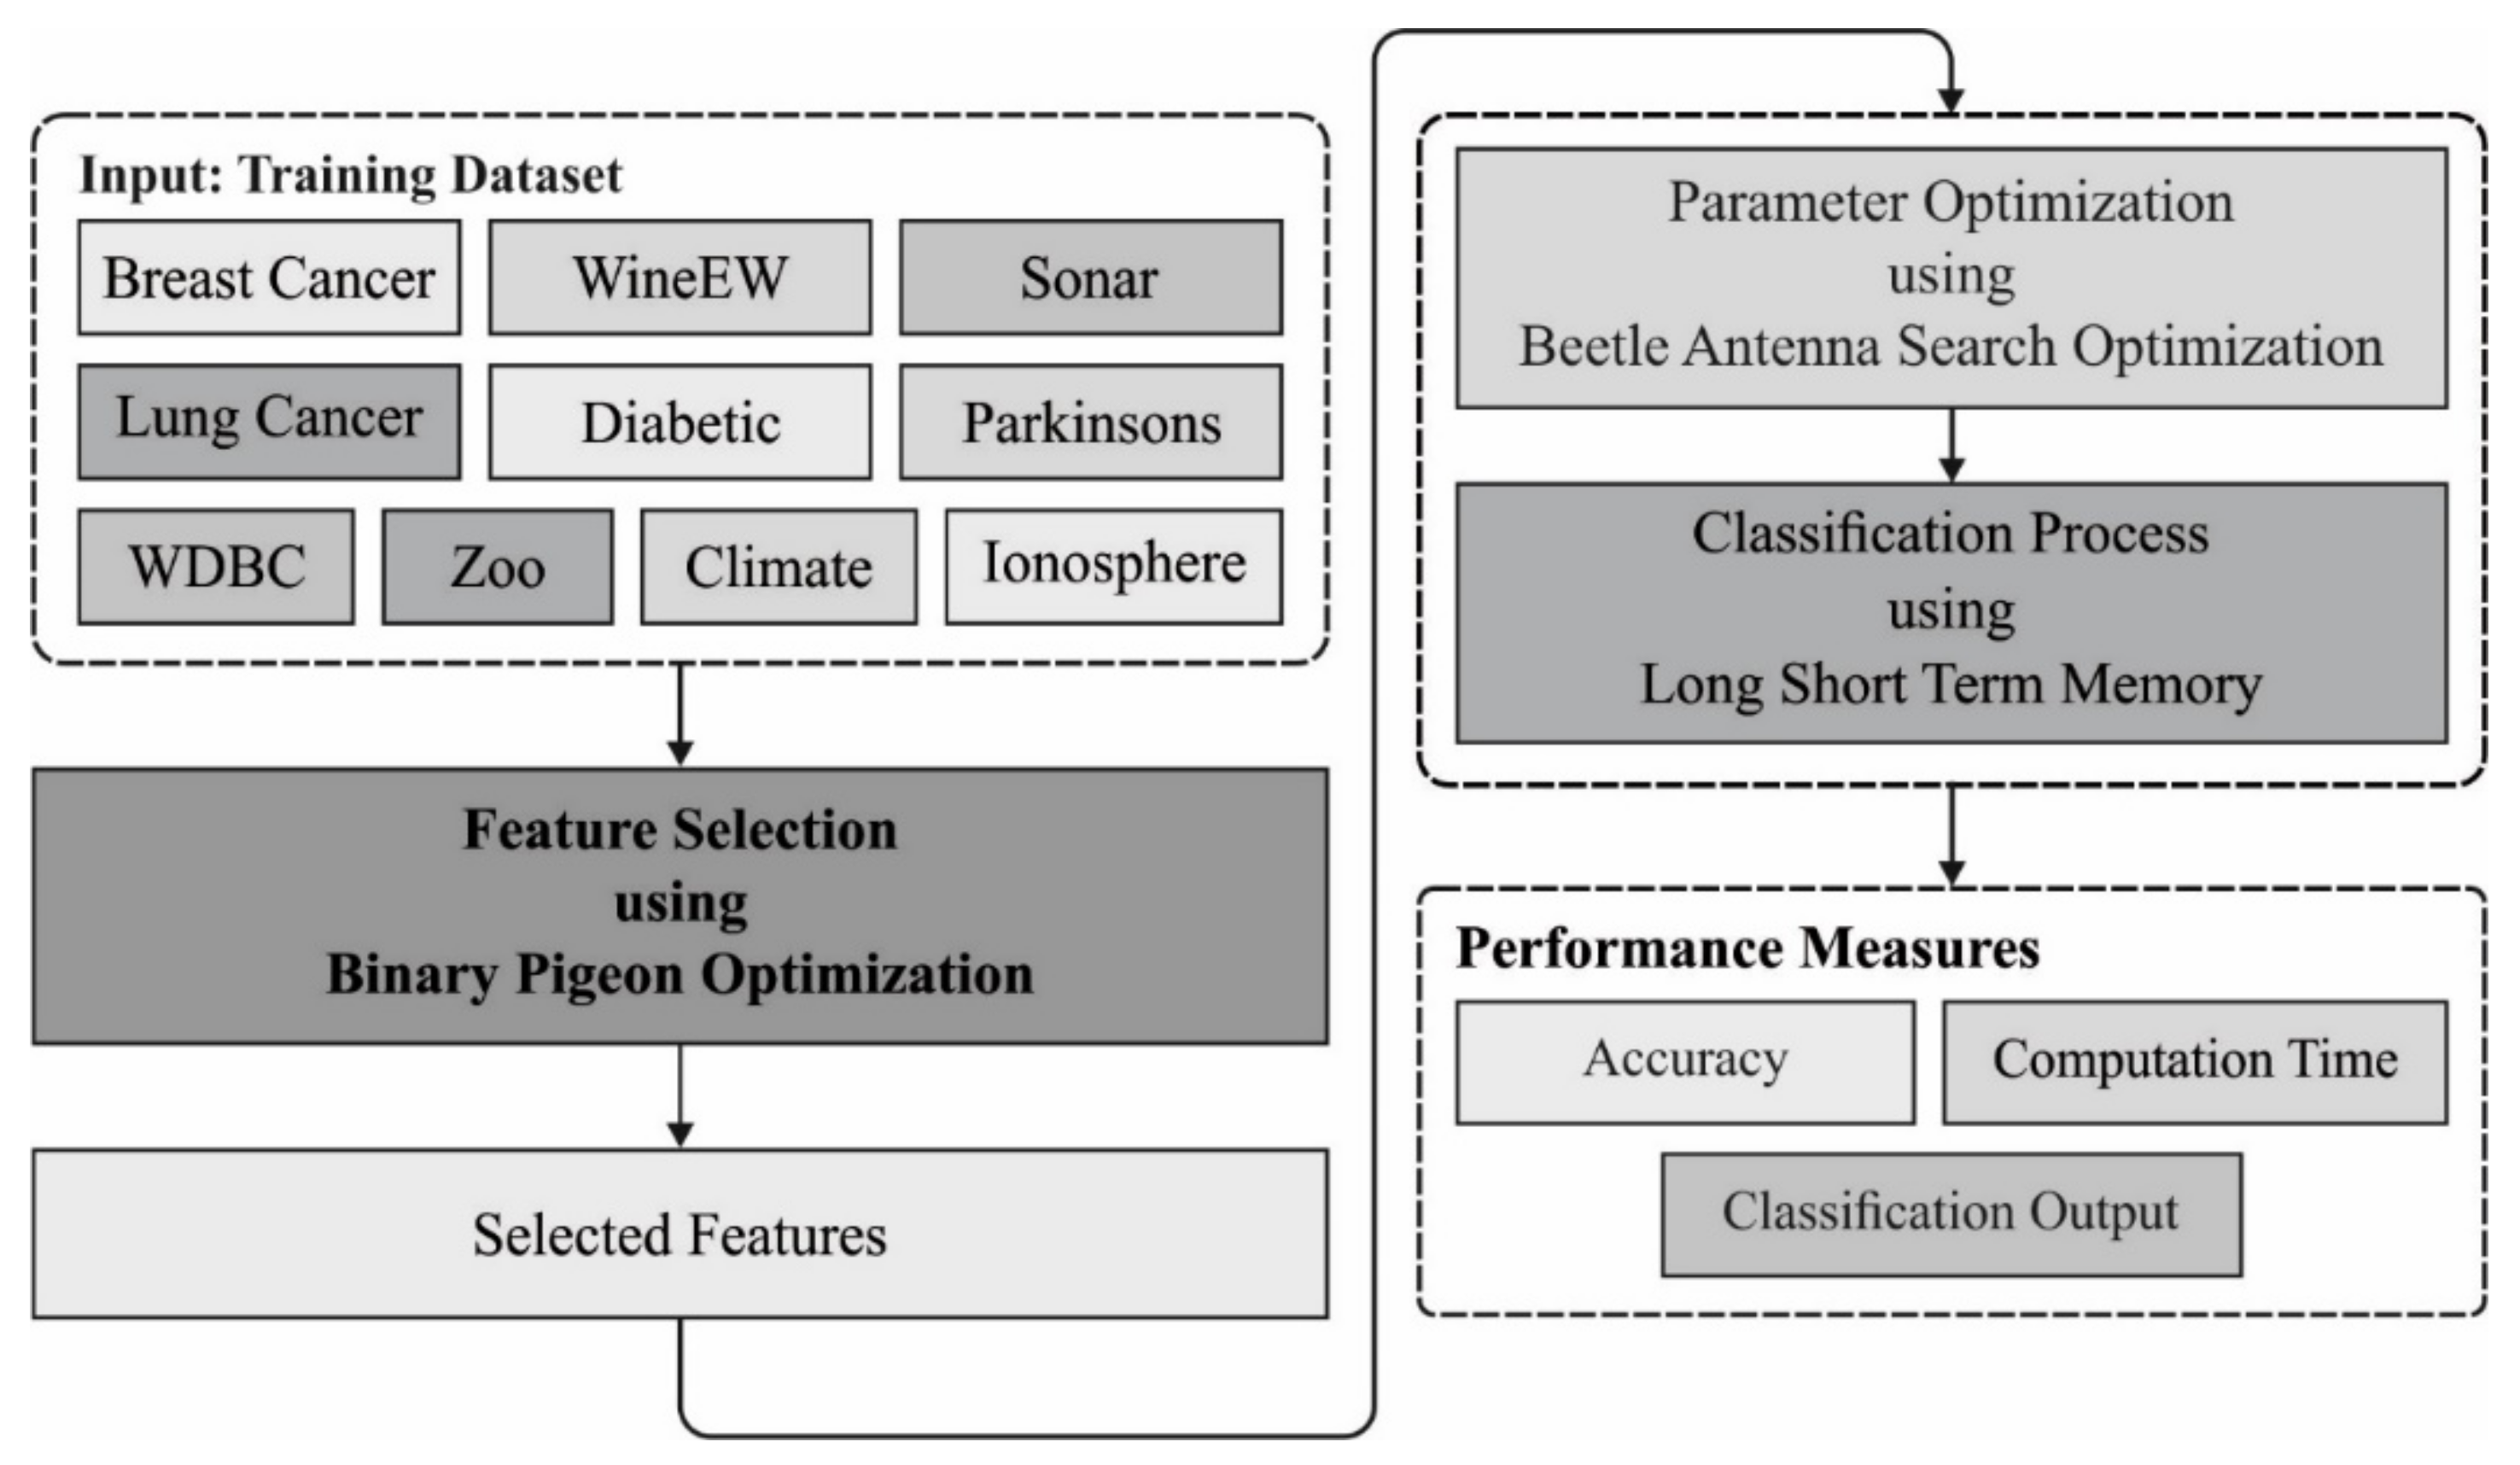
In this study, a new BD classification model using the MOBDC-MR technique was derived, which intends to choose optimal features and effectively classify BD. The MOBDC-MR technique follows a two-stage process, namely, BPOA-based FS and BAS-LSTM based classification. Furthermore, the presented MOBDC-MR technique was realized on Hadoop with the MR programming model.
Figure 1 illustrates the overall working process of the proposed MOBDC-MR model. The detailed working of these modules is given in the following sub-sections.
3.1. MapReduce Programming Framework
Hadoop is a technique that meets the requirements of BD. It can be horizontally scalable and designed as a software model to process huge amounts of data. Hadoop is a public domain execution for Google MR; also, it depends on the programming MR framework. Hadoop frameworks handle the processing of details and permits the developer to focus easily on the application logic. Additionally, Hadoop is a familiar technique, i.e., employed to realize BD. Huge corporations such as Oracle, IBM, and Intel are also based on an extension of Hadoop support for its BD solution. MR and the Hadoop Distributed File System (HDFS) are the fundamental models of Hadoop.
YARN is the resource manager of Hadoop and is accountable for distributing the requested resources (memory and CPU) of a Hadoop cluster to several workloads. In this method, specific jobs could be allocated more or less resources that can be configured based on the user and application. HDFS is the primary element of Hadoop clusters. It is a Java-based DFS, which permits reliable and persistent storage and faster access to a huge amount of data. It splits the file to block and save them redundantly on the cluster, i.e., only perceived and slightly influenced by the users. When the files are saved in it, it is usually not noted, even when a single file is saved on many computers. It has been presented by Google as a way of resolving a class of terabyte or petabyte magnitude problems with huge clusters of inexpensive machinery [
21]. Frameworks, alternative algorithms, and database management systems have been designed for resolving the dramatically increasing data and their model.
The MR model is employed for the parallel and distributed processing of huge amounts of unstructured and structured data, where Hadoop is usually stored in HDFS, clustered by a huge computer [
21]. MR is a programming framework for expressing a distributed computation on a huge scale. MR is a method of splitting all requests into small requests, which are transmitted to several smaller servers for making a scalable usage of the CPU promising. Hence, scaling in small steps is potential (scale-out). The framework depends on two distinct phases for an application:
- (i)
Map—a primary transformation, as well as a recording phase, where single-input records can be treated in parallel.
- (ii)
Reduce—a consolidation/aggregation phase, where each interrelated record is treated in an individual entity.
The two major benefits are related to the consolidation phase: Logical block and map task. The main idea is that the input data could be divided into logical blocks. All of these blocks can be independently treated initially through map tasks. The result from this individually functioning block could be physically separated into distinct sets and later sorted. All of the sorted blocks are later transferred to the reduce task (RT). The RT: A map task can run-in some computed nodes on the cluster, and many map tasks can run in parallel, which could be accountable for transforming the input record to a value or key pair. The output from each map is separated and then sorted. However, there is single division for all RTs. The keys of all sorted divisions and the value related to the keys are treated in the RT. Many RTs can later run in parallel.
3.2. Feature Selection Using the BPOA-FS Technique
During the feature selection process, the BPOA-FS technique is executed on the input data and derives an optimal subset of features. Mainly, the POA consists of three operators: The landmark, map, and compass operators. In the map and compass operators, pigeons sense the geomagnetic fields to form a map for homing. Assume that the searching space is
dimensions, and the
i-th pigeon of swarms can be denoted as
-dimensional vectors
. The velocity of a pigeon, representing the changing location of the pigeon, can be denoted as other
-dimensional vectors
. The formerly visited location of
i-th pigeons are represented by
. The global optimal location of the swarms are
. All pigeons fly based on Equations (1) and (2):
where
indicates map and compass factors, in which
denotes an arbitrary value between 0 and 1,
denotes global optimal solutions,
denotes the present location of a pigeon at time
, and
denotes the present velocity of a pigeon at iteration
.
In the landmark operator, each pigeon is ranked based on their fitness values [
22]. In all generations, the number of pigeons is upgraded by Equation (3), where only half of the pigeons are deliberated to evaluate the preferred location of the center pigeon, where every other pigeon alters their terminus, as follows:
where
represents the number of pigeons in the present iteration
The location of the preferred terminus is evaluated by Equation (4), where every other pigeon updates their location toward Equation (5).
where
represents the location of the center pigeon (preferred destinations). In order to implement the parameter election, a BPOA was presented. Unlike the typical POA, where the solution is upgraded in the searching space toward continuous valued position, in the BPOA, the search space is modeled as an
n-dimensional Boolean lattice. Moreover, the solution is upgraded over the corner of a hypercube. Additionally, to solve the problem of whether to elect or not, a provided parameter and a binary solution vector are applied, in which 1 corresponds to a parameter being elected to comprise the novel datasets, and
corresponds to something else.
In binary algorithms, one uses the step vectors to evaluate the likelihood of changing the position, and the transfer function considerably impacts the balance between exploitation and exploration. In the FS method, when the size of feature vectors is , the amount of distinct feature combination tends to be , i.e., a massive space for exhaustive searching. The proposed hybrid algorithms are employed for this purpose for searching the feature space vigorously, also generating the right combinations of features. The FS falls within multi-objective problems, since it needs to satisfy several objectives for getting an optimal solution, which minimizes the subsets of FS while simultaneously maximizing the accuracy of output to provided classifiers.
Based on the abovementioned, the fitness function (FF) to determine a solution under this condition was made to attain a balance among the two objectives as:
where
is the classifier’s error rate,
denotes the size of the subset that the technique selects,
is the overall number of features contained in the present datasets,
denotes parameter
, related to the weight of error rate of classifications, and correspondingly,
represents the importance of reduction features. The classification performance permits an important weight instead of the number of selected features. When the estimation function only considers the classification accuracy, the effects would be neglect of the solution, which might contain similar accuracy; however, there would be less selected features, which serves as the main aspect in reducing the dimensionality problem.
3.3. Data Classification Using the BAS-LSTM Technique
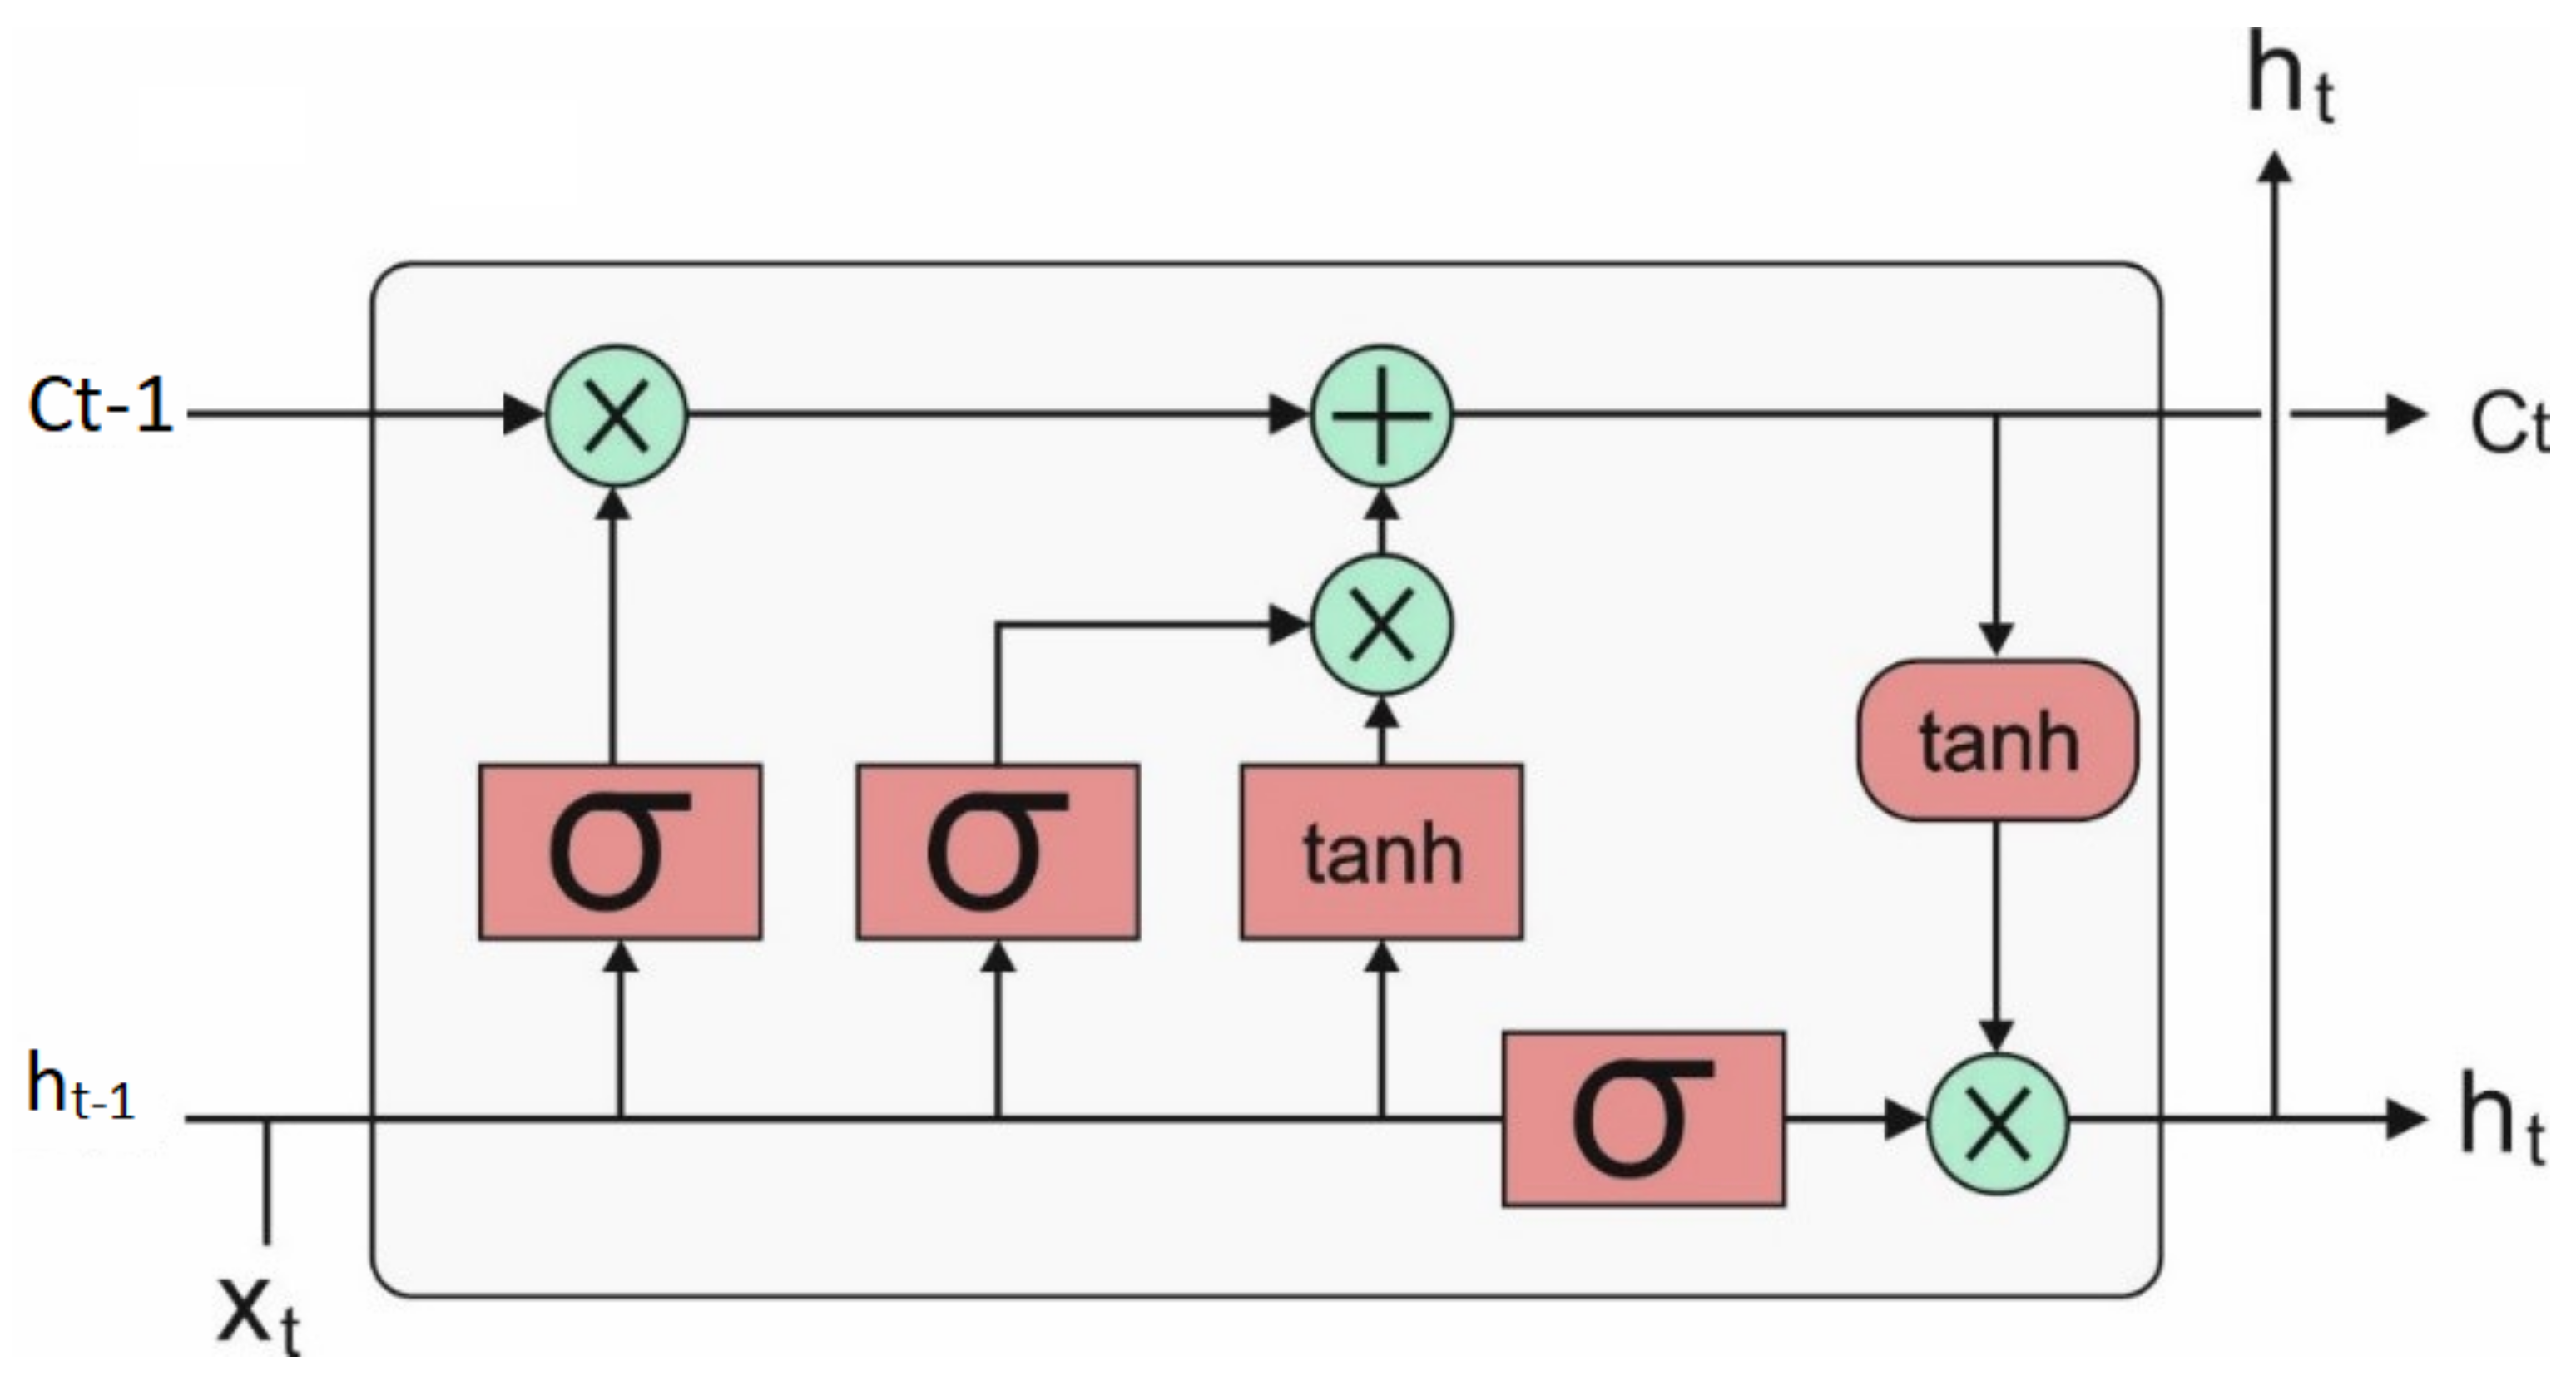
Once the features have been chosen, they are fed into the LSTM model to allot proper class labels. LSTM extends the recurrent neural network (RNN) with memory cells, rather than recurrent units, for storing and outputting data, ease the learning of temporal relationships on a longer time scale. LSTM utilizes the idea of gating: The procedure that depends on elementwise multiplication of the input that determines the performance of all separate memory cells. LSTM updates its cell states, based on the activation of the gate. The input provided to LSTM is fed into distinct gates, which control the process, and implemented on the memory of cells: Write (input gate) and reset (forget gate)/read (output gate). The computations of the hidden values
of an LSTM cell are upgraded in each time step
. The vectorial depiction (vector representing each unit in a layer) of LSTM layers is given in the following equations:
where
,
,
, and
represent the input gate, forget gate, output gate, and cell activation vector, respectively, with similar sizes to vector
determining the hidden values;
represents a nonlinear function;
represents the input to the memory cell layer at time
;
,
,
,
,
,
,
,
,
,
, and
indicate the weight matrices, with the subscripts demonstrating the from–to relationship
indicates the input–input gate matrix,
denotes the hidden-input gate matrix, etc.);
, and
signify bias vectors. Layer representation was neglected for clarity network with LSTM cells, have achieved an outstanding performance when compared to regular recurrent units in speech detection, in which they provide an advanced result in phoneme detection [
23].
Figure 2 depicts the architecture of the LSTM model.
For improving the efficacy of the LSTM model, the hyperparameter tuning process is carried out by the use of BAS technique. This approach is one of the smart optimization methods that simulate beetles’ foraging behaviors. Once a beetle starts foraging, it employs its right and left antennas for sensing the odor intensity of food. When the odor intensity obtained through the left antennas are larger, it flies to the left through the stronger odor intensity; otherwise, it flies to the right. The modeling procedure of BAS algorithms is given in the following:
where
represents the spatial dimension. The space coordinates of a beetle’s right and left sides and its antennae are made by:
Amongst others,
represents the location of a beetle’s antennae in the
t-th iteration,
represents the location of a beetle’s right antennae in the
t-th iteration,
represents the location of a beetle’s left antennae in the
t-th iteration, and
represents a beetle’s two locations. Based on the elected FF, the corresponding fitness value of the right and left antennae are estimated, and beetles move toward the antennae using a smaller fitness number [
24,
25]. The positions of beetles are iteratively upgraded by:
Amongst others, denotes the step factor, sign indicates a sign function, and eta represents the variable step factor, which is generally 0.95.
4. Performance Validation
This section investigates the performance of the MOBDC-MR technique under different dimensions. The results were examined against ten benchmark datasets, and the results are given in
Table 1. The results were inspected under several aspects and a detailed comparative results analysis was conducted in terms of different measures.
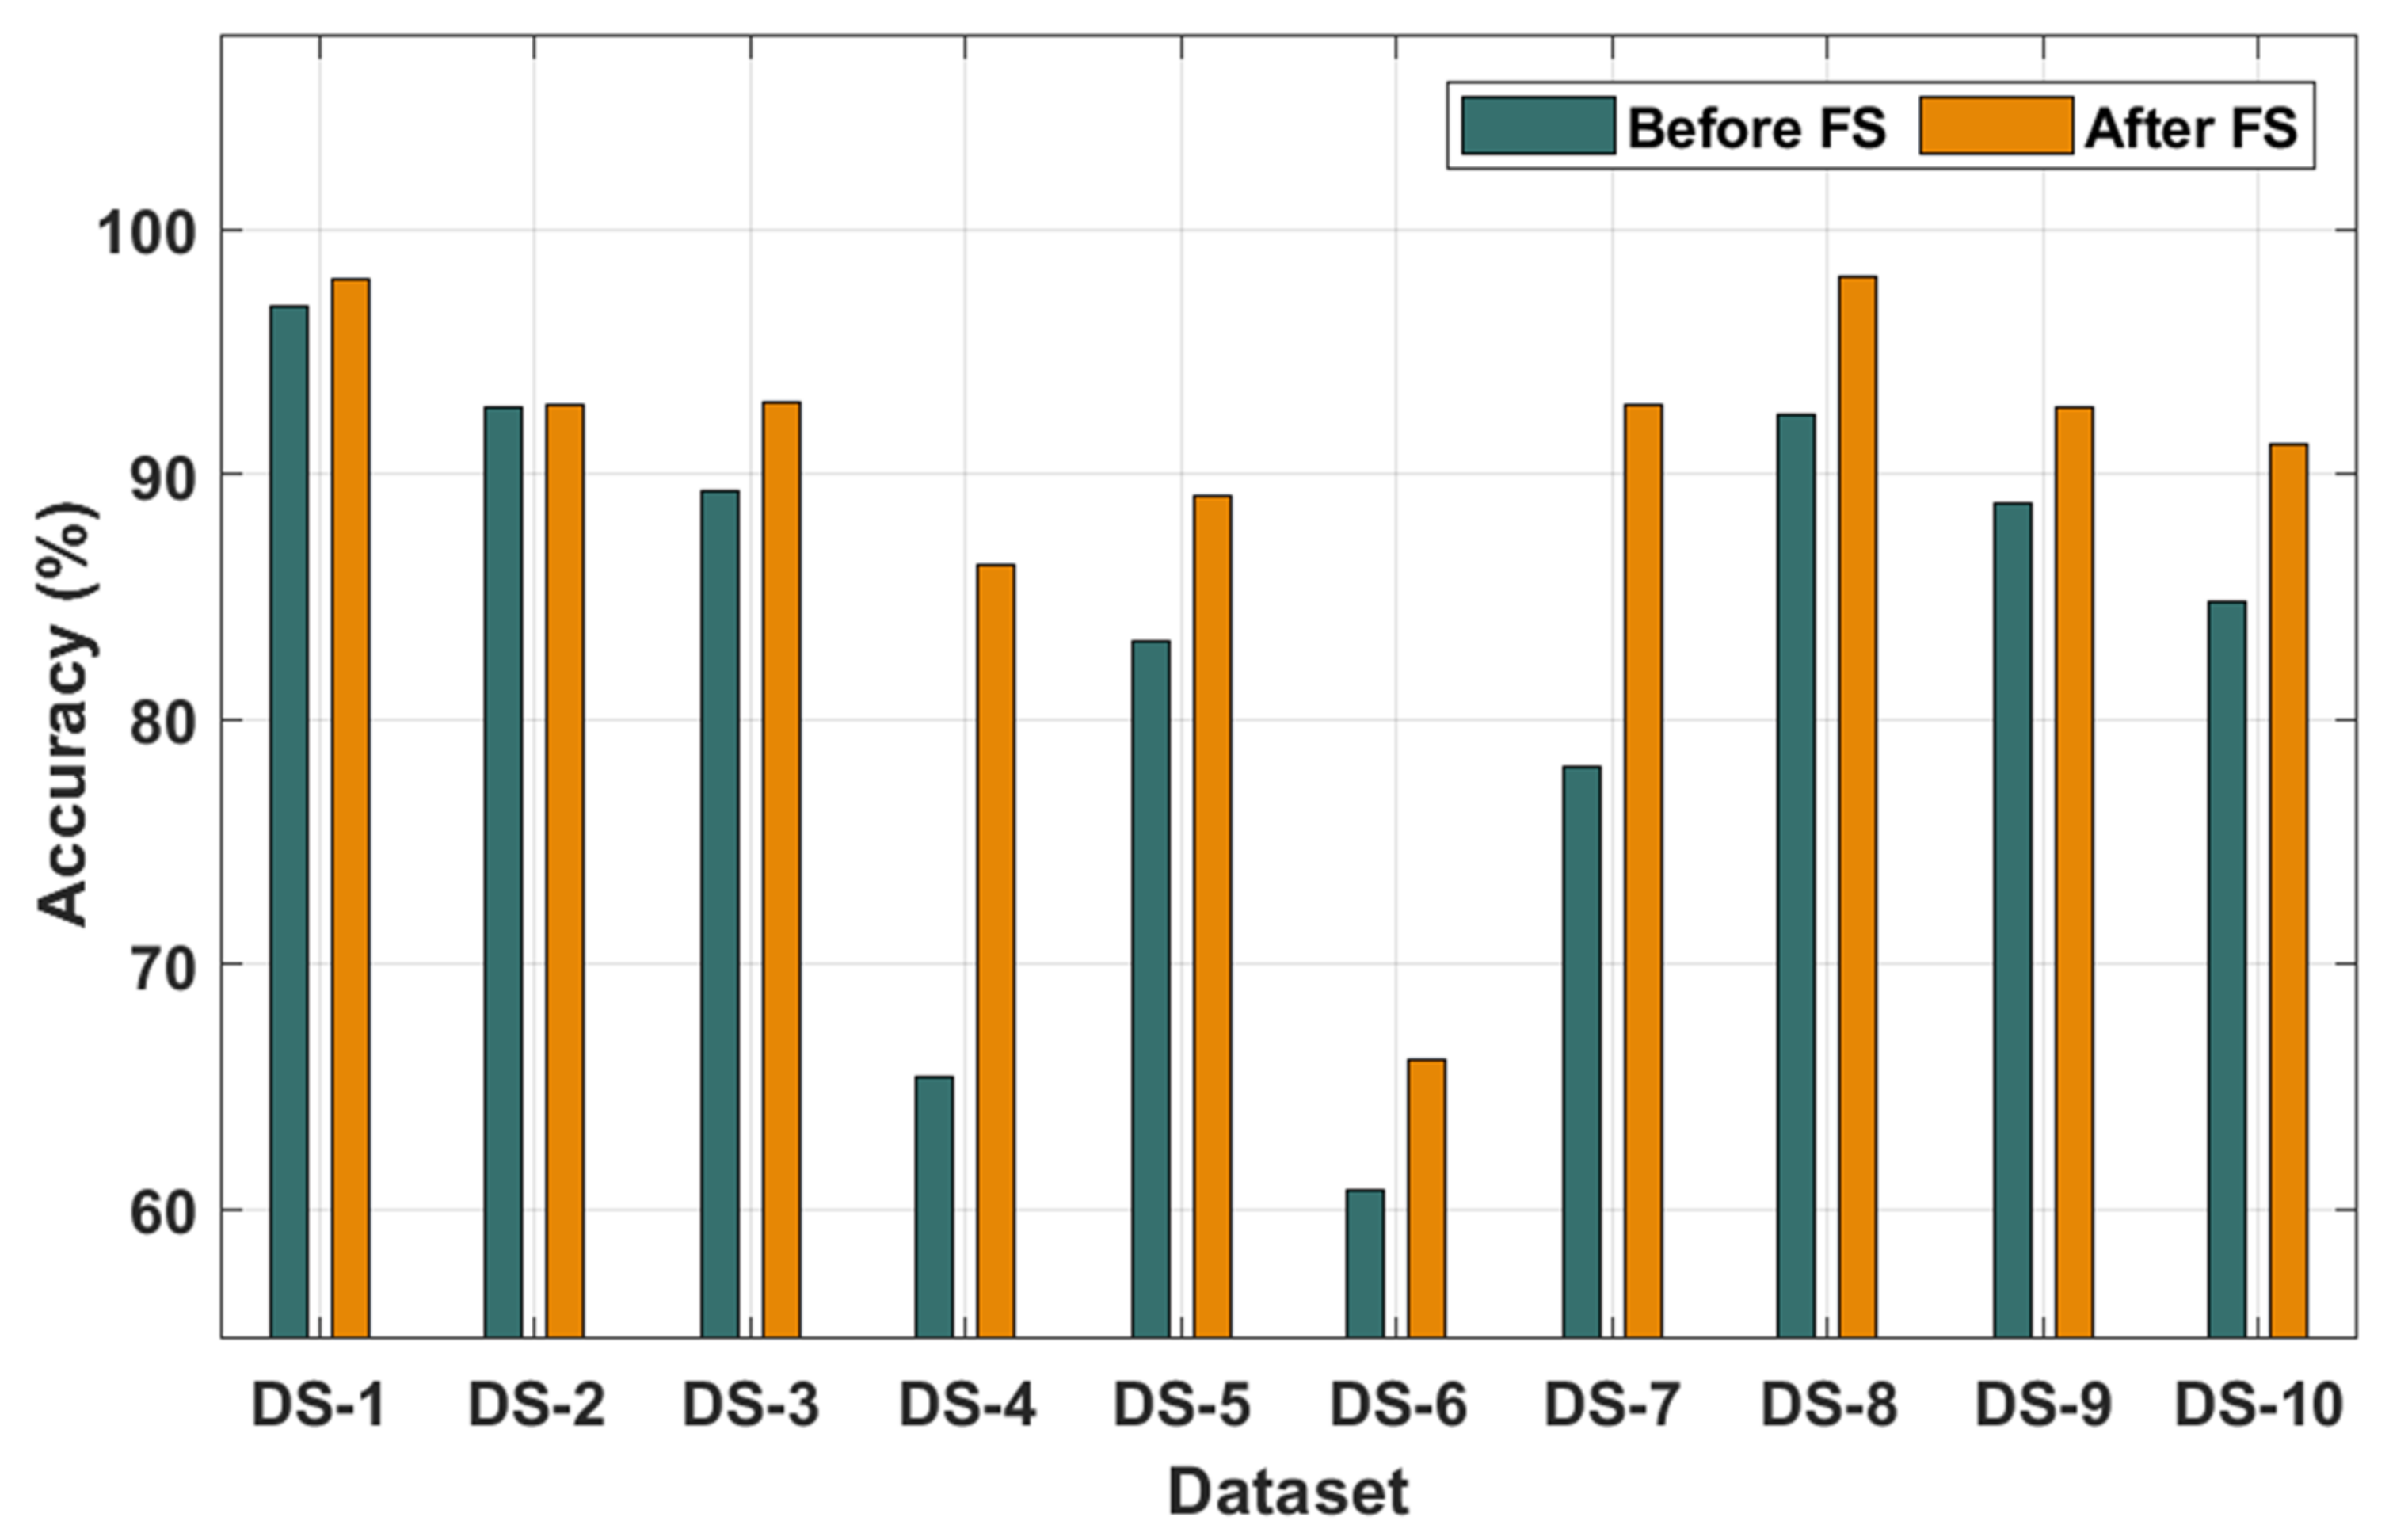
The results of the classification analysis of the MOBDC-MR technique on all the applied datasets are given in
Table 2 and
Figure 3 and
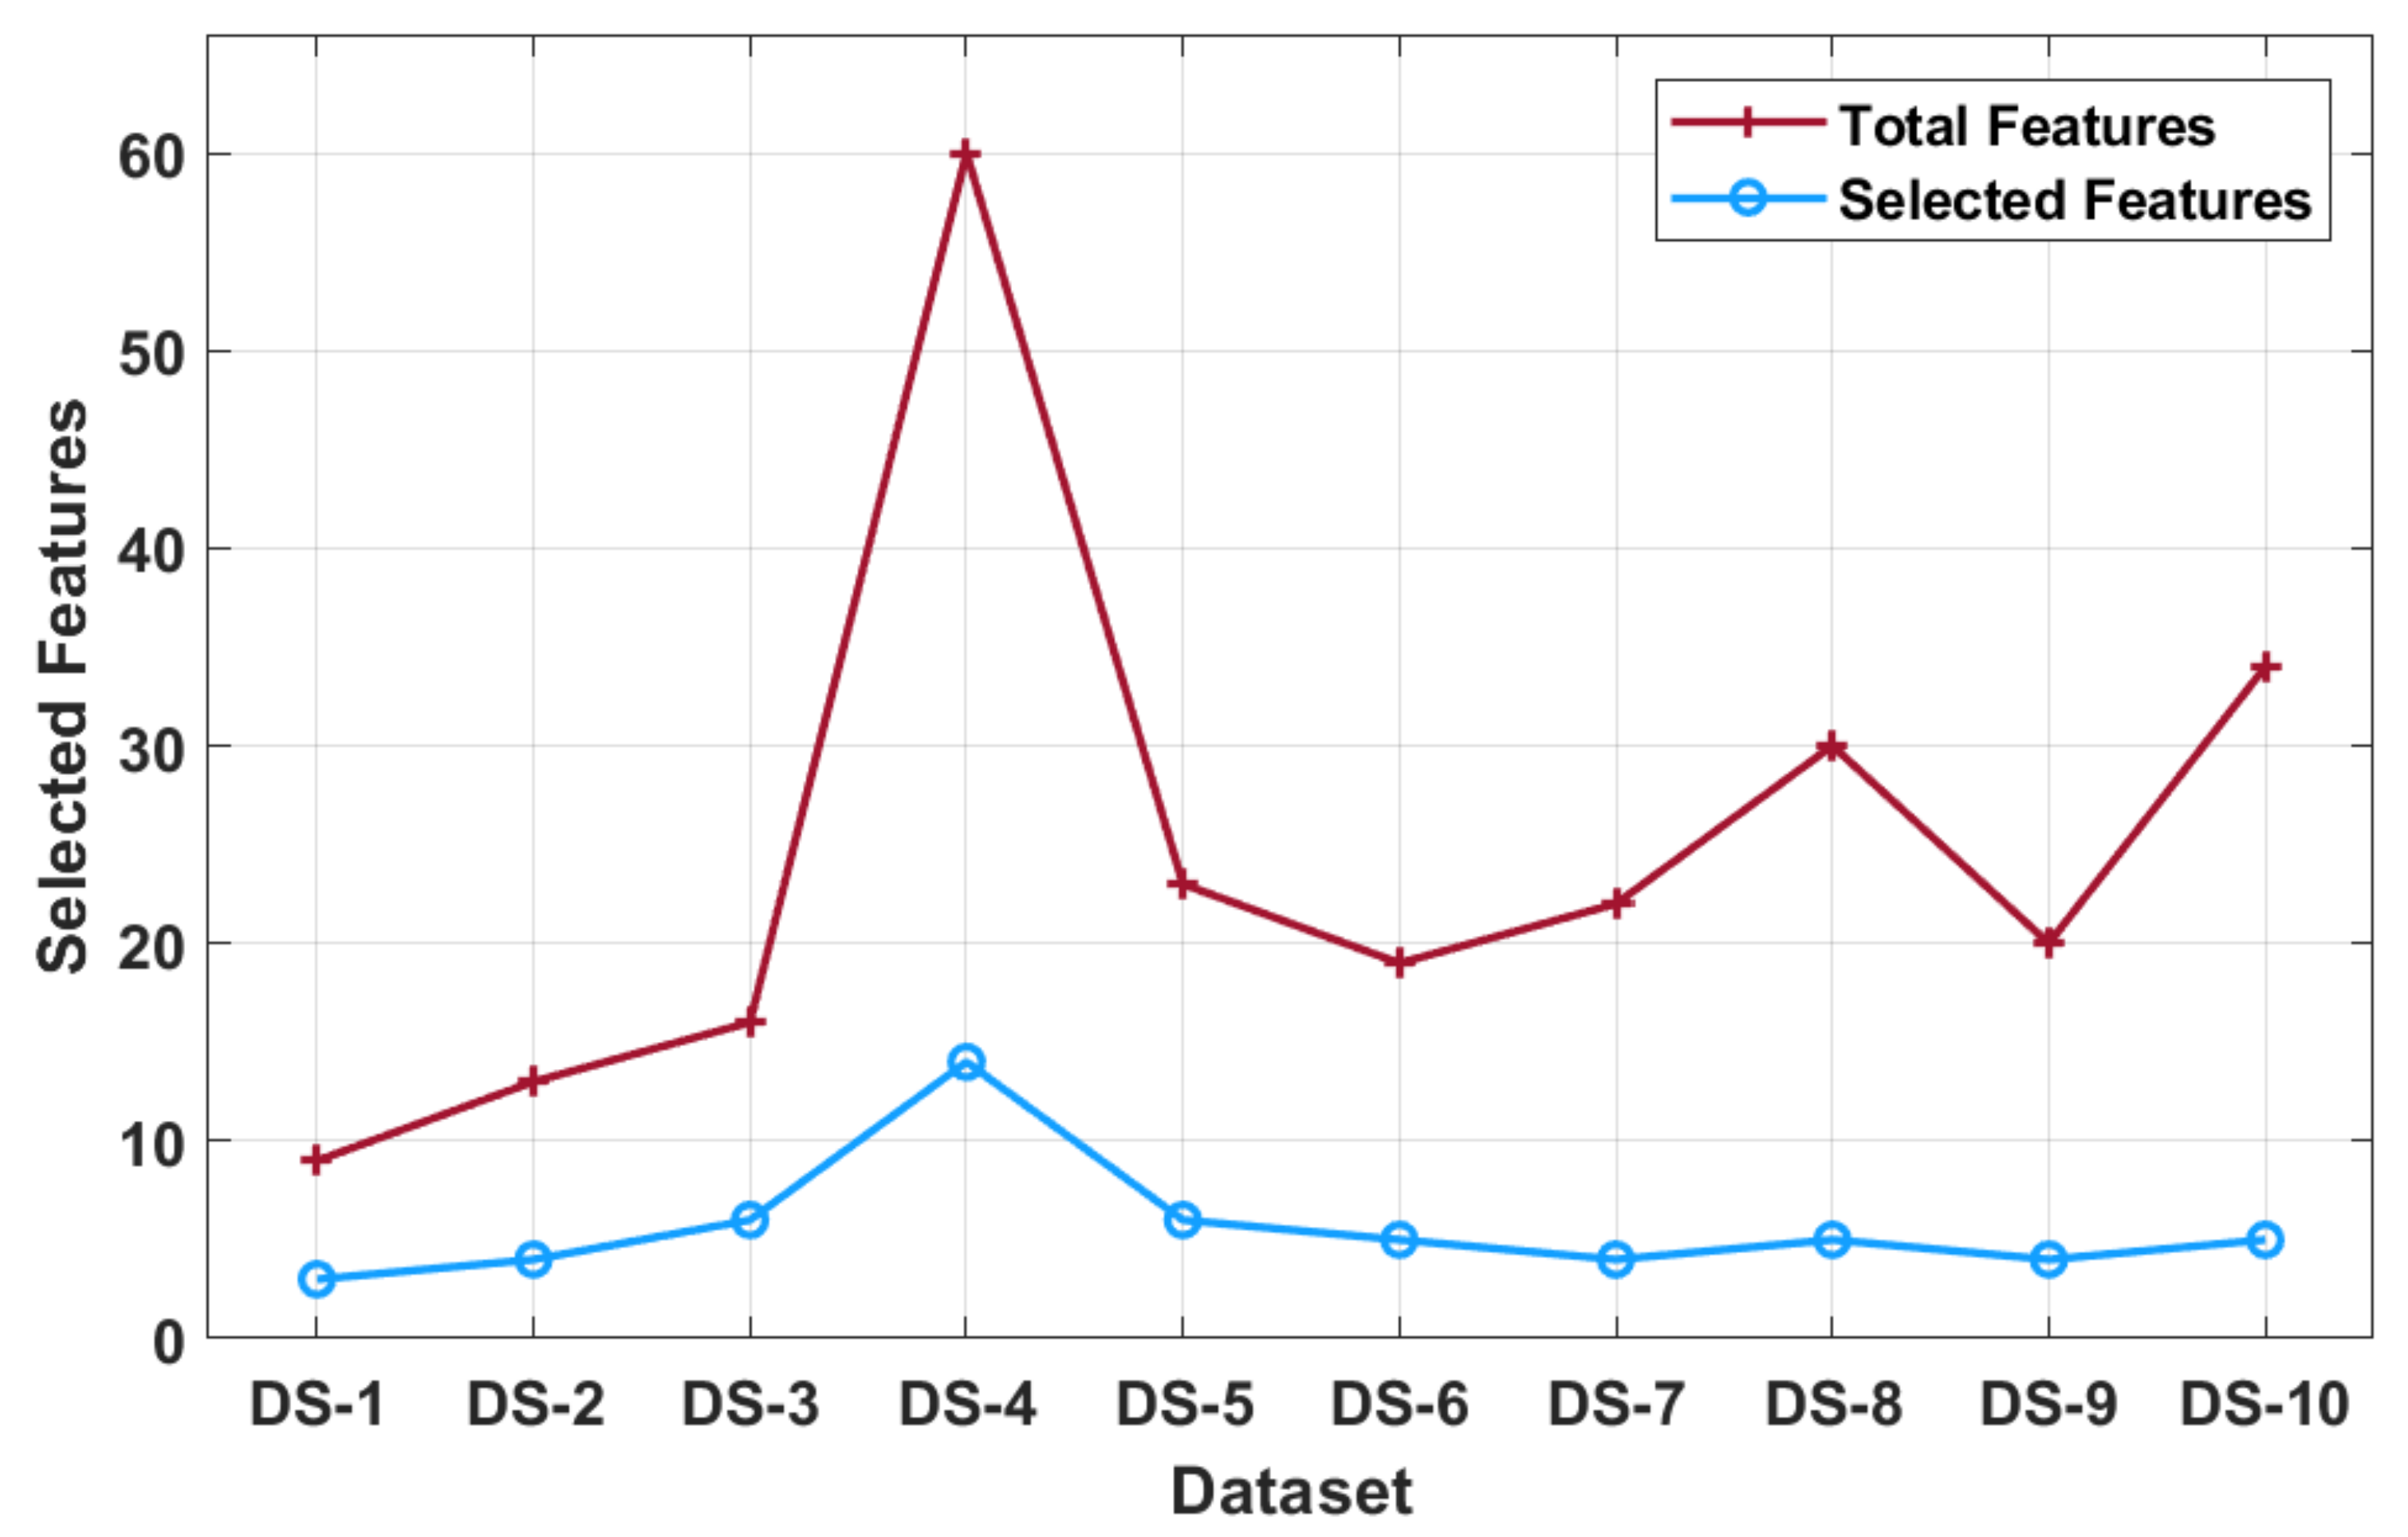
Figure 4. The results depict that the MOBDC-MR technique attained maximum accuracy after the FS process and chose only a minimum number of features on the applied datasets. The accuracy analysis was carried out using the MOBDC-MR technique with and without the FS process. The results demonstrate that the MOBDC-MR technique accomplished proficient results with higher accuracy after the FS process. For instance, the MOBDC-MR technique resulted effective in classification after the FS process by obtaining an accuracy of 97.98%, 92.88%, 92.98%, 86.25%, 89.15%, 66.11%, 92.86%, 98.05%, 92.75%, and 91.18% on the applied datasets 1–10 respectively. Similarly, the MOBDC-MR technique chose a minimal number of 3, 4, 6, 14, 6, 5, 4, 5, 4, and 5 features on the applied datasets 1–10, respectively.
Table 3 reports the comparative analysis of different FS techniques such as the social spider optimization (SSO) and pigeon-inspired optimization (PIO) algorithms in terms of the number of selected features. The results show that the BPOA-FS technique demonstrated an effectual outcome with the least number of selected features on all of the applied datasets.
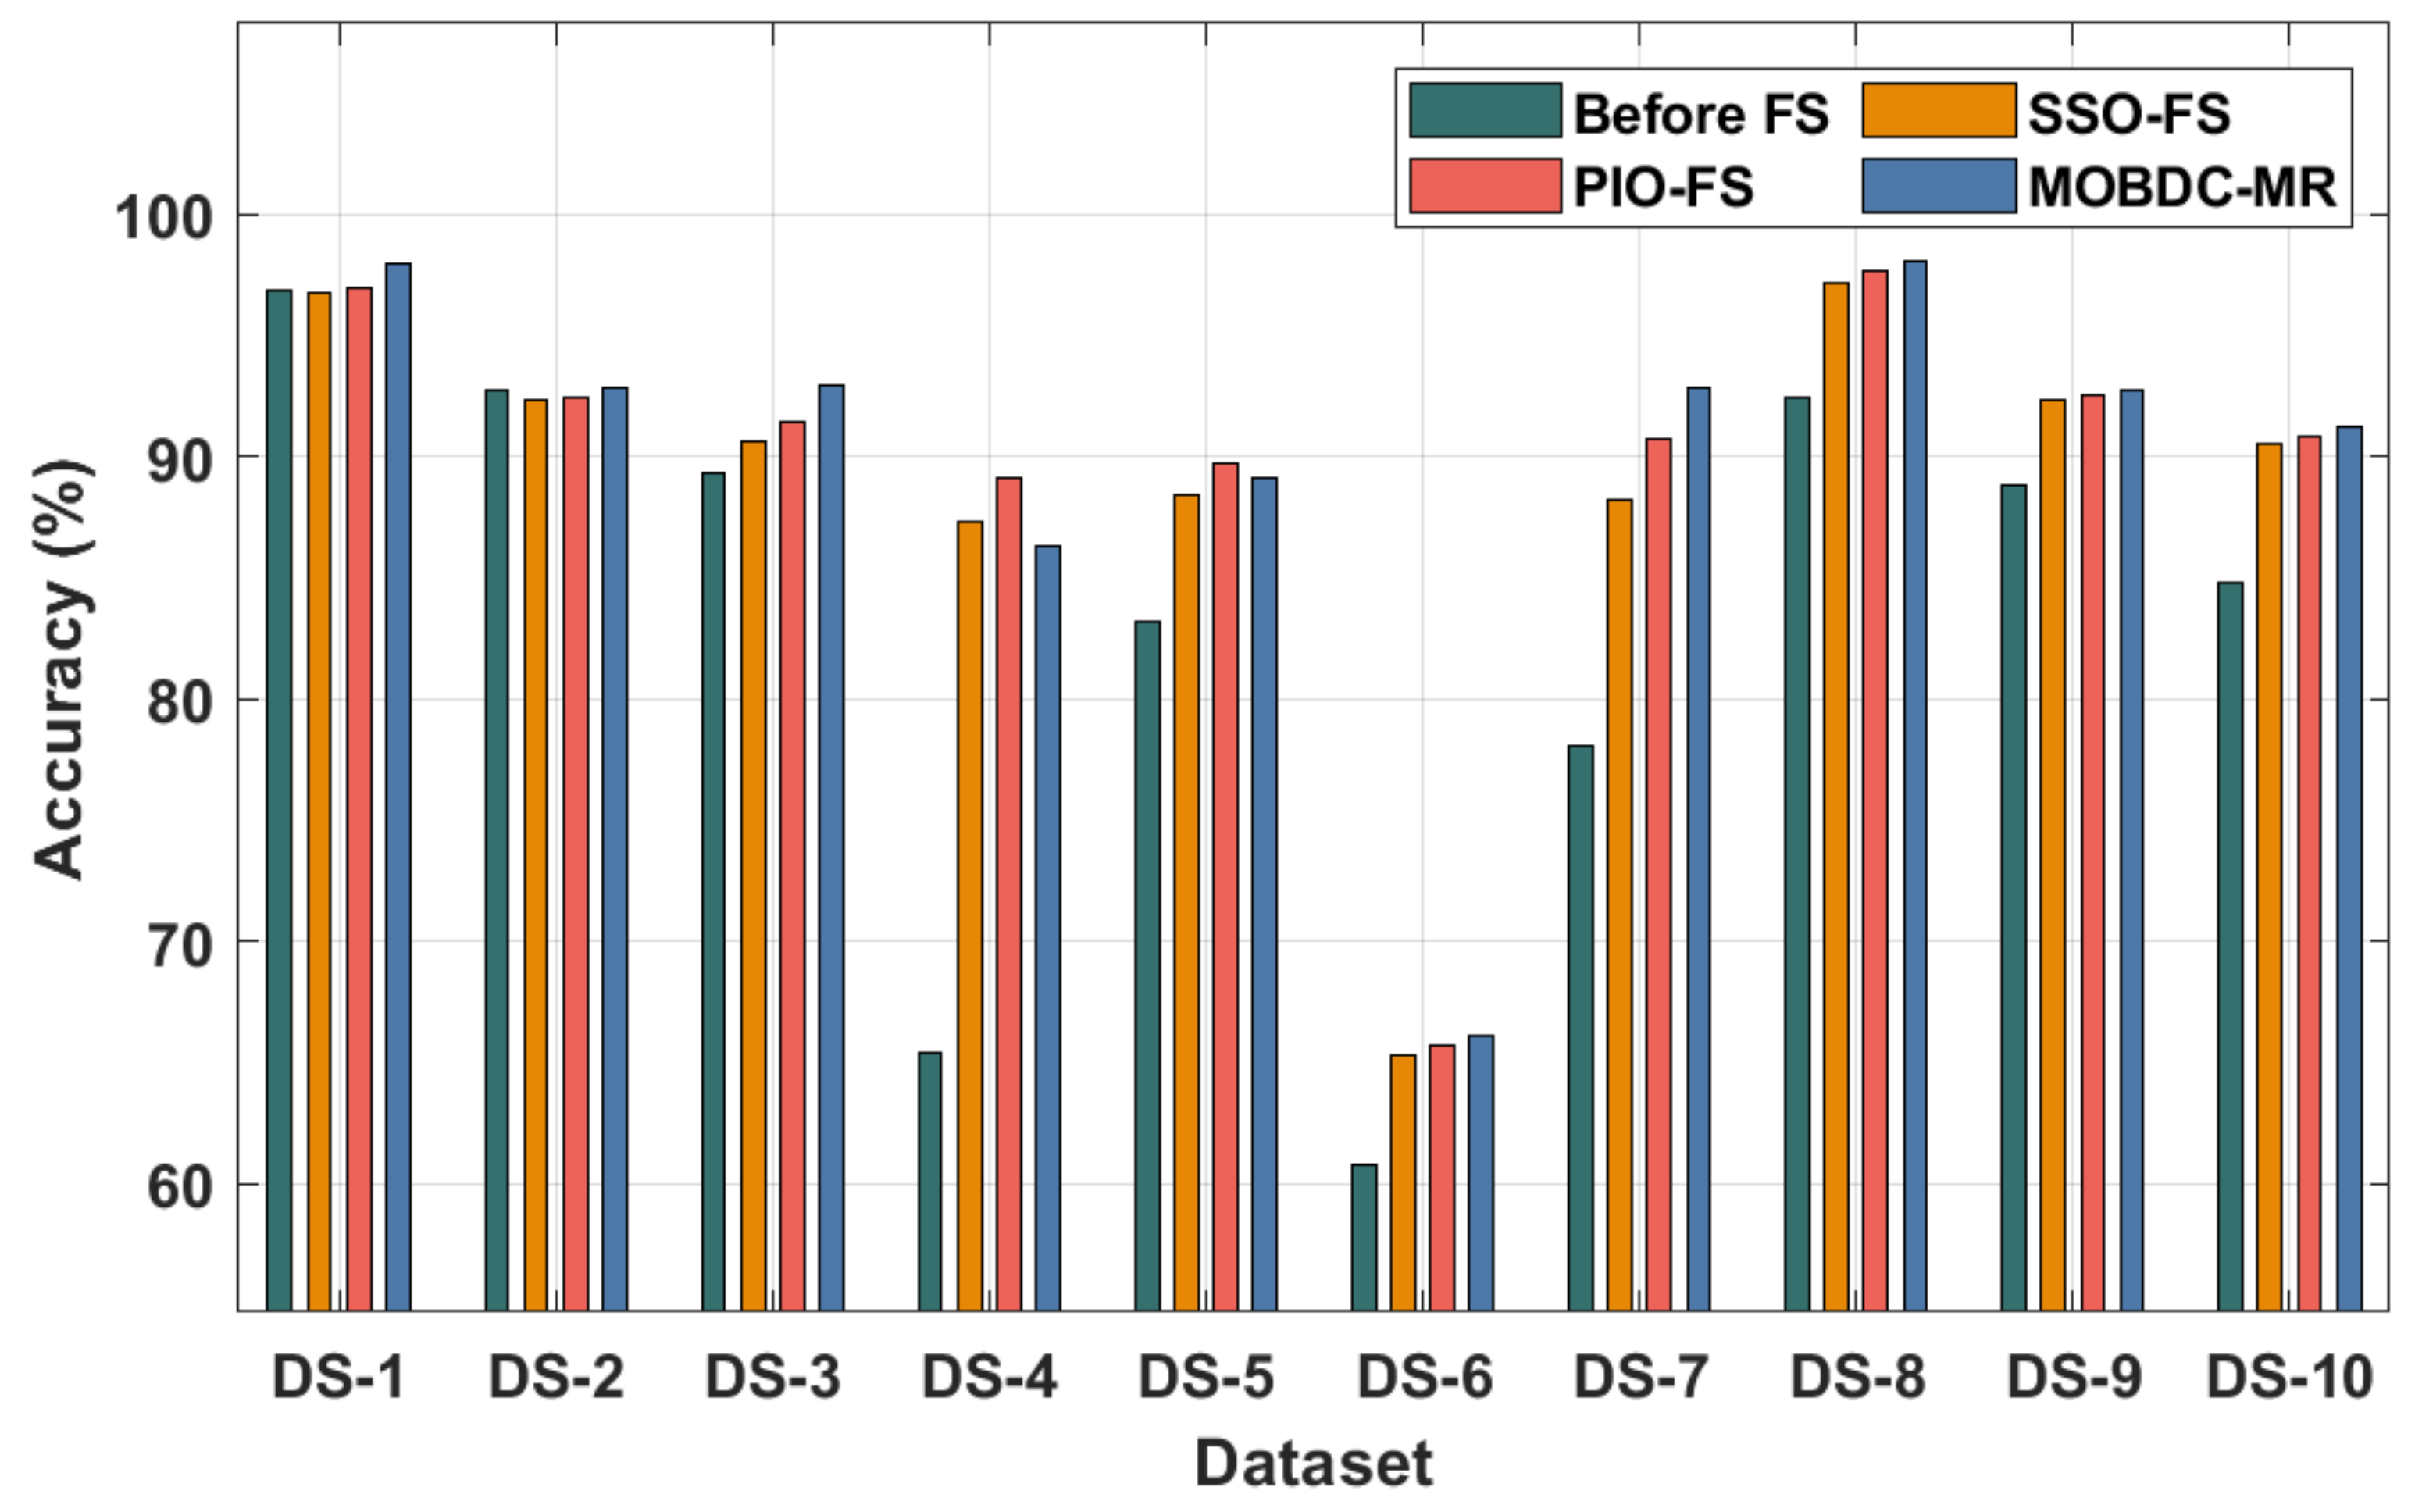
Table 4 and
Figure 5 portray the accuracy analysis of different FS techniques with LSTM as the classification model. The results demonstrate that the MOBDC-MR technique resulted in a superior classification performance over the other techniques. For instance, with dataset-1, the MOBDC-MR technique offered a maximum accuracy of 97.98%, whereas the SSO-FS and PIO-FS techniques obtained minimal accuracies of 96.78% and 96.97%, respectively. At the same time, with dataset-3, the MOBDC-MR approach obtained a maximal accuracy of 92.98%, whereas the SSO-FS and PIO-FS methods reached lesser accuracies of 90.66% and 91.42%, respectively. In line with dataset-6, the MOBDC-MR algorithm reached a higher accuracy of 66.11%, whereas the SSO-FS and PIO-FS techniques obtained lower accuracies of 65.28% and 65.69%, respectively. At last, with dataset-10, the MOBDC-MR system offered a maximum accuracy of 91.18%, whereas the SSO-FS and PIO-FS techniques gained reduced accuracies of 90.50% and 90.83%, respectively.
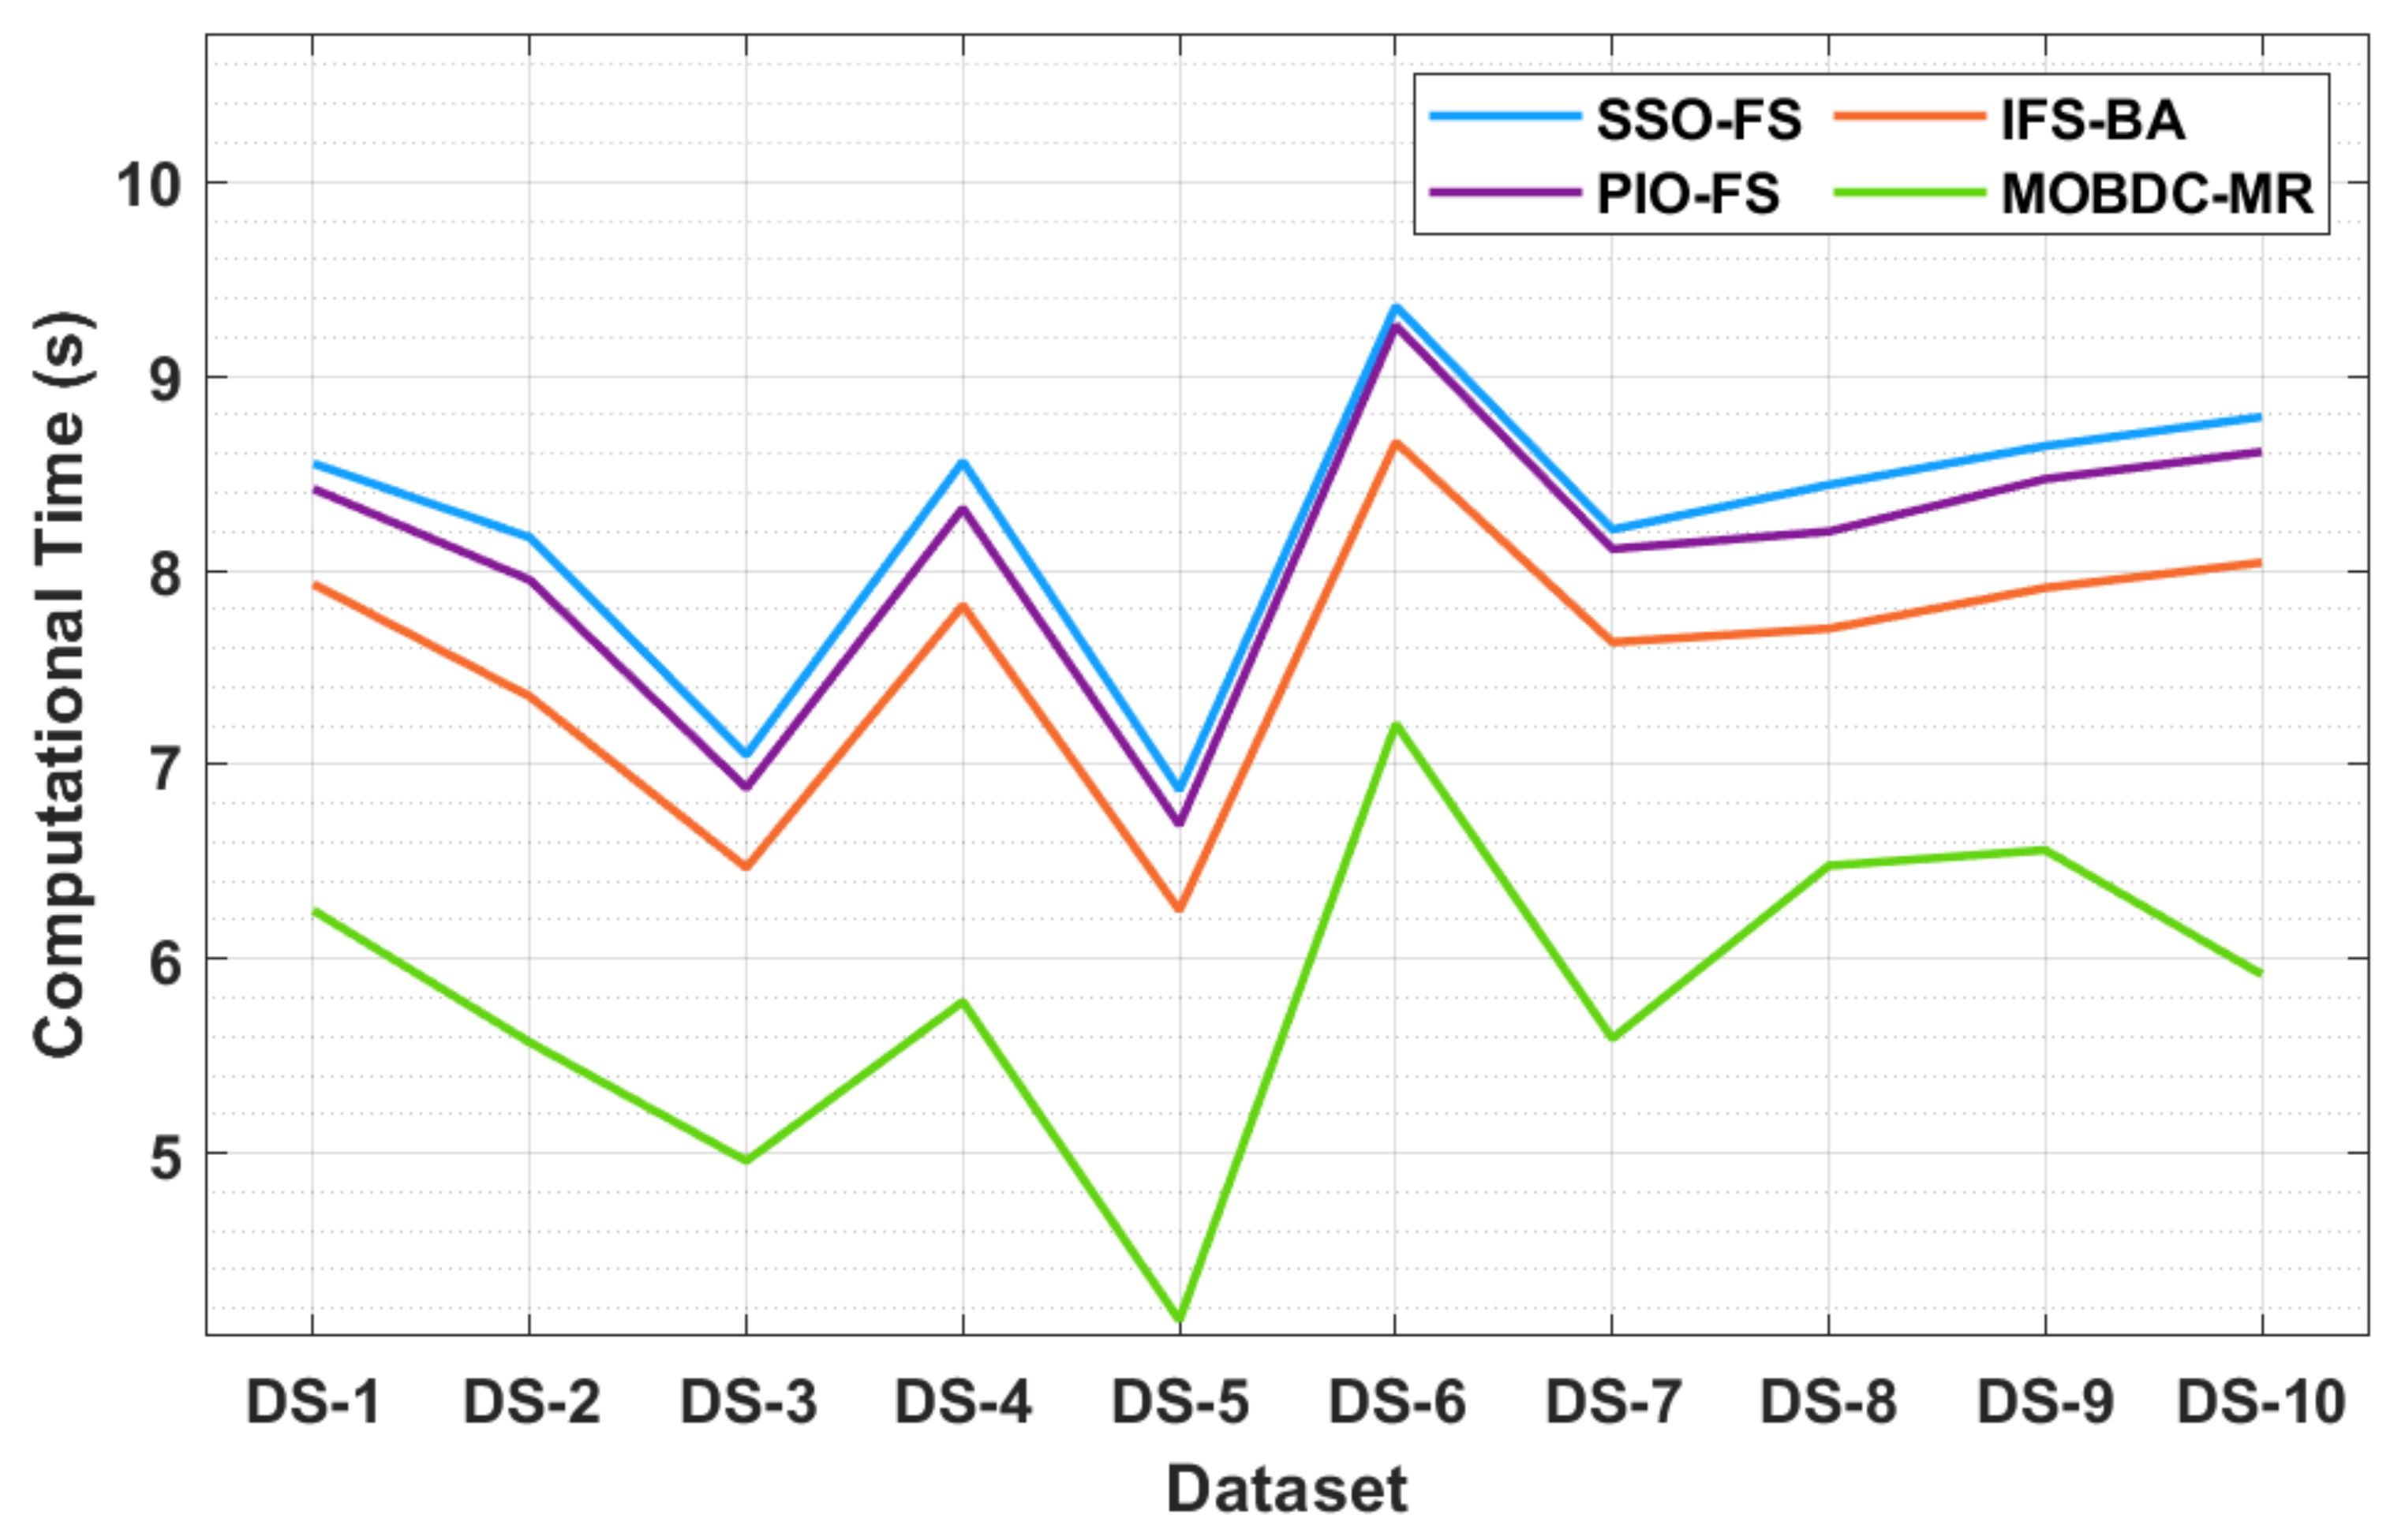
The results of a brief computation time (CT) analysis of the MOBDC-MR technique with existing methods are displayed in
Table 5 and
Figure 6. The resultant values portray that the MOBDC-MR technique attained minimal CT on all of the tested datasets. For instance, with dataset-1, a lower CT of 5.25 s was required by the MOBDC-MR technique, whereas the SSO-FS, PIO-FS, and IFS-BA techniques needed higher CTs of 8.55 s, 8.42 s, and 7.93 s, respectively. Following this, with dataset-3, a lower CT of 4.96 s was essential for the MOBDC-MR methodology, whereas the SSO-FS, PIO-FS, and IFS-BA techniques required higher CTs of 7.05 s, 6.88 s, and 6.47 s, respectively.
In addition, with dataset-5, a lower CT of 4.14 s was required by the MOBDC-MR technique, whereas the SSO-FS, PIO-FS, and IFS-BA approaches needed increased CTs of 6.87 s, 6.69 s, and 6.25 s, respectively. Eventually, with dataset-10, a lower CT of 5.92 s was required by the MOBDC-MR algorithm, whereas the SSO-FS, PIO-FS, and IFS-BA techniques required superior CTs of 8.79 s, 8.61 s, and 8.04 s, respectively.
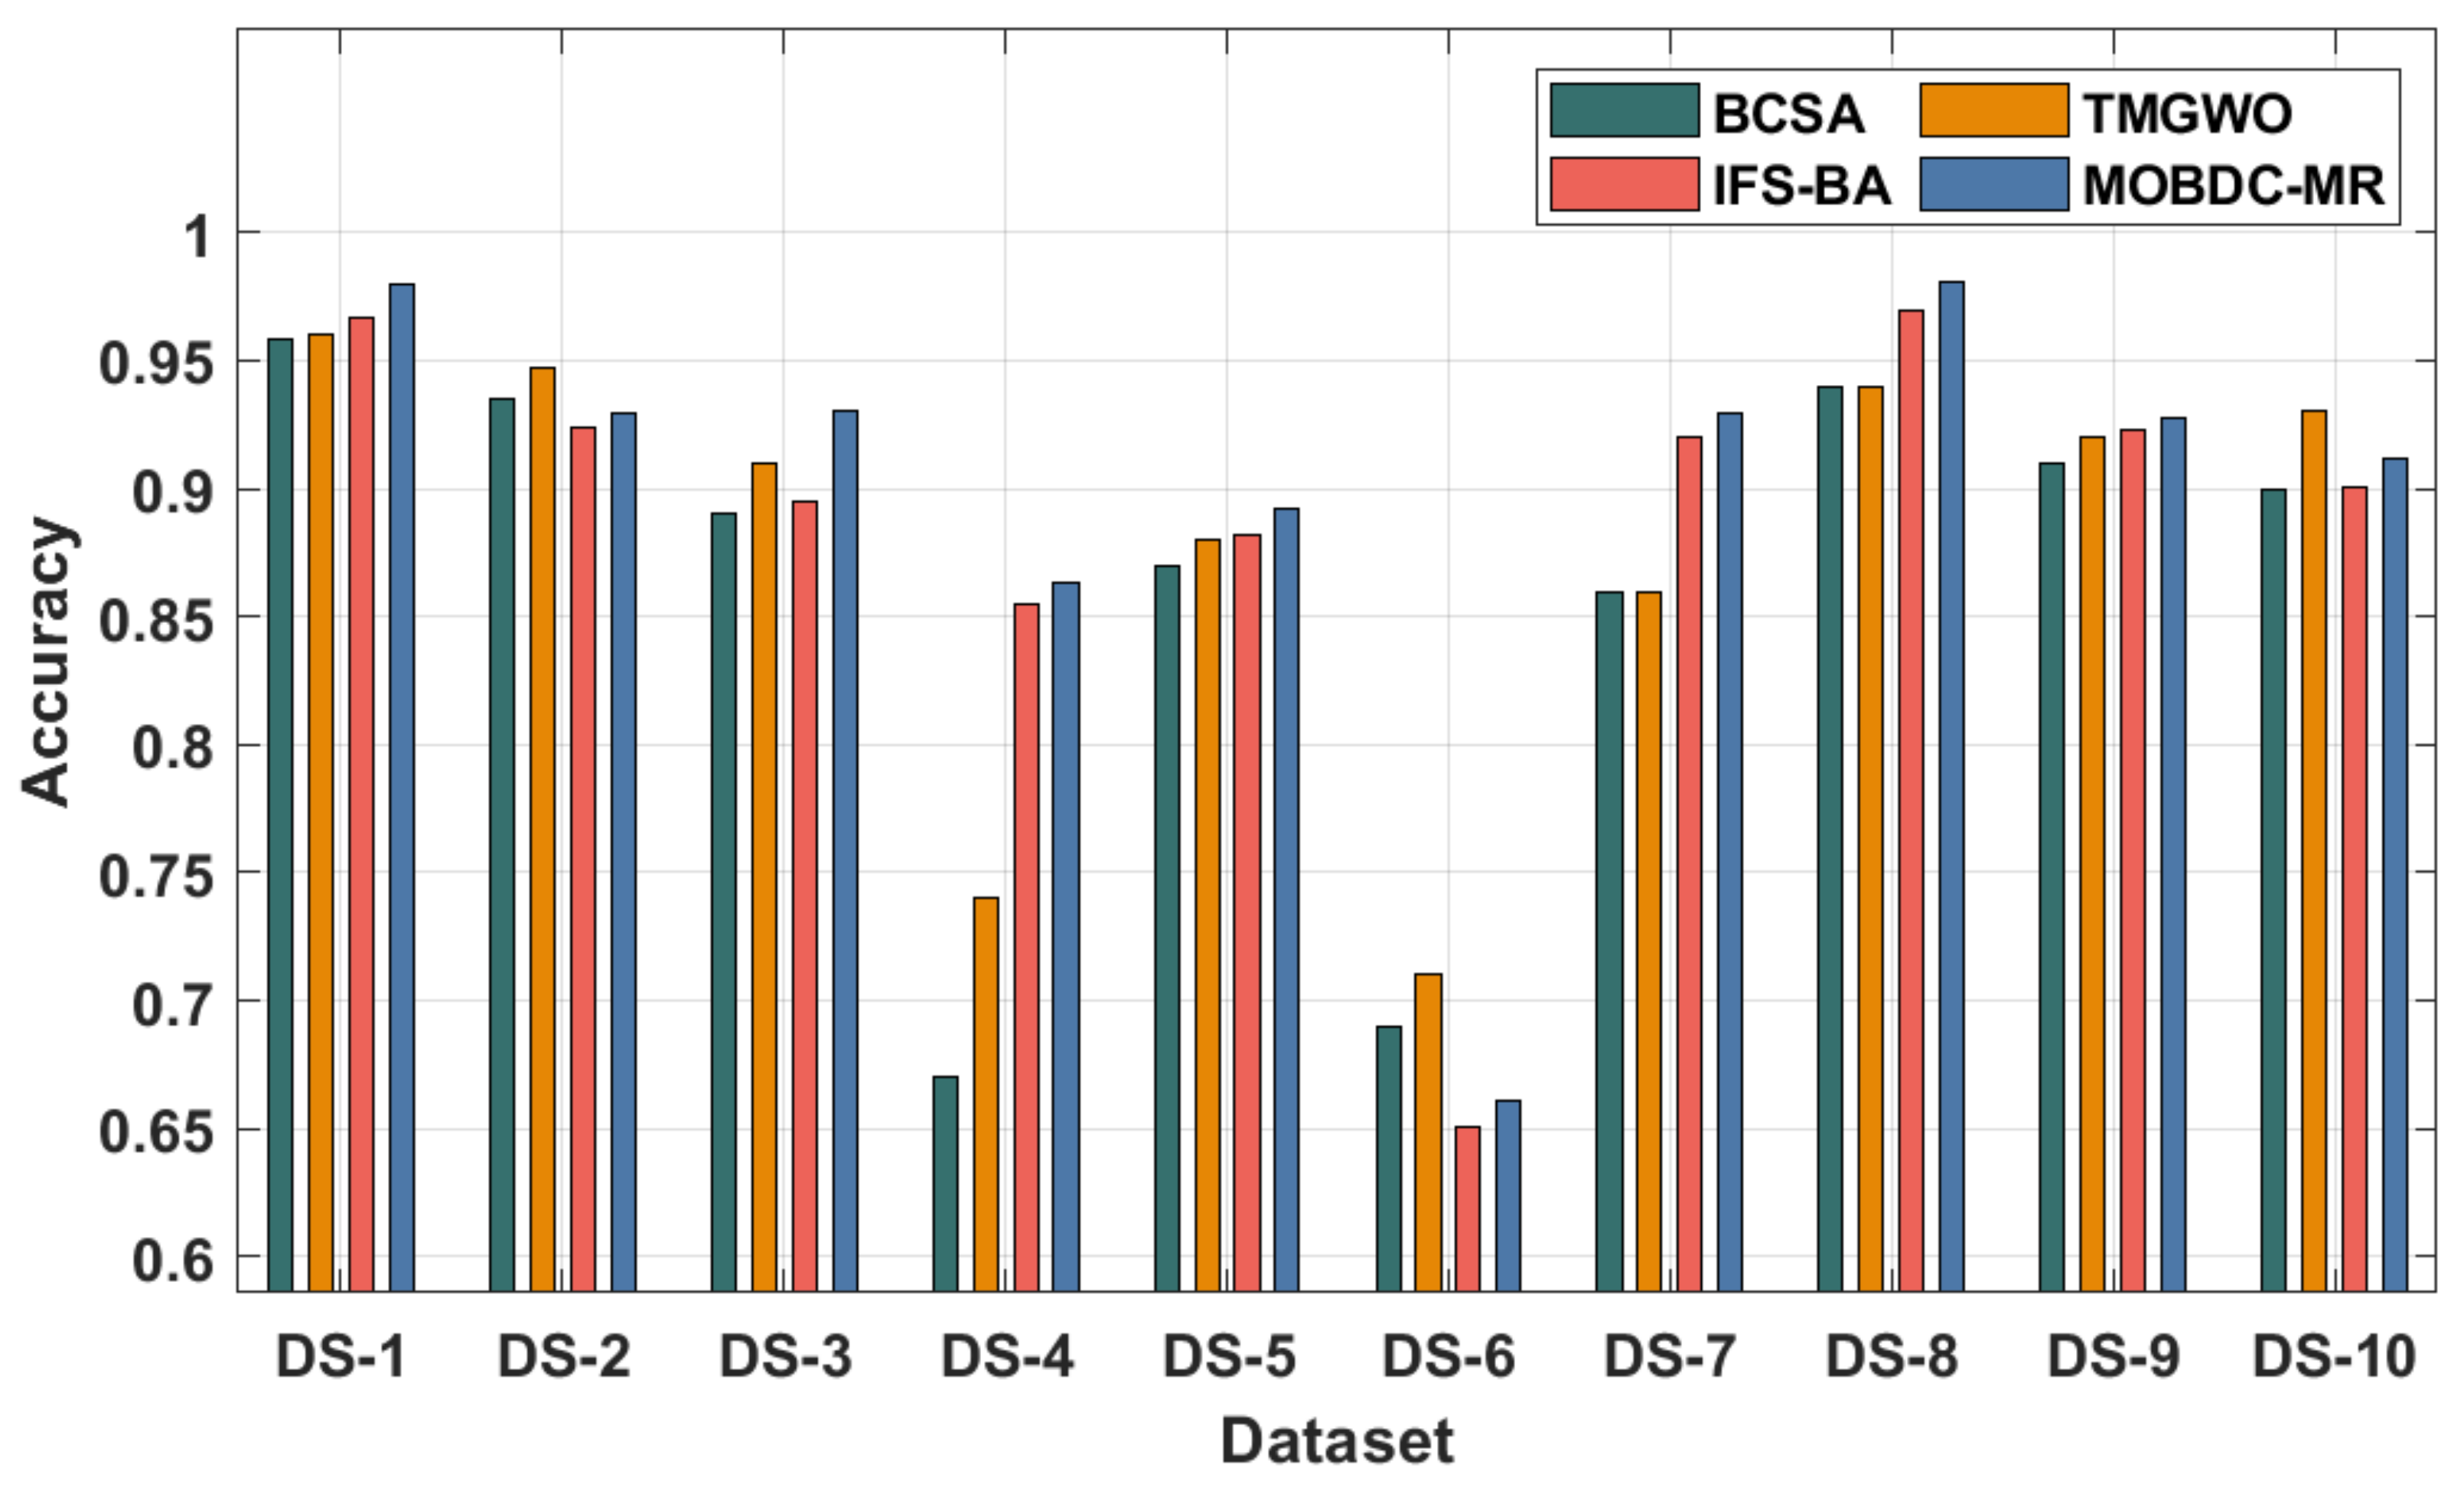
In order to ensure better performance of the MOBDC-MR technique, a comprehensive comparative results analysis with the binary crow search algorithm (BCA), tent map-based grey wolf optimization (TMGWO), and improved feature selection for Big Data analytics (IFS-BA) was performed, as shown in
Table 6 and
Figure 7. The experimental results highlight that the MOBDC-MR technique accomplished effectual outcomes with maximum overall accuracy compared to the other techniques. For instance, with dataset-1, the MOBDC-MR technique obtained an increased accuracy of 0.980, whereas the BCA, TMGWO, and IFS-BA techniques attained decreased accuracies of 0.958, 0.960, and 0.967, respectively. Similarly, with dataset-3, the MOBDC-MR approach gained a superior accuracy of 0.930, whereas the BCA, TMGWO, and IFS-BA algorithms attained decreased accuracies of 0.890, 0.910, and 0.895, respectively. Moreover, with dataset-5, the MOBDC-MR manner obtained an increased accuracy of 0.892, whereas the BCA, TMGWO, and IFS-BA approaches attained reduced accuracies of 0.870, 0.880, and 0.882. Lastly, with dataset-10, the MOBDC-MR technique attained an improved accuracy of 0.912, whereas the BCA, TMGWO, and IFS-BA methodologies gained lower accuracies of 0.900, 0.930, and 0.901, respectively.
By observing the detailed results analysis, it is apparent that the MOBDC-MR technique achieved accomplished maximum performance on the Big Data classification process compared to recent techniques.


 ,
, 


