
Developing Universally Applicable Service Quality Assessment Model Based on the Theory of Consumption Values, and Using Fuzzy Linguistic Preference Relations to Empirically Test Three Industries


Abstract
:1. Introduction
2. Literature Review
2.1. Service Quality Assessment Models
2.2. Theory of Consumption Values
2.3. Service Quality and Consumption Values
3. Research Method
3.1. Conceptualization of CV-SQ’s Potential Attributes
3.2. Use of the Modified Delphi Method to Confirm the Attributes of CV-SQ Aspects
3.3. Reliability and Validity
4. Empirical Testing of the CV-SQ Model by Using the Aviation Companies, Travel Agencies, and Hotels
4.1. Test the Consistency of the Universal Applicability of the CV-SQ Model
4.2. Fuzzy Linguistic Preference Relations (Fuzzy LinPreRa)
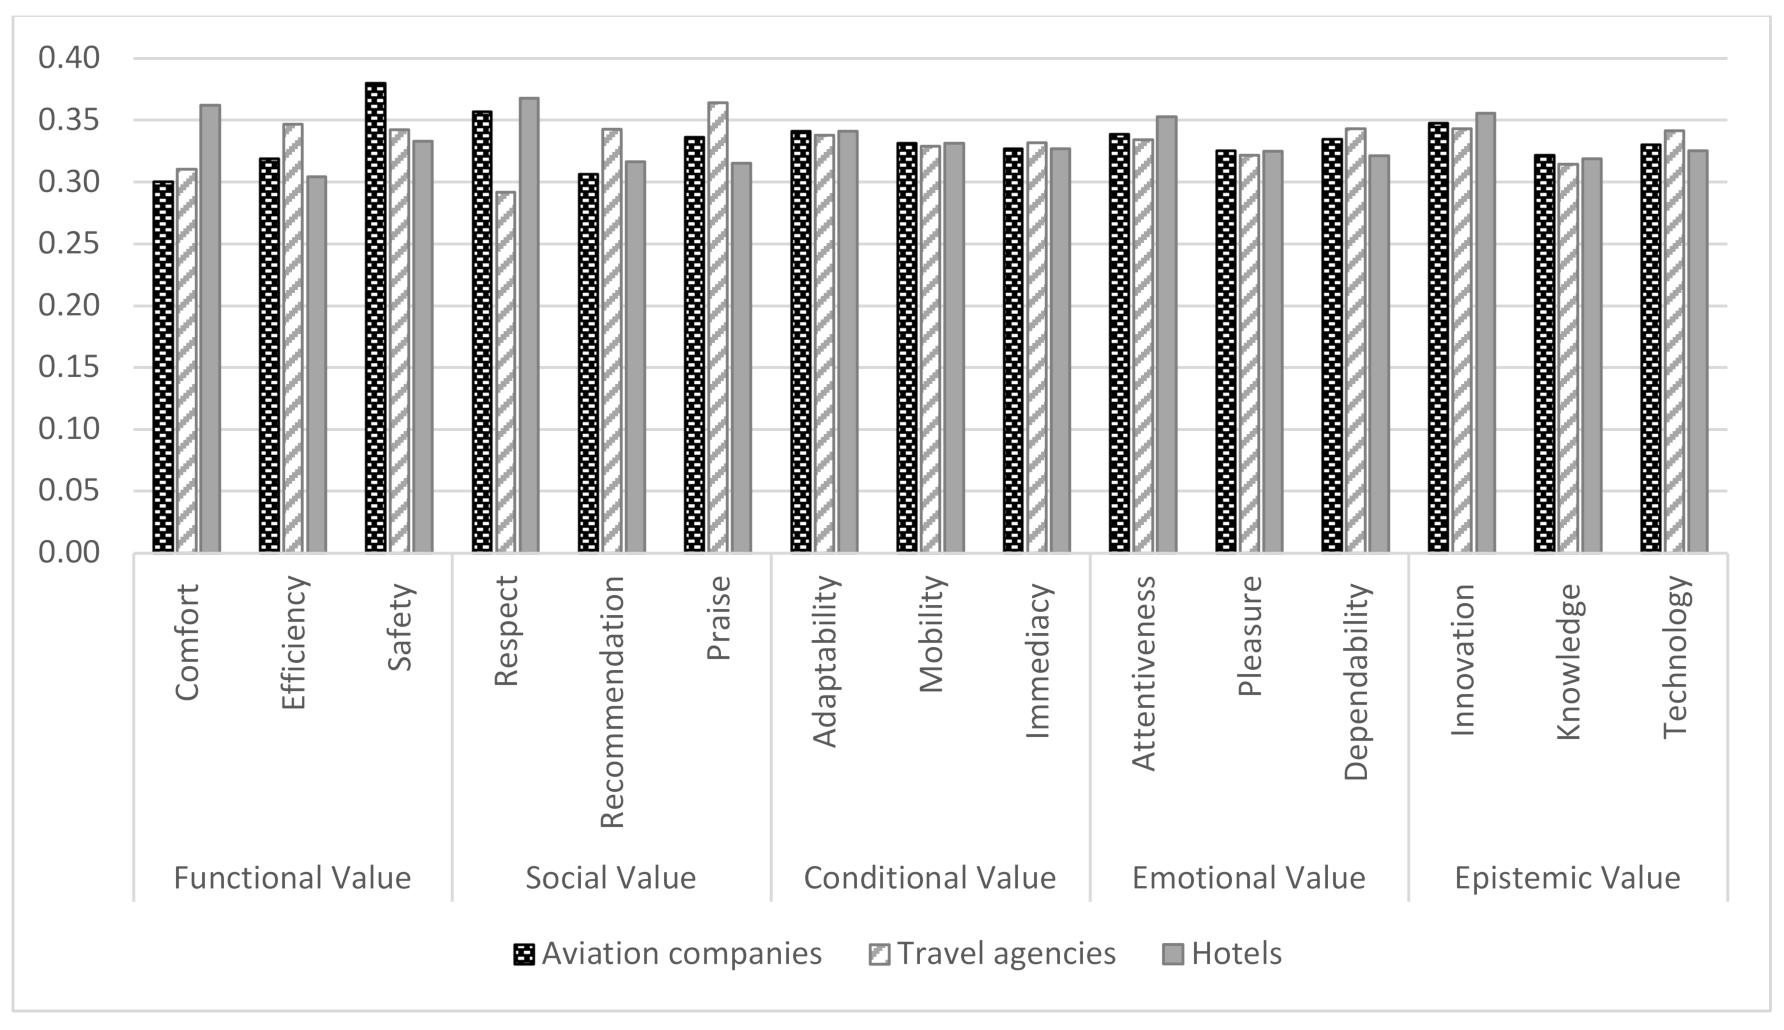
4.3. Analysis Most Important Key Factor of Service Quality
5. Conclusions and Recommendations
5.1. Discussion
5.2. Management Implications
5.3. Research Contributions
5.4. Recommendations for Future Research
Author Contributions
Funding
Institutional Review Board Statement
Informed Consent Statement
Data Availability Statement
Acknowledgments
Conflicts of Interest
Appendix A

| No. | Gender | Education | Years of Experience | Professional Background | Title |
|---|---|---|---|---|---|
| Industry | |||||
| 1 | M | Master’s | 19 | Customer complaint management, service quality improve management | Customer service manager |
| 2 | M | Bachelor’s | 13 | Innovation service project management, service quality improve project management | Project manager |
| 3 | F | Master’s | 23 | Service quality audit | Customer service senior manager |
| 4 | M | Master’s | 15 | Service quality management, | Customer service manager |
| 5 | M | Master’s | 20 | Customer relations management, services marketing management | Sales manager |
| 6 | F | Bachelor’s | 12 | Consumer behavior analysis, service quality management, | Customer service manager |
| 7 | M | Ph.D. | 27 | Organizational management, service quality management | General manager |
| Academia | |||||
| 8 | M | Ph.D. | 20 | Customer relations management, consumer behavior, service marketing strategies | Professor |
| 9 | M | Ph.D. | 18 | Service quality management, consumer behavior research | Associate prof. |
| 10 | F | Ph.D. | 17 | Marketing management, service quality management, MCDM | Professor |
| 11 | F | Ph.D. | 13 | Marketing management, business administration, customer relations management | Associate prof. |
| 12 | M | Ph.D. | 28 | Consumer behavior research, marketing management, multivariate analysis | Professor |
| 13 | F | Ph.D. | 22 | Marketing strategies, research methods, service quality management | Professor |
| 14 | M | Ph.D. | 25 | Service quality research, marketing management, MCDM | Professor |
| 15 | F | Ph.D. | 16 | Customer relations management, service quality management | Associate prof. |
Appendix B
| Function 4–11 | Functional Value | Social Value | Conditional Value | Emotional Value | Epistemic Value | ||||||||||
|---|---|---|---|---|---|---|---|---|---|---|---|---|---|---|---|
| Functional Value | 0.50 | 0.50 | 0.50 | 0.34 | 0.39 | 0.45 | 0.29 | 0.40 | 0.53 | 0.22 | 0.41 | 0.60 | 0.26 | 0.49 | 0.74 |
| Social Value | 0.55 | 0.61 | 0.66 | 0.50 | 0.50 | 0.50 | 0.45 | 0.51 | 0.58 | 0.38 | 0.52 | 0.65 | 0.42 | 0.61 | 0.79 |
| Conditional Value | 0.47 | 0.60 | 0.71 | 0.42 | 0.49 | 0.55 | 0.50 | 0.50 | 0.50 | 0.43 | 0.50 | 0.57 | 0.47 | 0.59 | 0.71 |
| Emotional Value | 0.40 | 0.59 | 0.78 | 0.35 | 0.48 | 0.62 | 0.43 | 0.50 | 0.57 | 0.50 | 0.50 | 0.50 | 0.54 | 0.59 | 0.64 |
| Epistemic Value | 0.26 | 0.51 | 0.74 | 0.21 | 0.39 | 0.58 | 0.29 | 0.41 | 0.53 | 0.36 | 0.41 | 0.46 | 0.50 | 0.50 | 0.50 |
| total | 2.18 | 2.81 | 3.39 | 1.83 | 2.25 | 2.70 | 1.96 | 2.32 | 2.71 | 1.89 | 2.34 | 2.78 | 2.19 | 2.78 | 3.37 |
| Function 4–12 | 0.44 | 0.56 | 0.68 | 0.37 | 0.45 | 0.54 | 0.39 | 0.46 | 0.54 | 0.38 | 0.47 | 0.56 | 0.44 | 0.56 | 0.67 |
| Function 4–13 | 0.22 | 0.22 | 0.23 | 0.18 | 0.18 | 0.18 | 0.20 | 0.19 | 0.18 | 0.19 | 0.19 | 0.19 | 0.22 | 0.22 | 0.23 |
| Function 4–14 | 0.2228 | 0.1809 | 0.1874 | 0.1872 | 0.2217 | ||||||||||
| rank | 1 | 5 | 3 | 4 | 2 | ||||||||||
| Function 4–11 | Comfort | Efficiency | Safety | ||||||
|---|---|---|---|---|---|---|---|---|---|
| Comfort | 0.50 | 0.50 | 0.50 | 0.47 | 0.53 | 0.58 | 0.51 | 0.63 | 0.72 |
| Efficiency | 0.42 | 0.47 | 0.53 | 0.50 | 0.50 | 0.50 | 0.54 | 0.60 | 0.64 |
| Safety | 0.28 | 0.37 | 0.49 | 0.36 | 0.40 | 0.46 | 0.50 | 0.50 | 0.50 |
| total | 1.21 | 1.34 | 1.51 | 1.34 | 1.43 | 1.54 | 1.55 | 1.72 | 1.85 |
| Function 4–12 | 0.40 | 0.45 | 0.50 | 0.45 | 0.48 | 0.51 | 0.52 | 0.57 | 0.62 |
| Function 4–13 | 0.29 | 0.30 | 0.31 | 0.33 | 0.32 | 0.31 | 0.38 | 0.38 | 0.38 |
| Function 4–14 | 0.3005 | 0.3194 | 0.3800 | ||||||
| rank | 3 | 2 | 1 | ||||||
| Function 4–11 | Respect | Recommendation | Praise | ||||||
|---|---|---|---|---|---|---|---|---|---|
| Respect | 0.50 | 0.50 | 0.50 | 0.38 | 0.42 | 0.47 | 0.37 | 0.47 | 0.57 |
| Recommendation | 0.53 | 0.58 | 0.62 | 0.50 | 0.50 | 0.50 | 0.48 | 0.55 | 0.60 |
| Praise | 0.43 | 0.53 | 0.63 | 0.40 | 0.45 | 0.52 | 0.50 | 0.50 | 0.50 |
| total | 1.47 | 1.60 | 1.75 | 1.28 | 1.37 | 1.48 | 1.35 | 1.53 | 1.67 |
| Function 4–12 | 0.49 | 0.53 | 0.58 | 0.43 | 0.46 | 0.49 | 0.45 | 0.51 | 0.56 |
| Function 4–13 | 0.36 | 0.36 | 0.36 | 0.31 | 0.30 | 0.30 | 0.33 | 0.34 | 0.34 |
| Function 4–14 | 0.3571 | 0.3065 | 0.3364 | ||||||
| rank | 1 | 3 | 2 | ||||||
| Function 4–11 | Adaptability | Mobility | Immediacy | ||||||
|---|---|---|---|---|---|---|---|---|---|
| Adaptability | 0.50 | 0.50 | 0.50 | 0.43 | 0.48 | 0.54 | 0.37 | 0.48 | 0.59 |
| Mobility | 0.46 | 0.52 | 0.57 | 0.50 | 0.50 | 0.50 | 0.44 | 0.49 | 0.56 |
| Immediacy | 0.41 | 0.52 | 0.63 | 0.44 | 0.51 | 0.56 | 0.50 | 0.50 | 0.50 |
| total | 1.37 | 1.54 | 1.70 | 1.37 | 1.49 | 1.60 | 1.30 | 1.47 | 1.65 |
| Function 4–12 | 0.46 | 0.51 | 0.57 | 0.46 | 0.50 | 0.53 | 0.43 | 0.49 | 0.55 |
| Function 4–13 | 0.34 | 0.34 | 0.34 | 0.34 | 0.33 | 0.32 | 0.32 | 0.33 | 0.33 |
| Function 4–14 | 0.3414 | 0.3314 | 0.3272 | ||||||
| rank | 1 | 2 | 3 | ||||||
| Function 4–11 | Attentiveness | Pleasure | Dependability | ||||||
|---|---|---|---|---|---|---|---|---|---|
| Attentiveness | 0.50 | 0.50 | 0.50 | 0.43 | 0.47 | 0.54 | 0.39 | 0.49 | 0.61 |
| Pleasure | 0.46 | 0.53 | 0.57 | 0.50 | 0.50 | 0.50 | 0.46 | 0.51 | 0.57 |
| Dependability | 0.39 | 0.51 | 0.61 | 0.43 | 0.49 | 0.54 | 0.50 | 0.50 | 0.50 |
| total | 1.36 | 1.54 | 1.69 | 1.36 | 1.46 | 1.58 | 1.34 | 1.50 | 1.68 |
| Function 4–12 | 0.45 | 0.51 | 0.56 | 0.45 | 0.49 | 0.53 | 0.45 | 0.50 | 0.56 |
| Function 4–13 | 0.33 | 0.34 | 0.34 | 0.33 | 0.32 | 0.32 | 0.33 | 0.33 | 0.34 |
| Function 4–14 | 0.3393 | 0.3260 | 0.3348 | ||||||
| rank | 1 | 3 | 2 | ||||||
| Function 4–11 | Innovation | Knowledge | Technology | ||||||
|---|---|---|---|---|---|---|---|---|---|
| Innovation | 0.50 | 0.50 | 0.50 | 0.41 | 0.45 | 0.51 | 0.37 | 0.47 | 0.58 |
| Knowledge | 0.49 | 0.55 | 0.59 | 0.50 | 0.50 | 0.50 | 0.46 | 0.52 | 0.56 |
| Technology | 0.42 | 0.53 | 0.63 | 0.44 | 0.48 | 0.54 | 0.50 | 0.50 | 0.50 |
| total | 1.41 | 1.57 | 1.72 | 1.35 | 1.44 | 1.55 | 1.33 | 1.49 | 1.64 |
| Function 4–12 | 0.47 | 0.52 | 0.57 | 0.45 | 0.48 | 0.52 | 0.44 | 0.50 | 0.55 |
| Function 4–13 | 0.34 | 0.35 | 0.35 | 0.33 | 0.32 | 0.32 | 0.33 | 0.33 | 0.33 |
| Function 4–14 | 0.3479 | 0.3219 | 0.3302 | ||||||
| rank | 1 | 3 | 2 | ||||||
Appendix C
| Function 4–11 | Functional Value | Social Value | Conditional Value | Emotional Value | Epistemic Value | ||||||||||
|---|---|---|---|---|---|---|---|---|---|---|---|---|---|---|---|
| Functional Value | 0.50 | 0.50 | 0.50 | 0.40 | 0.45 | 0.51 | 0.37 | 0.50 | 0.61 | 0.37 | 0.55 | 0.71 | 0.32 | 0.55 | 0.78 |
| Social Value | 0.49 | 0.55 | 0.60 | 0.50 | 0.50 | 0.50 | 0.47 | 0.55 | 0.60 | 0.46 | 0.60 | 0.70 | 0.42 | 0.61 | 0.78 |
| Conditional Value | 0.39 | 0.50 | 0.63 | 0.40 | 0.45 | 0.53 | 0.50 | 0.50 | 0.50 | 0.49 | 0.55 | 0.60 | 0.45 | 0.56 | 0.67 |
| Emotional Value | 0.29 | 0.45 | 0.63 | 0.30 | 0.40 | 0.54 | 0.40 | 0.45 | 0.51 | 0.50 | 0.50 | 0.50 | 0.45 | 0.51 | 0.57 |
| Epistemic Value | 0.22 | 0.45 | 0.68 | 0.22 | 0.39 | 0.58 | 0.33 | 0.44 | 0.55 | 0.43 | 0.49 | 0.55 | 0.50 | 0.50 | 0.50 |
| total | 1.88 | 2.45 | 3.04 | 1.82 | 2.20 | 2.66 | 2.07 | 2.43 | 2.77 | 2.25 | 2.69 | 3.06 | 2.14 | 2.73 | 3.31 |
| Function 4–12 | 0.38 | 0.49 | 0.61 | 0.36 | 0.44 | 0.53 | 0.41 | 0.49 | 0.55 | 0.45 | 0.54 | 0.61 | 0.43 | 0.55 | 0.66 |
| Function 4–13 | 0.19 | 0.20 | 0.21 | 0.18 | 0.18 | 0.18 | 0.20 | 0.19 | 0.19 | 0.22 | 0.21 | 0.21 | 0.21 | 0.22 | 0.22 |
| Function 4–14 | 0.1956 | 0.1782 | 0.1951 | 0.2141 | 0.2171 | ||||||||||
| rank | 3 | 5 | 4 | 2 | 1 | ||||||||||
| Function 4–11 | Comfort | Efficiency | Safety | ||||||
|---|---|---|---|---|---|---|---|---|---|
| Comfort | 0.50 | 0.50 | 0.50 | 0.50 | 0.56 | 0.60 | 0.45 | 0.55 | 0.64 |
| Efficiency | 0.40 | 0.44 | 0.50 | 0.50 | 0.50 | 0.50 | 0.45 | 0.50 | 0.54 |
| Safety | 0.36 | 0.45 | 0.55 | 0.46 | 0.50 | 0.55 | 0.50 | 0.50 | 0.50 |
| total | 1.26 | 1.39 | 1.55 | 1.46 | 1.56 | 1.66 | 1.39 | 1.55 | 1.68 |
| Function 4–12 | 0.42 | 0.46 | 0.52 | 0.49 | 0.52 | 0.55 | 0.46 | 0.52 | 0.56 |
| Function 4–13 | 0.31 | 0.31 | 0.32 | 0.36 | 0.35 | 0.34 | 0.34 | 0.34 | 0.34 |
| Function 4–14 | 0.3107 | 0.3470 | 0.3424 | ||||||
| rank | 3 | 1 | 2 | ||||||
| Function 4–11 | Respect | Recommendation | Praise | ||||||
|---|---|---|---|---|---|---|---|---|---|
| Respect | 0.50 | 0.50 | 0.50 | 0.53 | 0.58 | 0.62 | 0.50 | 0.62 | 0.71 |
| Recommendation | 0.38 | 0.42 | 0.47 | 0.50 | 0.50 | 0.50 | 0.47 | 0.54 | 0.59 |
| Praise | 0.29 | 0.38 | 0.50 | 0.41 | 0.46 | 0.53 | 0.50 | 0.50 | 0.50 |
| total | 1.17 | 1.31 | 1.47 | 1.44 | 1.54 | 1.65 | 1.47 | 1.66 | 1.80 |
| Function 4–12 | 0.39 | 0.44 | 0.49 | 0.48 | 0.51 | 0.55 | 0.49 | 0.55 | 0.60 |
| Function 4–13 | 0.29 | 0.29 | 0.30 | 0.35 | 0.34 | 0.34 | 0.36 | 0.37 | 0.37 |
| Function 4–14 | 0.2921 | 0.3431 | 0.3648 | ||||||
| rank | 3 | 2 | 1 | ||||||
| Function 4–11 | Adaptability | Mobility | Immediacy | ||||||
|---|---|---|---|---|---|---|---|---|---|
| Adaptability | 0.50 | 0.50 | 0.50 | 0.43 | 0.49 | 0.54 | 0.38 | 0.49 | 0.61 |
| Mobility | 0.46 | 0.51 | 0.57 | 0.50 | 0.50 | 0.50 | 0.44 | 0.50 | 0.57 |
| Immediacy | 0.39 | 0.51 | 0.62 | 0.43 | 0.50 | 0.56 | 0.50 | 0.50 | 0.50 |
| total | 1.36 | 1.52 | 1.69 | 1.36 | 1.48 | 1.59 | 1.32 | 1.50 | 1.68 |
| Function 4–12 | 0.45 | 0.51 | 0.56 | 0.45 | 0.49 | 0.53 | 0.44 | 0.50 | 0.56 |
| Function 4–13 | 0.34 | 0.34 | 0.34 | 0.34 | 0.33 | 0.32 | 0.33 | 0.33 | 0.34 |
| Function 4–14 | 0.3382 | 0.3293 | 0.3324 | ||||||
| rank | 1 | 3 | 2 | ||||||
| Function 4–11 | Attentiveness | Pleasure | Dependability | ||||||
|---|---|---|---|---|---|---|---|---|---|
| Attentiveness | 0.50 | 0.50 | 0.50 | 0.43 | 0.48 | 0.54 | 0.40 | 0.51 | 0.63 |
| Pleasure | 0.46 | 0.52 | 0.57 | 0.50 | 0.50 | 0.50 | 0.48 | 0.53 | 0.59 |
| Dependability | 0.37 | 0.49 | 0.60 | 0.41 | 0.47 | 0.52 | 0.50 | 0.50 | 0.50 |
| total | 1.33 | 1.52 | 1.67 | 1.34 | 1.44 | 1.56 | 1.38 | 1.54 | 1.71 |
| Function 4–12 | 0.44 | 0.51 | 0.56 | 0.45 | 0.48 | 0.52 | 0.46 | 0.51 | 0.57 |
| Function 4–13 | 0.33 | 0.34 | 0.34 | 0.33 | 0.32 | 0.32 | 0.34 | 0.34 | 0.35 |
| Function 4–14 | 0.3345 | 0.3221 | 0.3434 | ||||||
| rank | 2 | 3 | 1 | ||||||
| Function 4–11 | Innovation | Knowledge | Technology | ||||||
|---|---|---|---|---|---|---|---|---|---|
| Innovation | 0.50 | 0.50 | 0.50 | 0.41 | 0.45 | 0.51 | 0.40 | 0.50 | 0.60 |
| Knowledge | 0.49 | 0.55 | 0.59 | 0.50 | 0.50 | 0.50 | 0.49 | 0.55 | 0.59 |
| Technology | 0.40 | 0.50 | 0.60 | 0.41 | 0.45 | 0.51 | 0.50 | 0.50 | 0.50 |
| total | 1.39 | 1.55 | 1.69 | 1.32 | 1.41 | 1.52 | 1.39 | 1.54 | 1.68 |
| Function 4–12 | 0.46 | 0.52 | 0.56 | 0.44 | 0.47 | 0.51 | 0.46 | 0.51 | 0.56 |
| Function 4–13 | 0.34 | 0.35 | 0.35 | 0.32 | 0.31 | 0.31 | 0.34 | 0.34 | 0.34 |
| Function 4–14 | 0.3435 | 0.3148 | 0.3417 | ||||||
| rank | 1 | 3 | 2 | ||||||
Appendix D
| Function 4–11 | Functional Value | Social Value | Conditional Value | Emotional Value | Epistemic Value | ||||||||||
|---|---|---|---|---|---|---|---|---|---|---|---|---|---|---|---|
| Functional Value | 0.50 | 0.50 | 0.50 | 0.35 | 0.39 | 0.44 | 0.26 | 0.38 | 0.51 | 0.30 | 0.48 | 0.65 | 0.25 | 0.49 | 0.73 |
| Social Value | 0.56 | 0.61 | 0.65 | 0.50 | 0.50 | 0.50 | 0.42 | 0.49 | 0.56 | 0.45 | 0.59 | 0.71 | 0.40 | 0.60 | 0.78 |
| Conditional Value | 0.49 | 0.62 | 0.74 | 0.44 | 0.51 | 0.58 | 0.50 | 0.50 | 0.50 | 0.54 | 0.60 | 0.65 | 0.49 | 0.61 | 0.72 |
| Emotional Value | 0.35 | 0.52 | 0.70 | 0.29 | 0.41 | 0.55 | 0.35 | 0.40 | 0.46 | 0.50 | 0.50 | 0.50 | 0.45 | 0.51 | 0.58 |
| Epistemic Value | 0.27 | 0.51 | 0.75 | 0.22 | 0.40 | 0.60 | 0.28 | 0.39 | 0.51 | 0.42 | 0.49 | 0.55 | 0.50 | 0.50 | 0.50 |
| total | 2.17 | 2.76 | 3.35 | 1.79 | 2.20 | 2.67 | 1.81 | 2.17 | 2.55 | 2.21 | 2.67 | 3.06 | 2.08 | 2.70 | 3.31 |
| Function 4–12 | 0.43 | 0.55 | 0.67 | 0.36 | 0.44 | 0.53 | 0.36 | 0.43 | 0.51 | 0.44 | 0.53 | 0.61 | 0.42 | 0.54 | 0.66 |
| Function 4–13 | 0.22 | 0.22 | 0.22 | 0.18 | 0.18 | 0.18 | 0.18 | 0.17 | 0.17 | 0.22 | 0.21 | 0.20 | 0.21 | 0.22 | 0.22 |
| Function 4–14 | 0.2201 | 0.1776 | 0.1747 | 0.2126 | 0.2149 | ||||||||||
| rank | 1 | 4 | 5 | 3 | 2 | ||||||||||
| Function 4–11 | Comfort | Efficiency | Safety | ||||||
|---|---|---|---|---|---|---|---|---|---|
| Comfort | 0.50 | 0.50 | 0.50 | 0.37 | 0.41 | 0.46 | 0.36 | 0.46 | 0.55 |
| Efficiency | 0.54 | 0.59 | 0.63 | 0.50 | 0.50 | 0.50 | 0.48 | 0.55 | 0.60 |
| Safety | 0.45 | 0.54 | 0.64 | 0.40 | 0.45 | 0.52 | 0.50 | 0.50 | 0.50 |
| total | 1.49 | 1.63 | 1.77 | 1.28 | 1.36 | 1.47 | 1.34 | 1.51 | 1.65 |
| Function 4–12 | 0.50 | 0.54 | 0.59 | 0.43 | 0.45 | 0.49 | 0.45 | 0.50 | 0.55 |
| Function 4–13 | 0.36 | 0.36 | 0.36 | 0.31 | 0.30 | 0.30 | 0.33 | 0.34 | 0.34 |
| Function 4–14 | 0.3621 | 0.3044 | 0.3334 | ||||||
| rank | 1 | 3 | 2 | ||||||
| Function 4–11 | Respect | Recommendation | Praise | ||||||
|---|---|---|---|---|---|---|---|---|---|
| Respect | 0.50 | 0.50 | 0.50 | 0.38 | 0.42 | 0.47 | 0.32 | 0.43 | 0.52 |
| Recommendation | 0.53 | 0.58 | 0.62 | 0.50 | 0.50 | 0.50 | 0.44 | 0.51 | 0.55 |
| Praise | 0.48 | 0.57 | 0.68 | 0.45 | 0.49 | 0.56 | 0.50 | 0.50 | 0.50 |
| total | 1.52 | 1.66 | 1.80 | 1.33 | 1.41 | 1.53 | 1.26 | 1.43 | 1.57 |
| Function 4–12 | 0.51 | 0.55 | 0.60 | 0.44 | 0.47 | 0.51 | 0.42 | 0.48 | 0.52 |
| Function 4–13 | 0.37 | 0.37 | 0.37 | 0.32 | 0.31 | 0.31 | 0.31 | 0.32 | 0.32 |
| Function 4–14 | 0.3681 | 0.3165 | 0.3154 | ||||||
| rank | 1 | 2 | 3 | ||||||
| Function 4–11 | Adaptability | Mobility | Immediacy | ||||||
|---|---|---|---|---|---|---|---|---|---|
| Adaptability | 0.50 | 0.50 | 0.50 | 0.43 | 0.48 | 0.54 | 0.37 | 0.48 | 0.59 |
| Mobility | 0.46 | 0.52 | 0.57 | 0.50 | 0.50 | 0.50 | 0.44 | 0.49 | 0.56 |
| Immediacy | 0.41 | 0.52 | 0.63 | 0.44 | 0.51 | 0.56 | 0.50 | 0.50 | 0.50 |
| total | 1.37 | 1.54 | 1.70 | 1.37 | 1.49 | 1.60 | 1.30 | 1.47 | 1.65 |
| Function 4–12 | 0.46 | 0.51 | 0.57 | 0.46 | 0.50 | 0.53 | 0.43 | 0.49 | 0.55 |
| Function 4–13 | 0.34 | 0.34 | 0.34 | 0.34 | 0.33 | 0.32 | 0.32 | 0.33 | 0.33 |
| Function 4–14 | 0.3414 | 0.3314 | 0.3272 | ||||||
| rank | 1 | 2 | 3 | ||||||
| Function 4–11 | Attentiveness | Pleasure | Dependability | ||||||
|---|---|---|---|---|---|---|---|---|---|
| Attentiveness | 0.50 | 0.50 | 0.50 | 0.41 | 0.45 | 0.51 | 0.35 | 0.45 | 0.56 |
| Pleasure | 0.49 | 0.55 | 0.59 | 0.50 | 0.50 | 0.50 | 0.44 | 0.50 | 0.55 |
| Dependability | 0.44 | 0.55 | 0.65 | 0.45 | 0.50 | 0.56 | 0.50 | 0.50 | 0.50 |
| total | 1.42 | 1.60 | 1.75 | 1.35 | 1.46 | 1.57 | 1.29 | 1.44 | 1.62 |
| Function 4–12 | 0.47 | 0.53 | 0.58 | 0.45 | 0.49 | 0.52 | 0.43 | 0.48 | 0.54 |
| Function 4–13 | 0.35 | 0.36 | 0.35 | 0.33 | 0.32 | 0.32 | 0.32 | 0.32 | 0.33 |
| Function 4–14 | 0.3531 | 0.3251 | 0.3217 | ||||||
| rank | 1 | 2 | 3 | ||||||
| Function 4–11 | Innovation | Knowledge | Technology | ||||||
|---|---|---|---|---|---|---|---|---|---|
| Innovation | 0.50 | 0.50 | 0.50 | 0.40 | 0.44 | 0.49 | 0.36 | 0.45 | 0.55 |
| Knowledge | 0.51 | 0.56 | 0.60 | 0.50 | 0.50 | 0.50 | 0.46 | 0.51 | 0.56 |
| Technology | 0.45 | 0.55 | 0.64 | 0.44 | 0.49 | 0.54 | 0.50 | 0.50 | 0.50 |
| total | 1.45 | 1.61 | 1.74 | 1.34 | 1.43 | 1.53 | 1.32 | 1.47 | 1.61 |
| Function 4–12 | 0.48 | 0.54 | 0.58 | 0.45 | 0.48 | 0.51 | 0.44 | 0.49 | 0.54 |
| Function 4–13 | 0.35 | 0.36 | 0.36 | 0.33 | 0.32 | 0.31 | 0.32 | 0.33 | 0.33 |
| Function 4–14 | 0.3558 | 0.3189 | 0.3254 | ||||||
| rank | 1 | 3 | 2 | ||||||
References
- Stevic, Z.; Tanackov, I.; Puska, A.; Jovanov, G.; Vasiljevic, J.; Lojanicic, D. Development of Modified SERVQUAL-MCDM Model for Quality Determination in Reverse Logistics. Sustainability 2021, 13, 5734. [Google Scholar] [CrossRef]
- Agrawal, V.; Seth, N.; Dixit, J.K. A Combined AHP–TOPSIS–DEMATEL Approach for Evaluating Success Factors of E-Service Quality: An Experience from Indian Banking Industry. Electron. Commer. Res. 2020, 1–33. [Google Scholar] [CrossRef]
- Huang, S.L.; Kuo, M.Y. Critical success factors in the sharing economy: A customer perspective. Serv. Bus. 2020, 14, 553–576. [Google Scholar] [CrossRef]
- Belanche, D.; Casalo, L.V.; Flavian, C.; Perez-Rueda, A. The role of customers in the gig economy: How perceptions of working conditions and service quality influence the use and recommendation of food delivery services. Serv. Bus. 2021, 15, 45–75. [Google Scholar] [CrossRef]
- Bandyopadhyay, N. Classification of service quality attributes using Kano’s model: A study in the context of the Indian banking sector. Int. J. Bank Mark. 2015, 33, 457–470. [Google Scholar] [CrossRef]
- Cronin, J.J., Jr.; Taylor, S.A. Measuring service quality: A reexamination and extension. J. Mark. 1992, 56, 55–68. [Google Scholar] [CrossRef]
- Omar, S.; Mohsen, K.; Tsimonis, G.; Oozeerally, A.; Hsu, J.H. M-commerce: The nexus between mobile shopping service quality and loyalty. J. Retail. Consum. Serv. 2021, 60, 102468. [Google Scholar] [CrossRef]
- Rodriguez, P.G.; Villarreal, R.; Valino, P.C.; Blozis, S. A PLS-SEM approach to understanding E-SQ, E-Satisfaction and E-Loyalty for fashion E-Retailers in Spain. J. Retail. Consum. Serv. 2020, 57, 102201. [Google Scholar] [CrossRef]
- Zeithaml, V.A.; Berry, L.L.; Parasuraman, A. The behavioral consequences of service quality. J. Mark. 1996, 60, 31–46. [Google Scholar] [CrossRef]
- Pamucar, D.; Yazdani, M.; Montero-Simo, M.J.; Araque-Padilla, R.A.; Mohammed, A. Multi-criteria decision analysis towards robust service quality measurement. Expert Syst. Appl. 2021, 170, 114508. [Google Scholar] [CrossRef]
- Calabrese, A.; Scoglio, F. Reframing the past: A new approach in service quality assessment. Total. Qual. Manag. Bus. Excell. 2012, 23, 1329–1343. [Google Scholar] [CrossRef]
- Parasuraman, A.; Zeithaml, V.A.; Berry, L.L. Servqual: A multiple-item scale for measuring consumer perc. J. Retail. 1988, 64, 12. [Google Scholar]
- Behdioğlu, S.; Acar, E.; Burhan, H.A. Evaluating service quality by fuzzy SERVQUAL: A case study in a physiotherapy and rehabilitation hospital. Total. Qual. Manag. Bus. Excell. 2019, 30, 301–319. [Google Scholar] [CrossRef]
- Mirzaei, A.; Carter, S.R.; Chen, J.Y.; Rittsteuer, C.; Schneider, C.R. Development of a questionnaire to measure consumers’ perceptions of service quality in community pharmacies. Res. Soc. Adm. Pharm. 2019, 15, 346–357. [Google Scholar] [CrossRef] [PubMed]
- Chen, J.K. An integrated fuzzy MICMAC with a revised IPA approach to explore service quality improvement. Total Qual. Manag. Bus. Excell. 2020, 31, 1487–1505. [Google Scholar] [CrossRef]
- Carman, J.M. Consumer perceptions of service quality: An assessment of T. J. Retail. 1990, 66, 33. [Google Scholar]
- Nel, D.; Boshoff, C.; Mels, G. An empirical assessment of the extended service quality model. S. Afr. J. Bus. Manag. 1997, 28, 42–52. [Google Scholar] [CrossRef]
- Cronin, J.J., Jr.; Taylor, S.A. SERVPERF versus SERVQUAL: Reconciling performance-based and perceptions-minus-expectations measurement of service quality. J. Mark. 1994, 58, 125–131. [Google Scholar] [CrossRef]
- Boakye, K.G.; Natesan, P.; Prybutok, V.R. A correlated uniqueness model of service quality measurement among users of cloud-based service platforms. J. Retail. Consum. Serv. 2020, 55, 102098. [Google Scholar] [CrossRef]
- Devesh, S. Service quality dimensions and customer satisfaction: Empirical evidence from retail banking sector in Oman. Total Qual. Manag. Bus. Excell. 2019, 30, 1616–1629. [Google Scholar]
- Gounaris, S. An alternative measure for assessing perceived quality of software house services. Serv. Ind. J. 2005, 25, 803–823. [Google Scholar] [CrossRef]
- Sureshchandar, G.S.; Rajendran, C.; Kamalanabhan, T.J. Customer perceptions of service quality: A critique. Total Qual. Manag. 2001, 12, 111–124. [Google Scholar] [CrossRef]
- Ali, M.; Raza, S.A. Service quality perception and customer satisfaction in Islamic banks of Pakistan: The modified SERVQUAL model. Total Qual. Manag. Bus. Excell. 2017, 28, 559–577. [Google Scholar] [CrossRef]
- Ahmed, R.R.; Vveinhardt, J.; Štreimikienė, D.; Ashraf, M.; Channar, Z.A. Modified SERVQUAL model and effects of customer attitude and technology on customer satisfaction in banking industry: Mediation, moderation and conditional process analysis. J. Bus. Econ. Manag. 2017, 18, 974–1004. [Google Scholar] [CrossRef] [Green Version]
- Prentkovskis, O.; Erceg, Ž.; Stević, Ž.; Tanackov, I.; Vasiljević, M.; Gavranović, M. A new methodology for improving service quality measurement: Delphi-FUCOM-SERVQUAL model. Symmetry 2018, 10, 757. [Google Scholar] [CrossRef] [Green Version]
- Shang, M.; Li, H.; Lee, C.; Shin, Y. To strengthen the relationship and the long term trading orientation between the relationship quality and the B-SERVQUAL: Focus on the logistics intelligent equipment manufacturing industry. J. Ambient Intell. Humaniz. Comput. 2020, 11, 635–646. [Google Scholar] [CrossRef]
- Büyüközkan, G.; Havle, C.A.; Feyzioğlu, O.; Göçer, F. A combined group decision making based IFCM and SERVQUAL approach for strategic analysis of airline service quality. J. Intell. Fuzzy Syst. 2020, 38, 859–872. [Google Scholar] [CrossRef]
- Ocampo, L.; Alinsub, J.; Casul, R.A.; Enquig, G.; Luar, M.; Panuncillon, N.; Bongo, M.; Ocampo, C.O. Public service quality evaluation with SERVQUAL and AHP-TOPSIS: A case of Philippine government agencies. Socio-Econ. Plan. Sci. 2019, 68, 100604. [Google Scholar] [CrossRef]
- Asiamah, N.; Opuni, F.F.; Aggrey, M.; Adu-Gyamfi, K. ADAPTED SERVQUAL: A Health Service Quality Scale Incorporating Indicators of Sanitation and Hygiene. Qual. Manag. Health Care 2021, 30, 184–193. [Google Scholar] [CrossRef]
- VanDyke, T.P.; Kappelman, L.A.; Prybutok, V.R. Measuring information systems service quality: Concerns on the use of the SERVQUAL questionnaire. Mis Q. 1997, 21, 195–208. [Google Scholar] [CrossRef] [Green Version]
- Kettinger, W.J.; Lee, C.C. Zones of tolerance: Alternative scales for measuring information systems service quality. Mis Q. 2005, 29, 607–623. [Google Scholar] [CrossRef] [Green Version]
- Natesan, P.; Aerts, X. Can library users distinguish between minimum, perceived, and desired levels of service quality? Validating LibQUAL plus (R) using multitrait multimethod analysis. Libr. Inf. Sci. Res. 2016, 38, 30–38. [Google Scholar] [CrossRef]
- Kesharwani, A.; Mani, V.; Gaur, J.; Wamba, S.F.; Kamble, S.S. Service Quality Measurement in Information Systems: An Expectation and Desire Disconfirmation Approach. J. Glob. Inf. Manag. 2021, 29, 19. [Google Scholar] [CrossRef]
- Amenta, P.; Lucadamo, A.; D’Ambra, A. Restricted Common Component and Specific Weight Analysis: A Constrained Explorative Approach for the Customer Satisfaction Evaluation. Soc. Indic. Res. 2021, 156, 409–427. [Google Scholar] [CrossRef]
- McCollin, C.; Ograjensek, I.; Gob, R.; Ahlemeyer-Stubbe, A. SERVQUAL and the Process Improvement Challenge. Qual. Reliab. Eng. Int. 2011, 27, 705–718. [Google Scholar] [CrossRef]
- Caber, M.; Albayrak, T.; Crawford, D. Perceived value and its impact on travel outcomes in youth tourism. J. Outdoor Recreat. Tour. -Res. Plan. Manag. 2020, 31, 100327. [Google Scholar] [CrossRef]
- Jebarajakirthy, C.; Das, M.; Maggioni, I.; Sands, S.; Dharmesti, M.; Ferraro, C. Understanding on-the-go consumption: A retail mix perspective. J. Retail. Consum. Serv. 2021, 58, 102327. [Google Scholar] [CrossRef]
- Wong, K.H.; Chang, H.H.; Yeh, C.H. The effects of consumption values and relational benefits on smartphone brand switching behavior. Inf. Technol. People 2019, 32, 217–243. [Google Scholar] [CrossRef]
- Wu, B.; Yang, W. What do Chinese consumers want? A value framework for luxury hotels in China. Int. J. Contemp. Hosp. Manag. 2018, 30, 2037–2055. [Google Scholar] [CrossRef]
- Goncalves, H.M.; Lourenco, T.F.; Silva, G.M. Green buying behavior and the theory of consumption values: A fuzzy-set approach. J. Bus. Res. 2016, 69, 1484–1491. [Google Scholar] [CrossRef]
- Sheth, J.N.; Newman, B.I.; Gross, B.L. Why we buy what we buy: A theory of consumption values. J. Bus. Res. 1991, 22, 159–170. [Google Scholar] [CrossRef]
- Wang, T.-C.; Chen, Y.-H. Applying fuzzy linguistic preference relations to the improvement of consistency of fuzzy AHP. Inf. Sci. 2008, 178, 3755–3765. [Google Scholar] [CrossRef]
- Mishra, A.R.; Rani, P.; Pardasani, K.R.; Mardani, A.; Stević, Ž.; Pamučar, D. A novel entropy and divergence measures with multi-criteria service quality assessment using interval-valued intuitionistic fuzzy TODIM method. Soft Comput. 2020, 24, 11641–11661. [Google Scholar] [CrossRef]
- Zadeh, L.A. Fuzzy sets. Inf. Control 1965, 8, 338–353. [Google Scholar] [CrossRef] [Green Version]
- Hong, S.-J.; Choi, D.; Chae, J. Exploring different airport users’ service quality satisfaction between service providers and air travelers. J. Retail. Consum. Serv. 2020, 52, 101917. [Google Scholar] [CrossRef]
- Pandey, M.M. Evaluating the service quality of airports in Thailand using fuzzy multi-criteria decision making method. J. Air Transp. Manag. 2016, 57, 241–249. [Google Scholar] [CrossRef]
- Hsu, T.-H.; Tang, J.-W. Applying fuzzy LinPreRa cognitive map to evaluate strategic alliance partnerships for outlying island duty-free shop. Asia Pac. J. Mark. Logist. 2019, 31, 730–758. [Google Scholar] [CrossRef]
- Herrera-Viedma, E.; Herrera, F.; Chiclana, F.; Luque, M. Some issues on consistency of fuzzy preference relations. Eur. J. Oper. Res. 2004, 154, 98–109. [Google Scholar] [CrossRef]
- Kahraman, C.; Cebeci, U.; Ruan, D. Multi-attribute comparison of catering service companies using fuzzy AHP: The case of Turkey. Int. J. Prod. Econ. 2004, 87, 171–184. [Google Scholar] [CrossRef]
- Kahraman, C.; Ruan, D.; Doǧan, I. Fuzzy group decision-making for facility location selection. Inf. Sci. 2003, 157, 135–153. [Google Scholar] [CrossRef]
- Hsu, T.-H.; Chen, C.-H.; Yang, Y.-W. A Decision Analysis Model for the Brand Experience of Branded Apps Using Consistency Fuzzy Linguistic Preference Relations. Symmetry 2021, 13, 1151. [Google Scholar] [CrossRef]
- Wang, R.T.; Li, X.M.; Li, C.T. Optimal selection of sustainable battery supplier for battery swapping station based on Triangular fuzzy entropy -MULTIMOORA method. J. Energy Storage 2021, 34, 102013. [Google Scholar] [CrossRef]
- Tolga, E.; Demircan, M.L.; Kahraman, C. Operating system selection using fuzzy replacement analysis and analytic hierarchy process. Int. J. Prod. Econ. 2005, 97, 89–117. [Google Scholar] [CrossRef]
- Noori, A.; Bonakdari, H.; Salimi, A.H.; Gharabaghi, B. A group Multi-Criteria Decision-Making method for water supply choice optimization. Socio-Econ. Plan. Sci. 2021, 77, 101006. [Google Scholar] [CrossRef]
- Razzaq, O.A.; Fahad, M.; Khan, N.A. Different variants of pandemic and prevention strategies: A prioritizing framework in fuzzy environment. Results Phys. 2021, 28, 104564. [Google Scholar] [CrossRef]
- Zhang, F.; Ju, Y.B.; Gonzalez, E.; Wang, A.H.; Dong, P.W.; Giannakis, M. Evaluation of construction and demolition waste utilization schemes under uncertain environment: A fuzzy heterogeneous multi-criteria decision-making approach. J. Clean. Prod. 2021, 313, 127907. [Google Scholar] [CrossRef]
- Melian-Alzola, L.; Martin-Santana, J.D. Service quality in blood donation: Satisfaction, trust and loyalty. Serv. Bus. 2020, 14, 101–129. [Google Scholar] [CrossRef]
- Malhotra, N.; Mavondo, F.; Mukherjee, A.; Hooley, G. Service quality of frontline employees: A profile deviation analysis. J. Bus. Res. 2013, 66, 1338–1344. [Google Scholar] [CrossRef]
- Chiang, A.H.; Trimi, S. Impacts of service robots on service quality. Serv. Bus. 2020, 14, 439–459. [Google Scholar] [CrossRef]
- Han, Y.; Xie, G. Determinants of customer perceived online shopping logistics service quality value: An empirical study from China. Int. J. Logist. Res. Appl. 2019, 22, 614–637. [Google Scholar] [CrossRef]
- Laroche, M.; Kalamas, M.; Cheikhrouhou, S.; Cezard, A. An assessment of the dimensionality of should and will service expectations. Can. J. Adm. Sci./Rev. Can. Sci. Adm. 2004, 21, 361–375. [Google Scholar] [CrossRef]
- Li, L.X. Relationships between determinants of hospital quality management and service quality performance—A path analytic model. Omega 1997, 25, 535–545. [Google Scholar] [CrossRef]
- Jo, W.; Lee, C.; Reisinger, Y. Behavioral intentions of international visitors to the Korean hanok guest houses: Quality, value and satisfaction. Ann. Tour. Res. 2014, 47, 83–86. [Google Scholar] [CrossRef]
- Seo, K.; Moon, J.; Lee, S. Synergy of corporate social responsibility and service quality for airlines: The moderating role of carrier type. J. Air Transp. Manag. 2015, 47, 126–134. [Google Scholar] [CrossRef]
- Liu, C.-H.S.; Lee, T. Service quality and price perception of service: Influence on word-of-mouth and revisit intention. J. Air Transp. Manag. 2016, 52, 42–54. [Google Scholar] [CrossRef]
- Petrick, J.F. The roles of quality, value, and satisfaction in predicting cruise passengers’ behavioral intentions. J. Travel Res. 2004, 42, 397–407. [Google Scholar] [CrossRef]
- Wu, H.; Deng, Z.; Wang, B.; Wu, T. Online service qualities in the multistage process and patients’ compliments: A transaction cycle perspective. Inf. Manag. 2020, 57, 103230. [Google Scholar] [CrossRef]
- Kim, H.; Jan, I.U. Consumption value factors as determinants of use intention and behavior of car-sharing services in the Republic of Korea. Innov. Eur. J. Soc. Sci. Res. 2021, 1–19. [Google Scholar] [CrossRef]
- Zeithaml, V.A. Consumer perceptions of price, quality, and value: A means-end model and synthesis of evidence. J. Mark. 1988, 52, 2–22. [Google Scholar] [CrossRef]
- Sweeney, J.C.; Soutar, G.N. Consumer perceived value: The development of a multiple item scale. J. Retail. 2001, 77, 203–220. [Google Scholar] [CrossRef]
- Gallarza, M.G.; Saura, I.G. Value dimensions, perceived value, satisfaction and loyalty: An investigation of university students’ travel behaviour. Tour. Manag. 2006, 27, 437–452. [Google Scholar] [CrossRef]
- He, K.; Zhang, J.; Wang, A.; Chang, H. Rural households’ perceived value of energy utilization of crop residues: A case study from China. Renew. Energy 2020, 155, 286–295. [Google Scholar] [CrossRef]
- Lang, B.; Conroy, D.M. Are trust and consumption values important for buyers of organic food? A comparison of regular buyers, occasional buyers, and non-buyers. Appetite 2021, 161, 105123. [Google Scholar]
- Kaur, P.; Dhir, A.; Talwar, S.; Ghuman, K. The value proposition of food delivery apps from the perspective of theory of consumption value. Int. J. Contemp. Hosp. Manag. 2021, 33, 1129–1159. [Google Scholar] [CrossRef]
- von Janda, S.; Shainesh, G.; Hillebrand, C.M. Studying Heterogeneity in the Subsistence Consumer Market: A Context-Sensitive Approach. J. Int. Mark. 2021, 29, 39–56. [Google Scholar] [CrossRef]
- Yoon, S.H.; Kim, H.W.; Kankanhalli, A. What makes people watch online TV clips? An empirical investigation of survey data and viewing logs. Int. J. Inf. Manag. 2021, 59, 102329. [Google Scholar] [CrossRef]
- Maslow, A.H. A theory of human motivation. Psychol. Rev. 1943, 50, 370. [Google Scholar] [CrossRef] [Green Version]
- Maslow, A.H. The instinctoid nature of basic needs. J. Personal. 1954, 22, 326–347. [Google Scholar] [CrossRef] [PubMed]
- Katona, G. Rational behavior and economic behavior. Psychol. Rev. 1953, 60, 307. [Google Scholar] [CrossRef]
- Katz, D. The functional approach to the study of attitudes. Public Opin. Q. 1960, 24, 163–204. [Google Scholar] [CrossRef] [Green Version]
- Hanna, J.G. A typology of consumer needs. Res. Mark. 1980, 3, 83–104. [Google Scholar]
- Hirschman, E.C.; Holbrook, M.B. Hedonic consumption: Emerging concepts, methods and propositions. J. Mark. 1982, 46, 92–101. [Google Scholar] [CrossRef] [Green Version]
- Burns, M.J. Value in Exchange: The Consumer Perspective. Ph.D. Thesis, The University of Tennessee, Knoxville, TN, USA, 1994. [Google Scholar]
- Kotler, P. Marketing management: Analysis. Plan. Implement. Control 1997, 9, 1–798. [Google Scholar]
- Flint, D.J.; Woodruff, R.B.; Gardial, S.F. Exploring the phenomenon of customers’ desired value change in a business-to-business context. J. Mark. 2002, 66, 102–117. [Google Scholar] [CrossRef]
- Yang, H.-L.; Lin, R.-X. Determinants of the intention to continue use of SoLoMo services: Consumption values and the moderating effects of overloads. Comput. Hum. Behav. 2017, 73, 583–595. [Google Scholar] [CrossRef]
- Wang, S.; Wang, J.; Wang, Y.; Yan, J.; Li, J. Environmental knowledge and consumers’ intentions to visit green hotels: The mediating role of consumption values. J. Travel Tour. Mark. 2018, 35, 1261–1271. [Google Scholar] [CrossRef]
- Qasim, H.; Yan, L.; Guo, R.; Saeed, A.; Ashraf, B.N. The defining role of environmental self-identity among consumption values and behavioral intention to consume organic food. Int. J. Environ. Res. Public Health 2019, 16, 1106. [Google Scholar] [CrossRef] [Green Version]
- Karjaluoto, H.; Glavee-Geo, R.; Ramdhony, D.; Shaikh, A.A.; Hurpaul, A. Consumption values and mobile banking services: Understanding the urban–rural dichotomy in a developing economy. Int. J. Bank Mark. 2021, 39, 2. [Google Scholar] [CrossRef]
- Ye, Q.; Li, H.; Wang, Z.; Law, R. The influence of hotel price on perceived service quality and value in e-tourism: An empirical investigation based on online traveler reviews. J. Hosp. Tour. Res. 2014, 38, 23–39. [Google Scholar] [CrossRef]
- Lovelock, C.; Wirtz, J. Service Marketing“People, Technology, Strategy; Pearson Education: Upper Saddle River, NJ, USA, 2011. [Google Scholar]
- Parasuraman, A.; Zeithaml, V.A.; Berry, L.L. A conceptual model of service quality and its implications for future research. J. Mark. 1985, 49, 41–50. [Google Scholar] [CrossRef]
- Schvaneveldt, S.J.; Enkawa, T.; Miyakawa, M. Consumer evaluation perspectives of service quality: Evaluation factors and two-way model of quality. Total Qual. Manag. 1991, 2, 149–162. [Google Scholar] [CrossRef]
- Gerhard, M.; CHRIST0, B.; Deon, N. The dimensions of service quality: The original European perspective revisited. Serv. Ind. J. 1997, 17, 173–189. [Google Scholar] [CrossRef]
- Robledo, M.A. Measuring and managing service quality: Integrating customer expectations. Manag. Serv. Qual. Int. J. 2001, 11, 1. [Google Scholar] [CrossRef]
- Brady, M.K.; Cronin, J.J., Jr. Some new thoughts on conceptualizing perceived service quality: A hierarchical approach. J. Mark. 2001, 65, 34–49. [Google Scholar] [CrossRef] [Green Version]
- Zeithaml, V.A. Service excellence in electronic channels. Manag. Serv. Qual. Int. J. 2002, 12, 135–139. [Google Scholar] [CrossRef]
- Petrick, J.F. Development of a multi-dimensional scale for measuring the perceived value of a service. J. Leis. Res. 2002, 34, 119–134. [Google Scholar] [CrossRef]
- Khan, M. ECOSERV: Ecotourists’ quality expectations. Ann. Tour. Res. 2003, 30, 109–124. [Google Scholar] [CrossRef]
- Lee, G.-G.; Lin, H.-F. Customer perceptions of e-service quality in online shopping. Int. J. Retail Distrib. Manag. 2005, 33, 161–176. [Google Scholar] [CrossRef]
- Parasuraman, A.; Zeithaml, V.A.; Malhotra, A. ES-QUAL: A multiple-item scale for assessing electronic service quality. J. Serv. Res. 2005, 7, 213–233. [Google Scholar] [CrossRef]
- Abdullah, F. Measuring service quality in higher education: HEdPERF versus SERVPERF. Mark. Intell. Plan. 2006, 24, 1. [Google Scholar] [CrossRef] [Green Version]
- Cid-López, A.; Hornos, M.J.; Herrera-Viedma, E. SICTQUAL: A fuzzy linguistic multi-criteria model to assess the quality of service in the ICT sector from the user perspective. Appl. Soft Comput. 2015, 37, 897–910. [Google Scholar] [CrossRef]
- Hoyer, W.D.; MacInnis, D. Consumer Behavior, 3rd ed.; Boston Houghton Mifflin: Boston, MA, USA, 2004. [Google Scholar]
- MacInnis, D.J. A framework for conceptual contributions in marketing. J. Mark. 2011, 75, 136–154. [Google Scholar] [CrossRef] [Green Version]
- Peronard, J.-P.; Ballantyne, A.G. Broadening the understanding of the role of consumer services in the circular economy: Toward a conceptualization of value creation processes. J. Clean. Prod. 2019, 239, 118010. [Google Scholar] [CrossRef]
- Murry, J.W., Jr.; Hammons, J.O. Delphi: A versatile methodology for conducting qualitative research. Rev. High. Educ. 1995, 18, 423–436. [Google Scholar] [CrossRef]
- Dalkey, N.C. The Delphi Method: An Experimental Study of Group Opinion; Rand Corp: Santa Monica, CA, USA, 1969. [Google Scholar]
- Holsti, O.R. Content Analysis for the Social Sciences and Humanities; Addison-Wesley Pub. Co.: Boston, MA, USA, 1969; pp. 1–235. [Google Scholar]
- Zadeh, L.A. The concept of a linguistic variable and its application to approximate reasoning—I. Inf. Sci. 1975, 8, 199–249. [Google Scholar] [CrossRef]
- Guo, X.X.; Ji, J.; Khan, F.; Ding, L.; Tong, Q. A novel fuzzy dynamic Bayesian network for dynamic risk assessment and uncertainty propagation quantification in uncertainty environment. Saf. Sci. 2021, 141, 105285. [Google Scholar] [CrossRef]
- Wang, X.D.; Zhang, C.B.; Wang, C.; Zhu, Y.D.; Cui, Y.H. Probabilistic-fuzzy risk assessment and source analysis of heavy metals in soil considering uncertainty: A case study of Jinling Reservoir in China. Ecotoxicol. Environ. Saf. 2021, 222, 112537. [Google Scholar] [CrossRef] [PubMed]
- Dev, C.S.; Schultz, D.E. A customer-focused approach can bring the current marketing mix into the 21 st century. Mark. Manag. 2005, 14, 18–24. [Google Scholar]
- Bostanci, B.; Erdem, N. Investigating the satisfaction of citizens in municipality services using fuzzy modelling. Socio-Econ. Plan. Sci. 2020, 69, 100754. [Google Scholar] [CrossRef]
- Prakash, C.; Barua, M. A robust multi-criteria decision-making framework for evaluation of the airport service quality enablers for ranking the airports. J. Qual. Assur. Hosp. Tour. 2016, 17, 351–370. [Google Scholar]
- Akdag, H.; Kalaycı, T.; Karagöz, S.; Zülfikar, H.; Giz, D. The evaluation of hospital service quality by fuzzy MCDM. Appl. Soft Comput. 2014, 23, 239–248. [Google Scholar] [CrossRef]
- Martin, J.C.; Saayman, M.; du Plessis, E. Determining satisfaction of international tourist: A different approach. J. Hosp. Tour. Manag. 2019, 40, 1–10. [Google Scholar] [CrossRef]
- Tang, J.W.; Hsu, T.H. Utilizing the Hierarchy Structural Fuzzy Analytical Network Process Model to Evaluate Critical Elements of Marketing Strategic Alliance Development in Mobile Telecommunication Industry. Group Decis. Negot. 2018, 27, 251–284. [Google Scholar] [CrossRef]
- Buyukozkan, G.; Havle, C.A.; Feyzioglu, O. A new digital service quality model and its strategic analysis in aviation industry using interval-valued intuitionistic fuzzy AHP. J. Air Transp. Manag. 2020, 86, 101817. [Google Scholar] [CrossRef]
- Nojavan, M.; Heidari, A.; Mohammaditabar, D. A fuzzy service quality based approach for performance evaluation of educational units. Socio-Econ. Plan. Sci. 2021, 73, 100816. [Google Scholar] [CrossRef]
- Stevic, Z.; Dalic, I.; Pamucar, D.; Nunic, Z.; Veskovic, S.; Vasiljevic, M.; Tanackov, I. A new hybrid model for quality assessment of scientific conferences based on Rough BWM and SERVQUAL. Scientometrics 2019, 119, 1–30. [Google Scholar] [CrossRef]
- Maria Stock, R.; Jong, A.d.; Zacharias, N.A. Frontline employees’ innovative service behavior as key to customer loyalty: Insights into FLEs’ resource gain spiral. J. Prod. Innov. Manag. 2017, 34, 223–245. [Google Scholar] [CrossRef]
- Subramanian, N.; Gunasekaran, A.; Gao, Y. Innovative service satisfaction and customer promotion behaviour in the Chinese budget hotel: An empirical study. Int. J. Prod. Econ. 2016, 171, 201–210. [Google Scholar] [CrossRef]
- Chen, X.; Li, Z.; Fan, Z.-P.; Zhou, X.; Zhang, X. Matching demanders and suppliers in knowledge service: A method based on fuzzy axiomatic design. Inf. Sci. 2016, 346, 130–145. [Google Scholar] [CrossRef]
- Law, R.; Sun, S.; Chan, I.C.C. Hotel technology: A perspective article. Tour. Rev. 2019, 75, 1. [Google Scholar] [CrossRef]


| Author | Consumption Values Classification |
|---|---|
| Hirschman and Holbrook [82] | Experience consumption value, Rational consumption value. |
| Zeithaml [69] | Low price, whatever one wants in a product, what the consumer gets for what she or he gives, the quality the consumer receives for the price paid. |
| Sheth, Newman [41] | Functional Value, Conditional Value, Social Value, Emotional Value, Epistemic Value. |
| Burns [83] | Product value, Use value, Possession value, Full value. |
| Kotler [84] | Product value, Service value, Personal value, Image value. |
| Flint, Woodruff [85] | Actual value, Desired value. |
| Yang and Lin [86] | Functional Value, Social Value, Emotional Value, Epistemic Value, Fashion Value. |
| Wang, Wang [87] | Function value (price), Function value (quality), Social Value, Emotional Value. |
| Qasim, Yan [88] | Function value (price), Function value (quality), Social Value, Conditional Value, Epistemic Value, Emotional Value. |
| Karjaluoto, Glavee-Geo [89] | Functional Value, Social Value, Epistemic Value, Emotional Value. |
| Consumption Value Aspects Researcher | Functional Value | Social Value | Conditional Value | Emotional Value | Epistemic Value | Cannot Be Classified |
|---|---|---|---|---|---|---|
| Parasuraman, Zeithaml [92] | Tangibility Reliability Safety | Proximity Courtesy Communicability | Responsiveness | Goodwill Understanding of customers | Competence | |
| Parasuraman, Zeithaml [12] | Tangibility Reliability Authenticity | Responsiveness | Concern | |||
| Schvaneveldt, Enkawa [93] | Authenticity Ease of use Integrity Environment | Feelings | Accountability | |||
| Cronin Jr and Taylor [18] | Tangibility Reliability | Responsiveness | Empathy | Guarantee | ||
| Gerhard, CHRIST0 [94] | Extrinsic aspects Intrinsic aspects | |||||
| Robledo [95] | Tangibility Reliability | Concern for customers | ||||
| Brady and Cronin Jr [96] | Environment | Interaction | Results | |||
| Zeithaml [97] | Efficiency Reliability Privacy | Realizability | ||||
| Petrick [98] | Reputation | Emotions | Quality Monetary cost Action cost | |||
| Khan [99] | Reliability Tangibility | Responsiveness | Empathy | Guarantee Ecological materials | ||
| Lee and Lin [100] | Reliability | Responsiveness | Trustworthiness | |||
| Parasuraman, Zeithaml [101] | Reliability Ease of navigation Efficiency Safety Privacy Customization | Responsiveness Visitability Agility Individuation | Trustworthiness | Guarantee Price information Website aesthetics | ||
| Abdullah [102] | Reliability | Empathy | Non-academic aspects Academic aspects | |||
| Cid-López, Hornos [103] | Tangibility Reliability Application procedures Technology | Responsiveness | Empathy | Guarantee Overall satisfying service | ||
| Wu, Deng [67] | Before-sale service quality During-sale service quality After-sale service quality |
| Aspects Attributes Service | Functional Value | Social Value | Conditional Value | Emotional Value | Epistemic Value |
|---|---|---|---|---|---|
| Service quality | Comfort Efficiency Safety Multifunctionality | Respect Influence Recommendation Praise Communicability | Adaptability Responsiveness Mobility Immediacy | Concern Attentiveness Pleasure Memorability Sharing Dependability | Innovativeness Knowledge Prospective Technological |
| Aspects Attributes Service | Functional Value | Social Value | Conditional Value | Emotional Value | Epistemic Value |
|---|---|---|---|---|---|
| Service Quality | Comfort 100 Efficiency 100 Safety 100 | Respect 100 Recommendation 80 Praise 93 | Adaptability 93 Mobility 87 Immediacy 100 | Attentiveness 100 Pleasure 93 Dependability 93 | Innovative 100 Knowledge 93 Technology 100 |
| Consumption Value Aspect | Attributes | Content of Attribute |
|---|---|---|
| Functional Value |
|
|
| Social Value |
|
|
| Conditional Value |
|
|
| Emotional Value |
|
|
| Epistemic Value |
|
|
| Aspect | Attribute | Grade Distribution Based on Evaluation by 15 Expert Participants (E) and 3 Authors (R) | |||||||||||
|---|---|---|---|---|---|---|---|---|---|---|---|---|---|
| Strongly Disagree | Disagree | Neither Agree nor Disagree | Agree | Strongly Agree | 50% or More the Same | ||||||||
| −2 | −1 | 0 | +1 | +2 | |||||||||
| E | R | E | R | E | R | E | R | E | R | E | R | ||
| Functional Value | Comfort | 1 | 14 | 3 | +2 | +2 | |||||||
| Efficiency | 1 | 2 | 13 | 2 | +2 | +2 | |||||||
| Safety | 1 | 15 | 2 | +2 | +2 | ||||||||
| Social Value | Respect | 1 | 14 | 3 | +2 | +2 | |||||||
| Recommendation | 1 | 2 | 1 | 1 | 11 | 2 | +2 | +2 | |||||
| Praise | 1 | 14 | 3 | +2 | +2 | ||||||||
| Conditional Value | Adaptability | 1 | 1 | 9 | 5 | 2 | +1 | +2 | |||||
| Mobility | 2 | 1 | 13 | 2 | +2 | +2 | |||||||
| Immediacy | 1 | 2 | 12 | 3 | +2 | +2 | |||||||
| Emotional Value | Attentiveness | 2 | 1 | 3 | 10 | 2 | +2 | +2 | |||||
| Pleasure | 2 | 8 | 1 | 5 | 2 | +1 | +2 | ||||||
| Dependability | 1 | 1 | 2 | 11 | 3 | +2 | +2 | ||||||
| Epistemic Value | Innovation | 1 | 14 | 3 | +2 | +2 | |||||||
| Knowledge | 15 | 3 | +2 | +2 | |||||||||
| Technology | 15 | 3 | +2 | +2 | |||||||||
| Aspects Attributes Service | Functional Value | Social Value | Conditional Value | Emotional Value | Epistemic Value |
|---|---|---|---|---|---|
| Service Quality | Comfort 100 a, 98 t, 100 h Efficiency 100 a, 99 t, 99 h Safety 100 a, 95 t, 100 h | Respect 99 a, 100 t, 100 h Recommendation 94 a, 88 t, 96 h Praise 98 a, 95 t, 99 h | Adaptability 100 a, 100 t, 99 h Mobility 99 a, 98 t, 97 h Immediacy 100 a, 100 t, 100 h | Attentiveness 100 a, 100 t, 100 h Pleasure 100 a, 99 t, 100 h Dependability 100 a, 98 t, 98 h | Innovative 100 a, 100 t, 100 h Knowledge 99 a, 100 t, 99 h Technology 100 a, 100 t, 100 h |
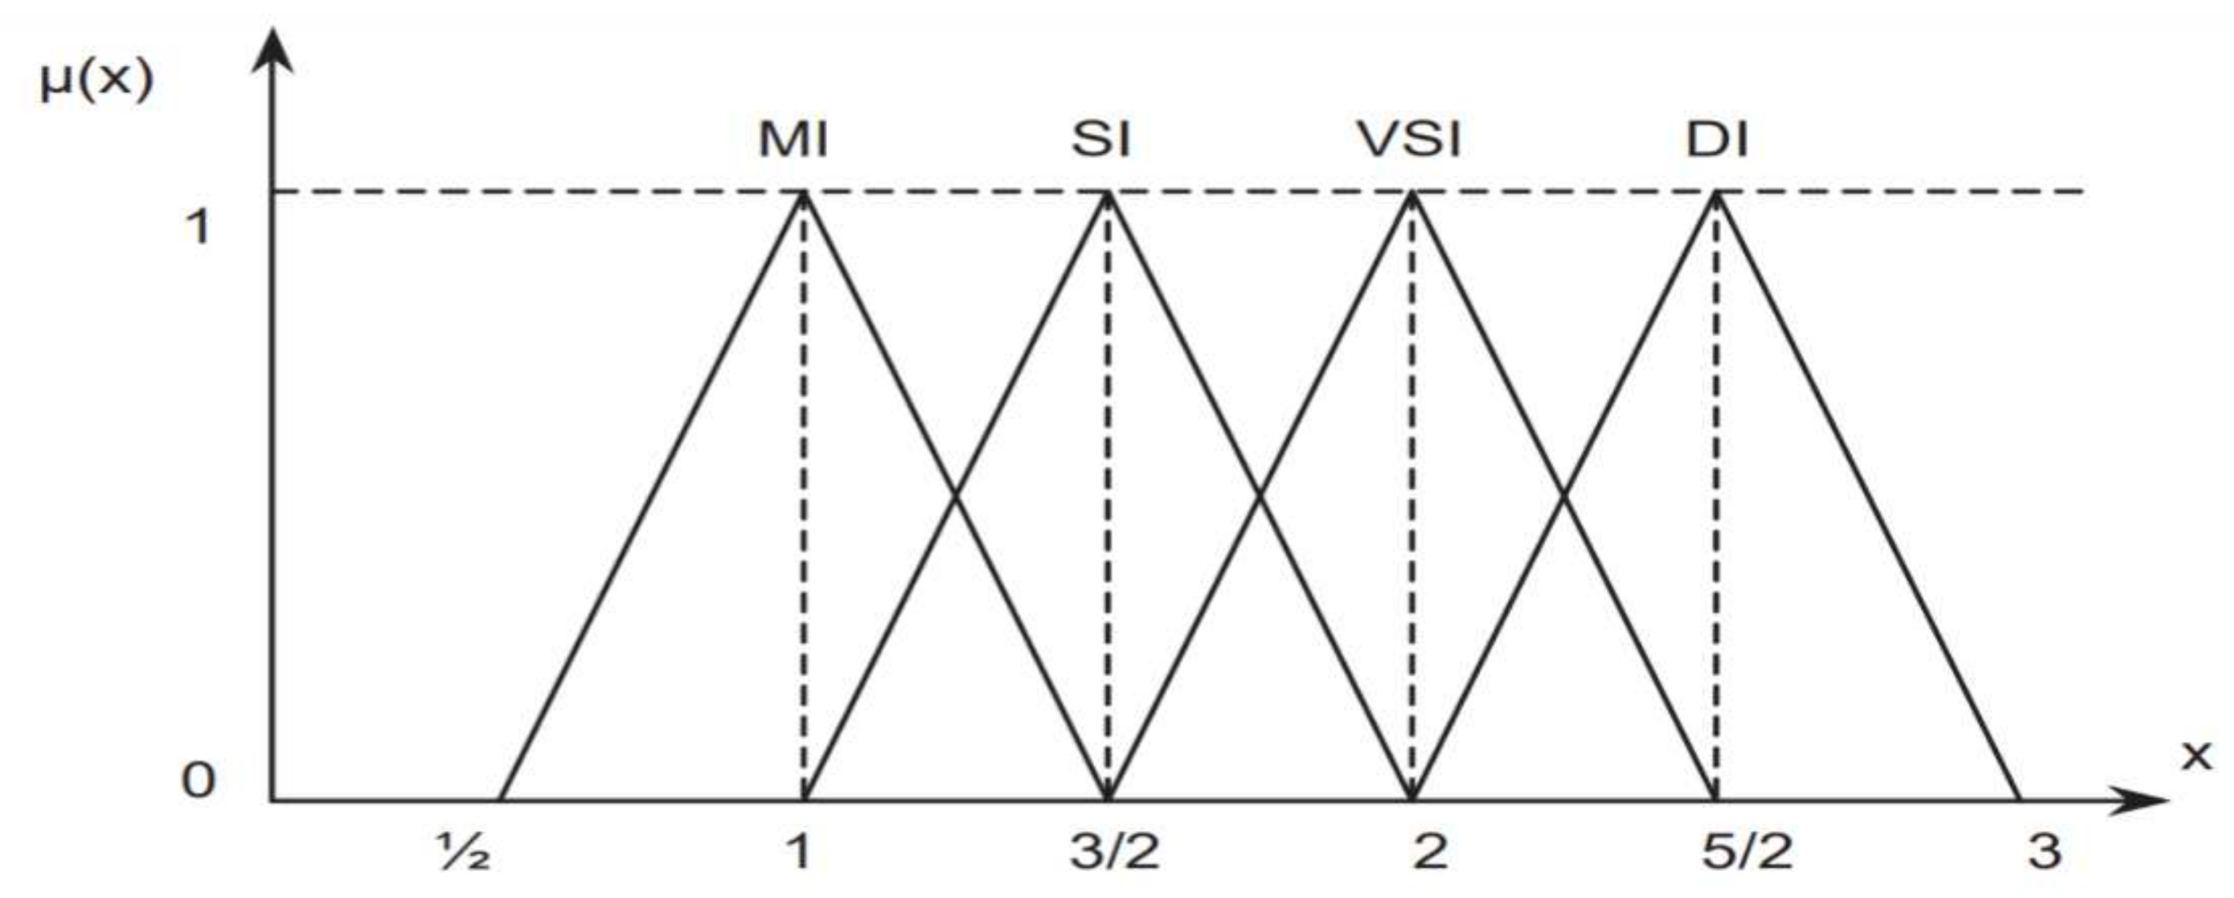
| Linguistic Variables | Designation | Triangular Fuzzy Number | Triangular Fuzzy Reciprocal Scale |
|---|---|---|---|
| Demonstrated importance | DI | (2, 5/2, 3) | (1/3, 2/5, 1/2) |
| Very strong importance | VSI | (3/2, 2, 5/2) | (2/5, 1/2, 2/3) |
| Strong importance | SI | (1, 3/2, 2) | (1/2, 2/3, 1) |
| Moderate importance | MI | (1/2, 1, 3/2) | (2/3, 1, 2) |
| Equal importance | EI | (1, 1, 1) | (1, 1, 1) |
| Aspects | Attributes | Relative Weights | Rank | ||||
|---|---|---|---|---|---|---|---|
| Name | Weights | Rank | Name | Weights | Rank | ||
| Functional Value | 0.2228 | 1 | Comfort | 0.3005 | 3 | 0.0670 | 6 |
| Efficiency | 0.3194 | 2 | 0.0712 | 5 | |||
| Safety | 0.3800 | 1 | 0.0847 | 1 | |||
| Social Value | 0.1809 | 5 | Respect | 0.3571 | 1 | 0.0646 | 7 |
| Recommendation | 0.3065 | 3 | 0.0554 | 15 | |||
| Praise | 0.3364 | 2 | 0.0609 | 14 | |||
| Conditional Value | 0.1874 | 3 | Adaptability | 0.3414 | 1 | 0.0640 | 8 |
| Mobility | 0.3314 | 2 | 0.0621 | 11 | |||
| Immediacy | 0.3272 | 3 | 0.0613 | 12 | |||
| Emotional Value | 0.1872 | 4 | Attentiveness | 0.3393 | 1 | 0.0635 | 9 |
| Pleasure | 0.3260 | 3 | 0.0610 | 13 | |||
| Dependability | 0.3348 | 2 | 0.0627 | 10 | |||
| Epistemic Value | 0.2217 | 2 | Innovation | 0.3479 | 1 | 0.0771 | 2 |
| Knowledge | 0.3219 | 3 | 0.0714 | 4 | |||
| Technology | 0.3302 | 2 | 0.0732 | 3 | |||
| Aspects | Attributes | Relative Weights | Rank | ||||
|---|---|---|---|---|---|---|---|
| Name | Weights | Rank | Name | Weights | Rank | ||
| Functional Value | 0.1956 | 3 | Comfort | 0.3107 | 3 | 0.0608 | 14 |
| Efficiency | 0.3470 | 1 | 0.0679 | 7 | |||
| Safety | 0.3424 | 2 | 0.0670 | 8 | |||
| Social Value | 0.1782 | 5 | Respect | 0.2921 | 3 | 0.0520 | 15 |
| Recommendation | 0.3431 | 2 | 0.0611 | 13 | |||
| Praise | 0.3648 | 1 | 0.0650 | 10 | |||
| Conditional Value | 0.1951 | 4 | Adaptability | 0.3382 | 1 | 0.0660 | 9 |
| Mobility | 0.3293 | 3 | 0.0642 | 12 | |||
| Immediacy | 0.3324 | 2 | 0.0648 | 11 | |||
| Emotional Value | 0.2141 | 2 | Attentiveness | 0.3345 | 2 | 0.0716 | 4 |
| Pleasure | 0.3221 | 3 | 0.0690 | 5 | |||
| Dependability | 0.3434 | 1 | 0.0735 | 3 | |||
| Epistemic Value | 0.2171 | 1 | Innovation | 0.3435 | 1 | 0.0746 | 1 |
| Knowledge | 0.3148 | 3 | 0.0683 | 6 | |||
| Technology | 0.3417 | 2 | 0.0742 | 2 | |||
| Aspects | Attributes | Relative Weights | Rank | ||||
|---|---|---|---|---|---|---|---|
| Name | Weights | Rank | Name | Weights | Rank | ||
| Functional Value | 0.2201 | 1 | Comfort | 0.3621 | 1 | 0.0797 | 1 |
| Efficiency | 0.3044 | 3 | 0.0670 | 9 | |||
| Safety | 0.3334 | 2 | 0.0734 | 4 | |||
| Social Value | 0.1776 | 4 | Respect | 0.3681 | 1 | 0.0654 | 10 |
| Recommendation | 0.3165 | 2 | 0.0562 | 14 | |||
| Praise | 0.3154 | 3 | 0.0560 | 15 | |||
| Conditional Value | 0.1747 | 5 | Adaptability | 0.3414 | 1 | 0.0597 | 11 |
| Mobility | 0.3314 | 2 | 0.0579 | 12 | |||
| Immediacy | 0.3272 | 3 | 0.0572 | 13 | |||
| Emotional Value | 0.2126 | 3 | Attentiveness | 0.3531 | 1 | 0.0751 | 3 |
| Pleasure | 0.3251 | 2 | 0.0691 | 6 | |||
| Dependability | 0.3217 | 3 | 0.0684 | 8 | |||
| Epistemic Value | 0.2149 | 2 | Innovation | 0.3558 | 1 | 0.0765 | 2 |
| Knowledge | 0.3189 | 3 | 0.0685 | 7 | |||
| Technology | 0.3254 | 2 | 0.0699 | 5 | |||
Publisher’s Note: MDPI stays neutral with regard to jurisdictional claims in published maps and institutional affiliations. |
© 2021 by the authors. Licensee MDPI, Basel, Switzerland. This article is an open access article distributed under the terms and conditions of the Creative Commons Attribution (CC BY) license (https://creativecommons.org/licenses/by/4.0/).
Share and Cite
Hsu, T.-H.; Her, S.-T.; Hou, J.-J. Developing Universally Applicable Service Quality Assessment Model Based on the Theory of Consumption Values, and Using Fuzzy Linguistic Preference Relations to Empirically Test Three Industries. Mathematics 2021, 9, 2608. https://doi.org/10.3390/math9202608
Hsu T-H, Her S-T, Hou J-J. Developing Universally Applicable Service Quality Assessment Model Based on the Theory of Consumption Values, and Using Fuzzy Linguistic Preference Relations to Empirically Test Three Industries. Mathematics. 2021; 9(20):2608. https://doi.org/10.3390/math9202608
Chicago/Turabian StyleHsu, Tsuen-Ho, Sen-Tien Her, and Jia-Jeng Hou. 2021. "Developing Universally Applicable Service Quality Assessment Model Based on the Theory of Consumption Values, and Using Fuzzy Linguistic Preference Relations to Empirically Test Three Industries" Mathematics 9, no. 20: 2608. https://doi.org/10.3390/math9202608
APA StyleHsu, T.-H., Her, S.-T., & Hou, J.-J. (2021). Developing Universally Applicable Service Quality Assessment Model Based on the Theory of Consumption Values, and Using Fuzzy Linguistic Preference Relations to Empirically Test Three Industries. Mathematics, 9(20), 2608. https://doi.org/10.3390/math9202608