1. Introduction
A complex network is a multidisciplinary topic in many domains including informatics, psychology, management, sociology, biology and engineering [
1]. In reality, networks arise in a multitude of domains and are useful in solving numerous problems of human communities, such as the detection of bot accounts on Twitter [
2], the discovery of vulnerabilities in electrical grids [
3], identification of potentially harmful interactions between drugs [
4], health care programs to predict the spread of epidemic diseases [
5], improvement of routes in the development of road networks [
6] and so on. The question of how to find influential nodes and edges is an important issue. Many methods are used to rank the nodes in networks. Degree [
7], H-index [
8] and k-shell [
9] are based on nodes’ neighbors. Closeness centrality [
10] and betweenness centrality [
11] are based on the path. Quasi-Laplacian centrality [
12], Local Gravity Model [
13] and AWLM [
14] are based on semi-local structural information. In comparison, influential edges also play a significant role in complex network study. Influential edges analysis will be beneficial for guiding or controlling the network from a global perspective, moving the epidemic tipping point through topologically targeted social distancing [
15] and so on.
In fact, for different problems, the importance of the edge in the network contains different meanings. In terms of the transmission of infectious diseases, the edge in the network represents the path of the transmission of infectious diseases, and its importance depends on the ability of this edge to spread diseases in the network. The stronger the transmission ability, the higher the edge importance. In electric transportation networks, edges in the network represent circuit connections. Its importance depends on the impact of the circuit failure on the network connectivity; the greater the impact on the network connectivity, the higher the edge importance. Therefore, the importance of the edge in the network under different problems is different. In this paper, we use network robustness R [
16] as the target measure defining the importance of an edge for the impact on the network connectivity.
It is arduous that the number of edges in the network is more than the number of nodes. However, there are still great signs of progress madding in the research of identifying influential edges in complex networks. The earliest studies have reported in 1973. Granovetter [
17] proposed that weakly connected edges may be more important than strongly connected edges, which has captured the attention of many researchers. Then, the research on edge strength has gradually emerged. Radicchi et al. [
18] extended the clustering coefficient of nodes to edges and considered that the edges with lower clustering coefficient bridges communities generally. Gilbert and Karahalios [
19] considered the attribute information and interaction strength of two nodes based on user characteristics and interaction behavior. En-Yu Yu [
20] considered not only the degrees of nodes and cliques (local characteristics) but also the betweenness centrality (global characteristics) in order to rank important edges. Kossinets [
21], Goyal [
22] and Saito [
23] proposed algorithms by learning a node behavior sequence and by calculating the influence probability.
In addition, Girvan and Newman [
24] proposed edge betweenness that is based on the centrality of betweenness. It can accurately identify the important edges in the network but consumes huge computing resources. Holme et al. [
25] multiplied the degrees of the two nodes as the centrality value of the edge. Liu et al. [
26] measured the influence of an edge by counting the number of node first-order neighbors at the ends of the edge that are not connected to another node. These two methods are very fast, but the accuracy is very low. Onnela et al. [
27] proposed a topological overlap method to judge the proportion of common neighbors in the total number of neighbors to measure the importance of the edge. It can improve the accuracy, but it was still poor at identifying edges that have a significant impact on network connectivity. The vital edge cannot be accurately identified; thus, the target removal edge has little effect on the network connectivity. An edge ranking algorithm that can accurately identify important edges is urgent needed.
Maintaining global network connectivity is the basic function of edges. In fact, the importance of an edge is related to the influence of the nodes at its two ends. However, the most important nodes tend to have many edges, which also causes these edges to be replaceable. In the paper, the scale of the gaint component is its nodes number. If edges that are highly replaceable are chosen to be removed, it will have a little impact on the scale of the giant component. On the contrary, the scale of the giant component will decrease sharply by removing the irreplaceable edge, For example, in the power grid, if the most irreplaceable edge is destroyed, it will cause a large-scale blackout. If such an edge is protected in advance, the impact will not be significant for other replaceable edges are damaged. Therefore, the rule of node influence distribution and the irreplaceability of edges should be considered comprehensively.
In order to improve the accuracy for identifying influential edges in complex network, we propose an edge ranking algorithm considering both local information and global information. Firstly, a node influence distribution model is employed for measuring the effect of the node on the edge. Subsequently, edge irreplaceability is revealed via the node dissimilarity strategy. Afterward, the edge ranking algorithm is proposed by combining the node influence distribution model (ID) and the node dissimilarity strategy (DIS). The purpose of the proposed DID algorithm is to accurately detect edges that can exert a strong influences over complex networks. Empirical results show that DID performs best in comparison with the four methods on nine real networks and twelve BA networks. In addition, DIS also can improve other methods that consider local information of the network.
The structure of the paper is as follows: In
Section 2, ID and DIS are proposed first. Next, our method DID is proposed, and an analysis of DID is represented. The network data description and numerical results based on various classic methods applying to real networks and BA networks are shown in
Section 3, respectively. Moreover, the experimental results are discussed in
Section 4. Finally, conclusions are made in
Section 5.
2. Algorithm
For different problems, the edge importance in the network is different. For the spreading problems, people take the number of infected nodes per unit time as the evaluation index of the network edge importance under the same transmission probability. On the contrary, for network connectivity problems, researchers measure edge importance by calculating the change of the scale of the most connected component in the network. The purpose of this paper is to find edges that have a significant impact on network connectivity.
In this paper, we introduce the node influence distribution model and node dissimilarity strategy, which are the basis of our proposed edge ranking algorithm. The proposed algorithm can identify influential edges widely. It works on unweighted and undirected networks. The proposed algorithm consists of the following three steps: distributes node influence, measures edge irreplaceability and proposes an edge ranking algorithm.
Table 1 summarizes the symbols and notations used in the paper.
2.1. Node Influence Distribution Model
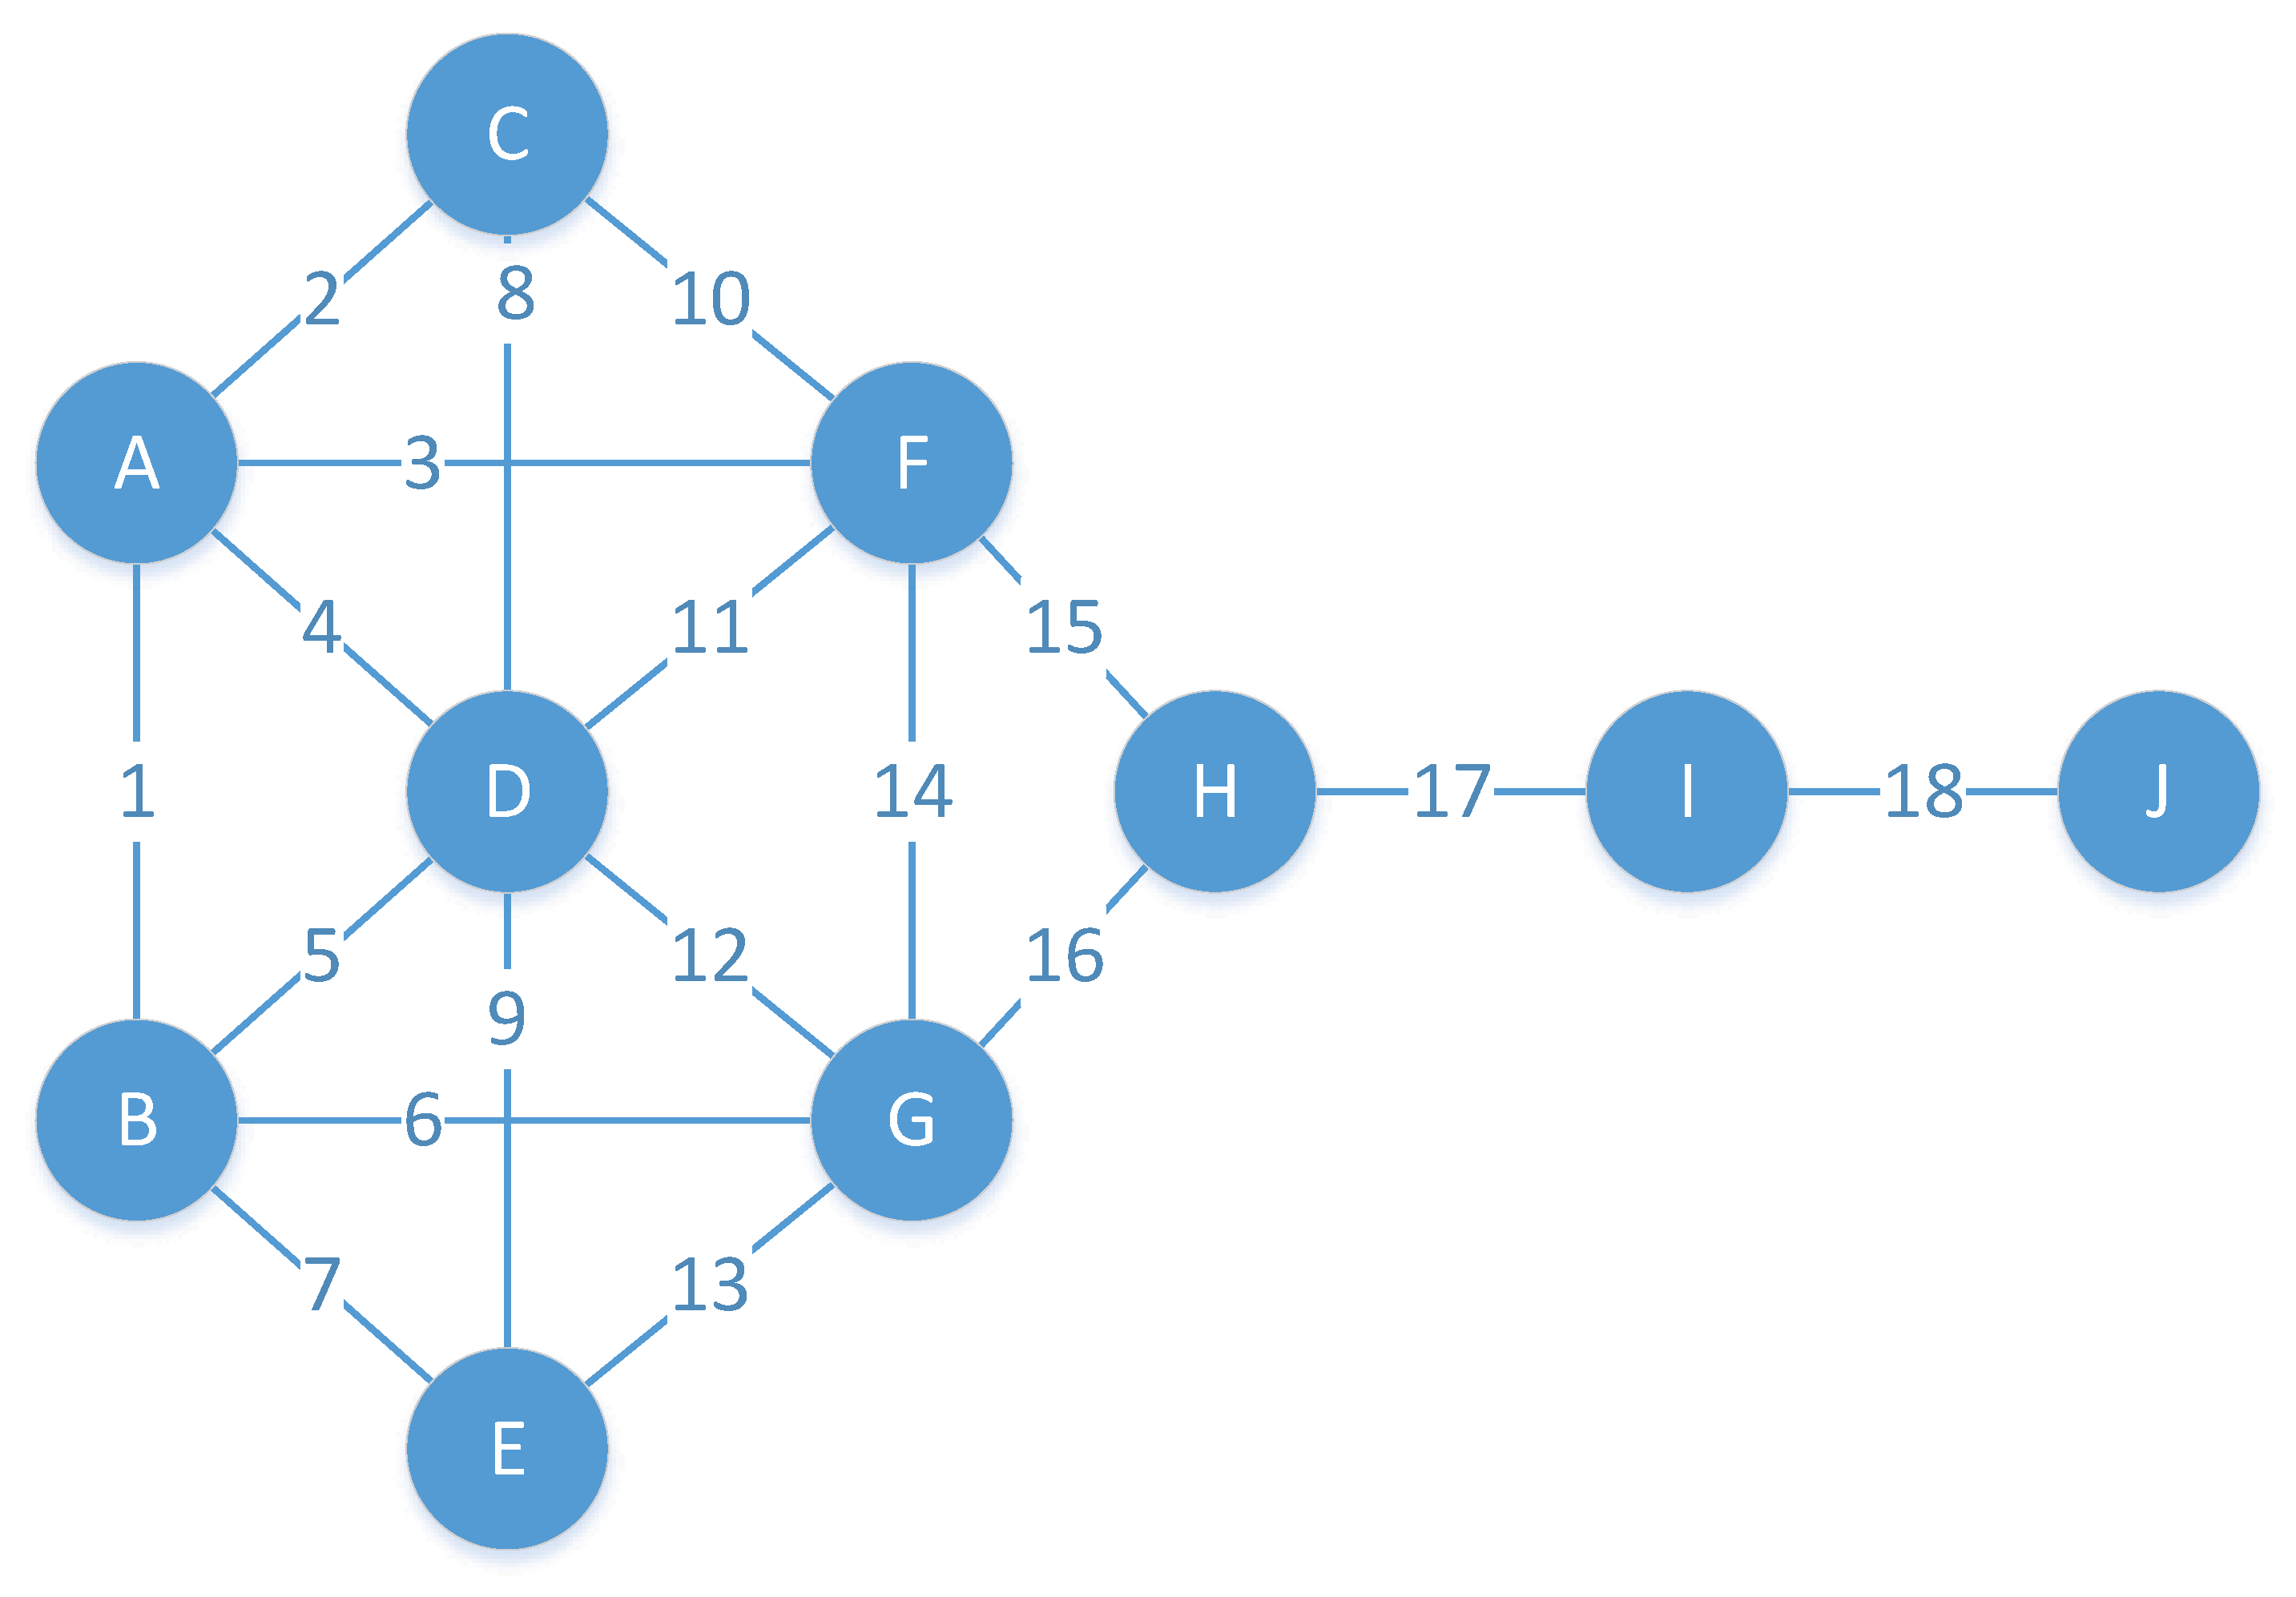
It is known that the edge connected with the greater influence node also has greater influence on the network. However, it is difficult to distinguish the importance of these edges connecting the same influential node for many important nodes in reality with many edges. For example, nodes F and G are the most influential nodes in
Figure 1. However, removing the connecting edge between nodes F and G has less impact on the overall connectivity of the network than by removing the connecting edge between nodes H and I. The influence of a node cannot directly reflect the influence of the edges connected to the node. When a node has many edges, the influence will be diluted accordingly. To solve these problems, node influence should be allocated to edges according to the actual rules.
Considering the global characteristics, closeness centrality [
10] is selected to evaluate the influence of nodes. The influence of node i allocated to an edge
is calculated by node i influences and the proportion of node j influence relative to the influence of all node i neighbors. The ID value is the product of the influence values allocated to the edge by the nodes at both ends of the edge. Thus, the edge influence is obtained as follows.
is defined as the following.
The node influence distribution model considers not only the information of the edge itself but also the path, which can more comprehensively reflect the importance of the edge.
2.2. Strategy Based on Node Dissimilarity
One of the greatest challenges for edge ranking is that the number of edges is much larger than the nodes. Therefore, the cost of calculation is unacceptable for the dissimilarity between edges. The more common the neighbors between the two nodes with the same edge, the more backup paths there are corresponding to the edge. For example, in
Figure 1, after the edge between node F and G is removed, there are two paths between them. The common neighbor plays the role of replacing the directly connected edge between the two nodes. Thus, the dissimilarity of nodes should be considered when identifying important edges to be more practical and efficient.
In order to measure the nodes similarity, Salton [
29] is selected to explore the similarity influence in two nodes on the edge. The cost of calculating the edge by this method is O(m). By calculating the similarity between nodes, the dissimilarity in nodes at both ends of the network is judged, and the irreplaceability of the edge is evaluated by the dissimilarity. The node dissimilarity is calculated as follows.
It should be noted that, in this paper, node dissimilarity is only used for pair of nodes with connected edges. Therefore, when the neighbors of two nodes are identical except for the degree of the two nodes being same and equal to the number of common neighbors plus one (for an edge between them), their similarity is one, and so the dissimilarity of the two nodes is zero.
2.3. Dissimilarity Influence Distribution Algorithm
Considering node influence distribution and edge irreplaceability, a new edge ranking algorithm is obtained by combining DIS with the ID model, named dissimilarity influence distribution algorithm (DID). DID is calculated as follows.
The kite network (
Figure 1) is used to describe the DID calculation process. The closeness centrality of each node in the kite network is calculated, which is shown in
Table 2.
The closeness centrality of A is 0.5294117647058824, which is the same as B. The neighbors of node A are B, C, D and F. The influence of edge 1 from node A can be obtained as follows.
The influence of edge 1 from node B also is 0.123. The ID value of Edge 1 can be obtained by 0.123 × 0.123 = 0.0152.
Then, the dissimilarity of nodes A and B is calculated as the irreplaceability of edge 1. Node A is connected with nodes B, C, D and F, and node B is connected with nodes A, D, E and G. The common neighbor between node pair A B is node D, the number of the common neighbor is one and so the dissimilarity is 0.5. Therefore, the DID of edge 1 is calculated by 0.0152 × 0.5 = 0076. Correspondingly, the DID values of other edges can be obtained, as shown in
Table 3.
Edge 17 has the highest score calculated by DID. Edge 17 is the only way to connect the left and right modules, which plays the role of the bridge. Although edges 4 and 5 connect the more important nodes in the network, their importance is decreased due to the presence of many neighbors relative to these nodes. The DID method can better reflect the real edge ranking sequence in the network.
3. Experiment
In this section, all experiments comprise targeted edge removal. Firstly, we explain four algorithms used in comparison with DID. Then, we describe the data sets used in our experiments. Next, the evaluation criterion network robustness R is described. The results are explained at the end.
3.1. Compared Algorithms
The performance of the proposed algorithm is compared with the following four algorithms:
(1) Edge Betweenness (EB [
24]): EB considers the global information of the network and measures the edge importance by judging the proportion of an edge on the shortest path between any two nodes. It can be calculated as follows.
(2) Degree Product (DP [
25]): The centrality of the edge can be obtained by multiplying the degree value of nodes at both ends of an edge, as follows.
(3) Diffusion Intensity (DI [
26]): The centrality of the edge can be obtained by counting the number of neighbors of one end node that is not connected to the other end node, as follows.
(4) Topological Overlap(TO [
27]): The centrality of the edge can be obtained by calculating the ratio of common neighbors to unconnected neighbors, as follows.
3.2. Data Set
In this paper, nine real networks from disparate fields including four social networks (Dolphin [
30], polblogs [
31], Sex [
32] and Facebook [
33]; three communication networks (Email [
34], As-733 [
35] and PG [
36]); and two collaboration networks (Jazz [
37] and CA-CondMat [
3]) are used to test the performance of DID and DIS combined with several classic methods. Dolphin is a social network of 62 dolphins. Polblogs is a social network in the political blogosphere of the United States. Sex is a bipartite network in which nodes are females (sex sellers) and males (sex buyers), and links between them are established when males write posts indicating sexual encounters with females. Facebook describes social circles from Facebook. Email describes email interchanges between users including faculty, researchers, technicians, managers, administrators and graduate students of the Rovira i Virgili University. As-733 contains the daily instances of autonomous systems from 8 November 1997 to 2 January 2000. PG is a snapshot of the Gnutella peer-to-peer file sharing network from August 2002. Jazz is a collaboration network of jazz musicians. Ca-CondMat is a collaboration network of Arxiv Condensed Matter category.
Table 4 summarizes the key properties of the selected real sets.
The BA networks are used to test the performance of DID and nodes, and the average degrees include (500, 3), (500, 6), (500, 9), (500, 12), (5000, 3), (5000, 6), (5000, 9), (5000, 12), (50,000, 3), (50,000, 6), (50,000, 9) and (50,000, 12), respectively.
3.3. Evaluation Criterion
The network robustness R is used as an evaluation criterion to compare the performance of DID with four algorithms on the considered data sets. The calculation process is as follows: delete the connected edges in the network one by one and calculate the size of the most connected subgraph of the normalized network until the network is empty. R could be obtained as follows:
where
i is the number of edges removed.
3.4. Experiment of DID Performance
The proposed DID is compared with four classic algorithms in nine real networks. The results are shown in
Table 5. The lower the network robustness R, the better performance of the algorithm.
Table 5 shows that the network robustness R obtained by the proposed DID generally outperforms the competitive methods as marked in bold. From
Table 5, DID is the best performing algorithm on seven data sets (namely, Dolphin, Jazz, Email, polblogs, PG, Sex and Facebook) whereas TO is the best performing algorithm on the as-733 and CA-CondMat data set. Compared with TO, which considers the semi local information, DID comprehensively considers the global and local information of the network. By combining the relationship between nodes and edges, it can better reflect the importance of network edges.
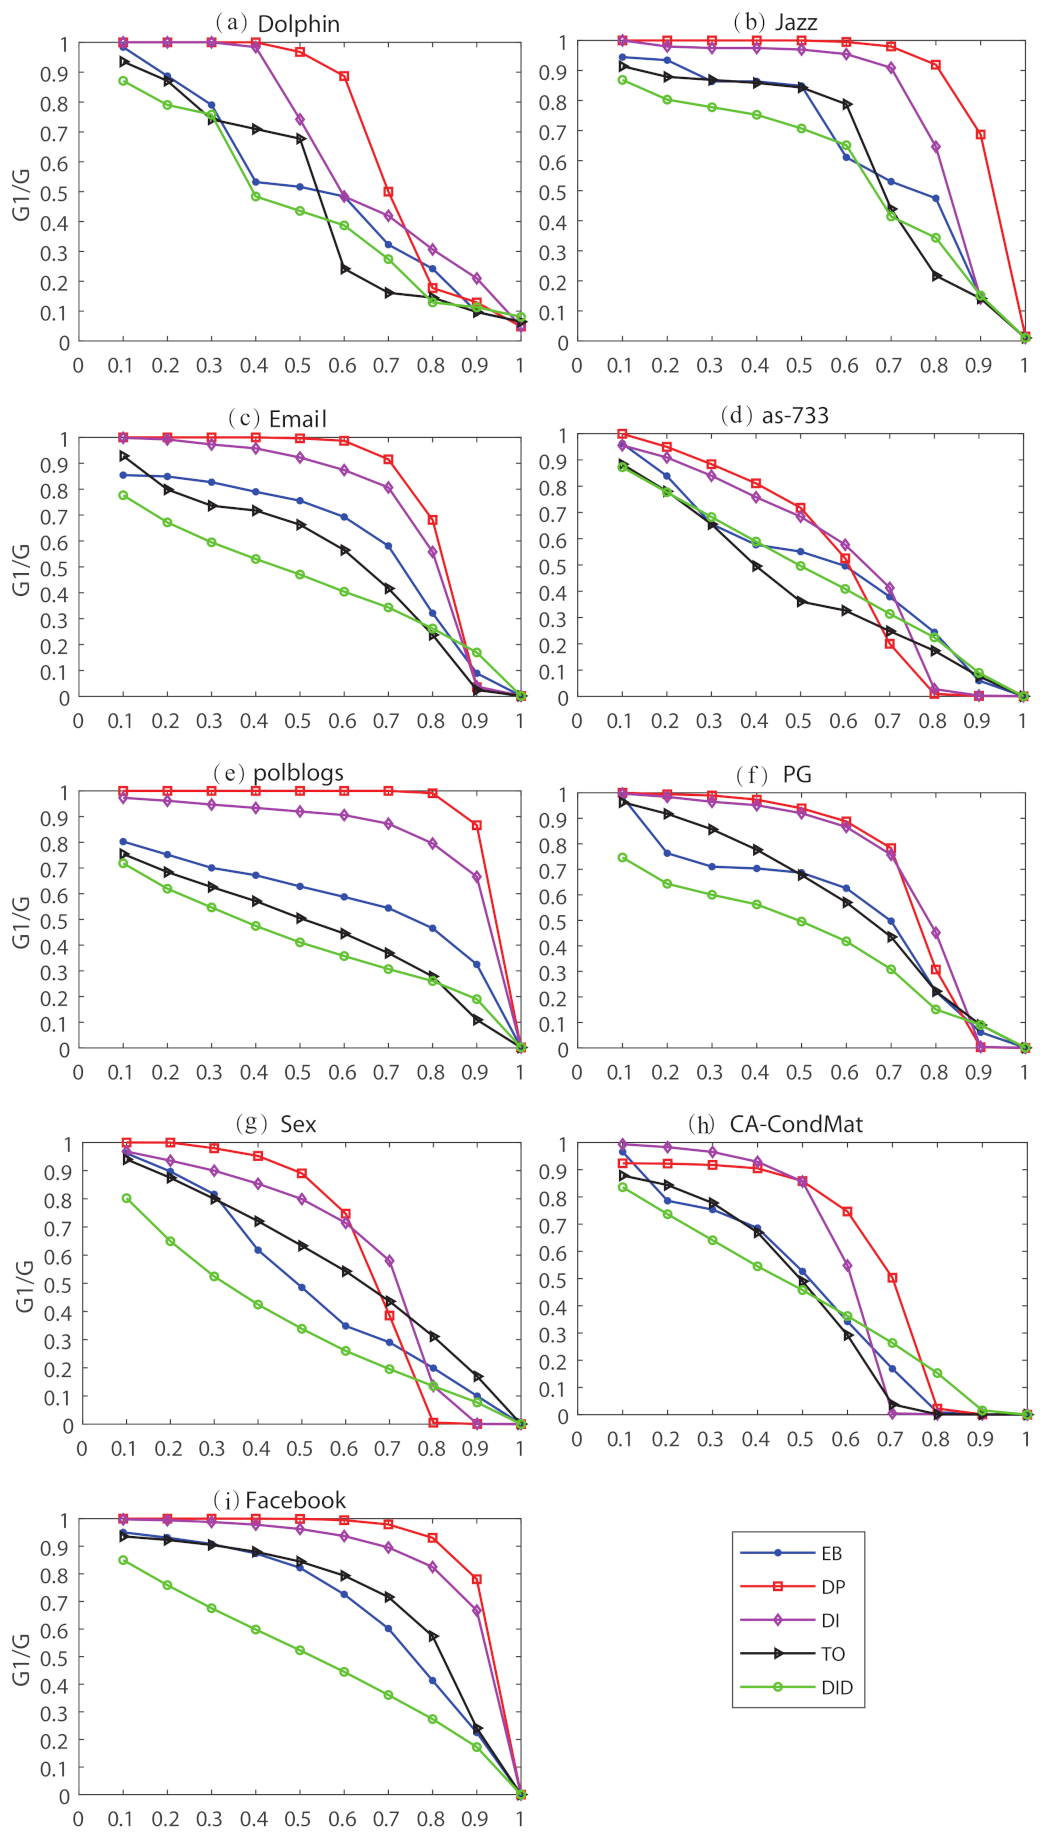
We further study the efficiency of the algorithm by observing the ratio of the remaining giant component relative to the original network after removing a certain proportion of edges. By observing the proportion dynamic change of the giant component relative to that of the original network, we can better represent the destruction of the algorithm. The results are as shown in
Figure 2.
Figure 2 exhibits that DID has excellent performance in finding the key edges in the real network. With the important edges removed, the connectivity of the network is greatly damaged. Even in the as-733 network and Ca-Condmat network where the performance of DID is not optimal, the damage of DID is stronger than the other four methods when deleting the top 50% edges. Moreover, in the Facebook network, DID is the best in the entire process. In other networks, after more than half of the edges are deleted, DID is still more destructive than other methods. Dynamic network experiment proves the effectiveness of DID.
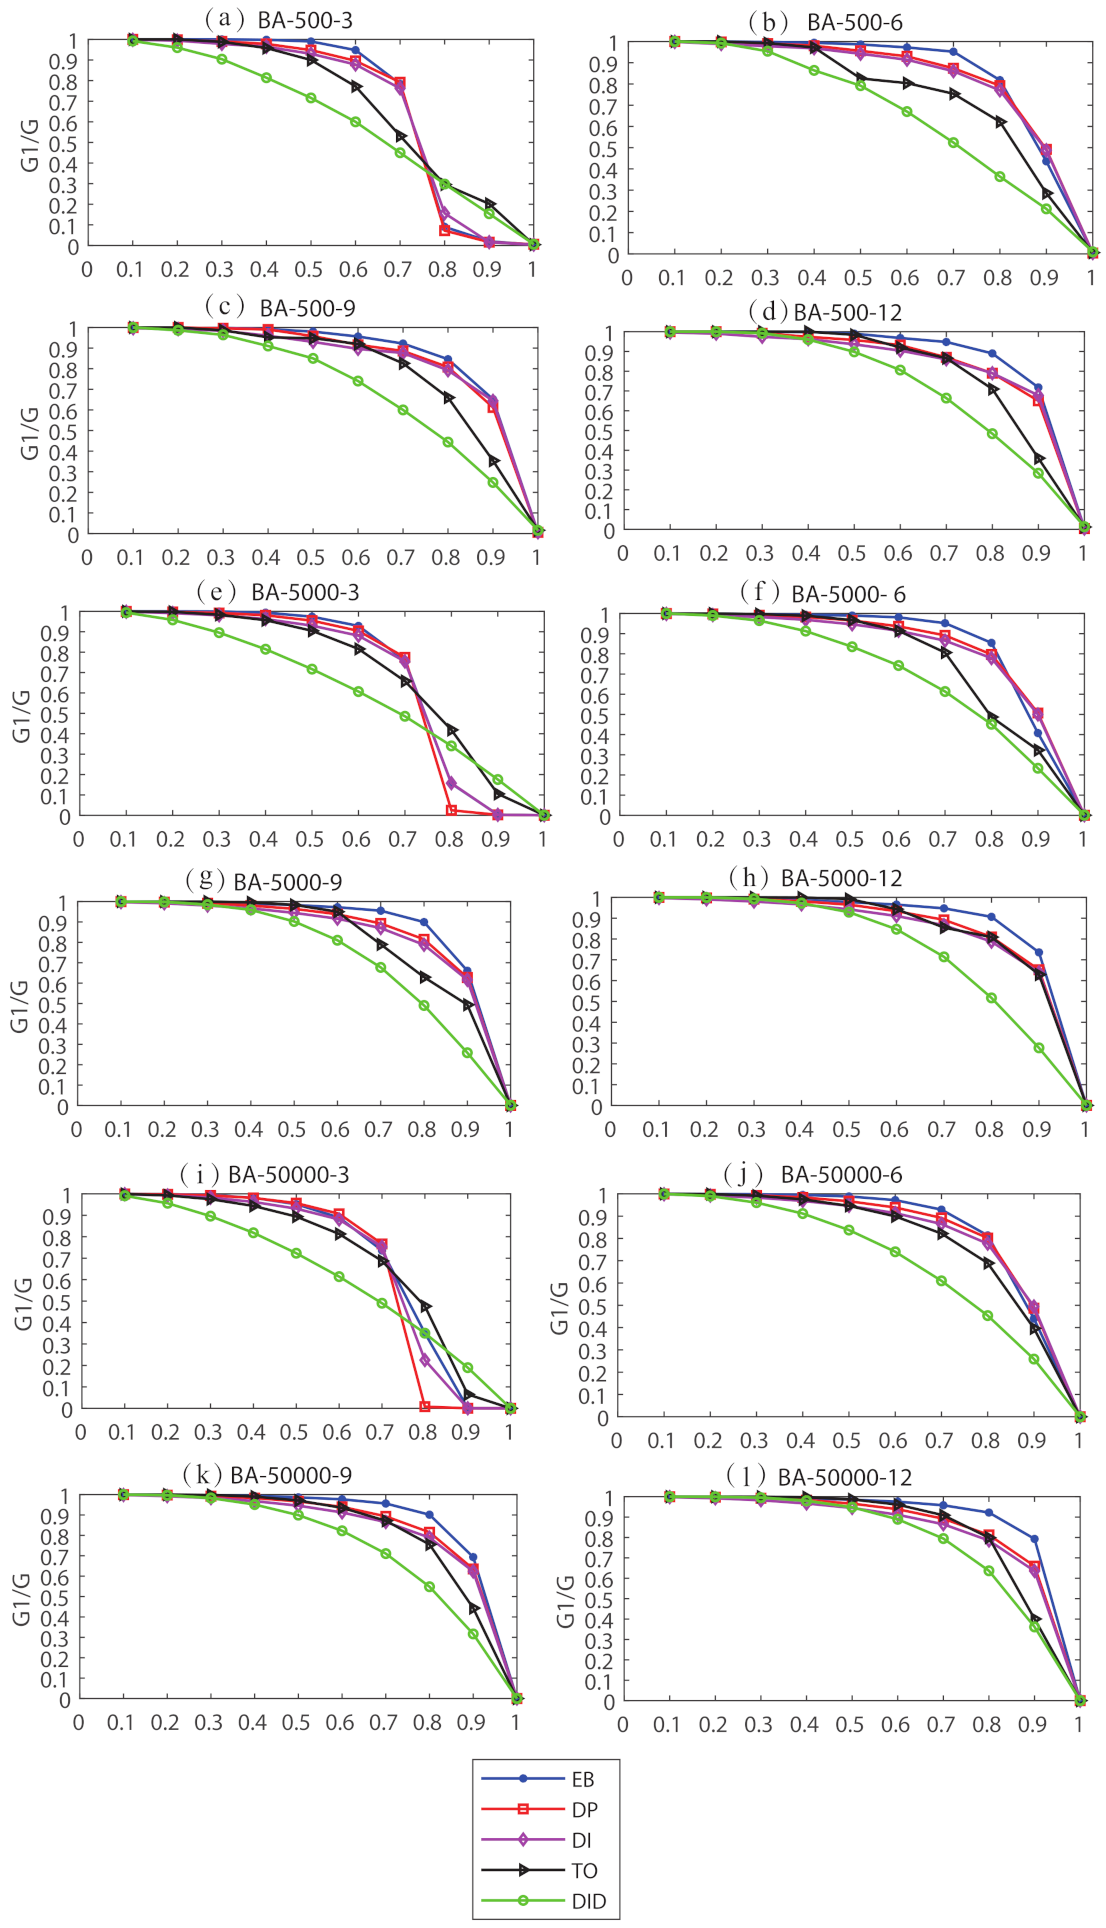
Next, we compared the proposed DID with four classic algorithms in 12 BA networks. The results are as shown in
Table 6 where the best values are marked in bold.
Figure 3 shows the dynamic damage of DID and four comparison algorithms relative to network connectivity. From
Table 6 and
Figure 3, DID has an excellent performance in finding the vital edges in the BA network.
3.5. Experiment of DIS
In order to verify the proposed DIS, we compared the combination methods (named DEP, DDP, DDI and DTO) with the original methods in nine real networks. The network robustness R is used as the evaluation index. The experimental results are shown in
Table 7 where the best values are marked in bold. The lower the R value, the better performance of the algorithm.
As
Table 7 shows, when compared with the original methods, it is obvious that DEB and DTO are not suitable, but DDP and DDI generally outperformed DP and DI. The performance of DID is the best when compared with these eight algorithms based on
Table 5 and
Table 7.
4. Discussion
Identifying influential nodes and edges is a hot topic with a variety of applications in different fields, such as informatics, psychology, management, sociology, biology, engineering and so on. Degree product [
24], as the simplest measure, considers that the importance of the edge is related to the importance of the nodes at its two ends. If nodes have a large number of neighbors, the edge will be crucial. However, it is likely that some bridge nodes are ignored, which connect different components but have a few neighbors. Edge Betweenness [
20] considers an edge as important if most nodes’ shortest path proceeds through it but has high computational complexity. To overcome this shortcoming, Diffusion Intensity [
25] and Topological Overlap [
26] are proposed, which can identify vital edges by the semi local information. These two measures seem to be more suitable for identifying the influential edges having a significant impact on network connectivity; however, they ignore the edge irreplaceability, which is more realistic. Thus, the DID algorithm is proposed in this paper, which firstly computes the influence that nodes distribute to the edge and then considers edge irreplaceability by computing node dissimilarity. The proposed DID algorithm is capable of identifying vital edges. Experimental results on nine real networks and twelve different BA networks show the feasibility and efficiency of DID.
Firstly, the experiments comparing network robustness R exhibit the superiority of DID, for the vital edges identified by the algorithm are observed to easily exert strong influence than compared to the competitors. Although inferior to TO on the as-733 and CA-CondMat data set, it is also quite competitive. As shown in
Figure 2, by observing the ratio of the remaining giant component to the original network after removing a certain proportion of edges, the networks are more easily broken up by DID. The results on BA networks also verify the feasibility and efficiency of DID. Secondly, we apply network robustness R to evaluate the DIS effect on the classical algorithm (as shown in
Table 7). In general, DIS can only improve the performance of the method in some real networks, some of which may even be reduced. Generally speaking, for some identifying influential edge methods that consider local information of nodes, this strategy can effectively enhance the performance of the algorithm at the cost of O(m) time when ranking edges for target removal edges. It is worth noting that the DID is still the best.
5. Conclusions
In this paper, by considering node influence distribution and edge irreplaceability, we proposed an edge ranking method named DID and compared it with four classic methods in nine real networks and twelve BA networks by network robustness R and the proportion of dynamic change relative to the giant component. The results show that DID performs well in identifying influential edges that have a significant impact on network connectivity. This will help us in some real-life applications such as controlling the spreading of rumors and targeted attacks on networks and so on.
In addition, we combined DIS with four classic methods (such as DEB, DDP, DDI and DTO). The results show that DIS can effectively improve the performance of DP and DI algorithms, which are based on local information of the network. The reason is that the node dissimilarity strategy is more realistic, and these algorithms combined with this strategy are more comprehensive for considering the topology of structure. However, for TO and EB, which consider the network’s semi-local or global information, their accuracies are reduced when identifying the edge that is more important compared to network connectivity. Therefore, for different methods, the question of whether to choose this strategy based on node dissimilarity should be answered and improved upon.


