
Super-Resolved Recognition of License Plate Characters


Department of Artificial Intelligence Convergence, Chonnam National University, Gwangju 11866, Korea
*
Author to whom correspondence should be addressed.
Mathematics 2021, 9(19), 2494; https://doi.org/10.3390/math9192494
Submission received: 18 September 2021
/
Revised: 29 September 2021
/
Accepted: 29 September 2021
/
Published: 5 October 2021
(This article belongs to the Special Issue Mathematical Methods and Applications for Artificial Intelligence and Computer Vision)
Abstract
:Object detection and recognition are crucial in the field of computer vision and are an active area of research. However, in actual object recognition processes, recognition accuracy is often degraded due to resolution mismatches between training and test image data. To solve this problem, we designed and developed an integrated object recognition and super-resolution framework by proposing an image super-resolution technique that improves object recognition accuracy. In detail, we collected a number of license plate training images through web-crawling and artificial data generation, and the image super-resolution artificial neural network was trained by defining an objective function to be robust to image flips. To verify the performance of the proposed algorithm, we experimented with the trained image super-resolution and recognition on representative test images and confirmed that the proposed super-resolution technique improves the accuracy of character recognition. For character recognition with the 4× magnification, the proposed method remarkably increased the mean average precision by 49.94% compared to the existing state-of-the-art method.
1. Introduction
Object recognition is a field of computer vision focused on recognizing information, such as a particular object area, type, or size, from a single image. The objects being detected can vary widely, and common applications are concerned with objects such as people or vehicles. The accurate detection of an object of interest from a single image is the vital element of object recognition. To recognize an object of interest in a single image, it is essential to detect a relevant object region in the image using an object detection neural network, and then adjust the size of the detected region appropriately to match the input size of the object attribute recognition.
However, in the process of resizing the image to match the input size of the object recognition neural network, the input image resolution degrades, which causes a discrepancy in resolution between the input images and training images used for the training of the object recognition neural network. This problem brings about the poor performance of the object recognition neural network because of the distortion of input images of the object recognition neural network. In order to solve this problem, domestic and foreign researchers focused on improving the recognition rate of the object recognition neural network with a preprocessing method that improves the quality of the low-resolution image, which is the input of the object recognition neural network.
Although there have been various studies aimed at improving the accuracy and speed of object detection neural networks and object attribute recognition neural net-works themselves, studies on techniques for upscaling low-resolution (LR) image inputs in object recognition are still lacking. Therefore, in this paper, to address this problem of object recognition degradation, we develop techniques for image super-resolution (SR) and object recognition studies to transform LR images into high-resolution (HR) images through SR techniques as a means of achieving higher recognition rates. Research using image SR technology to improve object recognition accuracy will produce higher recognition rates in future real-world object recognition applications, such as a smart parking system that can manage parking lots without a person, an intelligent transportation system that can administrate the traffic situation efficiently, and text-to-speech.
Our contributions in this paper are summarized threefold as follows:
- We proposed the new loss function that can augment data without the addition of data capacity by using the flip function. It trains the parameters of the SR neural network so that the SR result is robust to left-right reversal.
- We proposed simple yet advanced methods of collecting data. The proposed web-crawling method would be helpful to collect the ready-made datasets which are available on the website. Another one is the proposed artificial license plate image generation that will be helpful in new fields such as scene text recognition research for data augmentation.
- We integrated the SR network and character recognition neural network, and derived the optimized result by learning the proposed model with self-collected training data.
2. Related Works
2.1. Super-Resolution (SR)
SR technology, which converts LR images into HR images, is a major computer vision field. The SR method designates the original high resolution (HR) as the ground truth that needs to be restored, improves the resolution of the LR, and makes the restored image equal to the original HR image.
The typical criteria for measuring the quality of an SR image is the ratio of noise power to the maximum power a signal can have. That is, the peak signal to noise ratio (PSNR) and structural similarity (SSIM) used to evaluate the distortion of structural information. Recently, with the growing interest in convolutional neural networks (CNNs), CNNs have been utilized in several computer vision fields, and techniques using CNNs have been proposed in SR fields [1,2,3,4,5,6,7,8,9,10,11,12,13,14,15].
CNN-based SR technology is a method of restoring LR images through multiple convolutional layers into which LR images are inputted. Based on the loss function, it is possible to train the CNNs to minimize their values by defining the sum (L1 loss) of the difference between the original and predicted values, and the sum (L2 loss) of the difference between the original and predicted values can also be minimized. SRCNN [1] was the first method to utilize a CNN for high resolution conversion problems, outperforming example-based learning methods (example-based SR [2]) and sparse coding methods (sparse coding-based SR [3]) using LR–HR image pairs. At the time, the SRCNN showed the highest performance among any high resolution conversion method. However, SRCNN scaled LR images via linear interpolation, passing enlarged images through CNNs to obtain a resilient image, which required substantial computing power due to the HR-domain CNNs and had limitations in accuracy because it used only three layers of CNNs.
Accordingly, deep neural network utilization and various neural network lightening techniques have been proposed to improve performance. Subsequently, methods such as FSRCNN [4] and ESPCN [5] improved performance by reducing computing power and increasing the number of CNN layers using LR images as CNN inputs and by expanding the size of the output layers. However, as the CNN layer deepens, there is a gradual loss of information from the front layer through each subsequent layer. Thus, several methods have been proposed in subsequent studies to address this problem. An EDSR [6] technique using skip connection-based residual learning (ResNet [7]) was proposed. This technique demonstrated that batch regularization had little effect on HR image restoration problems and eliminates them; the input images were connected directly to output terminals. Additional methods have been proposed, such as VDSR [8], which utilizes both ResNet and VGGNet [9] structures, and DBPN [10] and RDN [11], which utilize DenseNet [12], to connect all networks. DBPN undergoes repeated up-sampling and down-sampling during the learning process and learns by calculating the difference from the source at each layer and providing feedback to reduce the reconstruction error at the next learning stage.
In addition, even newer CNN techniques, such as DRN [13], USRNet [14], and MZSR [15], were proposed. Unlike conventional models that typically use a single loss value, DRN adds a double regression loss to the existing loss and combines the two loss values to use as its loss function. Double regression loss limits the down-sampling of images restored from LR to resemble the input LR images. The USRNet and MZSR methods, unlike other models that typically train using only the bicubic kernel, were proposed to perform robust SR in various kernel environments. USRNet is a method of restoring images by setting and adjusting the noise level and kernel type as hyper parameters, whereas MZSR is a method of restoring images that is more flexible under actual blue conditions by training on various kernels.
2.2. Object Recognition
Among the various object recognition technologies, character recognition technology uses computer vision to detect vehicle license plate locations and recognize the vehicle numbers, and this application is widely used for real-life services, such as smart transportation and smart parking. The goal of this technology is to correct traffic regulations by recognizing the number of vehicles that are speeding or violating signals and to accurately recognize the number of vehicle plates that are geometrically distorted or unrecognizably damaged. In this context, character recognition consists of a license plate detector, which detects the area of a license plate in a vehicle image by passing the vehicle image to a CNN, and a character recognizer, which recognizes the internal letters from the detected license plate. Intersection over union (IoU) and mean average precision (mAP) can be used as criteria for measuring the performance of license plate detectors and character recognizers. IoU is a metric of evaluating a model by calculating the ratio of the intersection and aggregation between the detection results predicted by the model and the location of the actual object. In general, if the IoU value exceeds 0.5, then the speculative model has properly detected the position of the object. mAP is a calculation that evaluates the accuracy of object recognition CNNs, which is defined as the proportion of information recognized through the CNN that matches the label of the actual object.
A wide range of research has been conducted on vehicle license plate detection and character recognition techniques [16,17,18,19,20]. In Korea, a license plate database was constructed by virtually generating an artificial license plate similar to an actual vehicle license plate and applying six data expansion methods to the generated license plate. Accordingly, a method was proposed to solve problems of data shortage, which is a major challenge in training CNNs [16]. Traditional artificial data generation methods often result in models that do not recognize license plates at various angles because they only generate images of front-facing license plates. Therefore, a method for building a three-dimensional, rotation-based artificial license plate database has been proposed to address this problem [17]. We previously proposed a method to merge license plate detection and license plate recognition into a single network to improve local binary pattern (LBP)-based cascaded detector quality using minimal CNNs [18]. SSD [19] is a method of object recognition using a single deep neural network, wherein the bounding box in the output space is separated using a base space with various aspect ratios and scales, and then the final bounding box is generated. CCPD [20] has collected more than 250,000 license plates to help address the inadequacy of a license plate database and to address the low recognition problem and has built large datasets that are approximately 30GB in size, providing 100,000 learning datasets and 150,000 test datasets. This is significant in addressing the problem of data scarcity in future license plate recognition studies through the establishment of large license plate databases.
3. Proposed Method
3.1. Training SR Networks
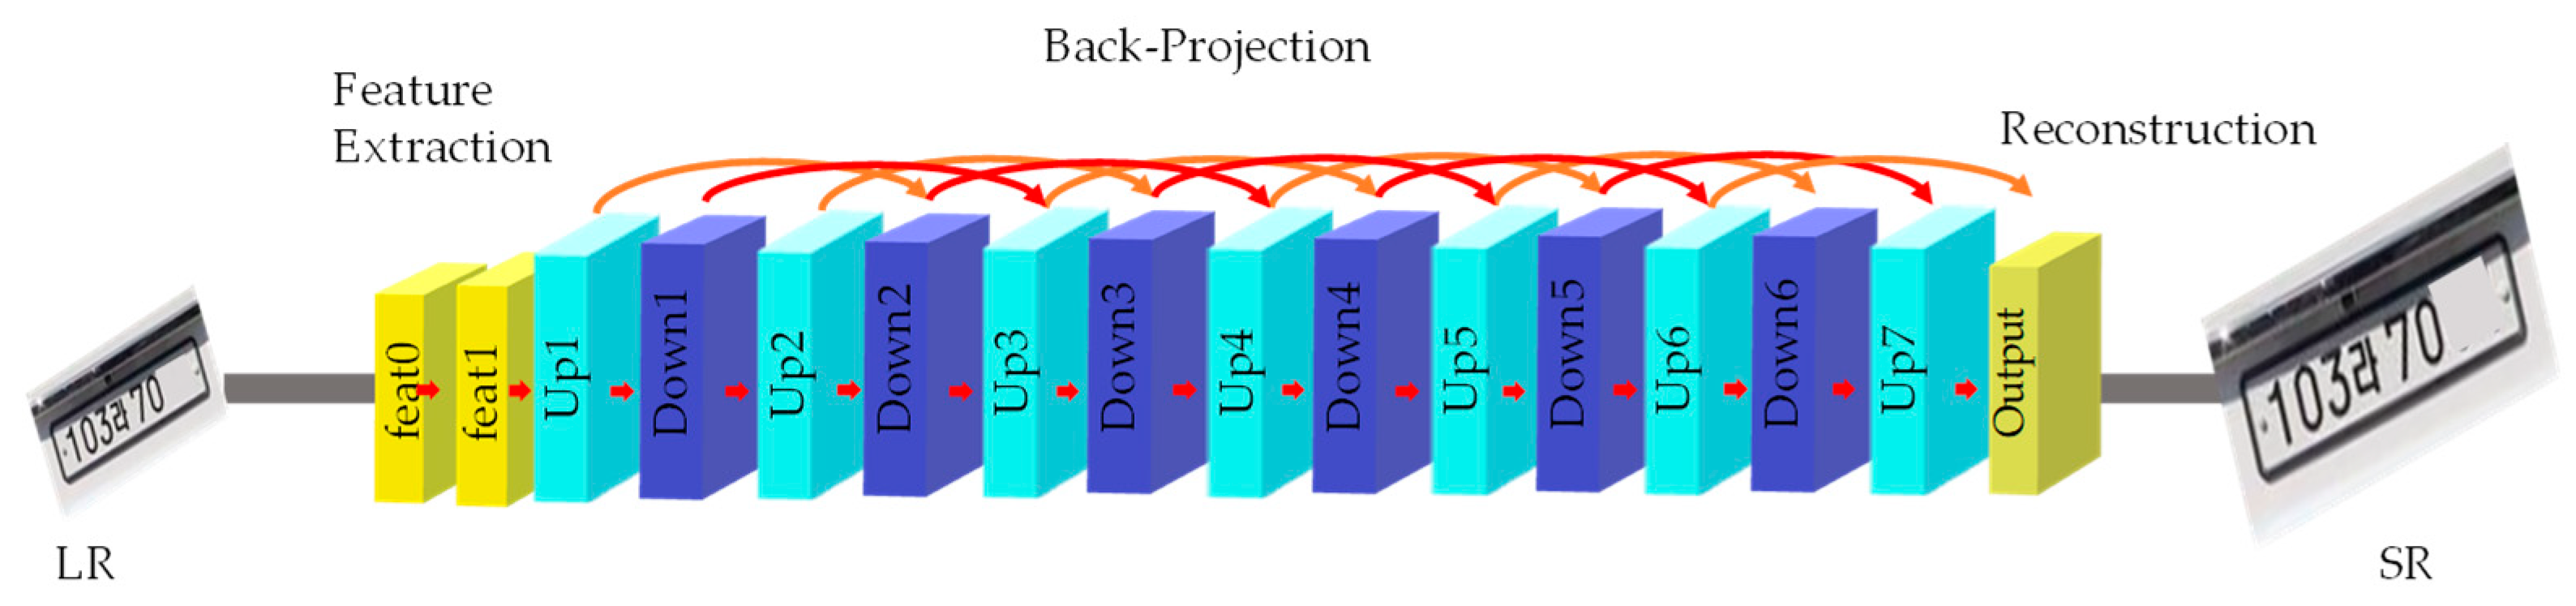
For SR neural network training, we collected a total of 13,230 license plate images from web crawl and by synthetic generation and divided them into a training set and a validation set. The training set is 11,231 HR license plate images and the validation set is 1999 HR license plate images. LR images were acquired by reducing the size of the HR images collected through biological interpolation. Neural network parameters were trained to restore the images via SR artificial neural networks to make them look similar to the original. In this work, the DBPN [10] method was benchmarked, modified, and improved for license plate image SR. The proposed method, as presented in Figure 1, underwent repeated up-blocks and down-blocks through multiple CNN layers in the learning process.
In this paper, various data extensions, such as rotations, perspective transformations, and crops, were used for training the SR artificial neural networks. In addition, hyper parameters were set and used (as shown in Table 1) to expand various magnifications, such as 2×, 3×, and 4×.
The proposed method consists of SR and character recognition. The computational time of the proposed SR method for different scale factors of 2×, 3×, and 4× is as follows. Given the ground-truth HR image with 144 × 96 pixels, the proposed SR method takes 0.9 ms for a LR image with 72 × 48 pixels and 2× scale factor, 1.0 ms for a LR image with 48 × 32 pixels and 3× scale factor, and 1.1ms for a LR image with 36 × 24 pixels and 4× scale factor. The computational time of the proposed character recognition model takes 2.1 ms for a input image with 128 × 128 pixels.
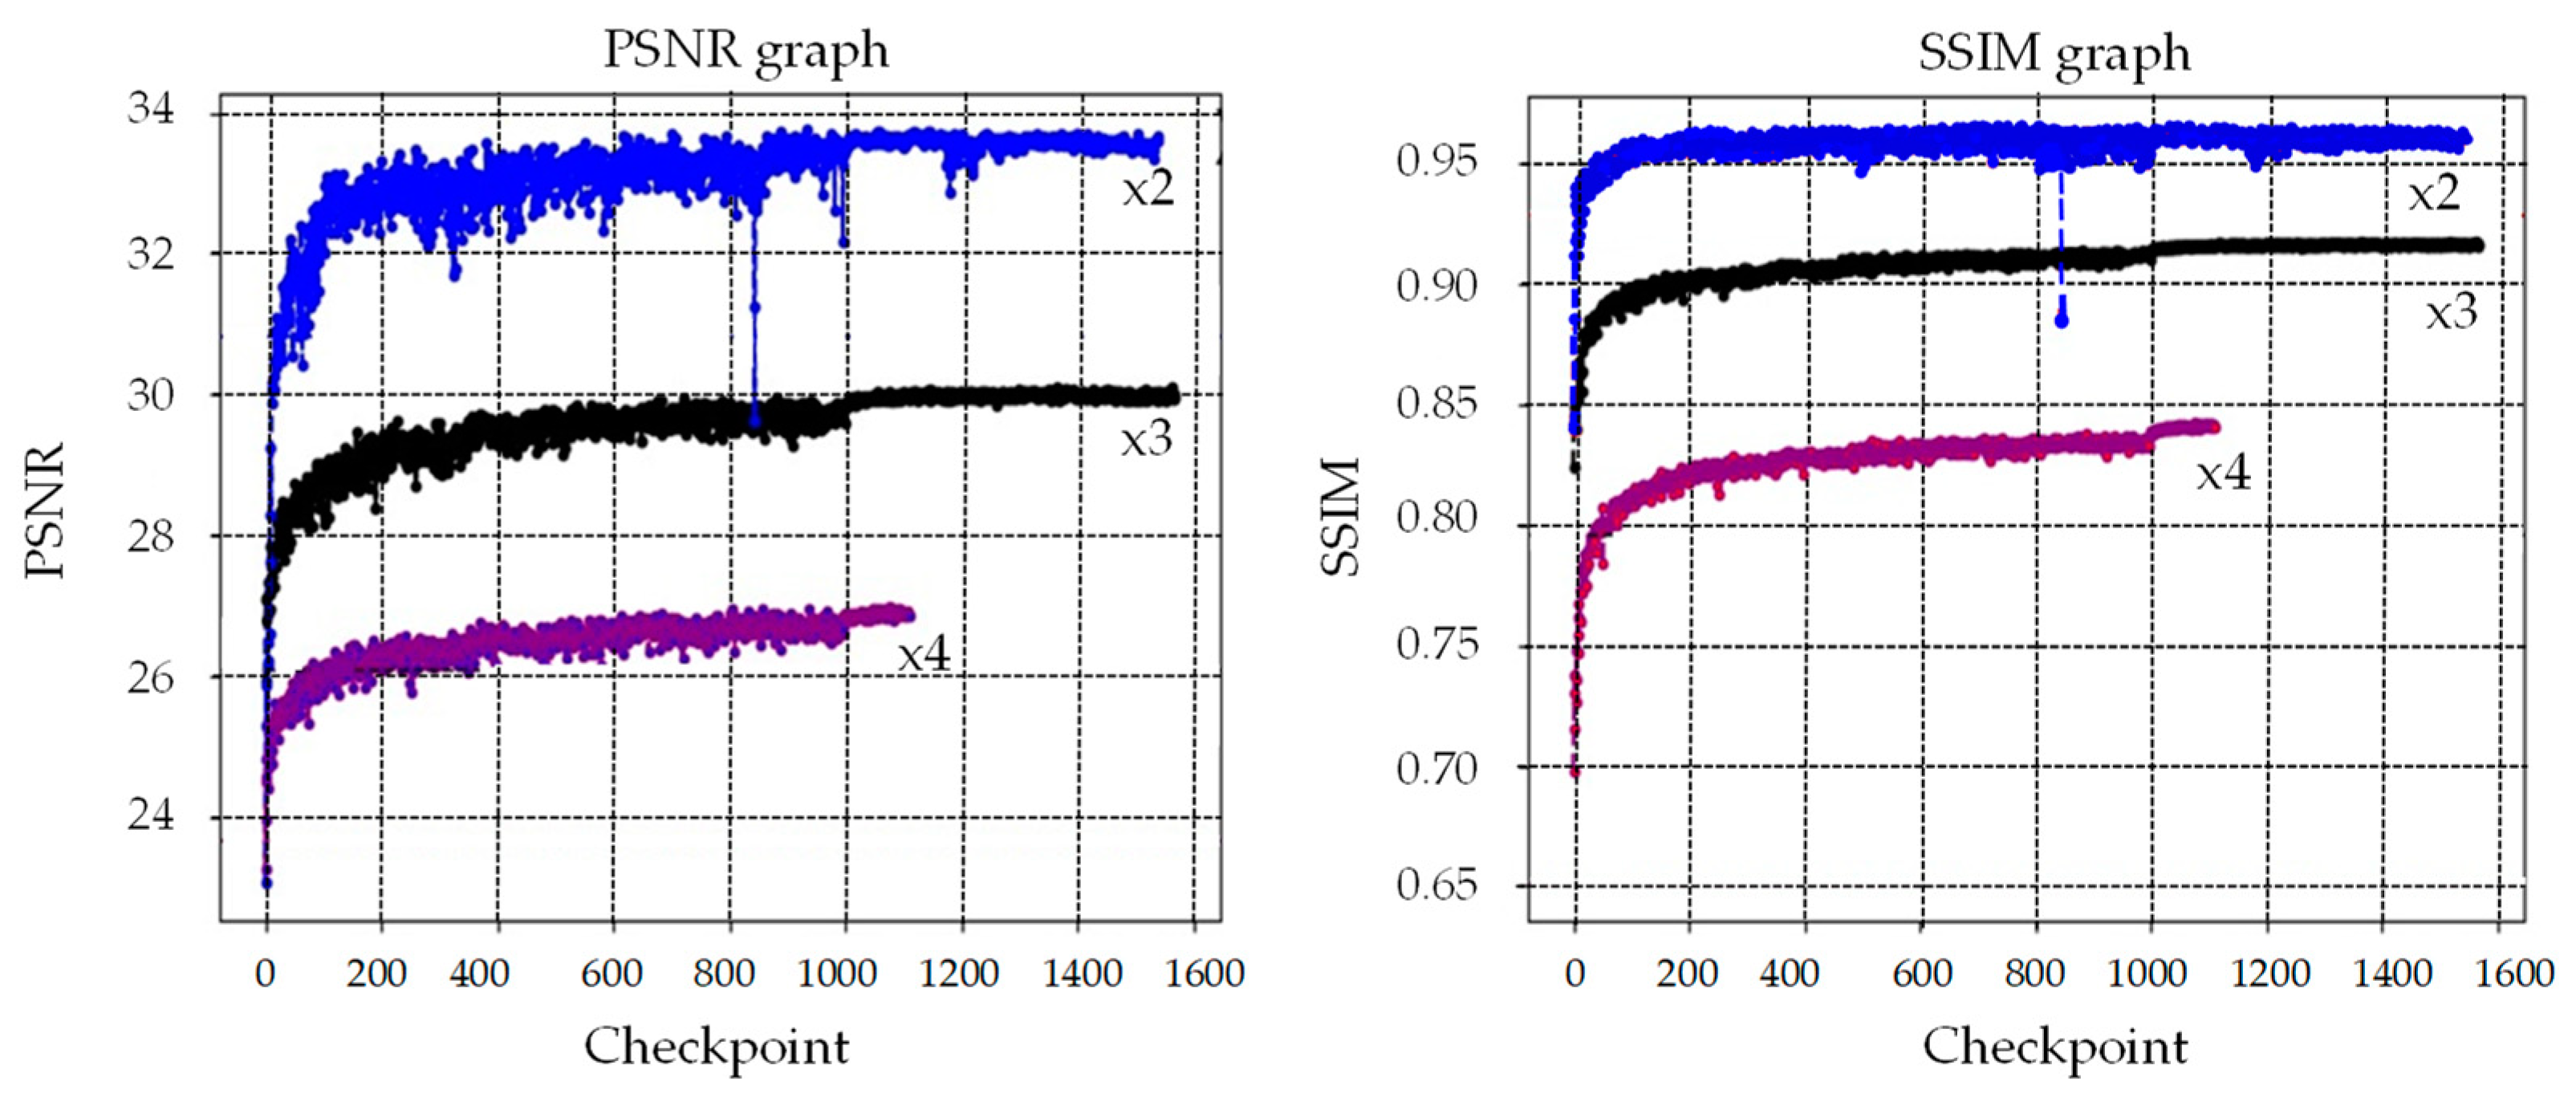
Figure 2 shows the changes in the mean PSNR and mean SSIM according to the proposed SR artificial neural network checkpoint. A total of 1999 license plate images were used as data sets for verification. Overall, it can be seen that the value gradually increases, then increases significantly around checkpoint 1000, and then no longer changes and is saturated. The blue graph represents 2× SR results, the black graph represents 3× SR results, and the purple graph represents 4× SR results.
In this work, we propose a new loss function for improving the performance of the SR network, as depicted in Figure 3. The loss function is defined as
where n denotes the number of training images, denotes the i-th LR training image, denotes the SR result of , and denotes the i-th HR training image corresponding to the SR image . In addition, flip(·) denotes the function that inverts left and right sides from the input image. The flip loss function enables us to train the parameters of the SR neural network so that the SR result is robust to left–right reversal. As shown in Figure 3, for flip loss calculations, the left–right inverted LR image was passed through the SR artificial neural network to obtain an additional flipped SR. Then, we obtained a re-flipped SR that originally reversed the restore image back to its original side and calculated the sum of the absolute values of the original SR image and the re-flipped SR image to obtain flip loss. Additionally, the original loss was obtained by applying the input LR image to the SR artificial neural network and by calculating the sum of the obtained restored image and the absolute value of the difference between it and the HR image. Finally, the total loss was calculated by combining the flip loss and original loss. Our image SR model was trained in the direction of reducing this total loss.
3.2. Training Chracter Recognition Networks
In this study, vehicle image data was collected through a web crawl using the BeautifulSoup Library. BeautifulSoup is a Python-based library that can load and store desired data from HTML or XML web pages, allowing data to be extracted to fit a specific format. The web crawler is a module that facilitates the viewing of all the information posted on the browser, as well as the storage of that information locally in an easy-to-use manner, As shown in Algorithm 1, the pseudocode capable for performing web crawl was implemented to collect the necessary data.
| Algorithm 1. Web-crawling code |
|
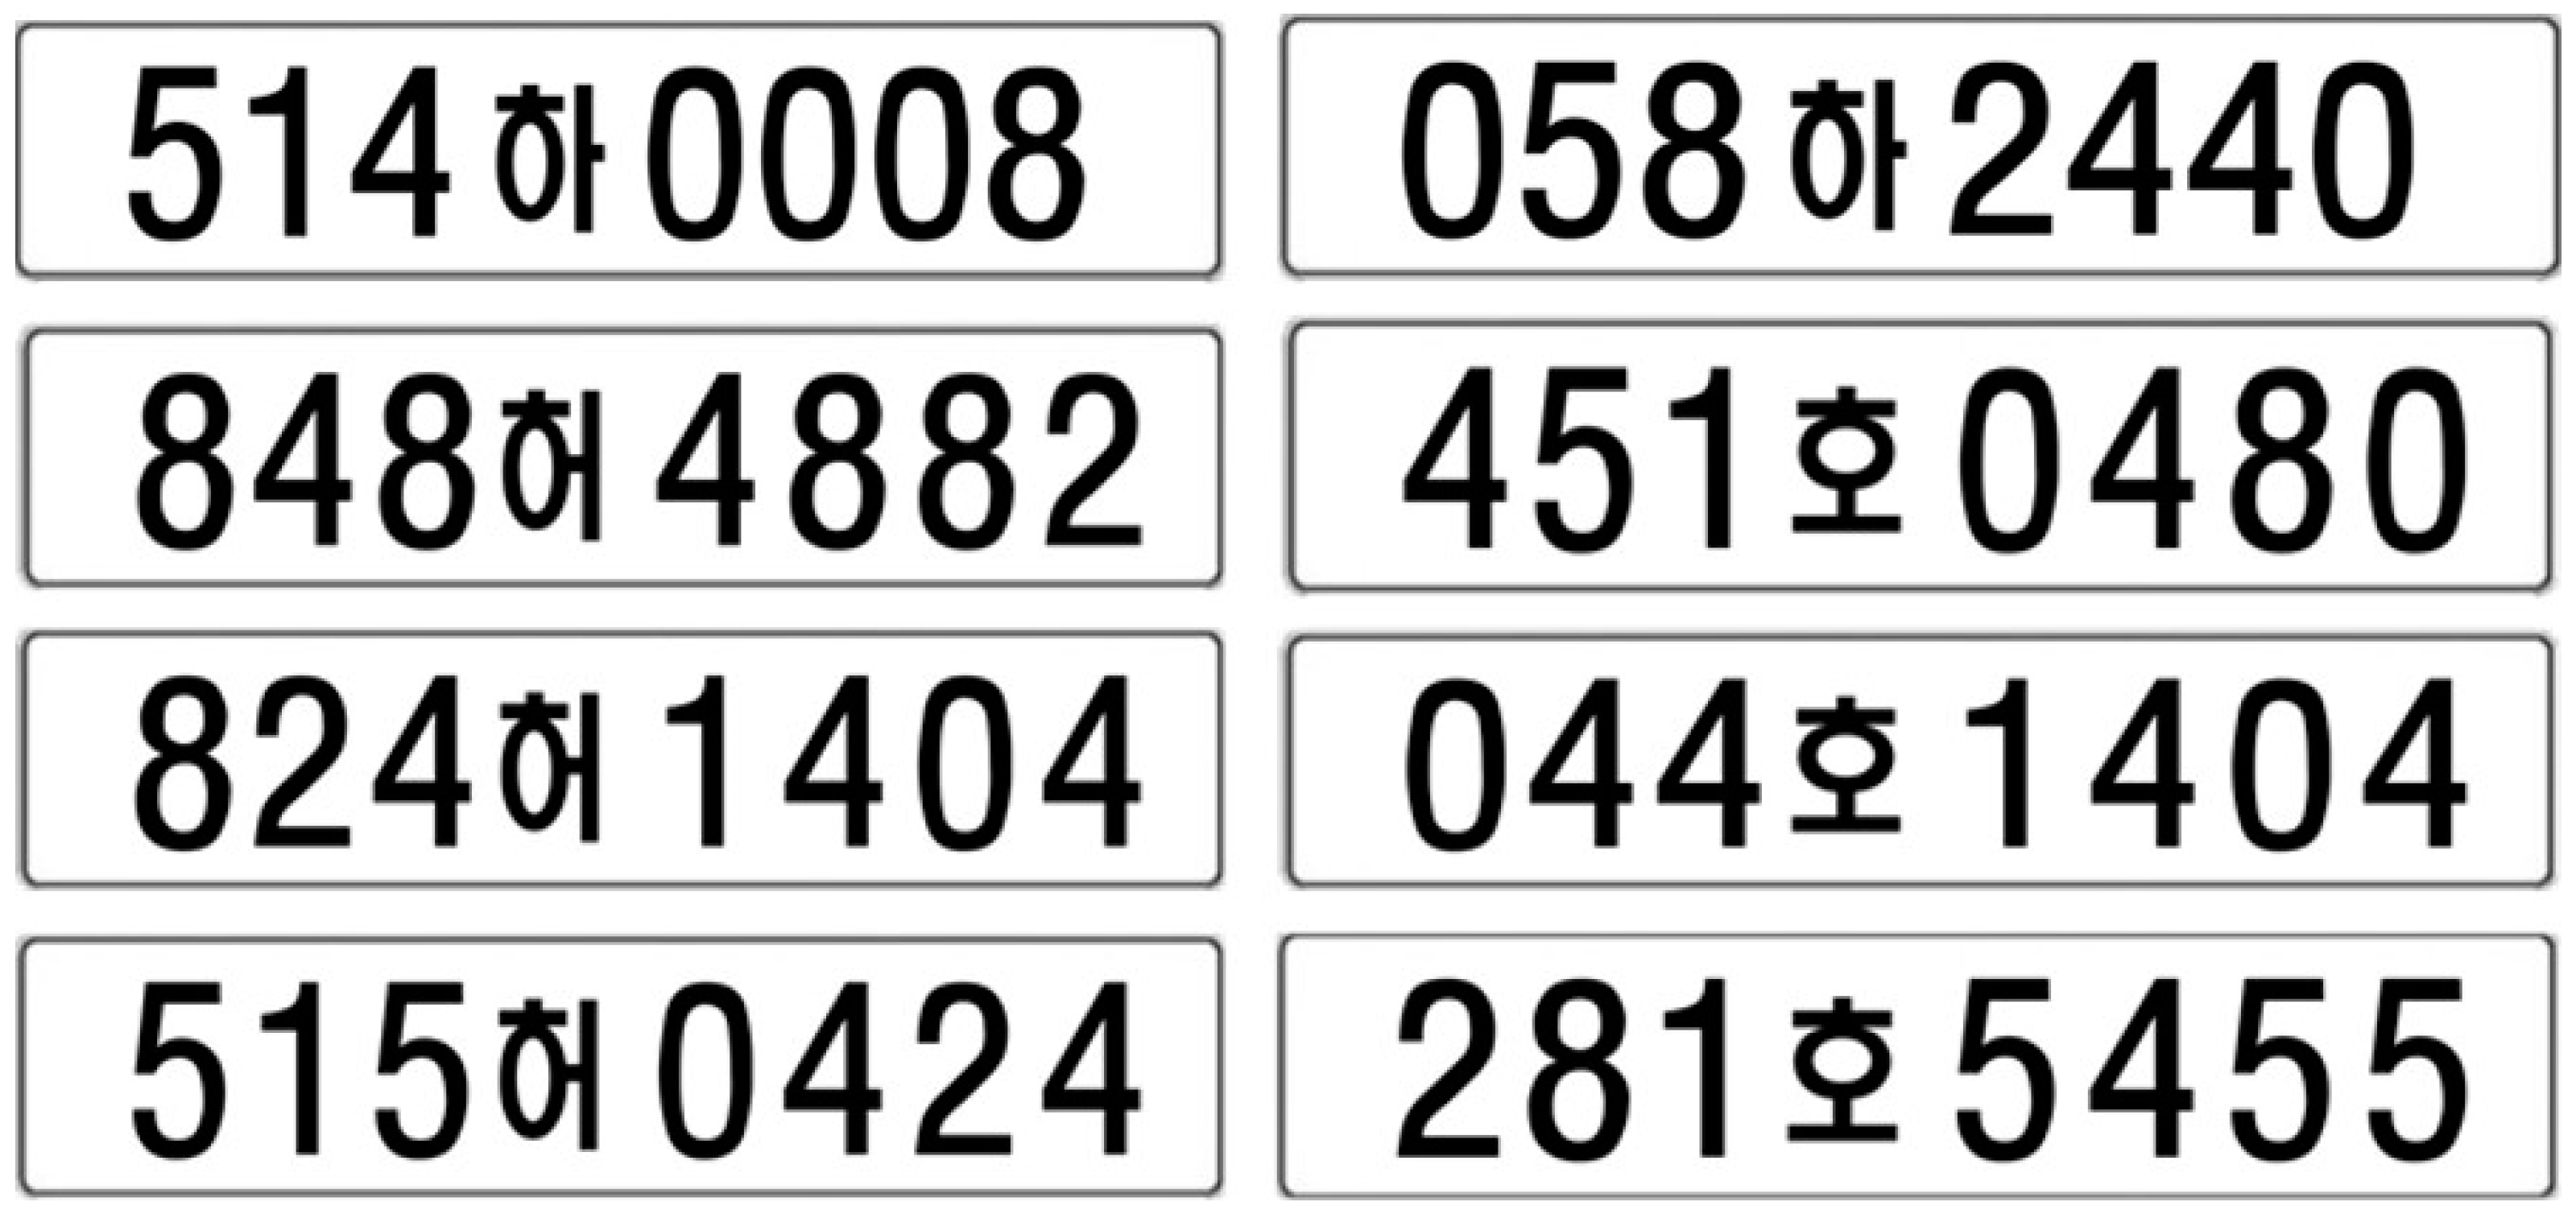
During the process of collecting real-world data through web crawl, we encountered a shortage in the Korean character data. We implemented the source code for generating synthetic license plates using OpenCV-based traditional methods [21] to compensate for the lack of data, as shown in Algorithm 2. Figure 4 presents an example of artificially generated 8-digit license plates.
| Algorithm 2. Artificial license plate image generation code |
|
To perform character recognition with the developed database, we designed and trained a two-step CNN model for vehicle character recognition. The first CNN model is intended to detect the license plate region within the input image. This model outputs the character region coordinates of the license plate region when passed through a neural network. The second CNN model is for character recognition, which receives cropped license plate images and outputs the characters, types, and locations of Korean characters in the license plate. We designed a two-step neural network model using the Darkflow [22] open source module with real-time character recognition, and individually trained two neural network parameters using the data we collected through web crawl and artificial data generation. For training the character recognition network, 122 classes were defined as presented in Table 2. We trained the character recognition network with 11,231 HR license plate images, which are the same in the training of the SR network, and we tested the character recognition network with 200 HR license plate images. Among 1999 validation images for the SR network, we selected 200 representative images as the validation set of the character recognition and labeled each character for 200 images by ourselves to validate the performance of the character recognition.
3.3. Integrated Framework for Improving the Recognition Accuracy
The general process of character recognition can be described as follows. The license plate area is cropped and extracted from the entire image. The extracted license plate image acts as input for the neural network, and the trained neural network recognizes the positions and labels of each character. Although interpolation methods, such as bicubic interpolation, can be used to resize the license plate to the input size of the neural network, these methods reduce clarity during the image magnification process. To address such problems, this work proposes a restoration preprocessing technique for images using SR. As shown in Figure 5, the license plate image, which is an LR image, is cropped from the car image. SR network extracts the feature of cropped license plate image, and improve the resolution of image with iterative up and down blocks. The character recognition network input the SR image to backbone model of character recognition neural network. The backbone model of character recognition neural network, Focus layer and CSP1 layer, extracts feature of input image by combining and shaping image features at different granularities. The neck model of character recognition neural network, CSP2 layer, and PANet aggregate image features to deliver them forward to character prediction of image. And finally, the head model predicts the box and the class of input image. The recognition rate can be improved by improving the clarity of the character through the proposed SR technique before the license plates that are extracted from the vehicle image enter the input of the character recognition neural network. Without the SR process, some characters can become degraded and difficult to recognize when recognizing vehicle characters in images. The proposed technique enables such characters to have high-definition clarity. The recognizer’s character recognition rate can be improved with characters having high brightness, with their resolution close to that of the characters learned by the recognition neural network. By utilizing neural network weights trained separately using only vehicle license plate image data, which is the character class of interest, we can obtain highly accurate vehicle license plate restoration results compared to universal SR neural networks that cover various character classes at once.
4. Results
4.1. Results of SR
To verify the performance of the SR neural networks trained in Section 3.1, we measured the PSNR and SSIM and compared the restored SR images after SR restoration and the original HR images using 1999 cropped license plate images. The proposed SR method has superior performance in restoring the quality of license plates compared to the conventional method, as demonstrated in Figure 6, Figure 7 and Figure 8 and Table 3. For example, Figure 6 compares the results of existing SR techniques and the proposed SR method. Since the shapes of Korean letters tend to be more complex than that of the numbers in the license plate image, Korean letters can be more blurred than the numbers in the LR license plate image. As in Figure 6b which is the input of the SR network, when the LR bicubic image’s quality is low and the character is heavily blurred, the LR character is hard to restore. In Figure 6g, while the numbers in the image are clear, other shapes are still unclear. Nevertheless, we note that the proposed image restoration performance is superior to or equivalent to existing state-of-the-art SR methods, and the proposed method provides much clearer results in the boundary edge area of other characters or numbers in the license plate image. These results allow us to qualitatively confirm that the proposed SR method has superior resolution improvements over conventional methods. Table 3 presents the performance of several SR techniques using the PSNR and SSIM. This quantitatively demonstrates the effectiveness of the proposed SR method.
4.2. Results of Character Recognition
Figure 9 presents the mAP results for 200 test sets (150 new 8-digit license plates and 50 electric vehicle license plates) measured using a two-stage character recognition neural network model. As shown in Figure 9a, due to insufficient Korean license plate data, for some characters, such as 113(하), 115(호), and 116(허), the character recognition neural network did not recognize Korean letter classes, and achieved an mAP score of 87.14%. To improve this, the additional building and training using the data obtained through web crawl and synthetic data generation achieved an mAP score of 95.30%. This was obtained by gradually improving the character recognition rates for other classes and by recognizing all of the problematic Korean letter classes, as shown in Figure 9b.
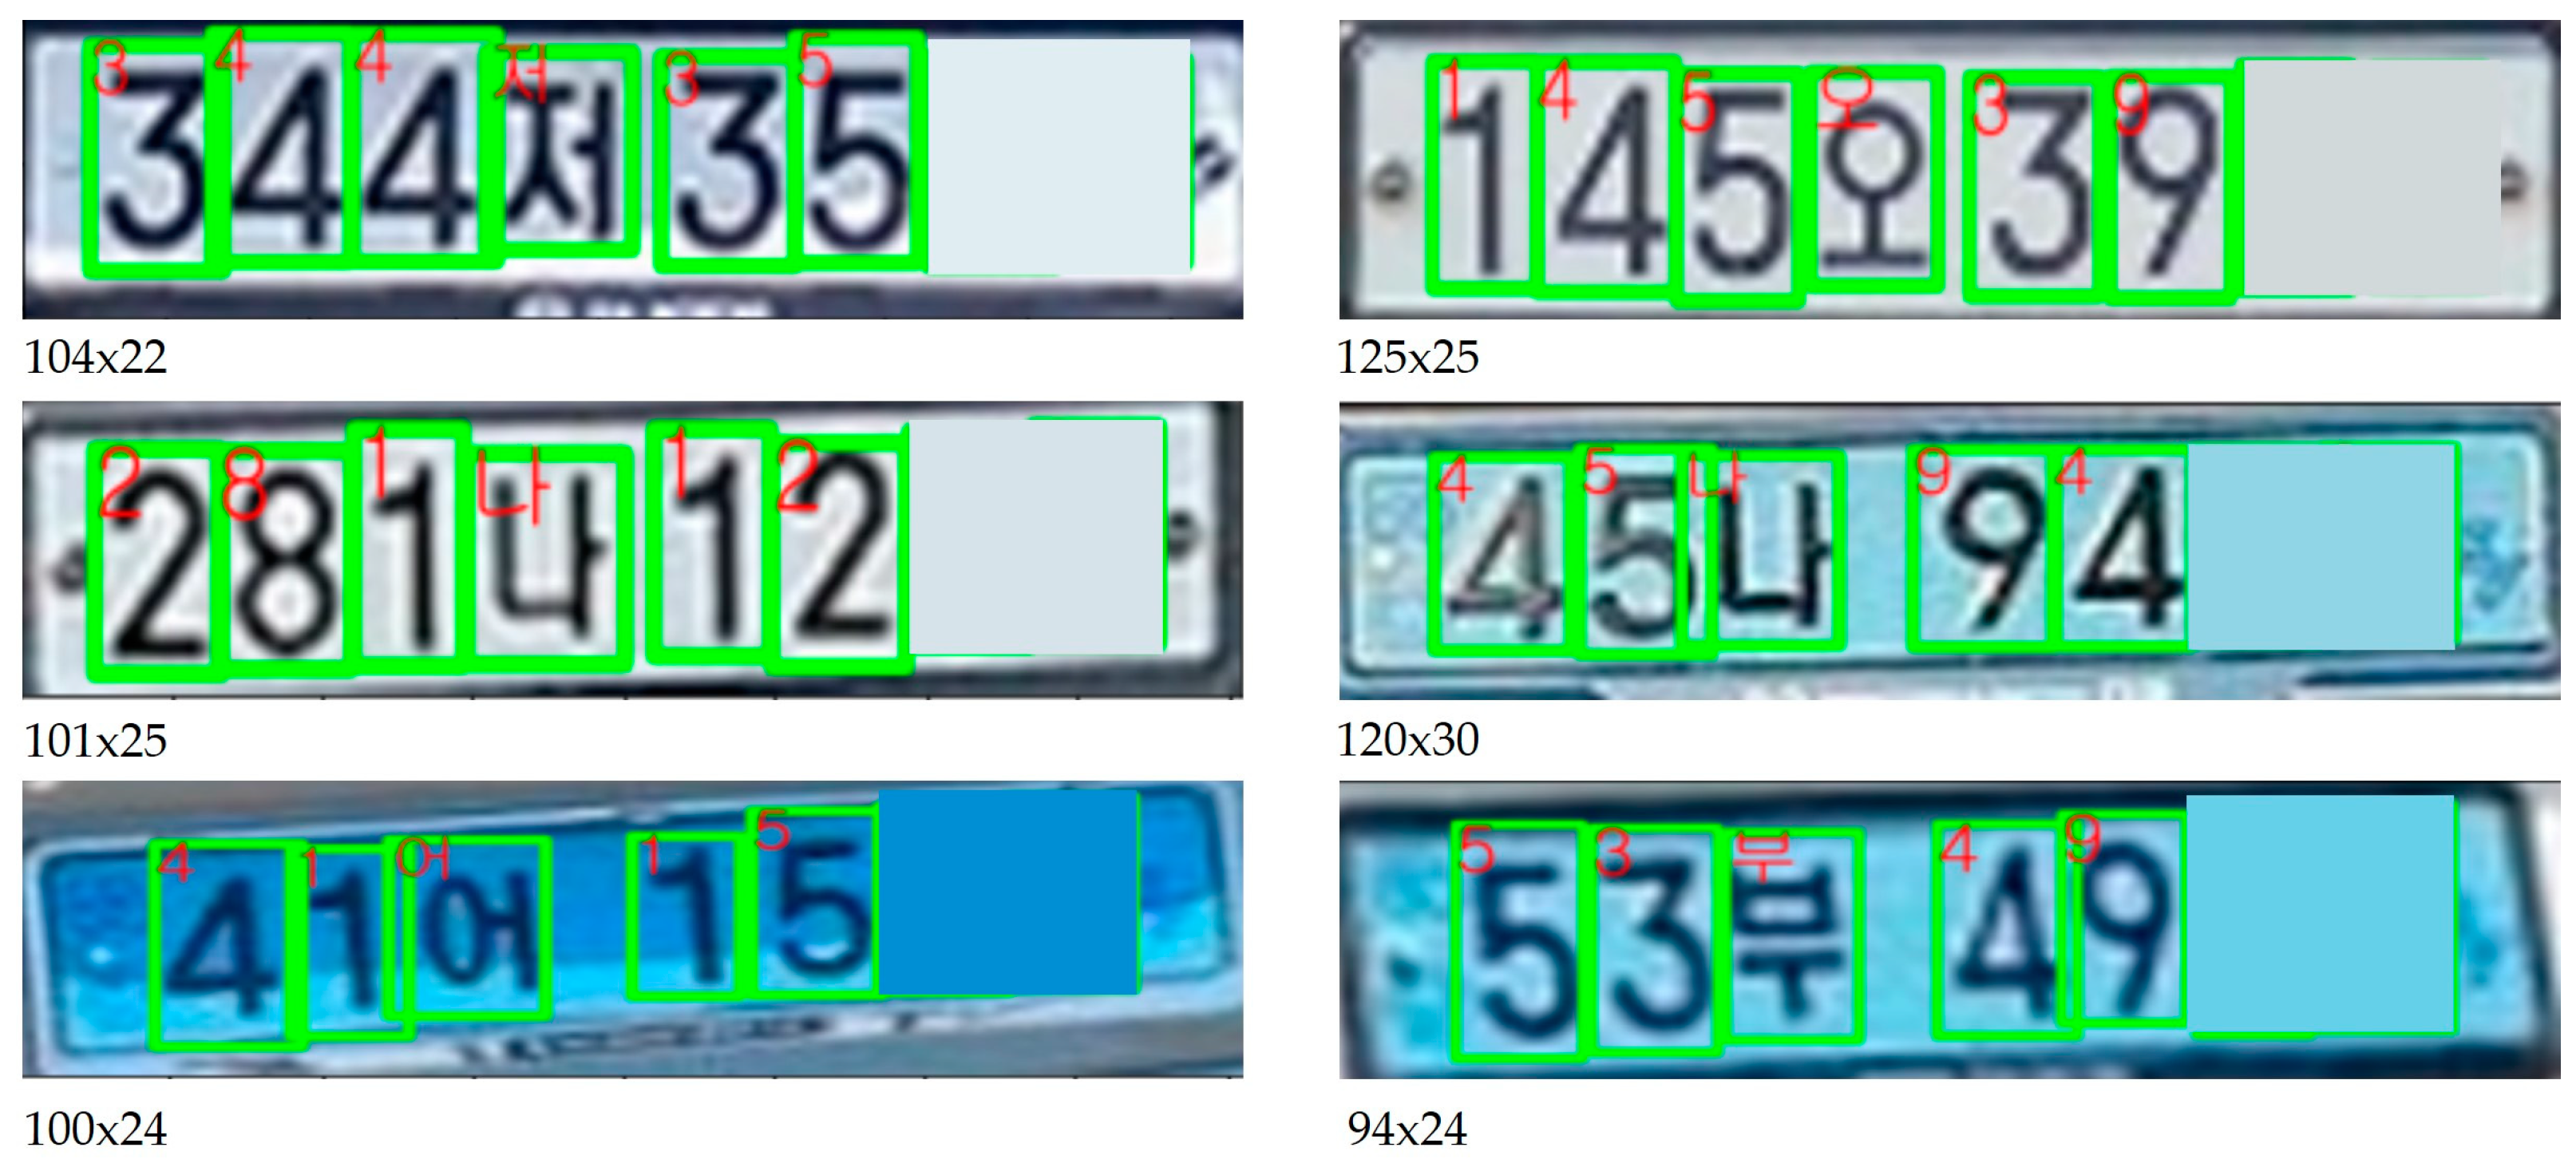
Figure 10 and Figure 11 present the results of detection and text recognition of the new 8 digits and the electric vehicle license plates, respectively. Figure 10 shows the license plate area detection and character recognition results from the vehicle image together, whereas Figure 11 shows the results of the character region detection and label information recognition from the cropped license plate images. For reference, the number plate recognition processing speed in the video was approximately 30 fps or higher, thus achieving real-time processing.
In addition, the character recognition algorithm proposed in this study can be extended to the recognition of vehicle license plate characters in other countries through re-the training of neural networks without any change to our algorithm. Unfortunately, however, there are few open license plate datasets due to issues such as personal information privacy, so it cannot be applied immediately. If other foreign license plate data is available in the future, our character recognition algorithm can be extended and applied to other foreign characters.
4.3. Integrated Results of SR and Character Recognition
This section presents the performance improvements in character recognition from using SR techniques. Image quality was improved using the proposed SR technique after converting the original license plate image into 2×, 3×, and 4× LR images, which were degraded by bicubic interpolation. As can be seen in Table 3, the images were improved through SR. These images possessed higher PSNR values than the LR images. However, the higher PSNR values cannot guarantee image quality, because higher PSNR values do not necessarily mean that our proposed SR technique was effective with respect to character recognition. This is because comparing the similarities between HR and SR images can result in a high PSNR calculation due to superficial similarities, such as in color or the position of letters, even if their shape is distorted in the process of improving the quality of letters or numbers. Therefore, we aimed to verify whether the proposed SR technique could improve the performance of character recognition by utilizing the character recognition neural network. When measuring the recognition rate from the license plate images in Figure 12 and Figure 13, we observed that the data were detected by the license plate recognizer only when the confidence of the data was over 50%. Although the perceived confidence of images, with improved quality owing to the SR techniques, was similar to that of the original HR images, the degree of image quality improvement was not significant in the case of double magnification. However, with enhancement in the image quality owing to the 3× and 4× magnification SR techniques, the recognition rate was significantly improved, as the letters not recognized in the LR image were newly recognized in the SR image, as observable in Figure 12 and Figure 13. Meanwhile, in the case of bad weather conditions (nighttime, heavy rain, heavy snow, etc.) or the angle of the license plate in the video is rotated a lot, the proposed algorithm often gives wrong results. The several wrong results from bad conditions such as nighttime and rotation situations are shown in Figure 14. For example, there are some missing and false recognition results in Figure 14b. The proposed algorithm often provides a failure case when there is a bad weather environment or when the angle of the license plate in the image is rotated too much. This is considered a limitation of the current algorithm, and the limitation is expected to be resolved via the application of an additional data augmentation technique.
The evaluation was conducted using mAP to quantitatively verify how many license plate numbers and letters recognized in this manner were accurate. By scaling 1999 LR license plate images through biological interpolation, mAP was measured by applying proposed SR technology instead of biological interpolation. Comparisons were made with the results in Figure 15, Figure 16, Figure 17 and Figure 18. This demonstrates that the character recognition accuracy for LR images was significantly lower than that for HR images.
The mAP did not exhibit a significant improvement for SR images because the performance of the original image was not significantly different from the quality of the 2× LR images. Meanwhile, Figure 15 shows the character recognition mAP results for 3× LR, SR, and HR images, from left to right. From this, we can observe that all of the class (0–121)-specific mAPs (35.56%) for the SR image results were 13.56% higher than the mAP (22.00%) calculated for the LR images, which was closer to the mAP results (96.7%) of the HR images. This result shows that SR is a technology that has a positive impact on the performance of character recognition software. In addition, Figure 16 shows the mAP results for a numeric class (0–9) for LR, SR, and HR images. The numerical class for SR image results (0–9) mAP (71.80%) was increased by 27.90% when compared to the mAP (43.90%) for LR images.
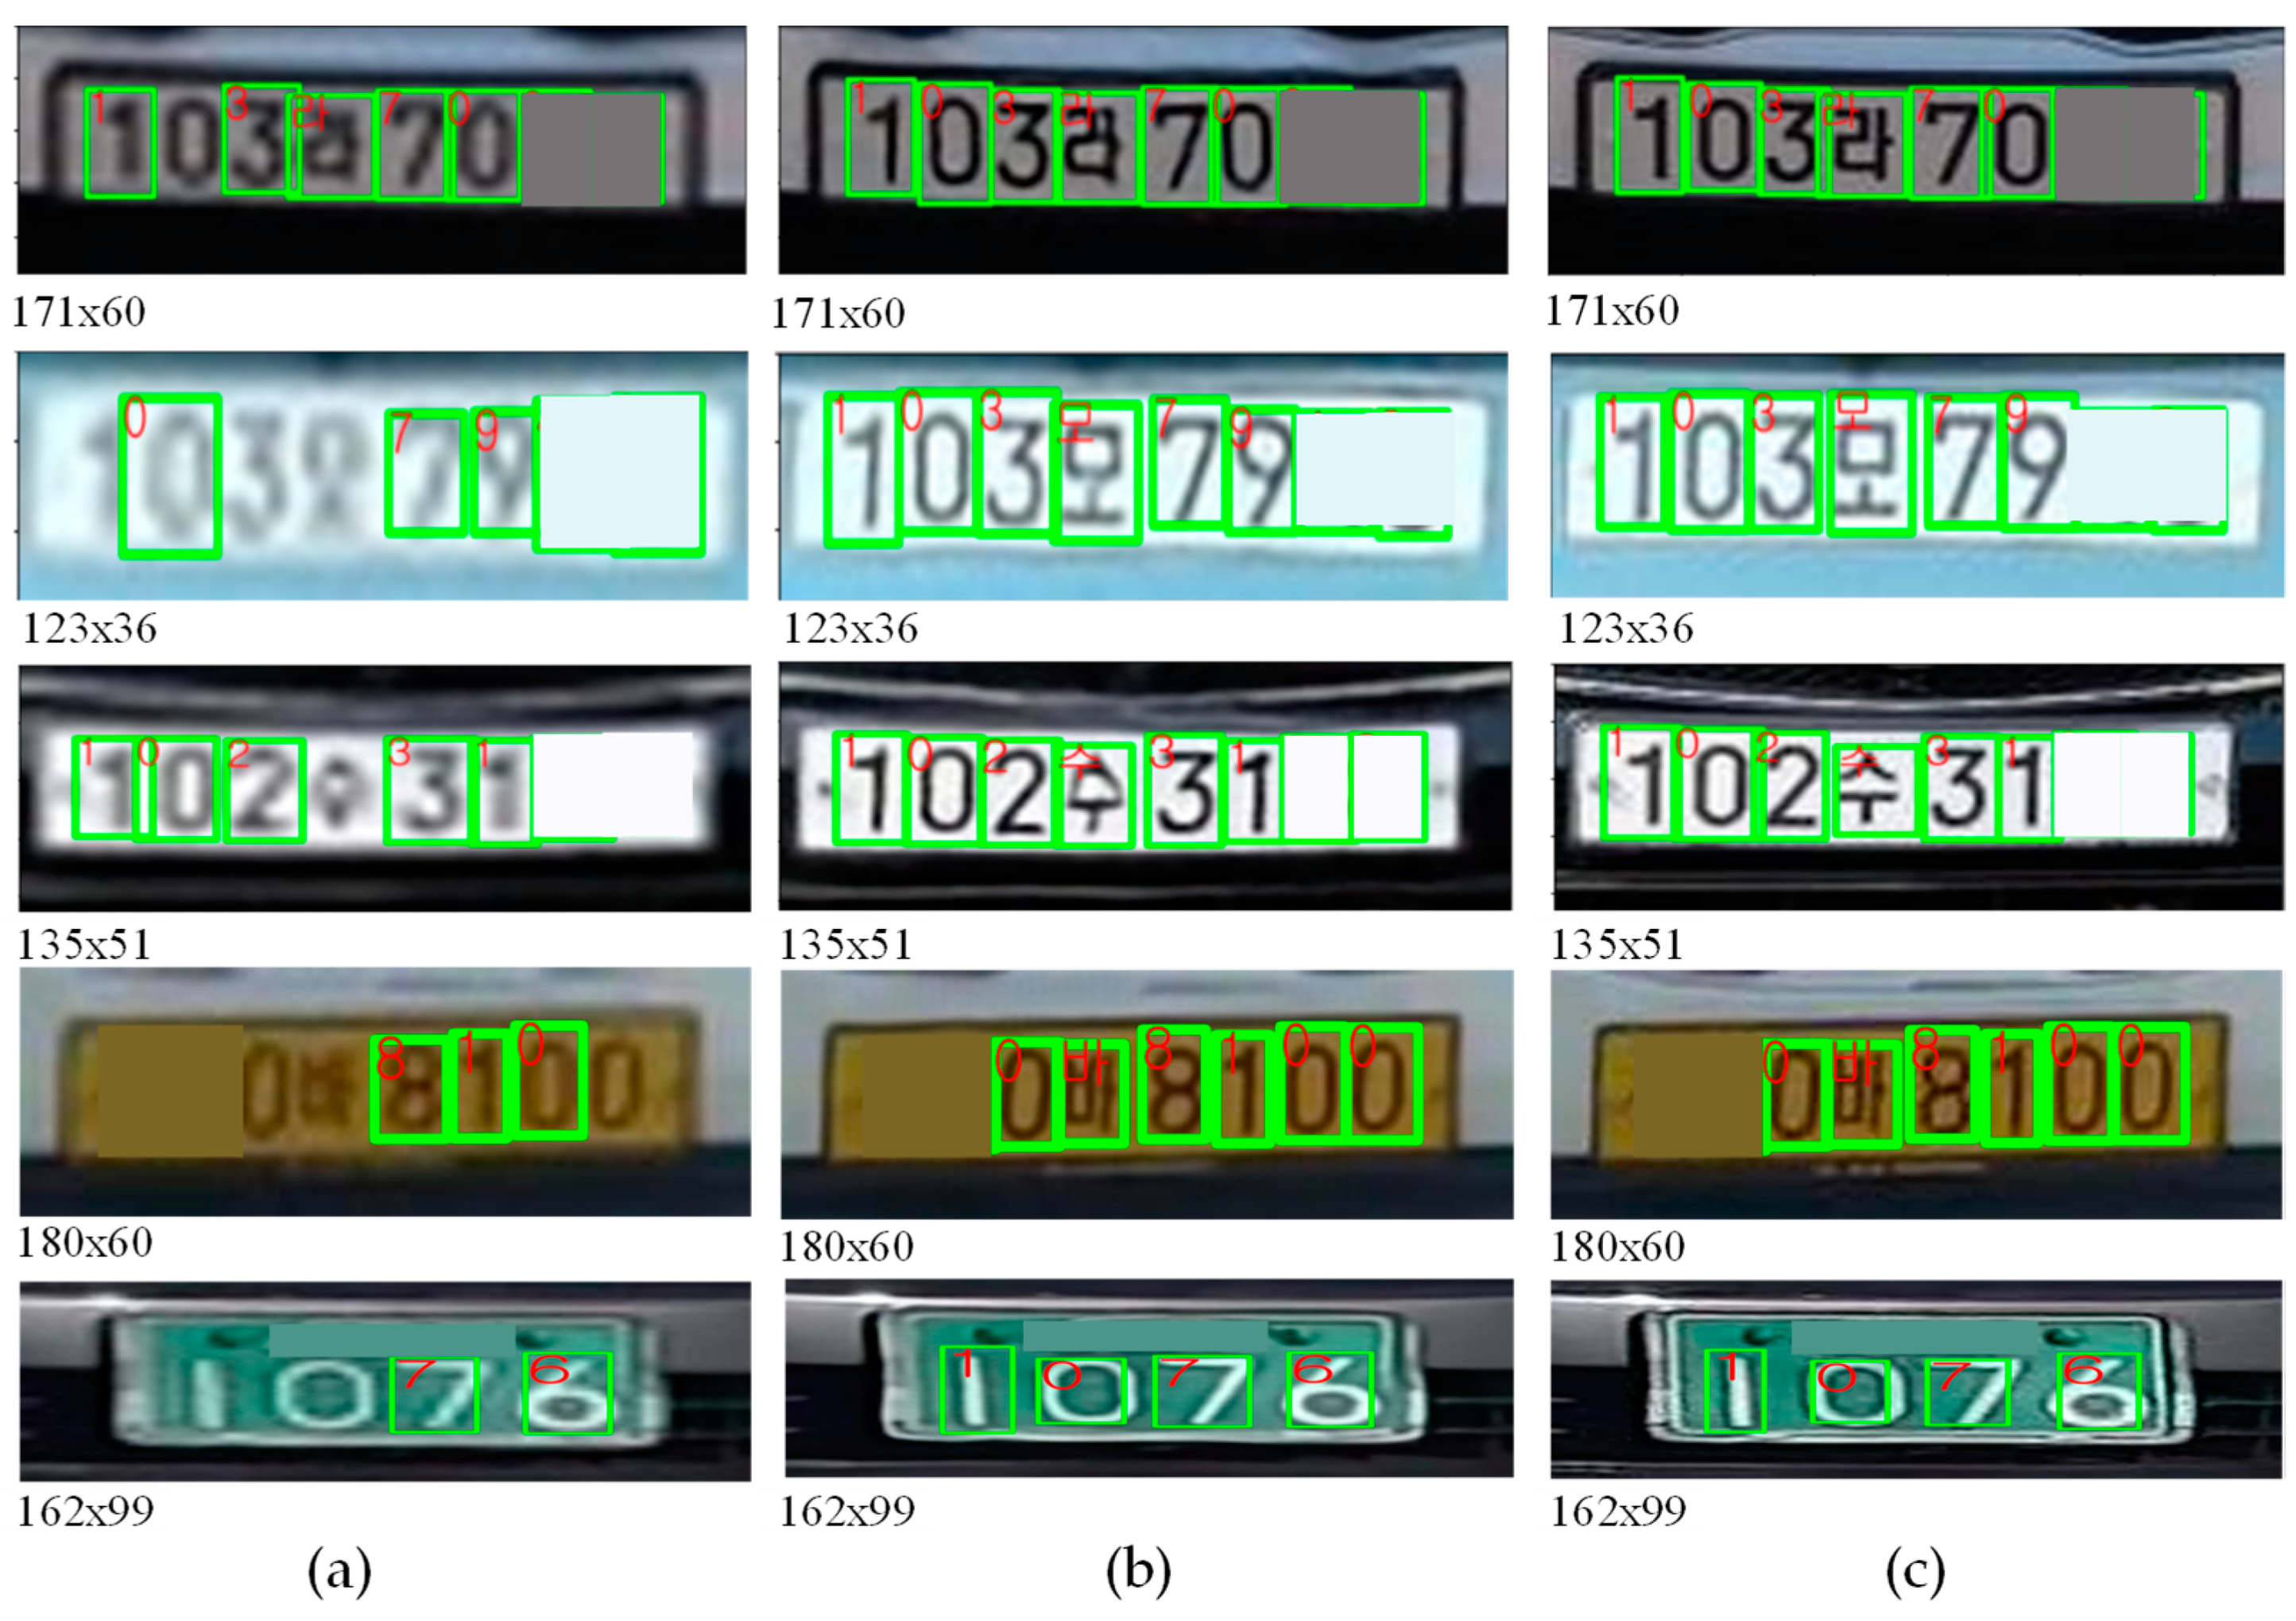
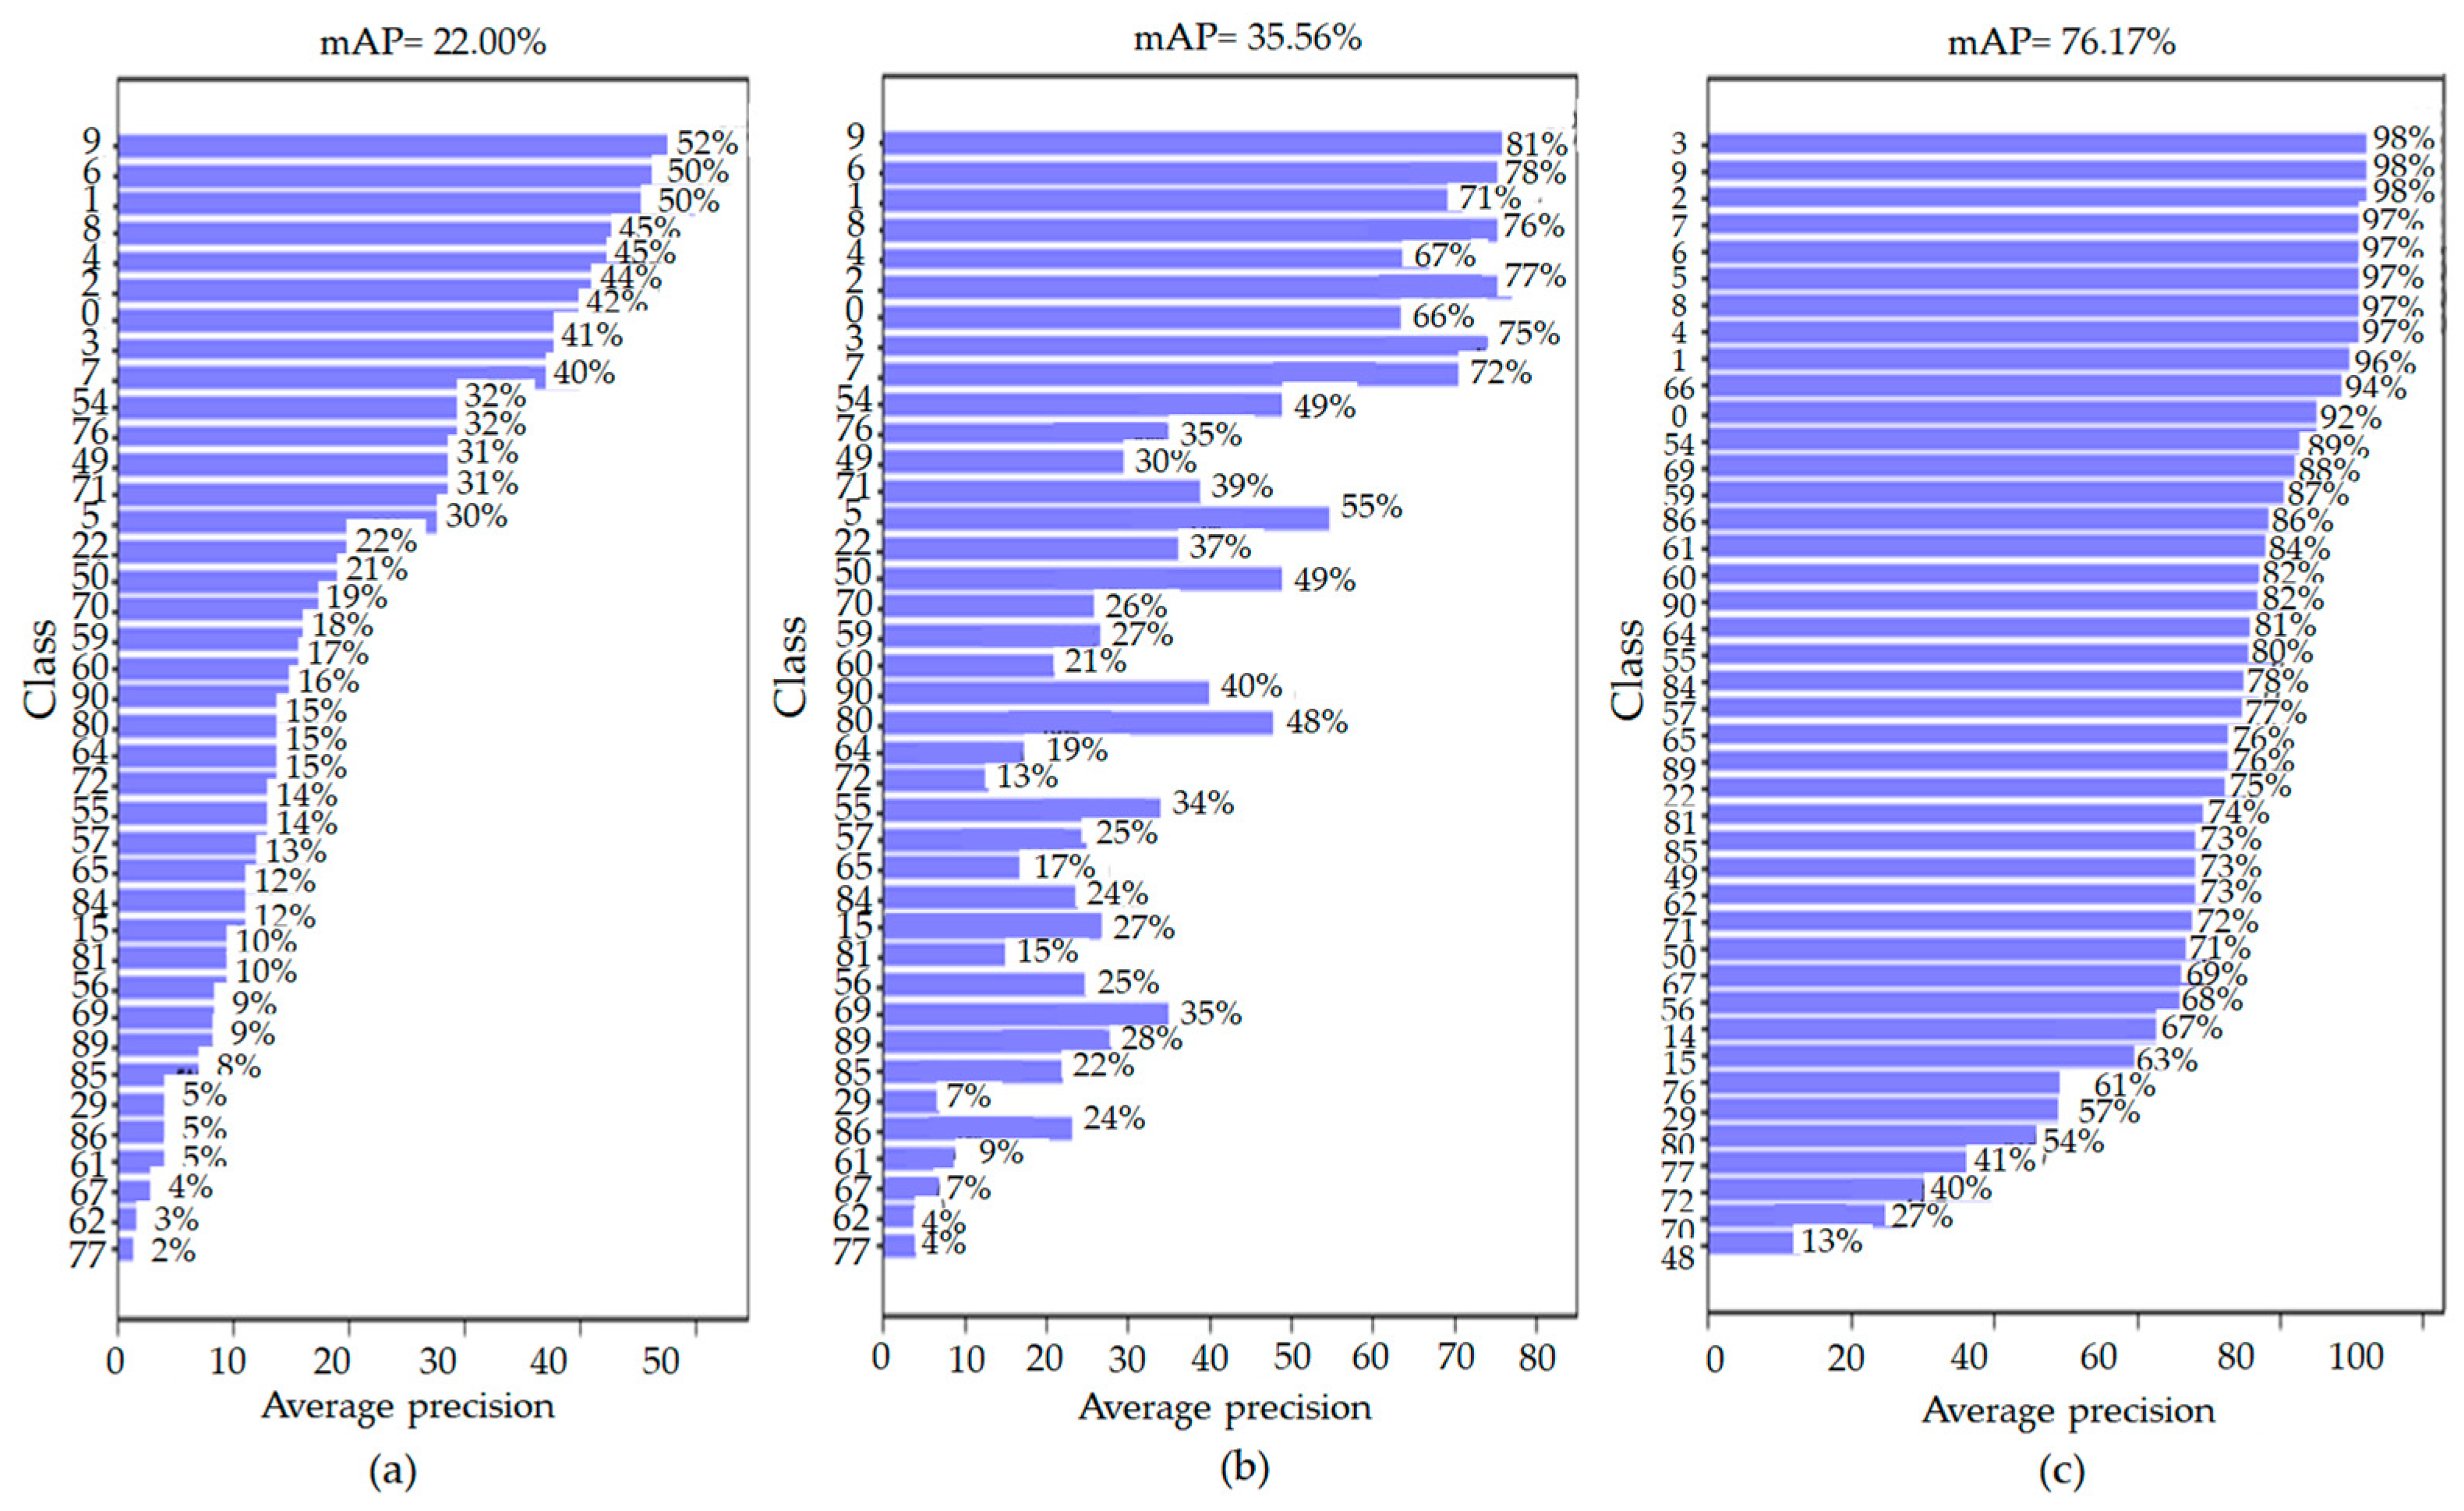
Figure 17 presents the results of the 4× magnification LR, DBPN, the proposed SR, and the number recognition mAP for HR images, starting from the upper left. All class (0–121)-specific mAPs (25.13%) for the SR image results were 20.30% higher than the mAP (4.83%) for the LR images, and 11.55% points higher than the mAP (13.58%) for the existing DBPN SR images. This shows that the proposed SR image was closer to the mAP result (76.17%) from the HR image than the LR and DBPN SR images. Additionally, Figure 18 shows the mAP results for a numeric class (0–9) for LR, DBPN, proposed SR, and HR images. The numerical class for the SR image results (0–9) mAP (61.30%) was 49.94% points higher than that of the mAP (11.36%) for the LR images, and 41.5% points higher than that the mAP (19.80%) for the existing DBPN SR images. Table 4 and Table 5 present a comparison of the results of character recognition of several SR techniques using mAP. Table 4 and Table 5 show the mAP comparison of various SR methods for the whole 122 classes and for 10 classes only, respectively. The proposed method outperforms other methods of character recognition. This quantitatively demonstrates the effectiveness of the proposed SR method in character recognition.
5. Discussion
In this section, we discuss the strengths and weaknesses of the proposed structure in detail. Our results show that the proposed integrated framework, super-resolved character recognition, improves character recognition performance. For example, the proposed method remarkably increased the mAP by 49.94% points compared to the existing state-of-the-art method for character recognition with the 4× magnification. However, failure cases in bad environments such as nighttime and rotation situations of our proposed framework can be generated. This is considered a weakness of our proposed algorithm and these shortcomings can be overcome through the data augmentation technique.
Meanwhile, image quality factors that should be considered important to recognize characters well include sharpness, contrast ratio, color, and noise. In general, the sharper the image, the higher the contrast ratio, the higher the color saturation, and the lower the noise, the better the character can be recognized. An integrated criterion can be proposed by comprehensively considering these quality factors. Additionally, the loss function (localization loss, confidence loss, and classification loss) used for character recognition can be simultaneously applied to the SR neural network training. As a future study, the end-to-end training of SR and character recognition can be considered.
6. Conclusions
In this paper, we analyzed the problem of reduced character recognition caused by differences in resolution between the test and learning image data. Both these data were trained by character recognizers and the proposed SR technique, which can improve character recognition in LR test input environments. To verify the performance of the proposed method, we implemented and experimented with SR and character recognition integration systems using Darkflow-based implemented license plate recognizers, confirming that SR techniques can help to innovatively improve license plate recognition rates. Additionally, we confirmed that data expansion using web crawl and artificial data generation methods can improve the performance of license plate recognizers. The license plate data set secured through this study and the SR artificial neural network weights can be widely utilized in areas such as smart transportation and smart parking, or any domain wherein text recognition of LR input images can be utilized. In the future, in addition to integer magnifications, such as 2×, 3×, and 4×, further intensification studies examining minority magnification (1.1 to 3.9) and network memory compression through the parameter sharing of weights by magnification can be performed.
Author Contributions
Conceptualization, S.B.Y.; methodology, S.-J.L. and S.B.Y.; software, S.-J.L.; validation, S.-J.L.; formal analysis, S.-J.L. and S.B.Y.; investigation, S.-J.L. and S.B.Y.; resources, S.-J.L. and S.B.Y.; data curation, S.-J.L. and S.B.Y.; writing—original draft preparation, S.-J.L. and S.B.Y.; writing—review and editing, S.-J.L. and S.B.Y.; visualization, S.B.Y.; supervision, S.B.Y.; project administration, S.B.Y.; funding acquisition, S.B.Y. Both authors have read and agreed to the published version of the manuscript.
Funding
This work was supported by the Institute of Information & Communications Technology Planning & Evaluation (IITP) grant funded by the Korea government (MSIT) (No. 2020-0-00004, Development of Previsional Intelligence based on Long-term Visual Memory Network) and the National Research Foundation of Korea (NRF) grant funded by the Korea government (MSIT) (NRF-2020R1G1A1100798).
Institutional Review Board Statement
Not applicable.
Informed Consent Statement
Not applicable.
Data Availability Statement
Not applicable.
Conflicts of Interest
The authors declare no conflict of interest.
References
- Dong, C.; Loy, C.C.; He, K.; Tang, X. Image super-resolution using deep convolutional networks. IEEE Trans. Pattern Anal. Mach. Intell. 2015, 38, 295–307. [Google Scholar] [CrossRef] [PubMed] [Green Version]
- Freeman, W.T.; Jones, T.R.; Pasztor, E.C. Example-based super-resolution. IEEE Comput. Graph. 2002, 22, 56–65. [Google Scholar] [CrossRef] [Green Version]
- Yang, J.; Wright, J.; Huang, T.; Ma, Y. Image super-resolution as sparse representation of raw image patches. In Proceedings of the IEEE Conference on Computer Vision and Pattern Recognition, Anchorage, AK, USA, 23–28 June 2008; pp. 1–8. [Google Scholar]
- Dong, C.; Loy, C.C.; Tang, X. Accelerating the super-resolution convolutional neural network. In Proceedings of the European Conference on Computer Vision, Amsterdam, The Netherlands; 2016; pp. 391–407. [Google Scholar]
- Shi, W.; Caballero, J.; Huszár, F.; Totz, J.; Aitken, A.P.; Bishop, R.; Rueckert, D.; Wang, Z. Real-time single image and video super-resolution using an efficient sub-pixel convolutional neural networks. In Proceedings of the IEEE Conference on Computer Vision and Pattern Recognition, Las Vegas, NV, USA, 27–30 June 2016; pp. 1874–1883. [Google Scholar]
- He, K.; Zhang, X.; Ren, S.; Sun, J. Deep residual learning for image recognition. In Proceedings of the IEEE Conference on Computer Vision and Pattern Recognition, Las Vegas, NV, USA, 27–30 June 2016; pp. 770–778. [Google Scholar]
- Lim, B.; Son, S.; Kim, H.; Nah, S.; Lee, K.M. Enhanced deep residual networks for single image super-resolution. In Proceedings of the IEEE Conference on Computer Vision and Pattern Recognition Workshops, Honolulu, HI, USA, 21–26 July 2017; pp. 136–144. [Google Scholar]
- Simonyan, K.; Zisserman, A. Very deep convolutional networks for large-scale image recognition. arXiv 2014, arXiv:1409.1556. [Google Scholar]
- Kim, J.W.; Lee, J.K.; Lee, K.M. Accurate image super-resolution using very deep convolutional networks. In Proceedings of the IEEE Conference on Computer Vision and Pattern Recognition, Las Vegas, NV, USA, 27–30 June 2016; pp. 1646–1654. [Google Scholar]
- Huang, G.; Liu, Z.; Maaten, L.; Weinberger, K.Q. Densely connected convolutional networks. In Proceedings of the IEEE Conference on Computer Vision and Pattern Recognition Workshops, Honolulu, HI, USA, 21–26 July 2017; pp. 2261–2269. [Google Scholar]
- Haris, M.; Shakhnarovich, G.; Ukita, N. Deep back-projection networks for super-resolution. In Proceedings of the IEEE Conference on Computer Vision and Pattern Recognition, Salt Lake City, UT, USA, 18–22 June 2018; pp. 1664–1673. [Google Scholar]
- Zhang, Y.; Tian, Y.; Kong, Y.; Zhong, B.; Fu, Y. Residual dense network for image super-resolution. In Proceedings of the IEEE Conference on Computer Vision and Pattern Recognition, Salt Lake City, UT, USA, 18–22 June 2018; pp. 2472–2481. [Google Scholar]
- Guo, Y.; Chen, J.; Wang, J.; Chen, Q.; Cao, J.; Deng, Z.; Xu, Y.; Tan, M. Closed-loop matters: Dual regression networks for single image super-resolution. In Proceedings of the IEEE/CVF Conference on Computer Vision and Pattern Recognition, Virtual, 14–19 June 2020; pp. 5407–5416. [Google Scholar]
- Zhang, K.; Gool, L.V.; Timofte, R. Deep unfolding network for image super-resolution. In Proceedings of the IEEE/CVF Conference on Computer Vision and Pattern Recognition, Virtual, Seattle, WA, USA, 14–19 June 2020; pp. 3217–3226. [Google Scholar]
- Soh, J.W.; Cho, S.; Cho, N.I. Meta-transfer learning for zero-shot super-resolution. In Proceedings of the IEEE/CVF Conference on Computer Vision and Pattern Recognition, Virtual, Seattle, WA, USA, 14–19 June 2020; pp. 3516–3525. [Google Scholar]
- Lee, J.H.; Cho, S.M.; Lee, S.J.; Kim, C.H. License plate recognition system using synthetic data. IEIE J. 2020, 57, 107–115. [Google Scholar]
- Lee, Y.J.; Kim, S.J.; Park, K.M.; Park, K.M. Comparison of number plate recognition performance of Synthetic number plate generator using 2D and 3D rotation. In Proceedings of the Korean Institute of Broadcast and Media Engineers Summer Conference, Virtual, 13–15 July 2020; pp. 141–144. [Google Scholar]
- Sergey, Z.; Alexey, G. LPRNet: License plate recognition via deep neural networks. arXiv 2018, arXiv:1806.10447. [Google Scholar]
- Liu, W.; Anguelov, D.; Derhan, D.; Szegedy, C.; Reed, S.; Fu, C.Y.; Berg, A.C. SSD: Single shot multibox detector. In Proceedings of the European Conference on Computer Vision, Amsterdam, The Netherlands; 2016; pp. 21–37. [Google Scholar]
- Xu, Z.; Yang, W.; Meng, A.; Lu, N.; Hunag, H.; Ying, C.; Huang, L. Towards end-to-end license plate detection and recognition: A large dataset and baseline. In Proceedings of the European Conference on Computer Vision, Munich, Germany, 8–14 September 2018; pp. 261–277. [Google Scholar]
- Lee, H.C. Design and implementation of efficient place number region detecting system in vehicle number plate image. KSCI J. 2005, 10, 87–93. [Google Scholar]
- Translate Darknet to Tensorflow. Available online: https://github.com/thtrieu/darkflow (accessed on 15 September 2021).
Figure 1.
Iterative up and down blocks for SR framework. Two characters were masked due to privacy policies.
Figure 1.
Iterative up and down blocks for SR framework. Two characters were masked due to privacy policies.

Figure 2.
Trends of the average PSNR and SSIM results, according to the checkpoint.

Figure 3.
Proposed loss function for the SR framework. Two characters were masked due to privacy policies.
Figure 3.
Proposed loss function for the SR framework. Two characters were masked due to privacy policies.

Figure 4.
Examples of artificial license plate images.

Figure 5.
Flowchart of the integrated SR and character recognition. Two characters were masked due to privacy policies.
Figure 5.
Flowchart of the integrated SR and character recognition. Two characters were masked due to privacy policies.

Figure 6.
SR results of the first plate image (4×). (a) HR (128 × 64), (b) Bicubic, (c) DRN, (d) MZSR, (e) USRNet, (f) DBPN, (g) Proposed. Two characters were masked due to privacy policies.
Figure 6.
SR results of the first plate image (4×). (a) HR (128 × 64), (b) Bicubic, (c) DRN, (d) MZSR, (e) USRNet, (f) DBPN, (g) Proposed. Two characters were masked due to privacy policies.

Figure 7.
SR results of the second plate image (4×). (a) HR (140 × 48), (b) Bicubic, (c) DRN, (d) MZSR, (e) USRNet, (f) DBPN, (g) Proposed. Two characters were masked due to privacy policies.
Figure 7.
SR results of the second plate image (4×). (a) HR (140 × 48), (b) Bicubic, (c) DRN, (d) MZSR, (e) USRNet, (f) DBPN, (g) Proposed. Two characters were masked due to privacy policies.

Figure 8.
SR results of the third plate image (4×). (a) HR (144 × 40), (b) Bicubic, (c) DRN, (d) MZSR, (e) USRNet, (f) DBPN, (g) Proposed. Two characters were masked due to privacy policies.
Figure 8.
SR results of the third plate image (4×). (a) HR (144 × 40), (b) Bicubic, (c) DRN, (d) MZSR, (e) USRNet, (f) DBPN, (g) Proposed. Two characters were masked due to privacy policies.

Figure 9.
Results of character recognition (a) without and (b) with artificial license plate generation.
Figure 9.
Results of character recognition (a) without and (b) with artificial license plate generation.

Figure 10.
Examples of plate detection results. Two characters were masked due to privacy policies.

Figure 11.
Examples of character recognition results. Two characters were masked due to privacy policies.
Figure 11.
Examples of character recognition results. Two characters were masked due to privacy policies.

Figure 12.
Examples of character recognition results. Recognition results on (a) bicubic results (3×), (b) proposed SR results (3×), and (c) HR images. Two characters were masked due to privacy policies.
Figure 12.
Examples of character recognition results. Recognition results on (a) bicubic results (3×), (b) proposed SR results (3×), and (c) HR images. Two characters were masked due to privacy policies.

Figure 13.
Examples of character recognition results. Recognition results on (a) bicubic results (4×), (b) proposed SR results (4×), and (c) HR images. Two characters were masked due to privacy policies.
Figure 13.
Examples of character recognition results. Recognition results on (a) bicubic results (4×), (b) proposed SR results (4×), and (c) HR images. Two characters were masked due to privacy policies.

Figure 14.
Failure examples of character recognition results. (a) Ground-truth labels on HR images and (b) the proposed SR (4×) and character recognition results obtained from LR images. Two characters were masked due to privacy policies.
Figure 14.
Failure examples of character recognition results. (a) Ground-truth labels on HR images and (b) the proposed SR (4×) and character recognition results obtained from LR images. Two characters were masked due to privacy policies.

Figure 15.
mAP comparison results. (a–c) represent the mAP results on bicubic results (3×), proposed SR results (3×), and HR images, respectively.
Figure 15.
mAP comparison results. (a–c) represent the mAP results on bicubic results (3×), proposed SR results (3×), and HR images, respectively.

Figure 16.
mAP comparison results for only numbers (0–9). (a–c) represent the mAP results on bicubic results (3×), proposed SR results (3×), and HR images, respectively.
Figure 16.
mAP comparison results for only numbers (0–9). (a–c) represent the mAP results on bicubic results (3×), proposed SR results (3×), and HR images, respectively.

Figure 17.
mAP comparison results. (a–d) represent the mAP results on bicubic results (×4), DBPN results (×4), proposed SR results (×4), and HR images, respectively.
Figure 17.
mAP comparison results. (a–d) represent the mAP results on bicubic results (×4), DBPN results (×4), proposed SR results (×4), and HR images, respectively.

Figure 18.
mAP comparison results for only numbers (0–9). (a–d) represent the mAP results on bicubic results (×4), DBPN results (×4), proposed SR results (×4), and HR images, respectively.
Figure 18.
mAP comparison results for only numbers (0–9). (a–d) represent the mAP results on bicubic results (×4), DBPN results (×4), proposed SR results (×4), and HR images, respectively.


Table 1.
Hyper parameters of the SR framework.
| Scale | 2× | 3× | 4× |
|---|---|---|---|
| Kernel size | 6 | 5 | 8 |
| Stride | 2 | 3 | 4 |
| Padding | 2 | 1 | 2 |
Table 2.
122 classes for character recognition.
| Class | Character | Class | Character | Class | Character | Class | Character |
|---|---|---|---|---|---|---|---|
| 0 | 0 | 31 | 강원 | 62 | 두 | 93 | 차 |
| 1 | 1 | 32 | 경기 | 63 | 드 | 94 | 처 |
| 2 | 2 | 33 | 경남 | 64 | 라 | 95 | 초 |
| 3 | 3 | 34 | 경북 | 65 | 러 | 96 | 추 |
| 4 | 4 | 35 | 광주 | 66 | 로 | 97 | 츠 |
| 5 | 5 | 36 | 대구 | 67 | 루 | 98 | 카 |
| 6 | 6 | 37 | 대전 | 68 | 르 | 99 | 커 |
| 7 | 7 | 38 | 부산 | 69 | 마 | 100 | 코 |
| 8 | 8 | 39 | 서울 | 70 | 머 | 101 | 쿠 |
| 9 | 9 | 40 | 세종 | 71 | 모 | 102 | 크 |
| 10 | 강 | 41 | 울산 | 72 | 무 | 103 | 타 |
| 11 | 경 | 42 | 인천 | 73 | 므 | 104 | 터 |
| 12 | 광 | 43 | 전남 | 74 | 바 | 105 | 토 |
| 13 | 대 | 44 | 전북 | 75 | 배 | 106 | 투 |
| 14 | 부 | 45 | 제주 | 76 | 버 | 107 | 트 |
| 15 | 서 | 46 | 충남 | 77 | 보 | 108 | 파 |
| 16 | 세 | 47 | 충북 | 78 | 브 | 109 | 퍼 |
| 17 | 울 | 48 | 가 | 79 | 사 | 110 | 포 |
| 18 | 인 | 49 | 거 | 80 | 소 | 111 | 푸 |
| 19 | 전 | 50 | 고 | 81 | 수 | 112 | 하 |
| 20 | 제 | 51 | 공 | 82 | 스 | 113 | 프 |
| 21 | 충 | 52 | 그 | 83 | 아 | 114 | 호 |
| 22 | 구 | 53 | 국 | 84 | 어 | 115 | 허 |
| 23 | 기 | 54 | 나 | 85 | 오 | 116 | 해 |
| 24 | 남 | 55 | 너 | 86 | 우 | 117 | 후 |
| 25 | 북 | 56 | 노 | 87 | 육 | 118 | 흐 |
| 26 | 산 | 57 | 누 | 88 | 자 | 119 | 합 |
| 27 | 원 | 58 | 느 | 89 | 저 | 120 | 영 |
| 28 | 종 | 59 | 다 | 90 | 조 | 121 | - |
| 29 | 주 | 60 | 더 | 91 | 주 | ||
| 30 | 천 | 61 | 도 | 92 | 즈 |
Table 3.
Average PSNR/SSIM of license plates for validation.
| Scale | 2× | 3× | 4× | |||
|---|---|---|---|---|---|---|
| Bicubic | 30.85 | 0.9297 | 26.09 | 0.7960 | 23.68 | 0.6516 |
| MZSR | 21.15 | 0.7056 | 21.27 | 0.5942 | 19.53 | 0.3788 |
| DRN | - | - | - | - | 25.80 | 0.6945 |
| DBPN | 33.72 | 0.9616 | - | - | 25.41 | 0.7739 |
| Proposed | 33.75 | 0.9632 | 30.09 | 0.9181 | 26.99 | 0.8430 |
Table 4.
Average mAP (%) comparison of LR license plates for validation of 122 classes (0–121).
| Scale | 2× | 3× | 4× |
|---|---|---|---|
| Bicubic | 62.61 | 22.00 | 4.83 |
| MZSR | 18.24 | 18.53 | 7.65 |
| DRN | - | - | 14.60 |
| DBPN | 57.49 | - | 13.58 |
| Proposed | 64.78 | 35.56 | 25.13 |
Table 5.
Average mAP (%) comparison of LR license plates for validation of 10 classes (0–9).
| Scale | 2× | 3× | 4× |
|---|---|---|---|
| Bicubic | 85.13 | 43.90 | 11.36 |
| MZSR | 58.37 | 58.86 | 30.86 |
| DRN | - | - | 48.40 |
| DBPN | 85.85 | - | 19.80 |
| Proposed | 91.70 | 71.80 | 61.30 |
Publisher’s Note: MDPI stays neutral with regard to jurisdictional claims in published maps and institutional affiliations. |
© 2021 by the authors. Licensee MDPI, Basel, Switzerland. This article is an open access article distributed under the terms and conditions of the Creative Commons Attribution (CC BY) license (https://creativecommons.org/licenses/by/4.0/).
Share and Cite
MDPI and ACS Style
Lee, S.-J.; Yoo, S.B. Super-Resolved Recognition of License Plate Characters. Mathematics 2021, 9, 2494. https://doi.org/10.3390/math9192494
AMA Style
Lee S-J, Yoo SB. Super-Resolved Recognition of License Plate Characters. Mathematics. 2021; 9(19):2494. https://doi.org/10.3390/math9192494
Chicago/Turabian StyleLee, Sung-Jin, and Seok Bong Yoo. 2021. "Super-Resolved Recognition of License Plate Characters" Mathematics 9, no. 19: 2494. https://doi.org/10.3390/math9192494
Note that from the first issue of 2016, this journal uses article numbers instead of page numbers. See further details here.