
Frequency of Neuroendocrine Tumor Studies: Using Latent Dirichlet Allocation and HJ-Biplot Statistical Methods

 ,
,  , ,
, , 

Abstract
1. Introduction
2. Materials and Methods
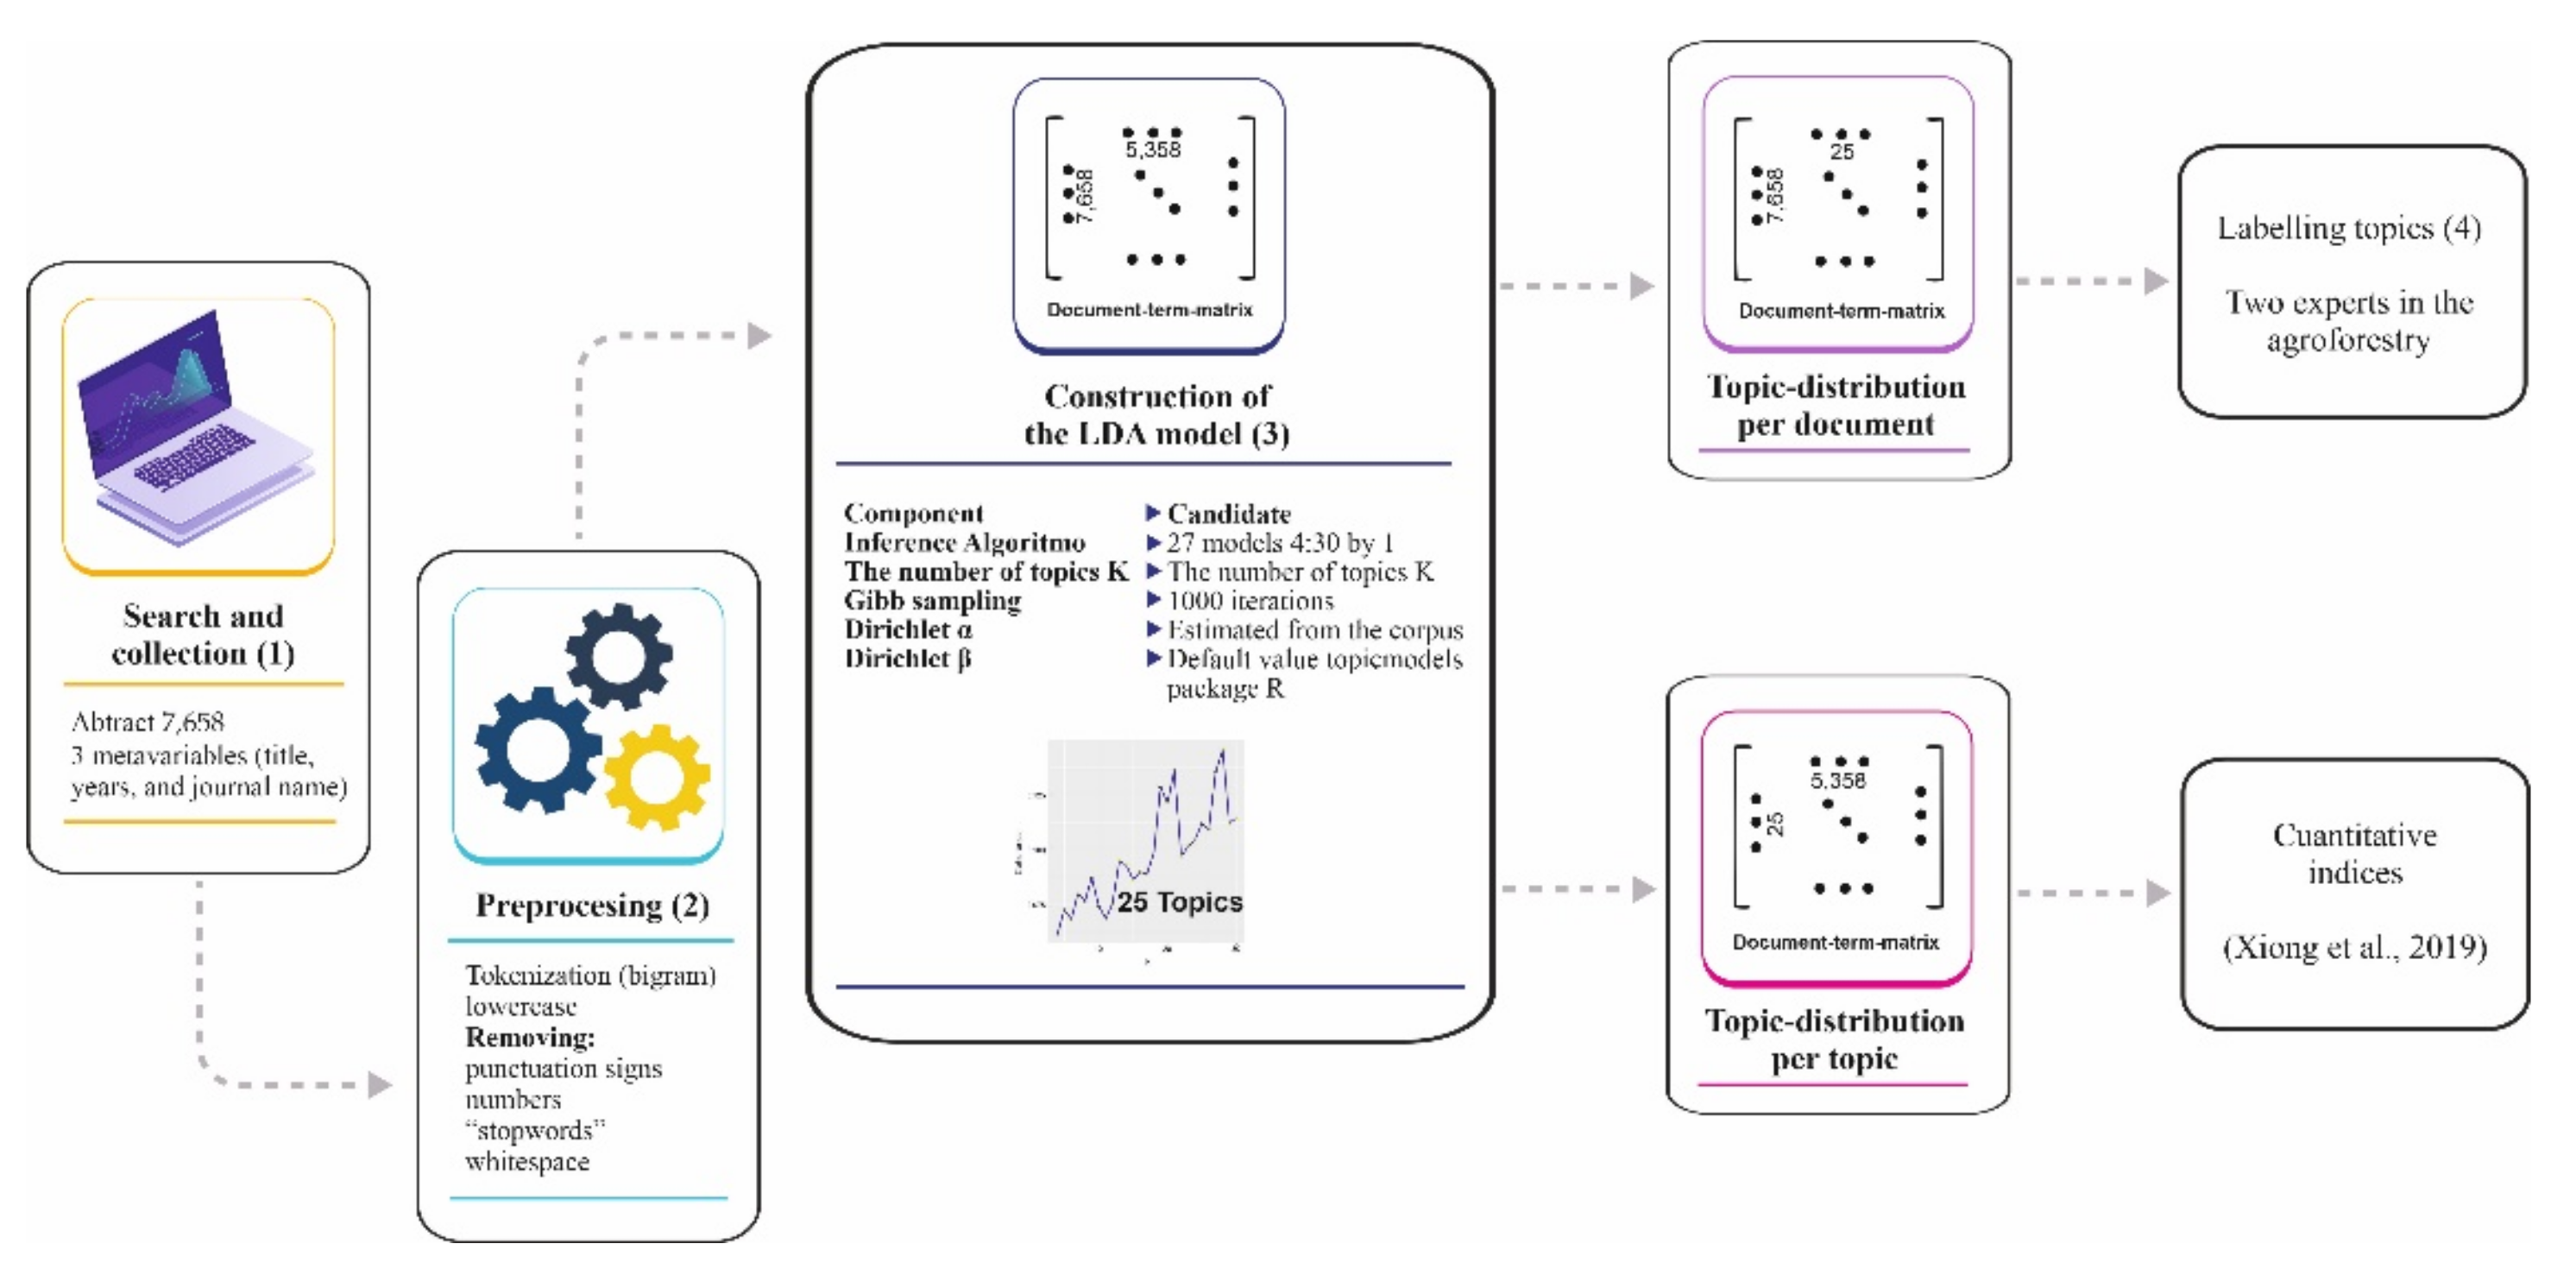
2.1. Latent Dirichlet Allocation (LDA)
2.2. Identifying Research Topics
2.2.1. Literature Search
2.2.2. Preprocessing
2.2.3. Selection of the Number of LDA Topics and Construction of the Model
2.2.4. Labeling of Topics
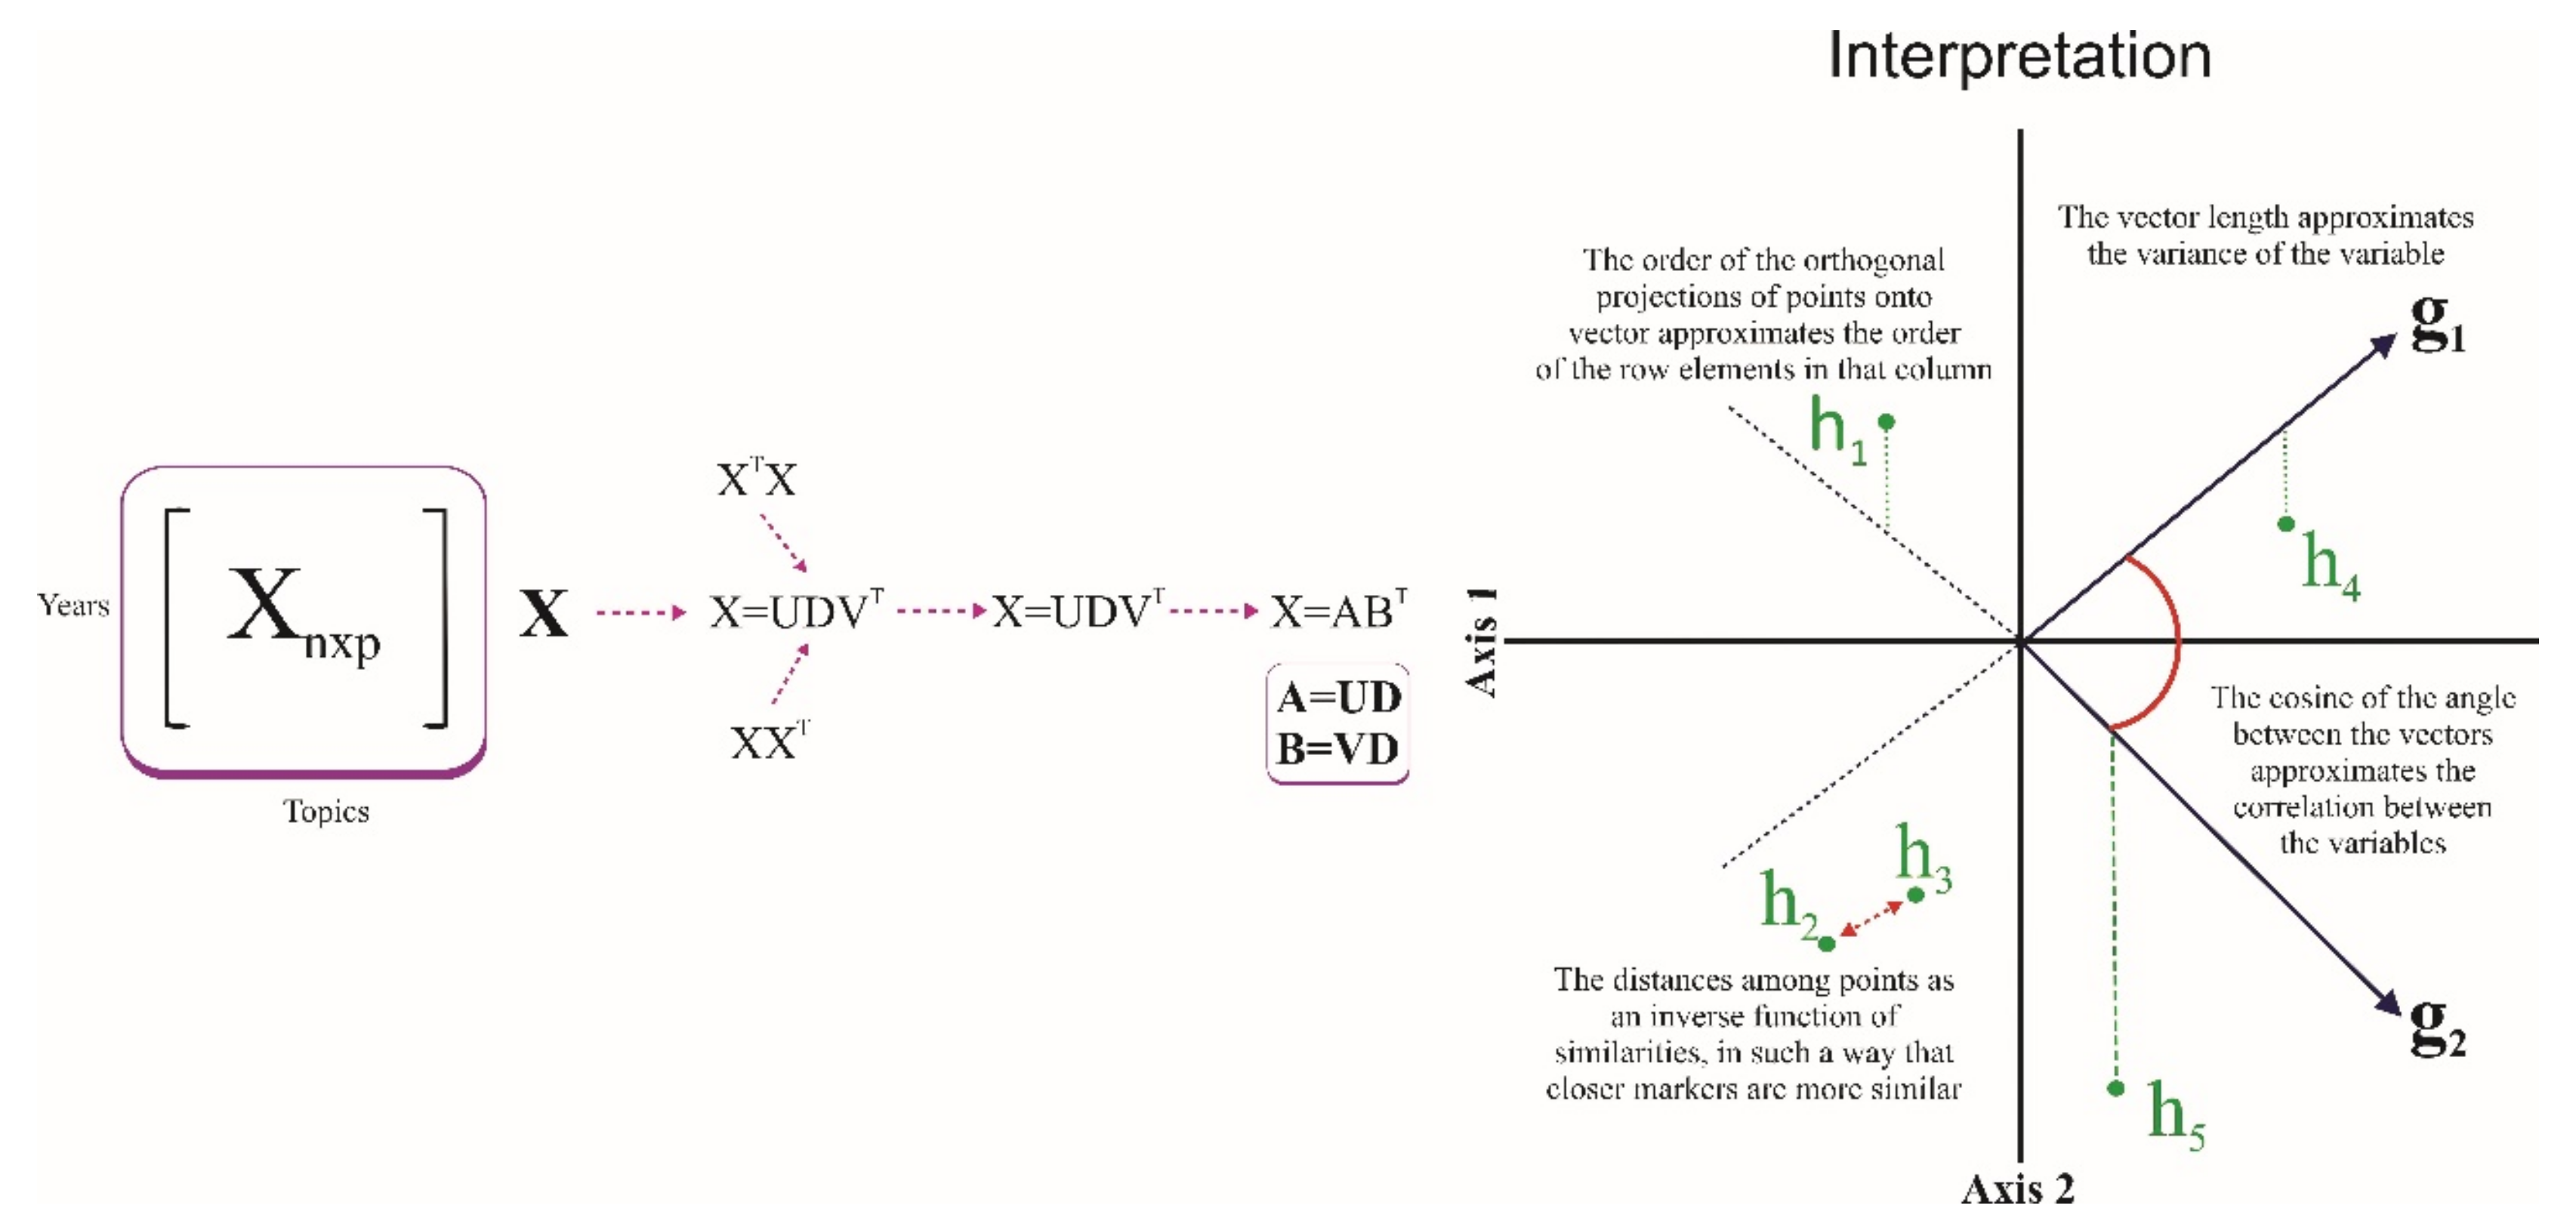
2.3. HJ-Biplot
2.4. Quantitative Indices Used to Analyze the Trend of Topic
3. Results
4. Discussion
5. Conclusions
Author Contributions
Funding
Institutional Review Board Statement
Informed Consent Statement
Acknowledgments
Conflicts of Interest
References
- Rindi, G.; Wiedenmann, B. Neuroendocrine neoplasia of the gastrointestinal tract revisited: Towards precision medicine. Nat. Rev. Endocrinol. 2020, 16, 590–607. [Google Scholar] [CrossRef]
- Klimstra, D.S.; Modlin, I.R.; Coppola, D.; Lloyd, R.V.; Suster, S. The Pathologic Classification of Neuroendocrine Tumors: A review of nomenclature, grading, and staging systems. Pancreas 2010, 39, 707–712. [Google Scholar] [CrossRef]
- Hijioka, S.; Hosoda, W.; Mizuno, N.; Hara, K.; Imaoka, H.; Bhatia, V.; Mekky, M.A.; Tajika, M.; Tanaka, T.; Ishihara, M.; et al. Does the WHO 2010 classification of pancreatic neuroendocrine neoplasms accurately characterize pancreatic neuroendocrine carcinomas? J. Gastroenterol. 2015, 50, 564–572. [Google Scholar] [CrossRef] [PubMed]
- Vanoli, A.; Albarello, L.; Uncini, S.; Fassan, M.; Grillo, F.; Di Sabatino, A.; Martino, M.; Pasquali, C.; Milanetto, A.C.; Falconi, M.; et al. Neuroendocrine Tumors (NETs) of the Minor Papilla/Ampulla: Analysis of 16 Cases Underlines Homology With Major Ampulla NETs and Differences From Extra-Ampullary Duodenal NETs. Am. J. Surg. Pathol. 2019, 43, 725–736. [Google Scholar] [CrossRef]
- Pavel, M.E.; Singh, S.; Strosberg, J.R.; Bubuteishvili-Pacaud, L.; Degtyarev, E.; Neary, M.P.; Carnaghi, C.; Tomasek, J.; Wolin, E.; Raderer, M.; et al. Health-related quality of life for everolimus versus placebo in patients with advanced, non-functional, well-differentiated gastrointestinal or lung neuroendocrine tumours (RADIANT-4): A multicentre, randomised, double-blind, placebo-controlled, phase 3 trial. Lancet Oncol. 2017, 18, 1411–1422. [Google Scholar] [CrossRef] [PubMed]
- Riihimäki, M.; Hemminki, A.; Sundquist, K.; Sundquist, J.; Hemminki, K. The epidemiology of metastases in neuroendocrine tumors. Int. J. Cancer 2016, 139, 2679–2686. [Google Scholar] [CrossRef]
- Dasari, A.; Shen, C.; Halperin, D.M.; Zhao, B.; Zhou, S.; Xu, Y.; Shih, T.; Yao, J.C. Trends in the Incidence, Prevalence, and Survival Outcomes in Patients with Neuroendocrine Tumors in the United States. JAMA Oncol. 2017, 3, 1335–1342. [Google Scholar] [CrossRef] [PubMed]
- Rindi, G.; Klöppel, G.; Couvelard, A.; Komminoth, P.; Körner, M.; Lopes, J.M.; McNicol, A.-M.; Nilsson, O.; Perren, A.; Scarpa, A.; et al. TNM staging of midgut and hindgut (neuro) endocrine tumors: A consensus proposal including a grading system. Virchows Arch. 2007, 451, 757–762. [Google Scholar] [CrossRef]
- Griffiths, T.L.; Steyvers, M. Finding scientific topics. Proc. Natl. Acad. Sci. USA 2004, 101, 5228–5235. [Google Scholar] [CrossRef] [PubMed]
- Hornik, K.; Grün, B. Topicmodels: An R package for fitting topic models. J. Stat. Softw. 2011, 40, 1–30. [Google Scholar]
- Geman, S.; Geman, D. Stochastic Relaxation, Gibbs Distributions, and the Bayesian Restoration of Images. IEEE Trans. Pattern Anal. Mach. Intell. 1984, 6, 721–741. [Google Scholar] [CrossRef]
- Galindo, M.P.; Cuadras, C.M. Una Extensión del Método Biplot y su Relación Con otras Técnicas; Publicaciones de Bioestadística y Biomatemática, Universidad de Barcelona no: Barcelona, Spain, 1986. [Google Scholar]
- Blei, D.M.; Ng, A.Y.; Jordan, M.I. Latent dirichlet allocation. J. Mach. Learn. Res. 2003, 3, 993–1022. [Google Scholar]
- Porteous, I.; Newman, D.; Ihler, A.; Asuncion, A.; Smyth, P.; Welling, M. Fast collapsed gibbs sampling for latent dirichlet allocation. In Proceedings of the 14th ACM SIGKDD International Conference on Knowledge Discovery and Data Mining-KDD 08; ACM Press: New York, NY, USA, 2008; pp. 569–577. [Google Scholar]
- Asuncion, A.; Welling, M.; Smyth, P.; Teh, Y.W. On smoothing and inference for topic models. arXiv 2012, arXiv:1205.2662. [Google Scholar]
- De la Hoz-M, J.; Fernández-Gómez, M.; Mendes, S. LDAShiny: An R Package for Exploratory Review of Scientific Literature Based on a Bayesian Probabilistic Model and Machine Learning Tools. Mathematics 2021, 9, 1671. [Google Scholar] [CrossRef]
- Blei, D.M.; Lafferty, J.D. A correlated topic model of Science. Ann. Appl. Stat. 2007, 1. [Google Scholar] [CrossRef]
- Röder, M.; Both, A.; Hinneburg, A. Exploring the Space of Topic Coherence Measures. In Proceedings of the Eighth ACM International Conference on Web Search and Data Mining; ACM Press: New York, NY, USA, 2015; pp. 399–408. [Google Scholar]
- Chang, J.; Blei, D.M. Relational topic models for document networks. In Proceedings of the Artificial Intelligence and Statistics, Clearwater Beach, FL, USA, 16–18 April 2009; Volume 5, pp. 81–88. [Google Scholar]
- Jones, T. textmineR: Functions for Text Mining and Topic Modeling, R Package Version 3.0. 4; R Foundation for Statistical Computing: Vienna, Austria, 2019; Volume 3, Available online: https://cran.r-project.org/web/packages/textmineR/index.html (accessed on 1 January 2021).
- Lau, J.H.; Grieser, K.; Newman, D.; Baldwin, T. Automatic labelling of topic models. In Proceedings of the ACL-HLT 2011-the 49th Annual Meeting of the Association for Computational Linguistics: Human Language Technologies, Portland, OR, USA, 19–24 June 2011; pp. 1536–1545. [Google Scholar]
- Sievert, C.; Shirley, K. LDAvis: A method for visualizing and interpreting topics. In Proceedings of the Workshop on Interactive Language Learning, Visualization, and Interfaces, Baltimore, MD, USA, 27 June 2014; Association for Computational Linguistics: Stroudsburg, PA, USA, 2014; pp. 63–70. [Google Scholar]
- Chuang, J.; Ramage, D.; Manning, C.D.; Heer, J. Interpretation and trust: Designing model-driven visualizations for text analysis. In Proceedings of the Conference on Human Factors in Computing Systems, Austin, TX, USA, 5–10 May 2012; pp. 443–452. [Google Scholar]
- Gabriel, K.R. The biplot graphic display of matrices with application to principal component analysis. Biometrika 1971, 58, 453–467. [Google Scholar] [CrossRef]
- Vicente-Villardón, J.L. MULTBIPLOT: A Package for Multivariate Analysis Using Biplots; Departamento de Estadística. Universidad de Salmanca: Salmanca, Spain, 2010. [Google Scholar]
- Xiong, H.; Cheng, Y.; Zhao, W.; Liu, J. Analyzing scientific research topics in manufacturing field using a topic model. Comput. Ind. Eng. 2019, 135, 333–347. [Google Scholar] [CrossRef]
- Novoa, M.P.D.M.; Capel, F.F.; Sedano, J.V.R.; Carrera, M.S.; Jiménez, V.A.; Pereira, P.O.; Valera, J.S.; Medina, L.O.; Pérez, J.; Ángel, D. Tumores neuroendocrinos gastroenteropancreáticos: Características clínicas, proceso diagnóstico y pronóstico en el Hospital Universitario Clínico San Carlos (Madrid). Endocrinología y Nutrición 2014, 61, 234–241. [Google Scholar] [CrossRef]
- Jiao, X.; Li, Y.; Wang, H.; Liu, S.; Zhang, N.; Zhou, Y. Clinicopathological features and survival analysis of gastroenteropancreatic neuroendocrine neoplasms: A retrospective study in a single center of China. Chin. J. Cancer Res. 2015, 27, 258–266. [Google Scholar] [CrossRef]
- Chauhan, A.; Kohn, E.; Del Rivero, J. Neuroendocrine Tumors-Less Well Known, Often Misunderstood, and Rapidly Growing in Incidence. JAMA Oncol. 2020, 6, 21. [Google Scholar] [CrossRef] [PubMed]
- Bellizzi, A.M. Immunohistochemistry in the diagnosis and classification of neuroendocrine neoplasms: What can brown do for you? Hum. Pathol. 2020, 96, 8–33. [Google Scholar] [CrossRef]
- Ahmed, M. Gastrointestinal neuroendocrine tumors in 2020. World J. Gastrointest. Oncol. 2020, 12, 791–807. [Google Scholar] [CrossRef]
- Lloyd, R.V.; Osamura, Y.R.; Kloppel, G.; Rosai, J. WHO Classification of Tumours of Endocrine Organs; World Health Organization: Geneva, Switzerland, 2017. [Google Scholar]
- Pearman, T.P.; Beaumont, J.L.; Cella, D.; Neary, M.P.; Yao, J. Health-related quality of life in patients with neuroendocrine tumors: An investigation of treatment type, disease status, and symptom burden. Support. Care Cancer 2016, 24, 3695–3703. [Google Scholar] [CrossRef]
- Pavel, M.E.; Hainsworth, J.D.; Baudin, E.; Peeters, M.; Höersch, D.; Winkler, R.E.; Klimovsky, J.; Lebwohl, D.; Jehl, V.; Wolin, E.M.; et al. Everolimus plus octreotide long-acting repeatable for the treatment of advanced neuroendocrine tumours associated with carcinoid syndrome (RADIANT-2): A randomised, placebo-controlled, phase 3 study. Lancet 2011, 378, 2005–2012. [Google Scholar] [CrossRef]
- Raymond, E.; Dahan, L.; Raoul, J.-L.; Bang, Y.-J.; Borbath, I.; Lombard-Bohas, C.; Valle, J.; Metrakos, P.; Smith, D.; Vinik, A.; et al. Sunitinib Malate for the Treatment of Pancreatic Neuroendocrine Tumors. N. Engl. J. Med. 2011, 364, 501–513. [Google Scholar] [CrossRef] [PubMed]
- Yao, J.C.; Fazio, N.; Singh, S.; Buzzoni, R.; Carnaghi, C.; Wolin, E.; Tomasek, J.; Raderer, M.; Lahner, H.; Voi, M.; et al. Everolimus for the treatment of advanced, non-functional neuroendocrine tumours of the lung or gastrointestinal tract (RADIANT-4): A randomised, placebo-controlled, phase 3 study. Lancet 2016, 387, 968–977. [Google Scholar] [CrossRef]
- Yao, J.C.; Guthrie, K.A.; Moran, C.; Strosberg, J.R.; Kulke, M.H.; Chan, J.A.; LoConte, N.; McWilliams, R.R.; Wolin, E.M.; Mattar, B.; et al. Phase III Prospective Randomized Comparison Trial of Depot Octreotide Plus Interferon Alfa-2b Versus Depot Octreotide Plus Bevacizumab in Patients With Advanced Carcinoid Tumors: SWOG S0518. J. Clin. Oncol. 2017, 35, 1695–1703. [Google Scholar] [CrossRef]
- Luo, M.; Delaplane, S.; Jiang, A.; Reed, A.; He, Y.; Fishel, M.; Nyland, R.L.; Borch, R.F.; Qiao, X.; Georgiadis, M.M.; et al. Role of the Multifunctional DNA Repair and Redox Signaling Protein Ape1/Ref-1 in Cancer and Endothelial Cells: Small-Molecule Inhibition of the Redox Function of Ape1. Antioxid. Redox. Signal. 2008, 10, 1853–1867. [Google Scholar] [CrossRef]
- Yao, J.C.; Hassan, M.M.; Phan, A.T.; Dagohoy, C.G.; Leary, C.C.; Mares, J.E.; Abdalla, E.K.; Fleming, J.B.; Vauthey, J.-N.; Rashid, A.; et al. One Hundred Years After “Carcinoid”: Epidemiology of and Prognostic Factors for Neuroendocrine Tumors in 35,825 Cases in the United States. J. Clin. Oncol. 2008, 26, 3063–3072. [Google Scholar] [CrossRef] [PubMed]
- Yao, J.C.; Eisner, M.P.; Leary, C.; Dagohoy, C.; Phan, A.; Rashid, A.; Hassan, M.; Evans, D.B. Population-Based Study of Islet Cell Carcinoma. Ann. Surg. Oncol. 2007, 14, 3492–3500. [Google Scholar] [CrossRef] [PubMed]
- Yao, J.C.; Lombard-Bohas, C.; Baudin, E.; Kvols, L.K.; Rougier, P.; Ruszniewski, P.; Hoosen, S.; Peter, J.S.; Haas, T.; Lebwohl, D.; et al. Daily Oral Everolimus Activity in Patients with Metastatic Pancreatic Neuroendocrine Tumors After Failure of Cytotoxic Chemotherapy: A Phase II Trial. J. Clin. Oncol. 2010, 28, 69–76. [Google Scholar] [CrossRef]
- Moore, F.D.; Scoinski, M.A.; Joste, N.E. Endocrine tumors and malignancies. In Atlas of Diagnostic Oncology, 3rd ed.; Elsevier Sci. Ltd.: Philadelphia, PA, USA, 2003. [Google Scholar]
- Halfdanarson, T.R.; Rabe, K.G.; Rubin, J.; Petersen, G.M. Pancreatic neuroendocrine tumors (PNETs): Incidence, prognosis and recent trend toward improved survival. Ann. Oncol. 2008, 19, 1727–1733. [Google Scholar] [CrossRef] [PubMed]
- Yao, J.; Phan, A.T. Optimising Therapeutic Options for Patients with Advanced Pancreatic Neuroendocrine Tumours. Eur. Oncol. Haematol. 2012, 8. [Google Scholar] [CrossRef]
- Schurr, P.G.; Strate, T.; Rese, K.; Kaifi, J.T.; Reichelt, U.; Petri, S.; Kleinhans, H.; Yekebas, E.F.; Izbicki, J.R. Aggressive Surgery Improves Long-term Survival in Neuroendocrine Pancreatic Tumors: An institutional experience. Ann. Surg. 2007, 245, 273–281. [Google Scholar] [CrossRef]
- Falconi, M.; Eriksson, B.; Kaltsas, G.; Bartsch, D.K.; Capdevila, J.; Caplin, M.; Kos-Kudla, B.; Kwekkeboom, D.; Rindi, G.; Klöppel, G.; et al. ENETS Consensus Guidelines Update for the Management of Patients with Functional Pancreatic Neuroendocrine Tumors and Non-Functional Pancreatic Neuroendocrine Tumors. Neuroendocrinology 2016, 103, 153–171. [Google Scholar] [CrossRef]
- Kattan, M.W.; Hess, K.R.; Amin, M.B.; Lu, Y.; Moons, K.G.; Gershenwald, J.E.; Gimotty, P.A.; Guinney, J.H.; Halabi, S.; Lazar, A.J.; et al. American Joint Committee on Cancer acceptance criteria for inclusion of risk models for individualized prognosis in the practice of precision medicine. CA A Cancer J. Clin. 2016, 66, 370–374. [Google Scholar] [CrossRef]
- Lee, L.C.; Grant, C.S.; Salomao, D.R.; Fletcher, J.G.; Takahashi, N.; Fidler, J.L.; Levy, M.J.; Huebner, M. Small, nonfunctioning, asymptomatic pancreatic neuroendocrine tumors (PNETs): Role for nonoperative management. Surgery 2012, 152, 965–974. [Google Scholar] [CrossRef] [PubMed]
- Sallinen, V.; Le Large, T.Y.; Galeev, S.; Kovalenko, Z.; Tieftrunk, E.; Araujo, R.; Ceyhan, G.O.; Gaujoux, S. Surveillance strategy for small asymptomatic non-functional pancreatic neuroendocrine tumors–a systematic review and meta-analysis. HPB 2017, 19, 310–320. [Google Scholar] [CrossRef]
- Partelli, S.; Cirocchi, R.; Crippa, S.; Cardinali, L.; Fendrich, V.; Bartsch, D.K.; Falconi, M. Systematic review of active surveillance versus surgical management of asymptomatic small non-functioning pancreatic neuroendocrine neoplasms. BJS 2016, 104, 34–41. [Google Scholar] [CrossRef]
- Dong, D.; Zhang, X.; Poultsides, G.; Rocha, F.; Weber, S.; Fields, R.; Idrees, K.; Cho, C.; Maithel, S.K.; Pawlik, T.M.; et al. Impact of tumor size and nodal status on recurrence of nonfunctional pancreatic neuroendocrine tumors ≤2 cm after curative resection: A multi-institutional study of 392 cases. J. Surg. Oncol. 2019, 120, 1071–1079. [Google Scholar] [CrossRef]
- Haynes, A.; Deshpande, V.; Ingkakul, T.; Vagefi, P.A.; Szymonifka, J.; Thayer, S.P.; Ferrone, C.R.; Wargo, J.A.; Warshaw, A.L. Implications of Incidentally Discovered, Nonfunctioning Pancreatic Endocrine Tumors: Short-term and long-term patient outcomes. Arch. Surg. 2011, 146, 534–538. [Google Scholar] [CrossRef]
- Gratian, L.; Pura, J.; Dinan, M.; Roman, S.; Reed, S.; Sosa, J.A. Impact of Extent of Surgery on Survival in Patients with Small Nonfunctional Pancreatic Neuroendocrine Tumors in the United States. Ann. Surg. Oncol. 2014, 21, 3515–3521. [Google Scholar] [CrossRef]
- Sharpe, S.M.; In, H.; Winchester, D.J.; Talamonti, M.S.; Baker, M.S. Surgical Resection Provides an Overall Survival Benefit for Patients with Small Pancreatic Neuroendocrine Tumors. J. Gastrointest. Surg. 2015, 19, 117–123. [Google Scholar] [CrossRef] [PubMed]
- Marchegiani, G.; Landoni, L.; Andrianello, S.; Masini, G.; Cingarlini, S.; D’Onofrio, M.; De Robertis, R.; Davì, M.; Capelli, P.; Manfrin, E.; et al. Patterns of Recurrence after Resection for Pancreatic Neuroendocrine Tumors: Who, When, and Where? Neuroendocrinology 2019, 108, 161–171. [Google Scholar] [CrossRef]
- Fasano, M.; Della Corte, C.M.; Papaccio, F.; Ciardiello, F.; Morgillo, F. Pulmonary Large-Cell Neuroendocrine Carcinoma: From Epidemiology to Therapy. J. Thorac. Oncol. 2015, 10, 1133–1141. [Google Scholar] [CrossRef] [PubMed]
- Fournel, L.; Falcoz, P.E.; Alifano, M.; Charpentier, M.-C.; Boudaya, M.-S.; Magdeleinat, P.; Damotte, D.; Régnard, J.-F. Surgical management of pulmonary large cell neuroendocrine carcinomas: A 10-year experience. Eur. J. Cardiothorac. Surg. 2013, 43, 111–114. [Google Scholar] [CrossRef] [PubMed]
- Sarkaria, I.S.; Iyoda, A.; Roh, M.S.; Sica, G.; Kuk, D.; Sima, C.S.; Pietanza, M.C.; Park, B.J.; Travis, W.D.; Rusch, V. Neoadjuvant and Adjuvant Chemotherapy in Resected Pulmonary Large Cell Neuroendocrine Carcinomas: A Single Institution Experience. Ann. Thorac. Surg. 2011, 92, 1180–1187. [Google Scholar] [CrossRef] [PubMed]
- Rossi, A.; Cavazza, A.; Marchioni, A.; Longo, L.; Migaldi, M.; Sartori, G.; Bigiani, N.; Schirosi, L.; Casali, C.; Morandi, U.; et al. Role of Chemotherapy and the Receptor Tyrosine Kinases KIT, PDGFRα, PDGFRβ, and Met in Large-Cell Neuroendocrine Carcinoma of the Lung. J. Clin. Oncol. 2005, 23, 8774–8785. [Google Scholar] [CrossRef] [PubMed]
- Kujtan, L.; Muthukumar, V.; Kennedy, K.F.; Davis, J.R.; Masood, A.; Subramanian, J. The Role of Systemic Therapy in the Management of Stage I Large Cell Neuroendocrine Carcinoma of the Lung. J. Thorac. Oncol. 2018, 13, 707–714. [Google Scholar] [CrossRef] [PubMed]
- Rosen, L.E.; Gattuso, P. Neuroendocrine Tumors of the Breast. Arch. Pathol. Lab. Med. 2017, 141, 1577–1581. [Google Scholar] [CrossRef]
- Bussolati, G.; Badve, S. Carcinomas with neuroendocrine features. WHO Classif. Tumours Breast 2012, 4, 62–63. [Google Scholar]
- Brask, J.B.; Talman, M.-L.M.; Wielenga, V.T. Neuroendocrine carcinoma of the breast-a pilot study of a Danish population of 240 breast cancer patients. APMIS 2014, 122, 585–592. [Google Scholar] [CrossRef] [PubMed]
- Wei, B.; Ding, T.; Xing, Y.; Wei, W.; Tian, Z.; Tang, F.; Abraham, S.C.; Nayeemuddin, K.M.; Hunt, K.K.; Wu, Y. Invasive neuroendocrine carcinoma of the breast: A distinctive subtype of aggressive mammary carcinoma. Cancer 2010, 116, 4463–4473. [Google Scholar] [CrossRef]
- Lewis, A.; Raoof, M.; Ituarte, P.H.G.; Williams, J.; Melstrom, L.; Li, D.; Lee, B.; Singh, G. Resection of the Primary Gastrointestinal Neuroendocrine Tumor Improves Survival With or Without Liver Treatment. Ann. Surg. 2019, 270, 1131–1137. [Google Scholar] [CrossRef]
- DiNorcia, J.; Lee, M.K.; Reavey, P.L.; Genkinger, J.M.; Lee, J.A.; Schrope, B.A.; Chabot, J.A.; Allendorf, J.D. One Hundred Thirty Resections for Pancreatic Neuroendocrine Tumor: Evaluating the Impact of Minimally Invasive and Parenchyma-Sparing Techniques. J. Gastrointest. Surg. 2010, 14, 1536–1546. [Google Scholar] [CrossRef] [PubMed]
- Mayo, S.C.; de Jong, M.C.; Pulitano, C.; Clary, B.M.; Reddy, S.K.; Gamblin, T.C.; Celinksi, S.A.; Kooby, D.A.; Staley, C.A.; Stokes, J.B.; et al. Surgical Management of Hepatic Neuroendocrine Tumor Metastasis: Results from an International Multi-Institutional Analysis. Ann. Surg. Oncol. 2010, 17, 3129–3136. [Google Scholar] [CrossRef] [PubMed]
- Musunuru, S.; Chen, H.; Rajpal, S.; Stephani, N.; McDermott, J.C.; Holen, K.; Rikkers, L.F.; Weber, S.M. Metastatic Neuroendocrine Hepatic Tumors: Resection improves survival. Arch. Surg. 2006, 141, 1000–1004. [Google Scholar] [CrossRef]
- Martinez, L.; Puig, I.; Valls, C. Colorectal liver metastases: Radiological diagnosis and staging. Eur. J. Surg. Oncol. 2007, 33, S5–S16. [Google Scholar] [CrossRef]
- Merath, K.; Bagante, F.; Beal, E.; Lopez-Aguiar, A.G.; Poultsides, G.; Makris, E.; Rocha, F.; Kanji, Z.; Weber, S.; Fisher, A.; et al. Nomogram predicting the risk of recurrence after curative-intent resection of primary non-metastatic gastrointestinal neuroendocrine tumors: An analysis of the U.S. Neuroendocrine Tumor Study Group. J. Surg. Oncol. 2018, 117, 868–878. [Google Scholar] [CrossRef]


| Database | Search | Filters/Limits |
|---|---|---|
| PubMed | Tumors neuroendocrine | Humans English |
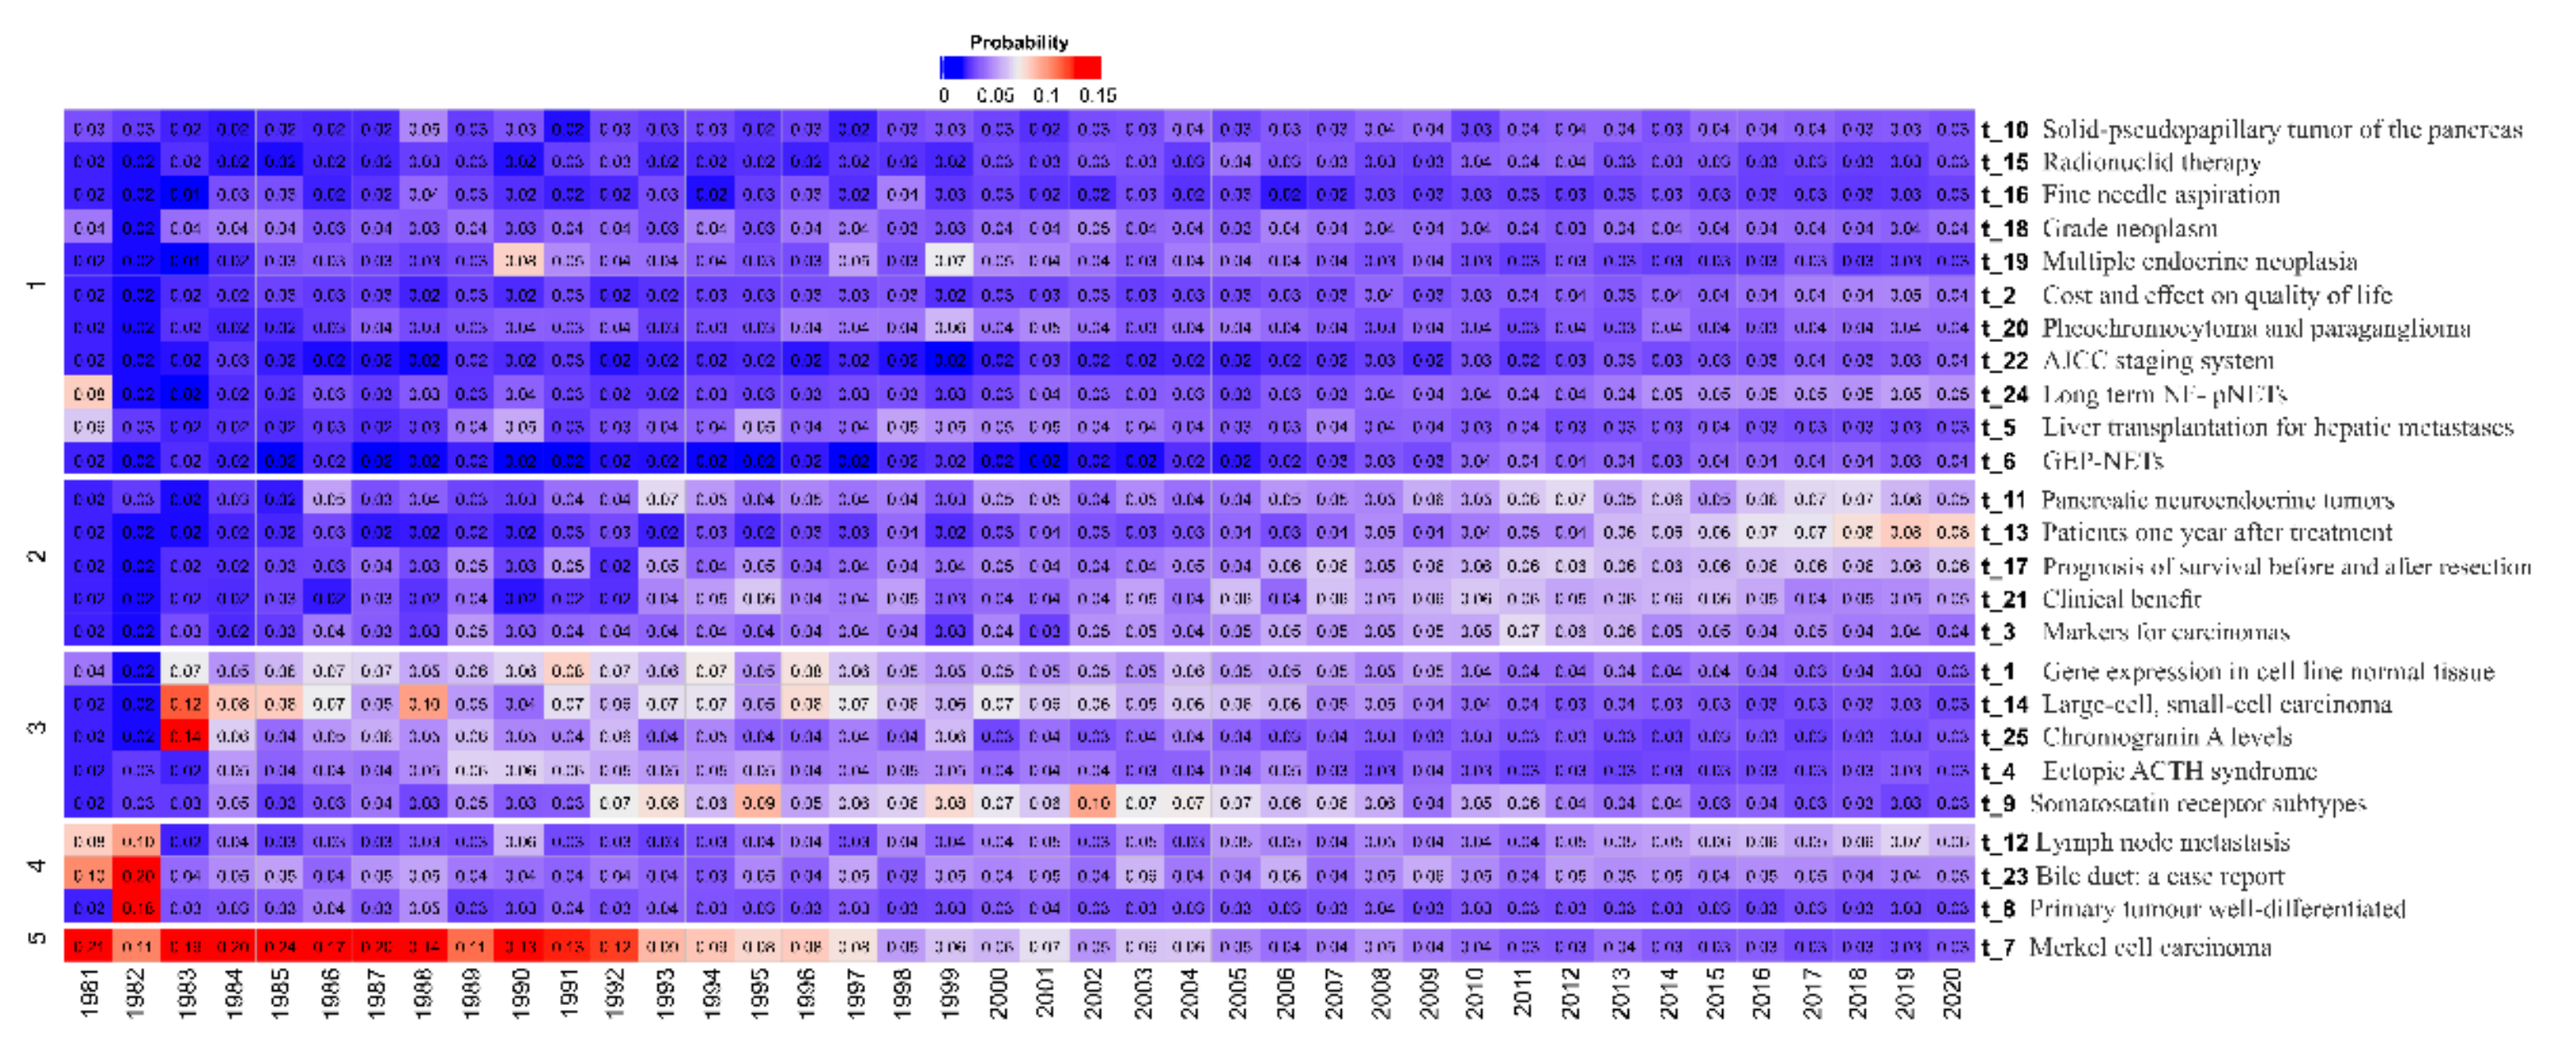
| TOPIC | TOPIC NAMES | P | PR | ART. | TOPICS TERMS | ||||
|---|---|---|---|---|---|---|---|---|---|
| t_21 | Clinical benefit | 5.4 | 1 | 630 | net | therapi | tumor | treatment | clinic |
| t_11 | Pancreatic neuroendocrine tumors | 5.9 | 2 | 561 | pancreat | tumor | neuroendocrin | present | report |
| t_13 | Patients one year after treatment | 6.3 | 3 | 552 | patient | year | ag | median | diagnosi |
| t_17 | Prognosis of survival before and after resection | 5.3 | 4 | 501 | surviv | patient | prognost | resection | analysi |
| t_3 | Markers for carcinomas | 5.1 | 5 | 483 | tumor | cell | neuroendocrin | ne | carcinoid |
| t_23 | Bile duct: a case report | 4.1 | 6 | 458 | case | report | rare | present | diagnosi |
| t_9 | Somatostatin receptor subtypes | 4.5 | 7 | 439 | receptor | somatostatin | tumor | somatostatin_receptor | analog |
| t_12 | Lymph node metastasis | 4.7 | 8 | 432 | resect | surgic | node | recurr | surgeri |
| t_7 | Merkel cell carcinoma | 4.1 | 9 | 349 | cell | tumor | posit | marker | stain |
| t_14 | Large-cell, small-cell, carcinoma | 4.0 | 10 | 340 | carcinoma | cell | carcinoid | lung | small |
| t_20 | Pheochromocytoma and paraganglioma | 3.6 | 11 | 315 | gene | mutat | pheochromocytoma | tumor | paraganglioma |
| t_1 | Gene expression in cell line normal tissue | 4.2 | 12 | 310 | express | cell | tissu | protein | tumor |
| t_5 | Liver transplantation for hepatic metastases | 3.3 | 13 | 281 | liver | metastas | hepat | metastat | primari |
| t_25 | Chromogranin A levels | 3.2 | 14 | 240 | level | cga | serum | chromogranin | measur |
| t_19 | Multiple endocrine neoplasia | 3.0 | 15 | 235 | men | endocrin | type | tumor | multipl |
| t_4 | Ectopic ACTH syndrome | 3.2 | 16 | 224 | carcinoid | symptom | hormon | tumor | syndrom |
| t_10 | Solid pseudopapillary tumor of the pancreas | 3.3 | 17 | 219 | pancreat | pancreat_tumor | pancrea | tumor | neoplasm |
| t_15 | Radionuclide therapy | 3.2 | 18 | 197 | therapi | dose | prrt | lu | radionuclid |
| t_24 | Long term NF- pNETs | 4.4 | 19 | 170 | pnet | year | group | rang | term |
| t_16 | Fine needle aspiration | 2.7 | 20 | 152 | diagnosi | eu | lesion | fna | biopsi |
| t_2 | Cost and effect on quality of life | 3.6 | 21 | 140 | clinic | data | base | manag | develop |
| t_18 | Grade neoplasm | 3.7 | 22 | 130 | tumor | featur | malign | grade | neoplasm |
| t_22 | AJCC staging system | 3.0 | 23 | 125 | stage | cancer | small | incid | system |
| t_6 | GEP-NETs | 3.3 | 24 | 89 | net | tumor_net | gep | gep_net | Gastroentero pancreat |
| t_8 | Primary tumor well-differentiated | 3.0 | 25 | 86 | differenti | tumor | well | primari | site |
Publisher’s Note: MDPI stays neutral with regard to jurisdictional claims in published maps and institutional affiliations. |
© 2021 by the authors. Licensee MDPI, Basel, Switzerland. This article is an open access article distributed under the terms and conditions of the Creative Commons Attribution (CC BY) license (https://creativecommons.org/licenses/by/4.0/).
Share and Cite
Escobar, K.M.; Vicente-Villardon, J.L.; de la Hoz-M, J.; Useche-Castro, L.M.; Alarcón Cano, D.F.; Siteneski, A. Frequency of Neuroendocrine Tumor Studies: Using Latent Dirichlet Allocation and HJ-Biplot Statistical Methods. Mathematics 2021, 9, 2281. https://doi.org/10.3390/math9182281
Escobar KM, Vicente-Villardon JL, de la Hoz-M J, Useche-Castro LM, Alarcón Cano DF, Siteneski A. Frequency of Neuroendocrine Tumor Studies: Using Latent Dirichlet Allocation and HJ-Biplot Statistical Methods. Mathematics. 2021; 9(18):2281. https://doi.org/10.3390/math9182281
Chicago/Turabian StyleEscobar, Karime Montes, José Luis Vicente-Villardon, Javier de la Hoz-M, Lelly María Useche-Castro, Daniel Fabricio Alarcón Cano, and Aline Siteneski. 2021. "Frequency of Neuroendocrine Tumor Studies: Using Latent Dirichlet Allocation and HJ-Biplot Statistical Methods" Mathematics 9, no. 18: 2281. https://doi.org/10.3390/math9182281
APA StyleEscobar, K. M., Vicente-Villardon, J. L., de la Hoz-M, J., Useche-Castro, L. M., Alarcón Cano, D. F., & Siteneski, A. (2021). Frequency of Neuroendocrine Tumor Studies: Using Latent Dirichlet Allocation and HJ-Biplot Statistical Methods. Mathematics, 9(18), 2281. https://doi.org/10.3390/math9182281