
Using K-Means Cluster Analysis and Decision Trees to Highlight Significant Factors Leading to Homelessness

 ,
,
Abstract
:1. Introduction
1.1. Homelessness in the United States
1.2. Methodological Approaches to Studying Homelessness in the United States
1.3. Recent Advances in Data Science Approaches to Studying Social Issues
1.4. Moving beyond Descriptive Studies of Homelessness
2. Materials and Methods
2.1. Study Sample
2.2. Cluster Analysis
2.3. K-Means Cluster Analysis
2.4. Factors Introduced to the K-Means Model
2.5. Decision Tree Analysis
3. Results
3.1. K-Means Cluster Analysis
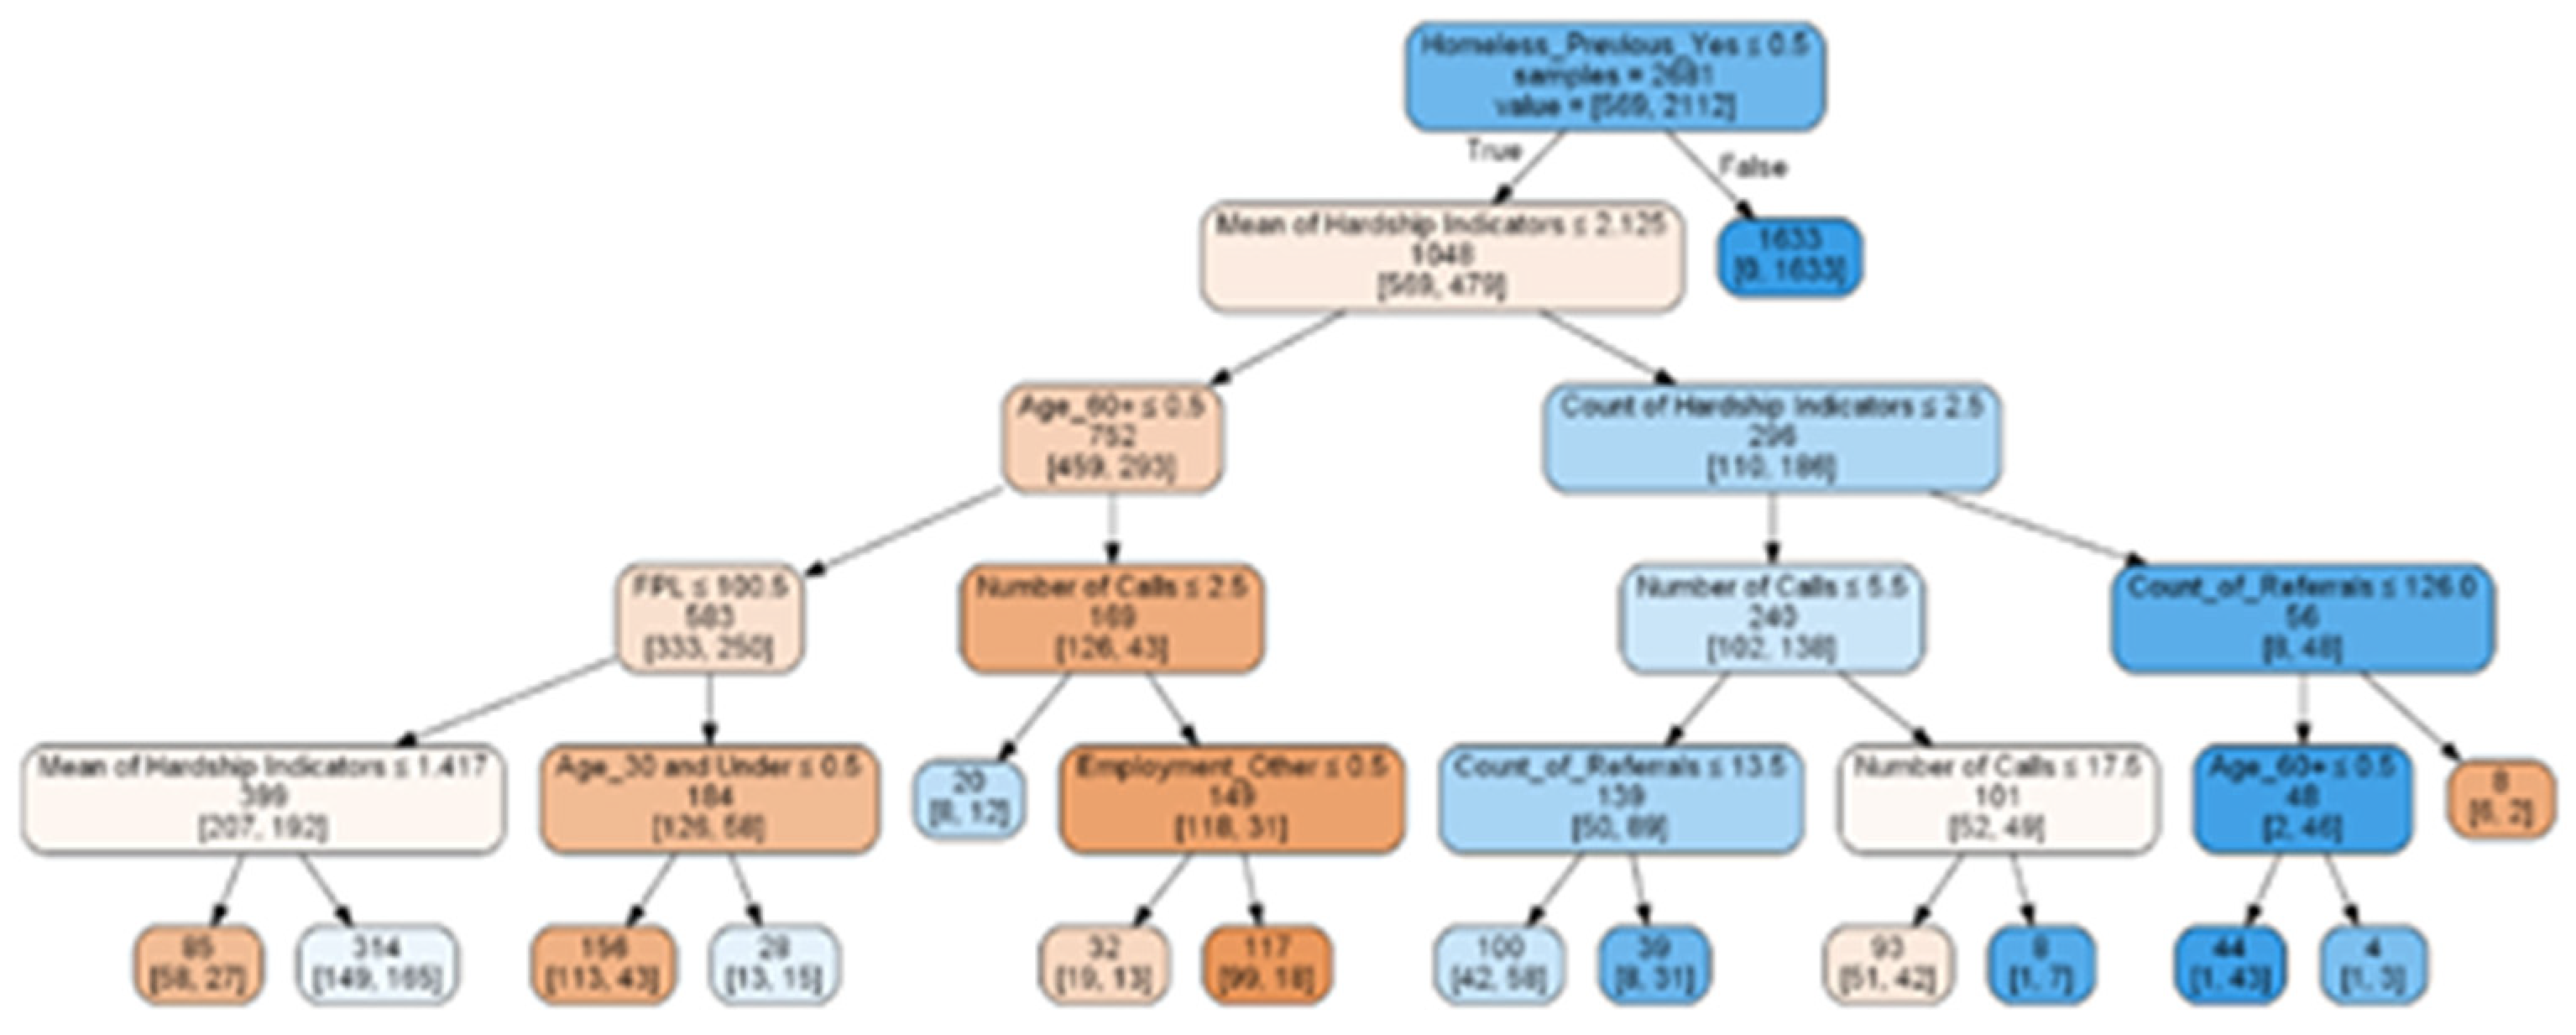
3.2. Decision Tree Analysis
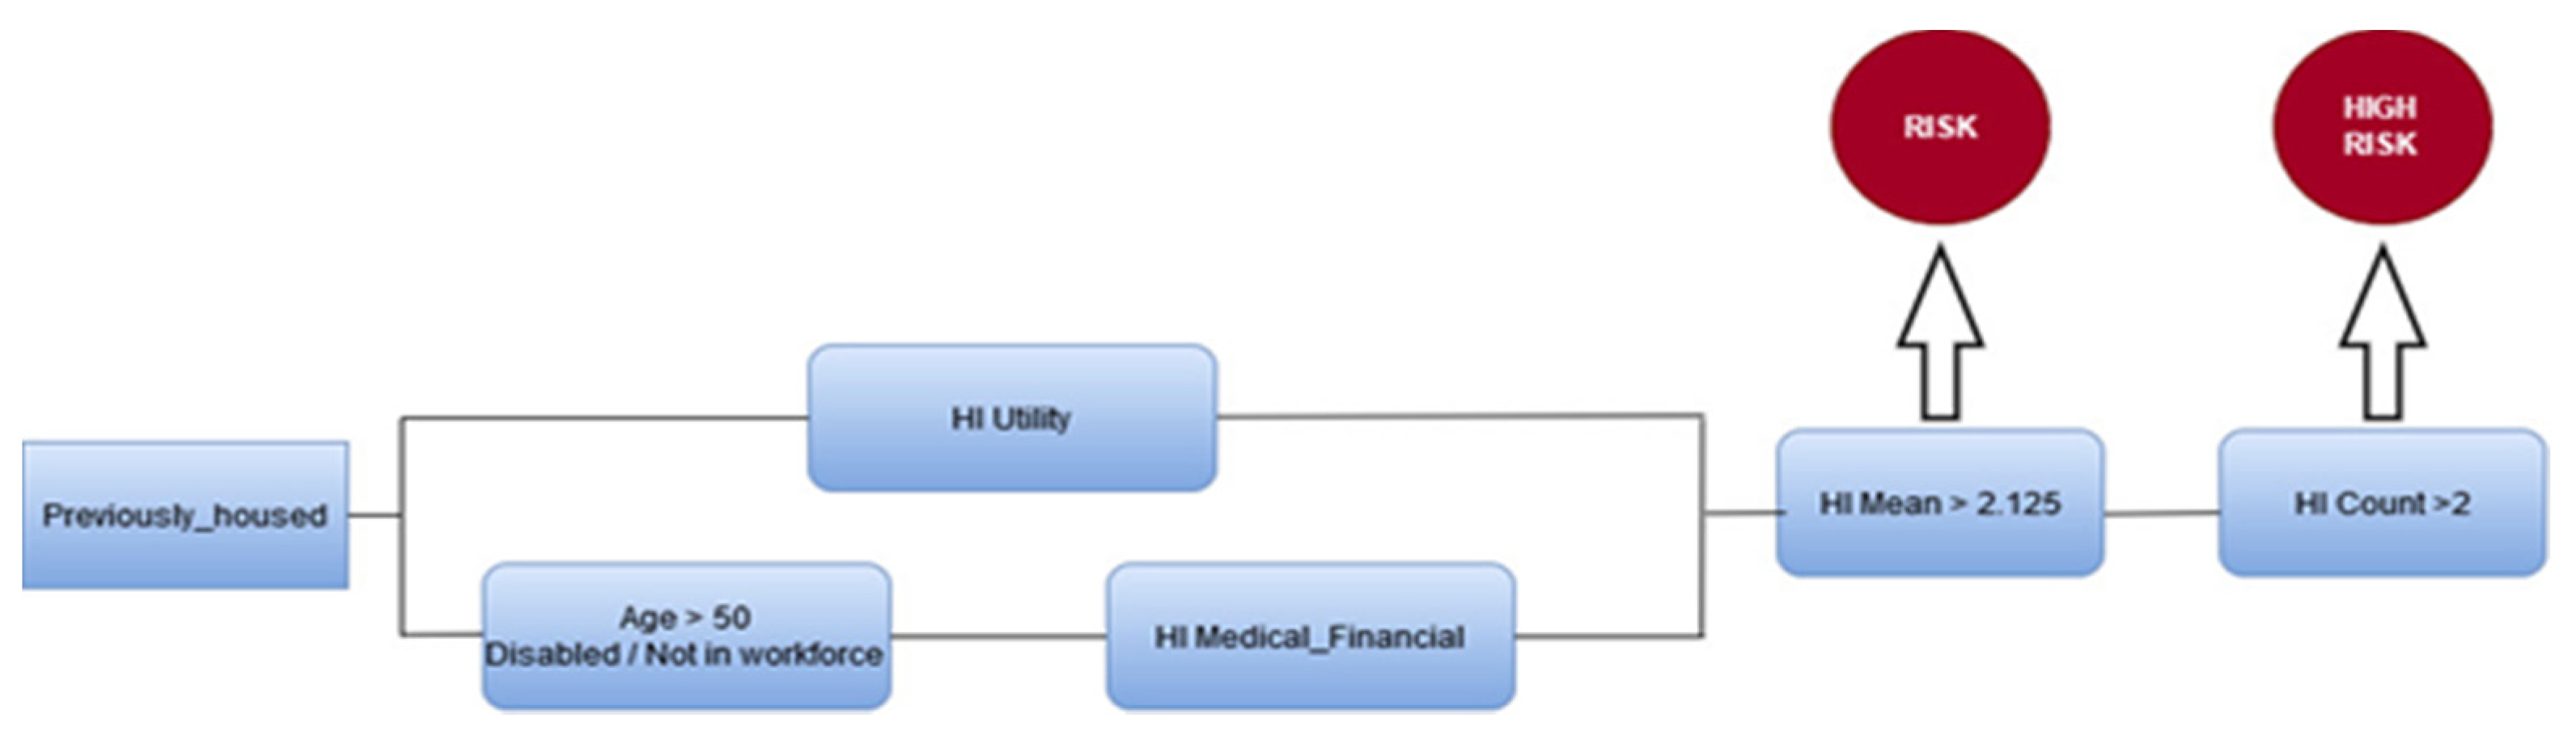
- If a client had a hardship indicator in the area of utilities AND demonstrated a mean hardship indicator score of two, meaning they had two other hardships while also facing an inability to pay their utility bills, the probability of becoming homeless in the future increased to a statistically significant level.
- If a client had a hardship indicator in the area of utilities AND demonstrated a mean hardship indicator score of more than two, meaning they had more than two other hardships while also facing an inability to pay their utility bills, the probability of becoming homeless in the future was highly statistically significant.
- The final pathway to homelessness occurred if a housed client was over 50 years old, male, disabled, and/or not in the workforce AND had ANY medical financial hardship and more than two other hardships at the same time. Respondents with these characteristics were highly statistically significantly more at risk of becoming homeless.
4. Discussion
5. Conclusions
5.1. Collective Impact Regional Data Hubs, like 2-1-1 San Diego’s CIE, Offer New Sources for High-Quality Quantitative Data on the Homeless Population, That Could Be Used to Replicate Study Findings and Expand Research of the Homeless Population in Other Geographies
5.2. Current Calculations of the Federal Poverty Level Do Not Include Regional Cost of Living and Inflation Adjustments, Potentially Leading to Higher Rates of Homeless Recidivism in Certain Geographies. Replicating Study Findings in Other Geographies Could Help Validate This Hypothesis
5.3. Measuring Social Determinants of Health Hardship Indicators When One Accesses Social Services Provides Additional Information to Further Assess Overall Risk across Complex Social Experiences, like the Experience of Homelessness
5.4. Having a Utility Hardship Indicator at Any Level and Two or More Other Social Determinants of Health Hardships That Co-Occur at the Same Time Create a Statistically Significant Probability of an Impending Homeless Event
5.5. A Health Medical Hardship Indicator at Any Level and More Than Two Other Hardships That Co-Occur Create a Highly Statistically Significant Probability of an Impending Homeless Event for Men Who Are Not Working and 50 or Older
Author Contributions
Funding
Institutional Review Board Statement
Informed Consent Statement
Data Availability Statement
Conflicts of Interest
References
- Kneebone, E. The Changing Geography of Disadvantage. In Shared Prosperity in America’s Communities; Watcher, S.M., Ding, L., Eds.; University of Pennsylvania Press: Philadelphia, PA, USA, 2016; pp. 41–56. [Google Scholar]
- Macdonald, D. Our Invisible Poor. New York, NY, USA. 11 January 1963. The January 19, 1963 Issue. Available online: https://stars.library.ucf.edu/cgi/viewcontent.cgi?article=1078&context=prism (accessed on 24 July 2021).
- Timmer, D.A.; Eitzen, S.; Talley, K.D. Paths to Homelessness: Extreme Poverty and the Urban Housing Crisis; Westview Press: Boulder, CO, USA, 1994. [Google Scholar]
- Saez, E. Striking it Richer: The Evolution of Top Incomes in the United States (Updated with 2012 Estimates); University of California: Berkeley, CA, USA, 2013. [Google Scholar]
- Denavas-Walt, C.; Procter, B.; Smith, J. Income, Poverty and Health Insurance Coverage in the United States: 2012; Current Population Reports; US Census Bureau: Washington, DC, USA, 2013.
- Chetty, R.; Ackerman, W. The Effects of Exposure to Better Neighborhoods on Children: New Evidence from the Moving to Opportunity Experiment: Data- Set. Am. Econ. Rev. 2016, 106, 855–902. [Google Scholar] [CrossRef] [PubMed] [Green Version]
- National Alliance to End Homelessness. State of Homelessness: 2020 Edition—National Alliance to End Homelessness. Available online: https://endhomelessness.org/homelessness-in-america/homelessness-statistics/state-of-homelessness-2020/ (accessed on 21 January 2021).
- Susser, I. Poverty and Homelessness in US Cities. In Cultural Diversity in the United States; Susser, I., Patterson, T.C., Eds.; Blackwell Publishers: Maiden, MA, USA, 2001; pp. 229–249. [Google Scholar]
- Jones, J. The Widening Gap Between Rich and Poor. Crit. Anthropol. 1993, 13, 247–267. [Google Scholar] [CrossRef]
- Liebow, E. Tally’s Corner; Little Brown Publishing: Boston, MA, USA, 1967. [Google Scholar]
- Jencks, C. The Homeless; Harvard University Press: Cambridge, MA, USA, 1994. [Google Scholar]
- Sidel, R. On Her Own: Growing Up in the Shadow of the American Dream; Viking Press: New York, NY, USA, 1990. [Google Scholar]
- Sidel, R. Women and Children Last; Basic Books: New York, NY, USA, 1992. [Google Scholar]
- Williams, T. The Cocaine Kids: The Inside Story of a Teenage Drug Ring; Addison-Wesley Publishers: Boston, MA, USA, 1989. [Google Scholar]
- Dehavenon, A. Where did all the men go? An Etic Model for the Cross-Cultural Study of the Causes of Matrifocality. In Where Did All the Men Go? Female-Headed Households Cross-Culturally; Mencher, J., Okongwu, A., Eds.; Westview Press: Boulder, CO, USA, 1993; pp. 53–69. [Google Scholar]
- Kuhn, R.; Culhane, D.P. Applying Cluster Analysis to Test a Typology of Homelessness by Pattern of Shelter Utilization: Results from the Analysis of Administrative Data. Am. J. Community Psychol 1998, 26, 207–232. [Google Scholar] [CrossRef] [PubMed] [Green Version]
- Chan, H.; Rice, E.; Vayanos, P.; Tambe, M.; Morton, M. Evidence From the Past: AI Decision Aids to Improve Housing Systems for Homeless Youth. In Proceedings of the National Clearinghouse on Homeless Youth & Families; University of Southern California Center for Artificial Intelligence in Society and Chapin Hall at the University of Chicago; The Westin Arlington Gateway; Arlington, VA, USA, 2017. [Google Scholar]
- Kania, J.; Kramer, M. Collective Impact. Stanford Social Innovation Review. 2011. Available online: https://ssir.org/articles/entry/collective_impact (accessed on 28 July 2021).
- Kolker, A. Community Data Sharing 101: General Warehouse Design. January 2021. Available online: https://www.nfocus.com/community-data-sharing-101-general-warehouse-design/ (accessed on 28 July 2021).
- Porter, N.D.; Verdery, A.M.; Gaddis, S.M. Enhancing big data in the social sciences with crowdsourcing: Data augmentation practices, techniques, and opportunities. PLoS ONE 2020, 15, e0233154. [Google Scholar] [CrossRef] [PubMed]
- Congdon, W.J.; Kling, J.R.; Mullainathan, S. Poverty and Inequality. In Policy and Choice: Public Finance through the Lens of Behavioral Economics; Brookings Institution Press, 2011; pp. 149–151. Available online: http://www.jstor.org/stable/10.7864/j.ctt127x9c.9 (accessed on 21 January 2021).
- Roleff, T.L. The Homeless: Opposing Viewpoints; Greenhaven Press: San Diego, CA, USA, 1995. [Google Scholar]
- San Diego Regional Task Force on Homelessness. 2019 RTFH Homeless Point in time Count. 2019. Available online: https://www.rtfhsd.org/wp-content/uploads/AnnuallayoutRevised9_3_20.pdf (accessed on 28 July 2021).
- US Census. US Census Quick Facts: San Diego County, California. 2019. Available online: https://www.census.gov/quickfacts/fact/table/sandiegocountycalifornia,CA/PST045219 (accessed on 28 July 2021).
- Aggarwal, C.C. An Introduction to Cluster Analysis. In Data Clustering: Algorithms and Applications; Aggarwal, C.C., Reddy, C.K., Eds.; CRC Press: Baton Rouge, FL, USA, 2014; pp. 2–15. [Google Scholar]
- Qualtrics. Cluster Analysis: Definition and Methods. Available online: https://www.qualtrics.com/experience-management/research/cluster-analysis/ (accessed on 21 January 2021).
- Reddy, C.K.; Vinzamuri, B. A Survey of Partitional and Hierarchical Clustering Algorithms. In Data Clustering: Algorithms and Applications; Aggarwal, C.C., Reddy, C.K., Eds.; CRC Press: Baton Rouge, FL, USA, 2014; pp. 88–93. [Google Scholar]
- World Health Organization. The Economics of Social Determinants of Health and Health Inequalities: A Resource Book; Available online: https://ebookcentral.proquest.com/lib/sandiego/reader.action?docID=1612011 (accessed on 21 January 2021).
- Health Leads USA. Learning from the Implementation of CSCA; Available online: http://healthleadsusa.org/wp-content/uploads/2020/08/Learning-from-the-Implementation-of-CSCA.pdf (accessed on 21 January 2021).
- Alelyani, S.; Tang, J.; Liu, H. Feature Selection for Cluster Analysis: A Review. In Data Clustering: Algorithms and Applications; Aggarwal, C.C., Reddy, C.K., Eds.; CRC Press: Baton Rouge, FL, USA, 2014; pp. 30–35. [Google Scholar]
- Ma, X. Using Classification and Regression Trees: A Practical Primer; Information Age Publishing: Charlotte, NC, USA, 2018; pp. 1–52. [Google Scholar]
- Homeless Hub. Homelessness Recurrence in Georgia: Descriptive Statistics, Risk Factors, and Contextualized Outcome Measurement; Available online: https://www.homelesshub.ca/resource/homelessness-recurrence-georgia-descriptive-statistics-risk-factors-and-contextualized (accessed on 21 January 2021).


| Housing | Gender Identity | Race and Ethnicity | ||||||||
|---|---|---|---|---|---|---|---|---|---|---|
| Homeless | Male | Female | White | African American | Asian | Hispanic | Native American | Other | Pac.Islander | Multi |
| Yes | 454 | 1103 | 440 | 393 | 20 | 340 | 21 | 27 | 16 | 91 |
| No | 492 | 1534 | 566 | 561 | 57 | 539 | 17 | 49 | 31 | 89 |
Publisher’s Note: MDPI stays neutral with regard to jurisdictional claims in published maps and institutional affiliations. |
© 2021 by the authors. Licensee MDPI, Basel, Switzerland. This article is an open access article distributed under the terms and conditions of the Creative Commons Attribution (CC BY) license (https://creativecommons.org/licenses/by/4.0/).
Share and Cite
Yoder Clark, A.; Blumenfeld, N.; Lal, E.; Darbari, S.; Northwood, S.; Wadpey, A. Using K-Means Cluster Analysis and Decision Trees to Highlight Significant Factors Leading to Homelessness. Mathematics 2021, 9, 2045. https://doi.org/10.3390/math9172045
Yoder Clark A, Blumenfeld N, Lal E, Darbari S, Northwood S, Wadpey A. Using K-Means Cluster Analysis and Decision Trees to Highlight Significant Factors Leading to Homelessness. Mathematics. 2021; 9(17):2045. https://doi.org/10.3390/math9172045
Chicago/Turabian StyleYoder Clark, Andrea, Nicole Blumenfeld, Eric Lal, Shikar Darbari, Shiyang Northwood, and Ashkan Wadpey. 2021. "Using K-Means Cluster Analysis and Decision Trees to Highlight Significant Factors Leading to Homelessness" Mathematics 9, no. 17: 2045. https://doi.org/10.3390/math9172045
APA StyleYoder Clark, A., Blumenfeld, N., Lal, E., Darbari, S., Northwood, S., & Wadpey, A. (2021). Using K-Means Cluster Analysis and Decision Trees to Highlight Significant Factors Leading to Homelessness. Mathematics, 9(17), 2045. https://doi.org/10.3390/math9172045