1. Introduction
1.1. Multiple Criteria Decision Making Methods
A group of multiple criteria (or multicriteria) decision-making (MCDM) methods (sometimes referred to as techniques) is widely considered to be one of the most important and often used support tools for decision-making processes in business and engineering, across a wide area of human interaction with natural and man-made subjects [
1,
2,
3,
4]. Typically, the methods deal with multiple conflicting evaluation criteria to select a single alternative or rank the alternative solutions to a decision-making problem.
Multiple criteria decision making is now a well-established, defined and comprehensively studied branch of operations research. Historically, the advent of MCDM coincided with the onset of wider usage of operations research tools and methods. While the core ideas exemplified by the multiple criteria methods can be traced back to the 18th century, if not earlier [
5], the methods widely used now, such as ELECTRE (1965) [
6], AHP (1977) [
7], TOPSIS (1980) [
8] and PROMETHEE (1986) [
9] were clearly first developed in the latter half of the 20th century as well as numerous others from the same group [
10,
11,
12].
An abundance of literature exists in relation to the scientific background of MCDM methods, including the discussion on their distinction, classification or their expected scope of use, and even more is written every day, in particular concerning the case studies of their usage in a professional environment [
13]. State of the art trends in MCDM during the previous decade reveal at least two clear threads: a tendency toward compartmentalization, i.e., providing the background for using the particular methods in particular settings, and the hybridization of well-known and other methods, with the inclusion of fuzzy or rough sets or the gray relational model approach [
14].
In many observed case studies, the recurring issue, directly related to the vast number (estimated to be higher than one hundred) of different MCDM methods, regards selecting the appropriate MCDM method to use. According to Wang et al. there are no better or worse methods, only methods that fit better to a certain situation. Furthermore, the authors state that there are three main disadvantages to the use of MCDM methods: different results when using the same method, different methods yielding different results and the fact that evaluation or comparison of MCDM methods is a complex issue [
15]. In these settings, it is not unusual to adopt and adapt an existing method or even develop a new one for the case in question.
The development of novel methods in MCDM does not seem to be a predominant research direction nowadays. According to Alinezhad and Khalili [
16], only a handful of methods developed in the last two decades are readily used in the business or engineering environment, for example MOORA (2006) [
17] and WASPAS (2012) [
18]. The reasons for this situation may stem from different sources, but these can be classified as coming from the overload of methods in use, the insufficient distribution of information regarding novel methods or simply from the timeframe necessary for a novel method to be widely adopted and used.
As the area of their use is expanding, MCDM methods deemed to be quite different in their approach are used in a similar context. Thus, a thorough review on the usability of methods in different settings and their advantages and disadvantages may be in order, alongside a detailed cross-section of the areas of use. In this paper, we present a short assessment of some of the methods used today (
Table 1). The assessment is compiled from the authors in [
19,
20,
21,
22,
23] and amended by selected methods TAOV [
24] ARAS [
25], and [
26] and GRA [
15,
27,
28].
MCDM methods have been extensively used in mining engineering and mineral processing. A comprehensive review on this issue has been presented by Sitorus et al. [
4]. According to Sitorus et al. decision makers in the mining and mineral processing industry often face complex problems where solving them involves multidisciplinary knowledge including technical, economic, environmental and social aspects, as well as politics and regulations [
29]. Furthermore, the trend of use of MCDM methods in mining and mineral processing, both individual and hybrid methods, has increased over the last fifteen years, but without the implementation of new or novel methods.
In this paper, two methods designed for the problem of ranking alternatives are presented. Both methods are two-staged, involving, in the first stage, the normalization, weighting and determining a “magnitude” of a component upon obtaining an optimal alternative and the decomposition of alternatives. In the second stage, the first method uses a trace of a matrix (multiple criteria ranking by alternative trace—MCRAT), while the second (ranking the alternatives by perimeter similarity—RAPS) uses the concept of perimeter similarity to determine the ranking of the alternatives.
The two novel methods were validated by comparing the results with the results ob-tained by seven well-known MCDM methods: TAOV [
24], ARAS [
30], SAW [
31], TOPSIS [
8], COPRAS [
32], VIKOR [
33], WASPAS [
18] and ELECTRE [
6]. The criteria for selecting these were the frequency of use in professional literature and/or similarity of the concept to the pro-posed methods. An evaluation of both methods by means of evaluation criteria proposed by Saaty and Ergu [
34] is provided in order to help the reader determine the potential scope of both methods.
1.2. Drilling and Blasting Problem
The mining process is a global industry that is of great importance for almost every product we use. Mining projects include many activities that need to be conducted to obtain a final product. Two of these activities are drilling and blasting. These two operations are inseparable, and their role is to separate rock from massive or secondary crushing of rocks.
When drilling and blasting are organized properly, the efficiency of the exploitation process increases and it leads to a reduction of production costs of these operations, which affect the overall production costs of the mine by about 25% to 40% [
35].
Many researchers have successfully investigated the possibilities of the application of MCDM methods for different drilling and blasting issues and have shown how to optimize parameters or to predict effects of negative consequences of this process, or how to lower the cost of it. Monjezi et al. [
36] applied the TOPSIS method to select the most appropriate pattern for limestone. Javad Rahimel et al. [
37] also used MCDM methods for selection of the optimal blasting pattern for one iron ore mine. They used AHP for determining the importance of criteria and after that they applied PROMETHEE and TOPSIS for ranking of alternatives. In both studies the result was the successful selection of an optimal blasting design.
The main aim of blasting in the mining process is to accomplish convenient fragmentation of rock which means a suitable size distribution of the rock that can be successfully loaded, transported and milled [
38] while at the same time minimize negative effects which can be dangerous for people and the environment. Researchers have conducted many studies about these unfavorable effects such as fly rock, air shock and ground vibrations [
39,
40,
41].
The third important aim of every mining operation, or in this case blasting, are costs. Bad fragmentation or a higher impact on the environment due to blasting operations leads to additional costs and that is certainly what experts do not want to achieve. In this paper, through mathematical assessment, we provided the optimal blasting design, respecting desirable fragmentation, reducing negative effects and minimizing the costs of these activities.
2. Materials and Methods
The most suitable way to describe the problem of alternative ranking is the decision-making matrix, abbreviated decision matrix:
where:
—a given set of alternatives, where m is the total number of alternatives
—a given set of criteria, where n is the total number of criteria
—an assessment of alternative Ai with respect to a set of criteria
Some of the criteria should be maximized while some minimized. If we face the problem, where all criteria tend to achieve max or min value, then in an artificial way one of the criteria is expressed by its reciprocal value. In this way, one criterion is being transformed to its opposite desired extreme value, while the rest stay the same. The purpose of such a transformation is to create an appropriate environment to decompose (separate) the decision-making space in two independent components (max and min components). The existence of max and min criteria is a necessary precondition for methods working properly.
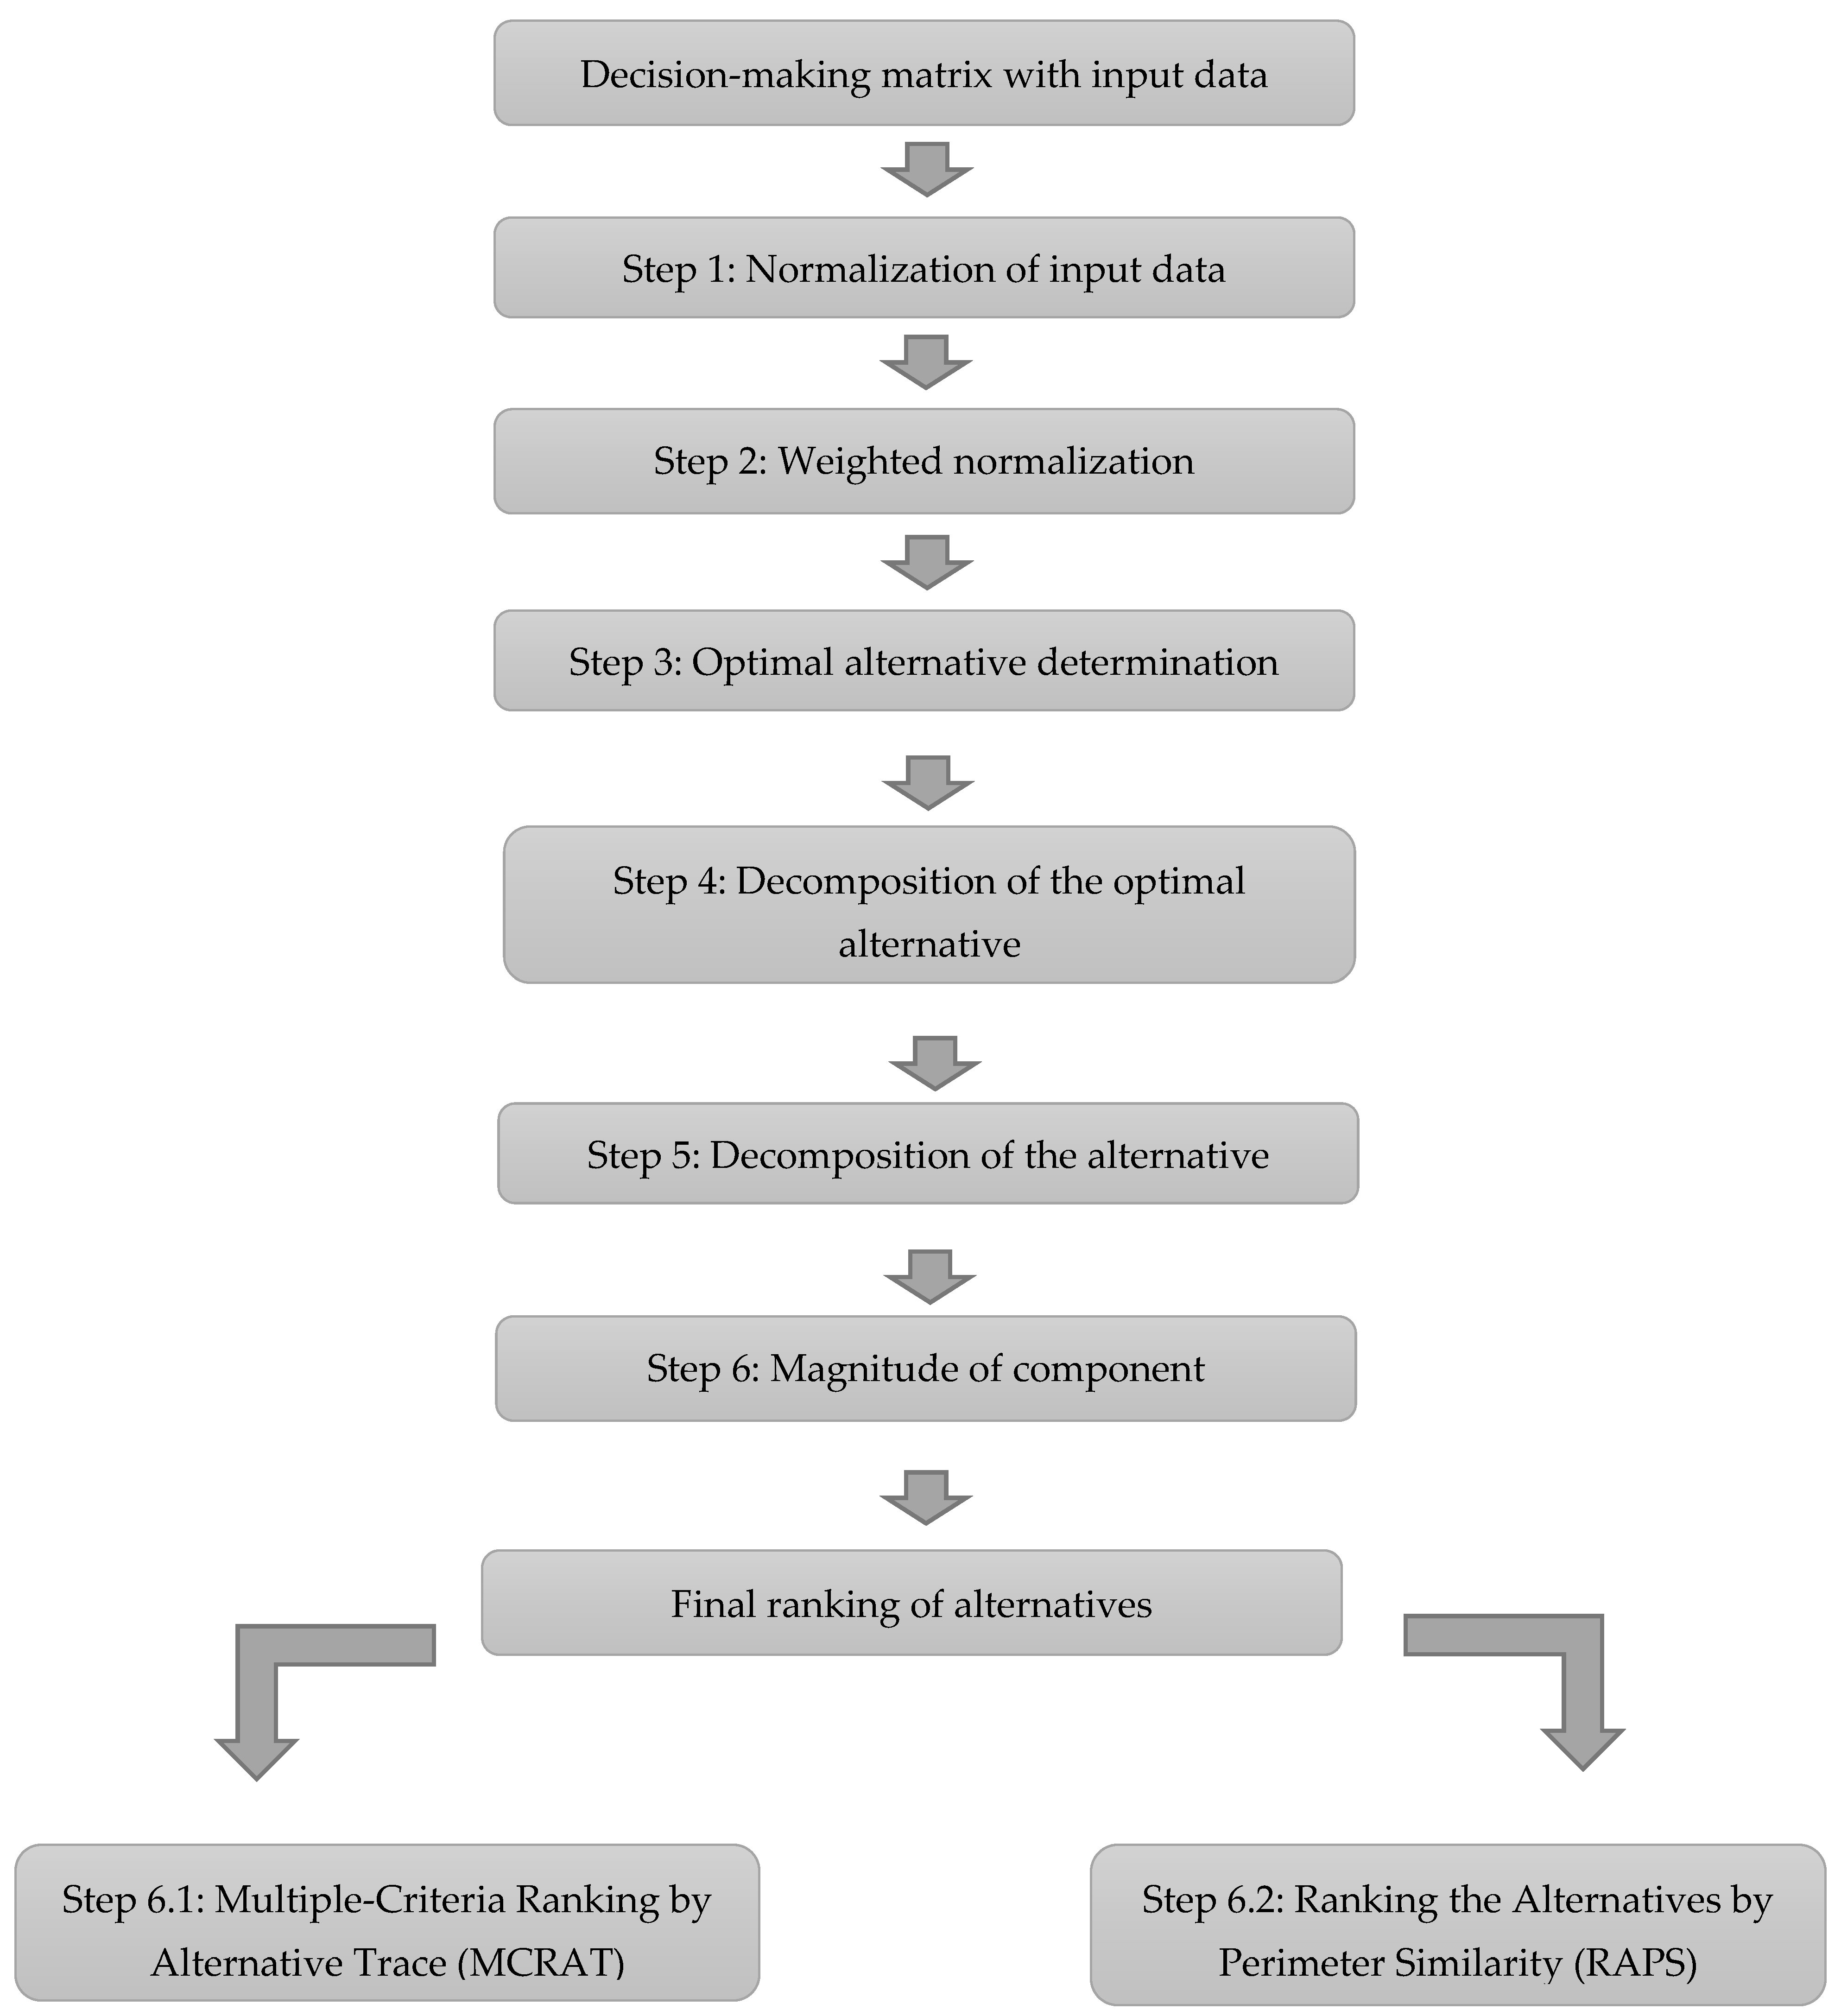
The procedure of extracting the rank of alternatives from the decision matrix is composed of the following steps:
Step 1: Normalization of input data
Each criterion is defined by its dimension: this means that we are facing the multidimensional problem. In such an environment it is very hard to make decisions. To avoid such difficulties, it is necessary to transform the multidimensional into a nondimensional decision space. For the max criteria we perform the following way of normalization:
while for the min criteria:
where:
Smax—a set of criteria that should be maximized
Smin—a set of criteria that should be minimized
The process of normalization yields the normalized decision matrix:
Step 2: Weighted normalization
For each normalized assessment
rij do the weighted normalization as follows:
The outcome of weighted normalization is the weighted normalized matrix:
To avoid subjectivity in the process of weighted normalization it is necessary to apply some objective method. In this paper, Shannon’s entropy method is used to define the weights of criteria [
42]. Compute the entropy
by:
The degree of diversification is calculated as:
Finally, the degree of criteria importance, i.e., criteria weights is defined as follows:
The sum of weights must equal one; .
Step 3: Optimal alternative determination
Determine each element of the optimal alternative as follows:
Optimal alternative is represented by the following set:
Step 4: Decomposition of the optimal alternative
This step implies decomposition of the optimal alternative in the two subsets or two components. The set
Q can be represented as the union of the two subsets:
If
k represents the total number of criteria which should be maximized, then
h=
n-
k represents the total number of criteria which should be minimized. Hence, the optimal alternative is defined as:
Step 5: Decomposition of the alternative
Similarly, to Step 4 we perform decomposition of each alternative:
Step 6: Magnitude of component
For each component of the optimal alternative, calculate the magnitude defined by:
The same approach is applied for each alternative.
From this point, we represent two methods developed to create the rank of alternatives. The first method is based on the trace of a matrix. The second method uses the similarity between the perimeter of the optimal alternative and the perimeter of the alternative.
Step 6.1: Multiple Criteria Ranking by Alternative Trace (MCRAT)
Create the matrix
F composed of optimal alternative components:
In addition, create the matrix
Gi composed of alternative components:
If
Ti is a matrix obtained by the product of matrix
F and
Gi:
Then, the trace of the matrix
Ti is as follows:
Alternatives are now ranked according to the descending order of tr (Ti).
Step 6.2: Ranking the Alternatives by Perimeter Similarity (RAPS)
Perimeter of the optimal alternative is expressed as the perimeter of the right-angle triangle. Components
Qk and
Qh represent the base and perpendicular side of this triangle, respectively.
Perimeter of each alternative is calculated the same way:
Perimeter similarity represents the ratio between the perimeter of each alternative and optimal alternative:
Alternatives are now ranked according to the descending order of PSi.
Figure 1 represents all of the abovementioned steps of extracting the rank of alternatives from the decision matrix.
3. Mining Problem
In this paper, a hypothetical dacite mine is considered, with an annual capacity of 300,000.00 tons of dacite in different fractions. To separate dacite from massif drilling, blasting operations are used.
It is necessary to consider all possible aspects in the design of drilling and blasting in order to minimize the impact of these operations on the environment and at the same time keep the costs of exploitation within the limits of acceptability.
The available equipment has the possibility to drill holes with three different diameters: 76-, 89- and 106-mm. The maximum size of fragmented dacite rock acceptable for crusher is 850 mm. The main explosive which is in use for blasting is based on TNT and ammonium nitrate, with characteristics which are suitable for blasting of hard rocks like dacite. The projected working slope is 75° and bench height is 15 m. For this purpose, 12 different blasting patterns are calculated, and their geometrical parameters are shown in
Table 2.
Represented in
Table 2 are 12 alternatives used for this purpose, where every alternative is described with geometrical parameters of the blasting pattern. Those geometrical specifications are hole diameter and length, stemming, burden, spacing and subdrill. Hole diameter depends on the available equipment, drill rig, that the mine has. In this case, there are three possibilities for the diameter value for the hole: 76, 89 and 106 mm. Hole length depends on bench height and its slope.
After putting explosives in the blast hole, the rest of the space in the hole is usually filled up with specific material; this process represents stemming. The task of stemming is to prevent the blowing of gases from the hole and thus enable the use of gas energy for the crushing of rock mass [
35].
Burden is the distance from a single row to the face of the excavation and spacing represents the lateral distance on centers between holes in a row. Subdrill is part of blasthole below floor level of the bench, with the purpose of ensuring the crushing of the rock in the lower part of the bench and providing successful blasting of the bench [
35].
All these parameters and their well-chosen combination lead to a successful blasting process. If some of these parameters are not suitable and do not match with the rest of the geometrical parameters, blasting will not provide convenient fragmentation or may cause some negative effect to the environment or can increase the cost of exploitation of raw materials. Therefore, it is important to align parameters and make sure that the exploitation process runs uninterrupted.
In accordance with the aims which are important to achieve in this example, five criteria are chosen to consider when selecting the best alternative. In
Table 3 these criteria are illustrated for all 12 alternatives individually.
In
Table 3, some of the most important products of explosion during blasting are shown. Some of them are important for the production process and others for environmental protection or economic aspects. Values in
Table 3 are the result of application of every one of the 12 alternatives described in
Table 2.
Powder factor is defined as an amount of explosive which will be enough to crush one cubic meter of rock [
35]. Powder factor is classified as a minimum value because of blasting cost: the higher the powder factor, the higher the cost of blasting.
The second criterion for selecting the most suitable pattern is fragmentation. Bad fragmentation of blasted rocks has a very significant influence on costs related to the production phases after primary blasting. In this case, desired fragmentation is specified by equipment used for the crushing of blasted rock. Fragment size of blasted rock is a function of site properties, blasting geometry, explosive strength, etc. In such an environment it is impossible to estimate the precise value of fragments. Values used in this calculation are approximate values of the biggest rock fragments obtained from the blasting process. The reciprocal value of fragmentation is used according to
Section 2 of this paper for the purpose of creating an environment in an artificial way, where two components can be separated in the decomposition process. Fragmentation expressed this way, tends to be the maximum.
Fly rock is one of the most undesired effects of blasting, that can endanger human beings and objects nearby blasting operations. This criterion should be defined as minimum because the lower the safety distance is, the bigger the chance to avoid the consequences of possible fly rock damage.
Air shock is one of the negative effects of blasting and it is characterized as minimum. This criterion represents the safety distance from the blast zone, where there are no possibilities the shock makes some damage to people or objects.
The fifth criterion used for selection is costs of every suggested pattern. Total costs for each pattern include labor force, energies, materials, etc. Costs are expressed in Euros. For optimal patterns, the most desired are the minimum costs.
The process of blasting includes preparation of patterns defined with geometrical parameters like those in
Table 2. When the pattern is ready, the explosive has to be placed in holes and then initiated and detonated. After that step, there is a very strong chemical reaction and products of explosion like energy, gases with very high temperatures and pressure spread. That energy provides the crushing of rocks and desired fragmentation but also produces negative effects like ground vibration, fly rock and air shock [
35].
4. Validity Test of Novel Methods
In this section, the correlation between novel methods and existing MCDM methods, which are already in use, is demonstrated. Examples are borrowed from researchers who already published their examinations.
4.1. The First Example for Testing
Zavadskas and Turskis [
25] used MCDM methods to evaluate 14 rooms according to six criteria for inside climate evaluation, as shown in
Table 4. Hajiagha et al. [
24] provided a solution of this problem by developing the TAOV method and presenting these results.
Criteria used to evaluate rooms by microclimate conditions were:
C1—the amount of air per head (should be maximized);
C2—relative air humidity (should be maximized);
C3—air temperature (should be maximized);
C4—illumination during work hours (should be maximized);
C5—rate of air flow (should be minimized);
C6—dew point (should be minimized).
Weights of all these criteria were based on the estimation of numerous experts in this field and determined by the method of pairwise comparison. The obtained weight vector of criteria is shown in
Table 4.
For the same numerical example, MCRAT and RAPS were applied, and the ranking by these two novel methods and a variety of other methods is presented in
Table 5.
Table 6 illustrates correlation degrees between novel methods and other methods for this numerical example.
From this table it can be seen that the least correlation of the MCRAT method is 79% with the VIKOR method. Correlation with the SAW method is 88%, while the MCRAT method has an over 90% correlation with all other methods in the table. The RAPS method is 78% with ELECTRE, which is the least correlation. Next are VIKOR with 80 %, SAW with 88% and TAOV with 89%, while all others have over 90% of correlation with RAPS.
4.2. The Second Example for Testing
Stanujkic et al. [
43] used multiple criteria decision-making methods on the example of ranking Serbian banks. Criteria used for evaluation of bank ranking (
Table 7) were:
L1—Cash and cash equivalent + cash due from financial institutions/total deposits (should be maximized)
L2—Total loans/total deposits (should be maximized)
L3—Net cash flow from operating activities/total cash flow (should be maximized)
E1—Operating cost/operating income (should be minimized)
E2—Provisions for loans/net interest income (should be minimized)
E3—Operating income/total number of employees (should be maximized)
P1—Profit before taxes/equity (should be maximized)
P2—Profit before taxes/asset (should be maximized)
P3—Profit before taxes/operating income (should be maximized)
C1—Total liabilities (should be minimized)
C2—Equity/loans (should be maximized)
C3—Total deposits/equity (should be minimized)
C4—Capital adequacy ratio (should be maximized)
After application of the MCRAT and RAPS methods on this example, ranking was obtained and calculated regarding correlation of existing methods applied in this example and novel methods. Results are shown in
Table 8.
In
Table 8 it can be seen that the highest correlation of novel methods is with VIKOR and GRA (MinMax). It is a very interesting fact that MCRAT and RAPS have a negative correlation with GRA(T), as with all other methods. It indicates the capability of the proposed methods to rank alternatives in a very successful way.
5. Numerical Example for the Mining Problem
For determination of the most economical and reliable blasting pattern and to satisfy environmental issues we applied the above explained two novel methods MCRAT and RAPS based on the MCDM process. Every pattern which is used in the selecting process has determined values of each criterion.
Selecting an appropriate blasting pattern is very important because an incorrect choice causes many problems such as disruption of the mining process, raising of costs and safety issues for employees and the environment.
After presenting the results of the application of each pattern and showing values for every criterion considered,
Table 9 shows the classification of each criterion to max or min.
The next step for decision making was to normalize input data.
Table 10 shows the normalization of the criteria in
Table 9.
For determining the weights of each criterion, we used Shannon’s entropy method (42), and in that way avoided subjectivity of this process.
Table 11 shows weights for each criterion. They are also presented in
Figure 2.
After applying Shannon’s entropy method and getting weights for each criterion, the next step was to perform a weighted normalized matrix as shown in
Table 10. These results are presented in
Table 12.
The next step involved determining the optimal alternative by applying Formula 7. Results of this step are shown in
Table 13.
Table 14 represents the decomposition of the optimal alternative.
In
Table 15, the decomposition of each of the alternatives for the selecting process for obtaining an optimal solution for the blasting design is presented.
The next step in this selection process was to calculate the magnitude of the optimal and other components using Formulas (16)–(18). Values obtained within this step are shown in
Table 16.
Multiple Criteria Ranking by Alternative Trace (MCRAT)
Matrix
F composed of optimal alternative components is as follows:
Matrix
G1 composed of A1 alternative components is as follows:
The matrix
T1 defined by the product of matrix
F and
Gi is:
Trace of the matrix
T1 is as follows:
Table 17 represents the trace of the matrix
T1,
T2,...,
T12.
After representing the trace of the matrix
T1,
T2,...,
T12, in the previous table, we can demonstrate the final step: ranking by descending order as presented in
Table 18.
Ranking the Alternatives by Perimeter Similarity (RAPS)
According to Equations (24)–(26) the following results were obtained and shown in
Table 19.
Alternatives are now ranked according to the descending order of the obtained perimeter similarities and shown in
Table 20.
6. Discussion
In this paper, two novel MCDM methods are presented, tested and validated in a mining engineering setting. The methods, MCRAT and RAPS, use the matrix trace and perimeter similarity concepts, respectively, to obtain a ranking of alternatives. Results obtained were compared with results obtained by seven well-known and widely used MCDM methods by means of rank correlation: TAOV, ARAS, SAW, TOPSIS, COPRAS, VIKOR, WASPAS and ELECTRE.
Results obtained by the MCRAT method show the best correlation with TOPSIS (0.97), and the worst with VIKOR (0.79), while the RAPS method shows the best correlation with TOPSIS and COPRAS (0.96) and the worst with VIKOR (0.80). In addition, the mutual rank correlation coefficient between the two methods is very high (0.98).
By observing the obtained order of alternatives, it can be noted that the first ranked alternatives coincide for all methods observed, apart from the ARAS method. The same is valid for the second ranked alternative, i.e., alternative no. 9 is second place for all methods, apart from ARAS (first place). Furthermore, there are no major discrepancies in ranking orders, meaning that the average order of alternatives is preserved throughout the results of all methods.
In another example, some other MCDM methods are added, and a calculation of correlation is performed. The novel methods have the highest correlation with VIKOR and GRA (MinMax). MCRAT and RAPS have a negative correlation with GRA(T), as do other methods in this example. This indicates the capability of the proposed methods to rank alternatives in a very successful way. The mutual rank correlation between the two novel methods in this example is 1.
An evaluation of both novel methods by means of evaluation criteria proposed by Saaty and Ergu [
34] is provided in order to help the reader determine the potential scope of both methods.
Table 21 summarizes the preliminary evaluation of MCRAT and RAPS according to a list of criteria developed by Saaty and Ergu. The evaluation is deemed preliminary because in cases where an evaluation criterion is related to certain aspects of the procedures for both methods (such as generalization to ranking of intangibles or rank preservation) the potential of both methods is designed to be without limitations but remains to be tested.
In this analysis, the authors’ recommendation on rating of the methods system was used as well.
It can be concluded that, despite having different mathematical interpretations, since both methods rely on the same initial presumptions and inception procedures, the validation results are the same. This is a reasonable result since the validation criteria suggested by Saaty and Ergu deal with general notions and settings of a MCDM method.
Based on the comparison of obtained ranks with the other MCDM methods for a mining engineering problem, and the evaluation of both methods, both are suitable for use in an MCDM environment.
For a hypothetical dacite mine with an annual capacity of 300,000.00 tons of different fractions of dacite, the authors calculated 12 different blasting patterns, because drilling and blasting are methods which are used for separating dacite from Rock mass. Results of each pattern are shown as five criteria to evaluate alternatives and select the optimal one. Criteria that the authors used as the most important for an adequate blasting process were powder factor, fragmentation, fly rock, air shock and cost of each pattern applied. Each criterion presented some important aspect of the mining process that should be paid maximum attention. Those aspects imply production, safety issues and economic effects.
7. Conclusions
This research presented two novel methods of MCDM and has shown how to successfully apply those methods to mining engineering problems. Decision making in blasting design is difficult because experts must consider many attributes that undoubtedly have an influence on the evaluation of blasting design. Safety is vital for this operation because if it is not conducted properly, it may cause irreparable damage by endangering employees, equipment or the environment.
In a previous part of this paper, two novel methods (MCRAT and RAPS) were applied to select the optimal pattern by considering five criteria important for the mining process. In each selecting process alternative, 3 (A3) has been optimal solution in this particular example. The alternative with a hole diameter of 76 mm, hole length of 16.3 m, stemming of 3 m, burden of 3 m, spacing of 3 m and subdrill of 0.76 m has been selected as optimal for dacite blasting with geometry and conditions described in this paper.
Further research can be related by increasing the uncertainty of input data. The model is not closed and can be extended with the application of fuzzy or interval numbers directly in calculations. Including that volatile environment of input data helps a mining company to develop a reliable and realistic mine production plan. In addition, the application of stochastic differential equations can be applied to describe the future change of some criteria such as costs through the time period. In that way, we can create a dynamic model burdened with some uncertainties.


