Article

Opinion Diversity and the Resilience of Cooperation in Dynamical Networks

Department of Computing and Mathematics, John R. Dalton Building, All Saints Campus, Manchester M15 6BH, UK
*
Author to whom correspondence should be addressed.
Mathematics 2021, 9(15), 1801; https://doi.org/10.3390/math9151801
Submission received: 14 May 2021 / Revised: 8 June 2021 / Accepted: 24 July 2021 / Published: 29 July 2021
(This article belongs to the Section Network Science)

Abstract

:
Across various scenarios, individuals cooperate with others to contribute towards a shared goal and ensure self-preservation. In game theory, the act of cooperation is considered as an individual producing some form of benefit to be utilised by others, under the expectation others will return the favour. In several scenarios, individuals make use of their own information to aid with their decision about who to connect and cooperate with. However, the choice of cooperation can be taken advantage of by opportunistic defectors, which can lead to significant disruption. This paper investigates how the diversity of opinion can contribute to the structure and mechanics of a dynamical network model and to the resilience of cooperation, by utilising a computational model where individuals make use of both public and private information to implement their decision. Our results show that increasing diversity leads to more stable, less connected and less prosperous networks coupled to more frequent, but shallower information cascades. Our work generally shows that the outcome of the conflict between cooperators and cheaters strongly depends on the interplay between population structure, individual decision making and individual opinions.

1. Introduction

In many aspects of life on earth, cooperation can be observed in various forms [1,2,3]. This type of behaviour can be seen in manmade concepts such as the economy and politics [4,5,6] and can also be observed in many areas of nature [5,7], including animal social groups, evolutionary processes and biological systems. Once plotted out, these networks can be analysed to determine how interconnected nodes are and which nodes possess the highest level of ‘social capital’, which can be influenced by factors such as a higher level of connectivity or providing access to other parts of a network [8,9]. Of course, analysis of these networks can expand beyond analysing network structures; how these nodes interact and behave with each other is considered in the field of game theory [7,10].
Here, cooperation is defined as an individual producing a kind of benefit/commodity that each of the neighbours it is connected with via an edge will gain, at some individual cost. For example, in a community of bees, a worker bee will put aside their own reproductive potential to protect the hive, this in turn raises the reproductive potential of other bees [7]. In an ideal scenario, the connected neighbours will engage in like-minded behaviour, which should make up for the cost of cooperation and allow for all parties to reap the benefits and support each other [11,12,13]. This type of behaviour can range between interactions among just two individuals to entire networks of individuals with varying amounts of available connections with others, which can take the form of communities of varying scale and connectivity [14,15].
At face value, this mindset should mean that all individuals within a network should be able to look out for each other and collectively take advantage of the benefits that this cooperation produces. However, as both history [6] and certain games [10,16] illustrate, this altruistic behaviour can be taken advantage of by opportunistic cheaters within the network. In game theory, a defector is considered an individual that will take no personal cost and produce no benefits for its neighbours but will still take produced benefits from each of its cooperative neighbours. One game that illustrates this cooperation based problem is the prisoner’s dilemma [10]. Here, both individuals have the option to either cooperate or defect, with a different payoff for each player depending on combination of selected options. Upon inspecting the payoffs from each scenario (Figure 1), it becomes clear that the most logical choice is to always defect against your opponent, in order to minimise your losses and maximise your gains.
This paper aims to expand upon the work previously carried out by Yang et al. [17]. The results presented in [17] demonstrate how the presence of public and private information available to nodes can affect which nodes they formed connections with. In [17], potential neighbours that a newcomer can form connections with are limited to those that its chosen role model is currently connected to. Node prosperity is used by newcomers when selecting a role model, which can indicate which nodes are performing well. Public information is based on the number of existing connections a potential neighbour had compared to the rest of the network. Private information is represented as a newcomer’s ability to perceive whether a potential neighbour is trustworthy. These pieces of information are utilised as part of a newcomer’s decision-making process to determine if it should form a connection with a potential neighbour. In this sense, the approach proposed in [17] and extended here is different from classical voter models [18]. In this case, individuals do not change their opinions based on the opinions of others, but rather use the available public and private information available to make a decision about connecting to potential partners.
In the model studied in [17], each node shares the same values when carrying out decision making, i.e., the same τ value used to perceive if a potential neighbour is trustworthy. However, it is likely that individuals within a network possess a more diverse range of opinions, some individuals are cautious whilst others are more trusting than their peers. This paper seeks to explore this possibility and expand on work previously carried out by Yang et al. [17] by incorporating opinion diversity into the existing simulation model. This is achieved by introducing a parameter that represents the possibility of different opinions between the individuals. Here, we assume that individuals do not have their private opinion influenced by others, which has been explored in other previous work [19], and instead assume that their actions are influenced by observing other individual’s actions that may lead to the emergence of information cascades. To enable this study, we utilise a computational model that is capable of simulating the scenarios described thus far, which is discussed in detail in Section 2. To evaluate the dynamics of the population, we make use of an agent-based model and computer simulations where the networks are gradually subjected to an increasing level of opinion diversity to determine how this affects the level of cooperation within a network and its underlying structure and stability (Section 3). The obtained results show that increasing diversity of opinion can have an important effect on the topology and instability of the networks, the amount of cooperation and the emergence of information cascades. The findings of these results are discussed in greater detail in Section 4, followed by concluding remarks in Section 5.

2. Materials and Methods

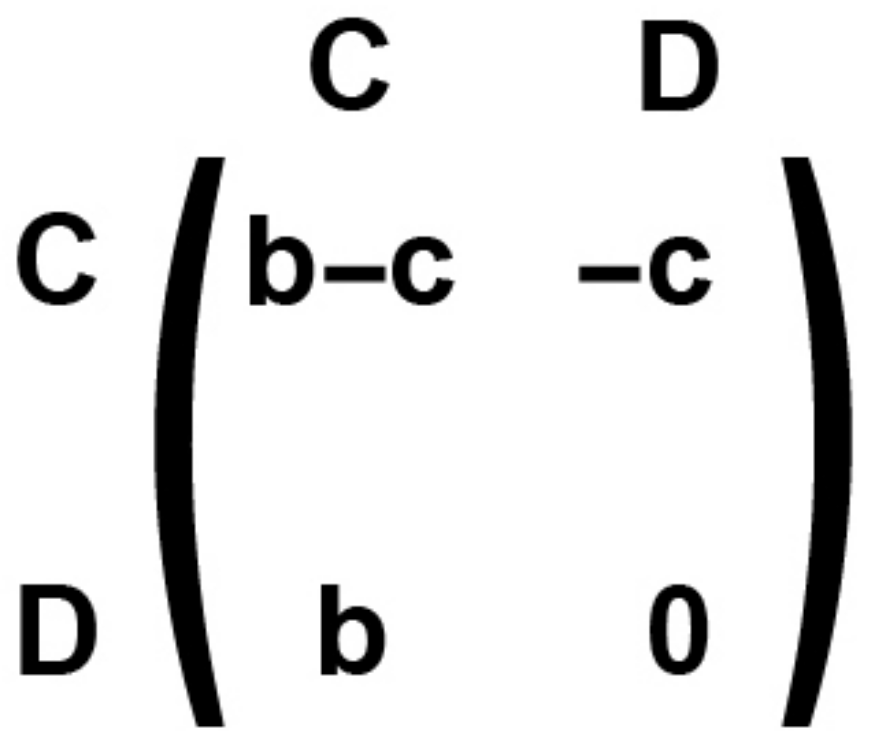
2.1. Computational Model

The model utilised for this paper expands upon the one presented in [17] to explore the question of how a diversity of opinion can affect cooperation and network well-being. Firstly, parameter N is used to set the number of nodes present in the network whilst E will set the initial number of edges present in the network. The number of nodes determined by N will remain constant throughout a simulation as in the Moran process, often used to abstract the notion of carrying capacity in evolutionary game theory models [7].
We utilise the prisoner’s dilemma (Figure 1) to investigate the conflict that can arise between cooperators and cheaters. Its payoff matrix will utilise parameter b to indicate the benefits that are produced through the act of cooperation. The model will also utilise parameter c to represent the cost that is incurred when an individual chooses to cooperate. We assume that b has been set to 10 and c has been set to 8. The payoff P i that is received by each node i present within a network is calculated by summing the payoffs obtained considering all interactions with its neighbours. For example, a cooperator with K adjacent cooperators and J adjacent cheaters will obtain a payoff as described in Equation (1). A cheater with K adjacent cooperators and J adjacent cheaters will obtain a payoff as described in Equation (2).
K ( b c ) + J ( c )
K ( b ) + J ( 0 )
Parameter δ is used to determine the selection strength and will influence the probability of nodes being selected by newcomers based on their current payoff P. This parameter is used to calculate the fitness of each node i within the network which is determined by Equation (3). Increasing this parameter will affect the probability that nodes with greater payoffs are chosen to act as role models for newcomers that are added to the network.
( 1 + δ ) P i
At each step during a simulation, a newcomer is incorporated into the network (Figure 2). Firstly, a node is randomly selected to act as a role model for the newcomer (Figure 2a). The selection of a node as role model is influenced by the level of fitness of the node, as described in Equation (3). The higher this value is, the more likely it is chosen to act as the newcomer’s role model. Increasing parameter δ will make it more likely for nodes with a higher payoff to be selected as role models. Implementing node fitness in this manner allows for fine adjustment of the intensity of selection within a network, which will allow for greater flexibility without losing generality [20,21]. Upon selecting a role model, the newcomer will next determine if it will adopt the same strategy of its role model (Figure 2b). A probability of μ is used to determine the likeliness that a mutation will occur. During all simulations, parameter μ is set to 0.0001. If a newcomer mutates, it will instead imitate the opposite strategy of its role model.

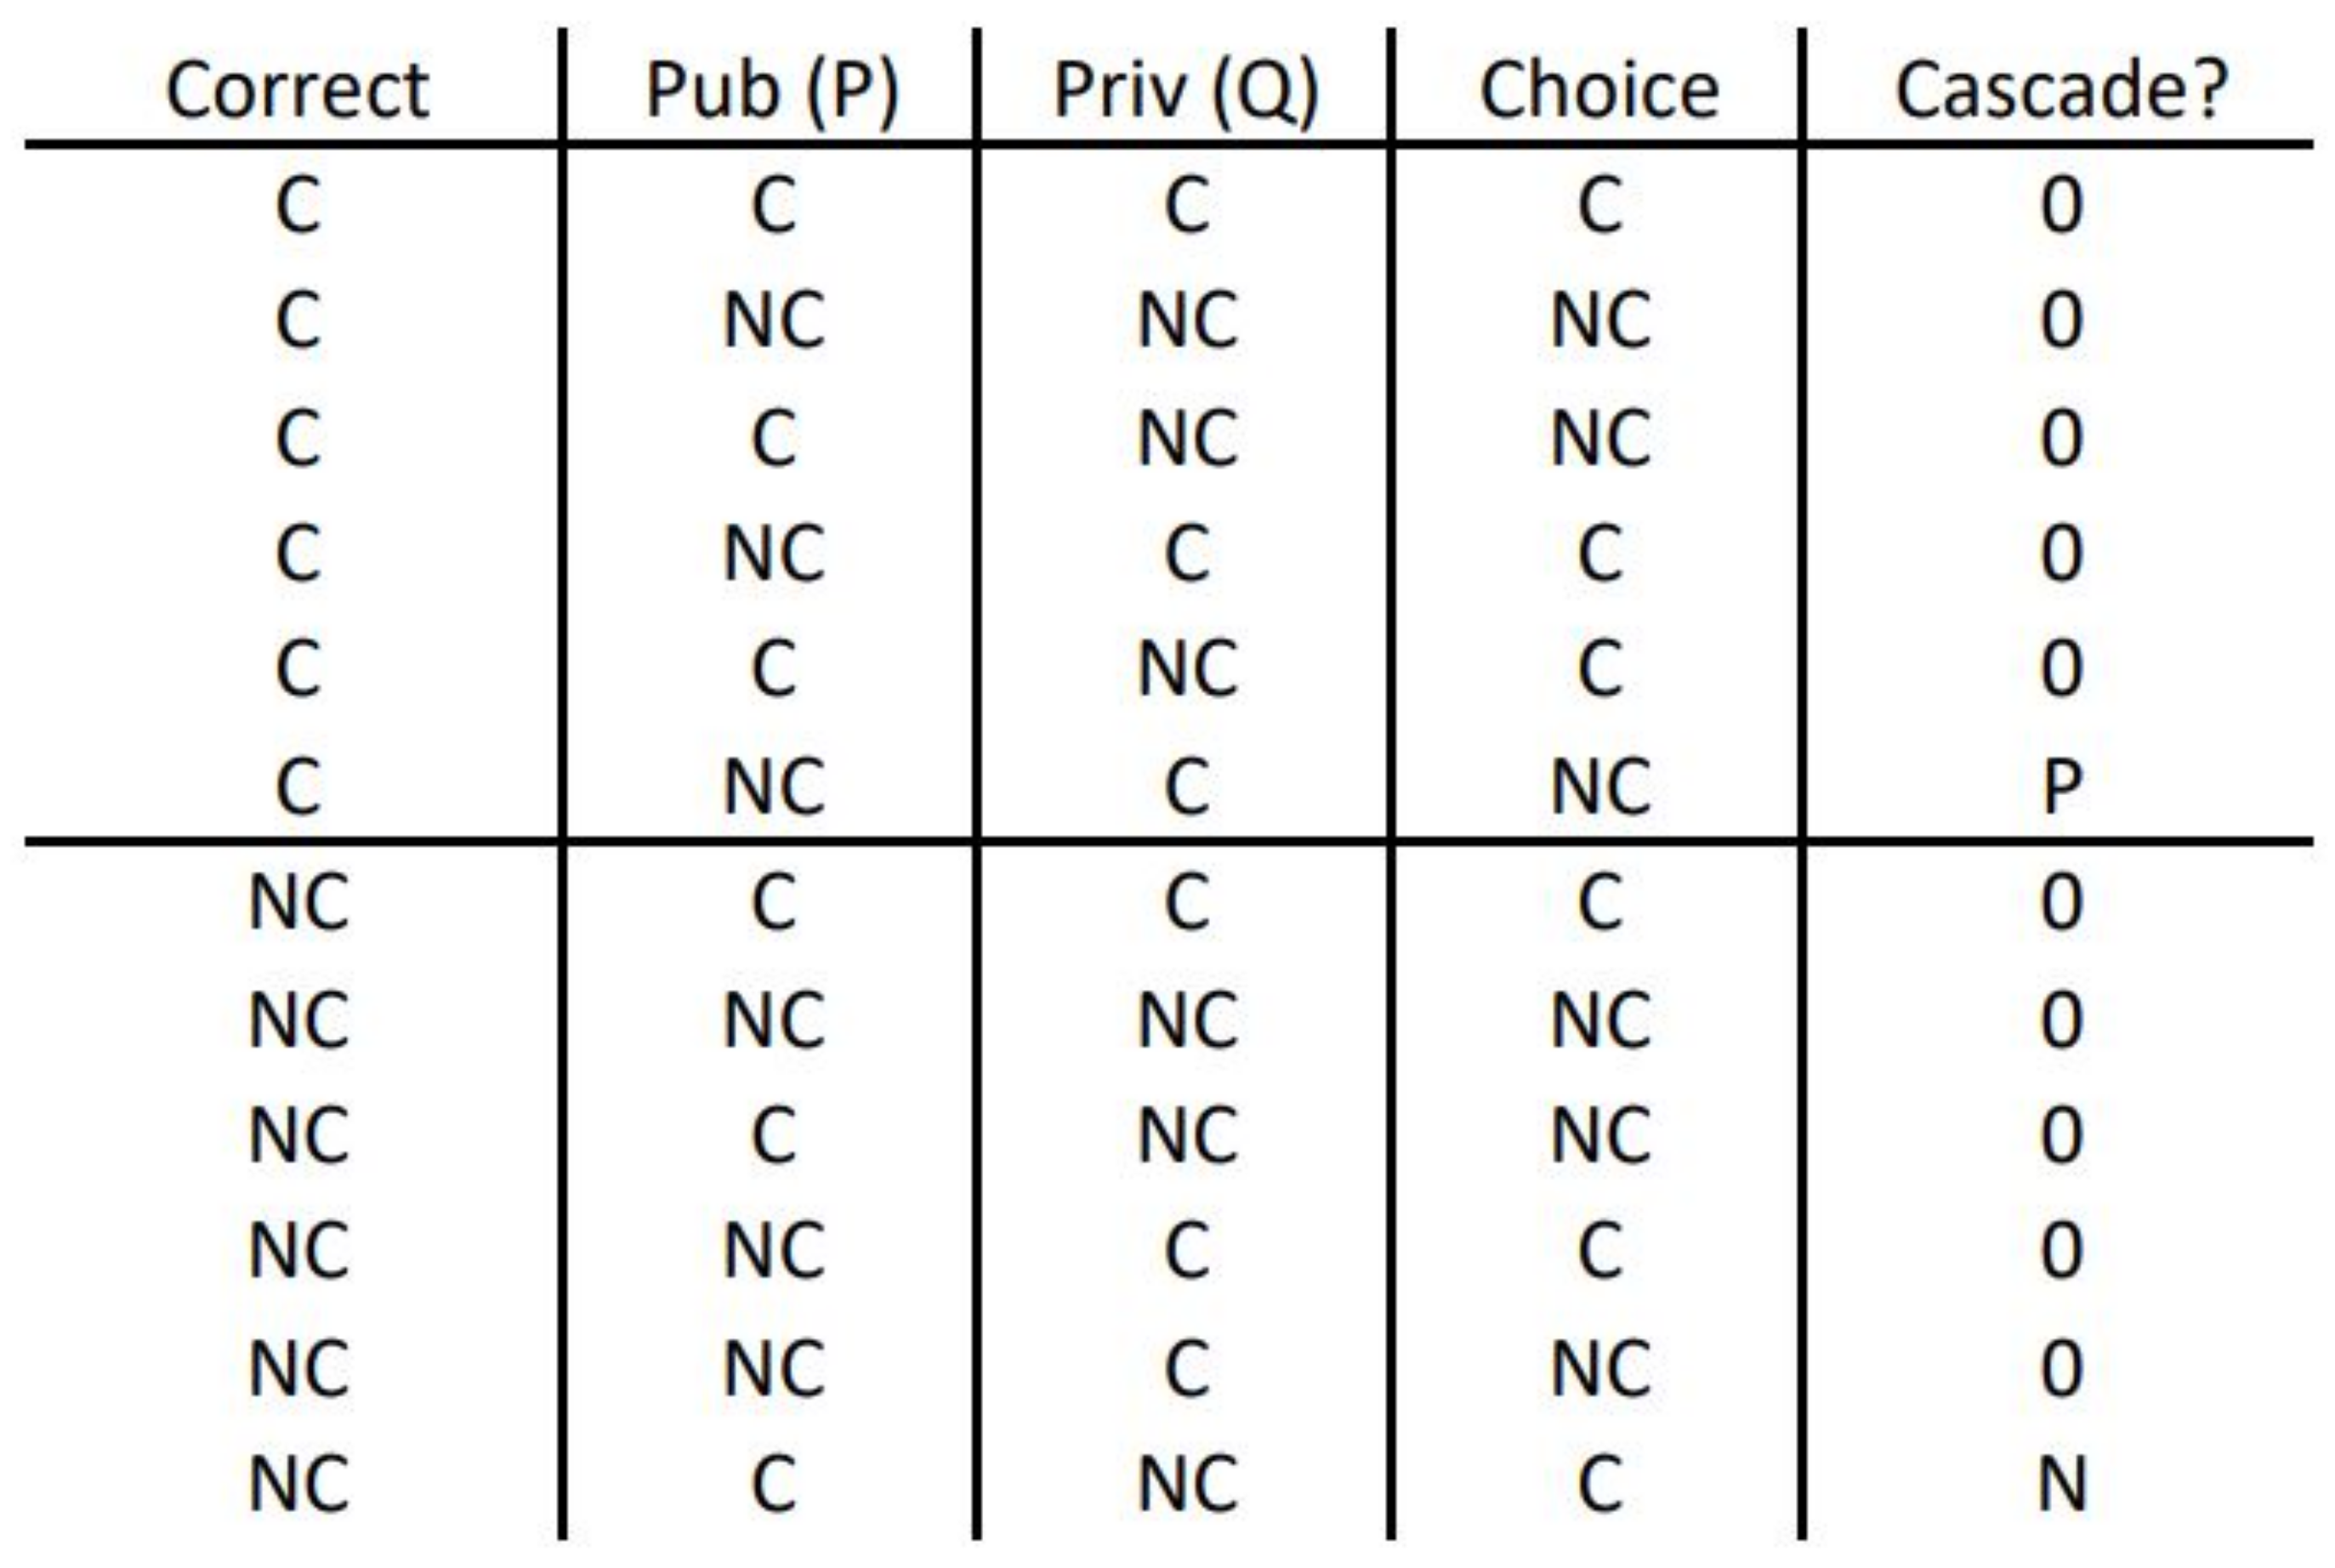
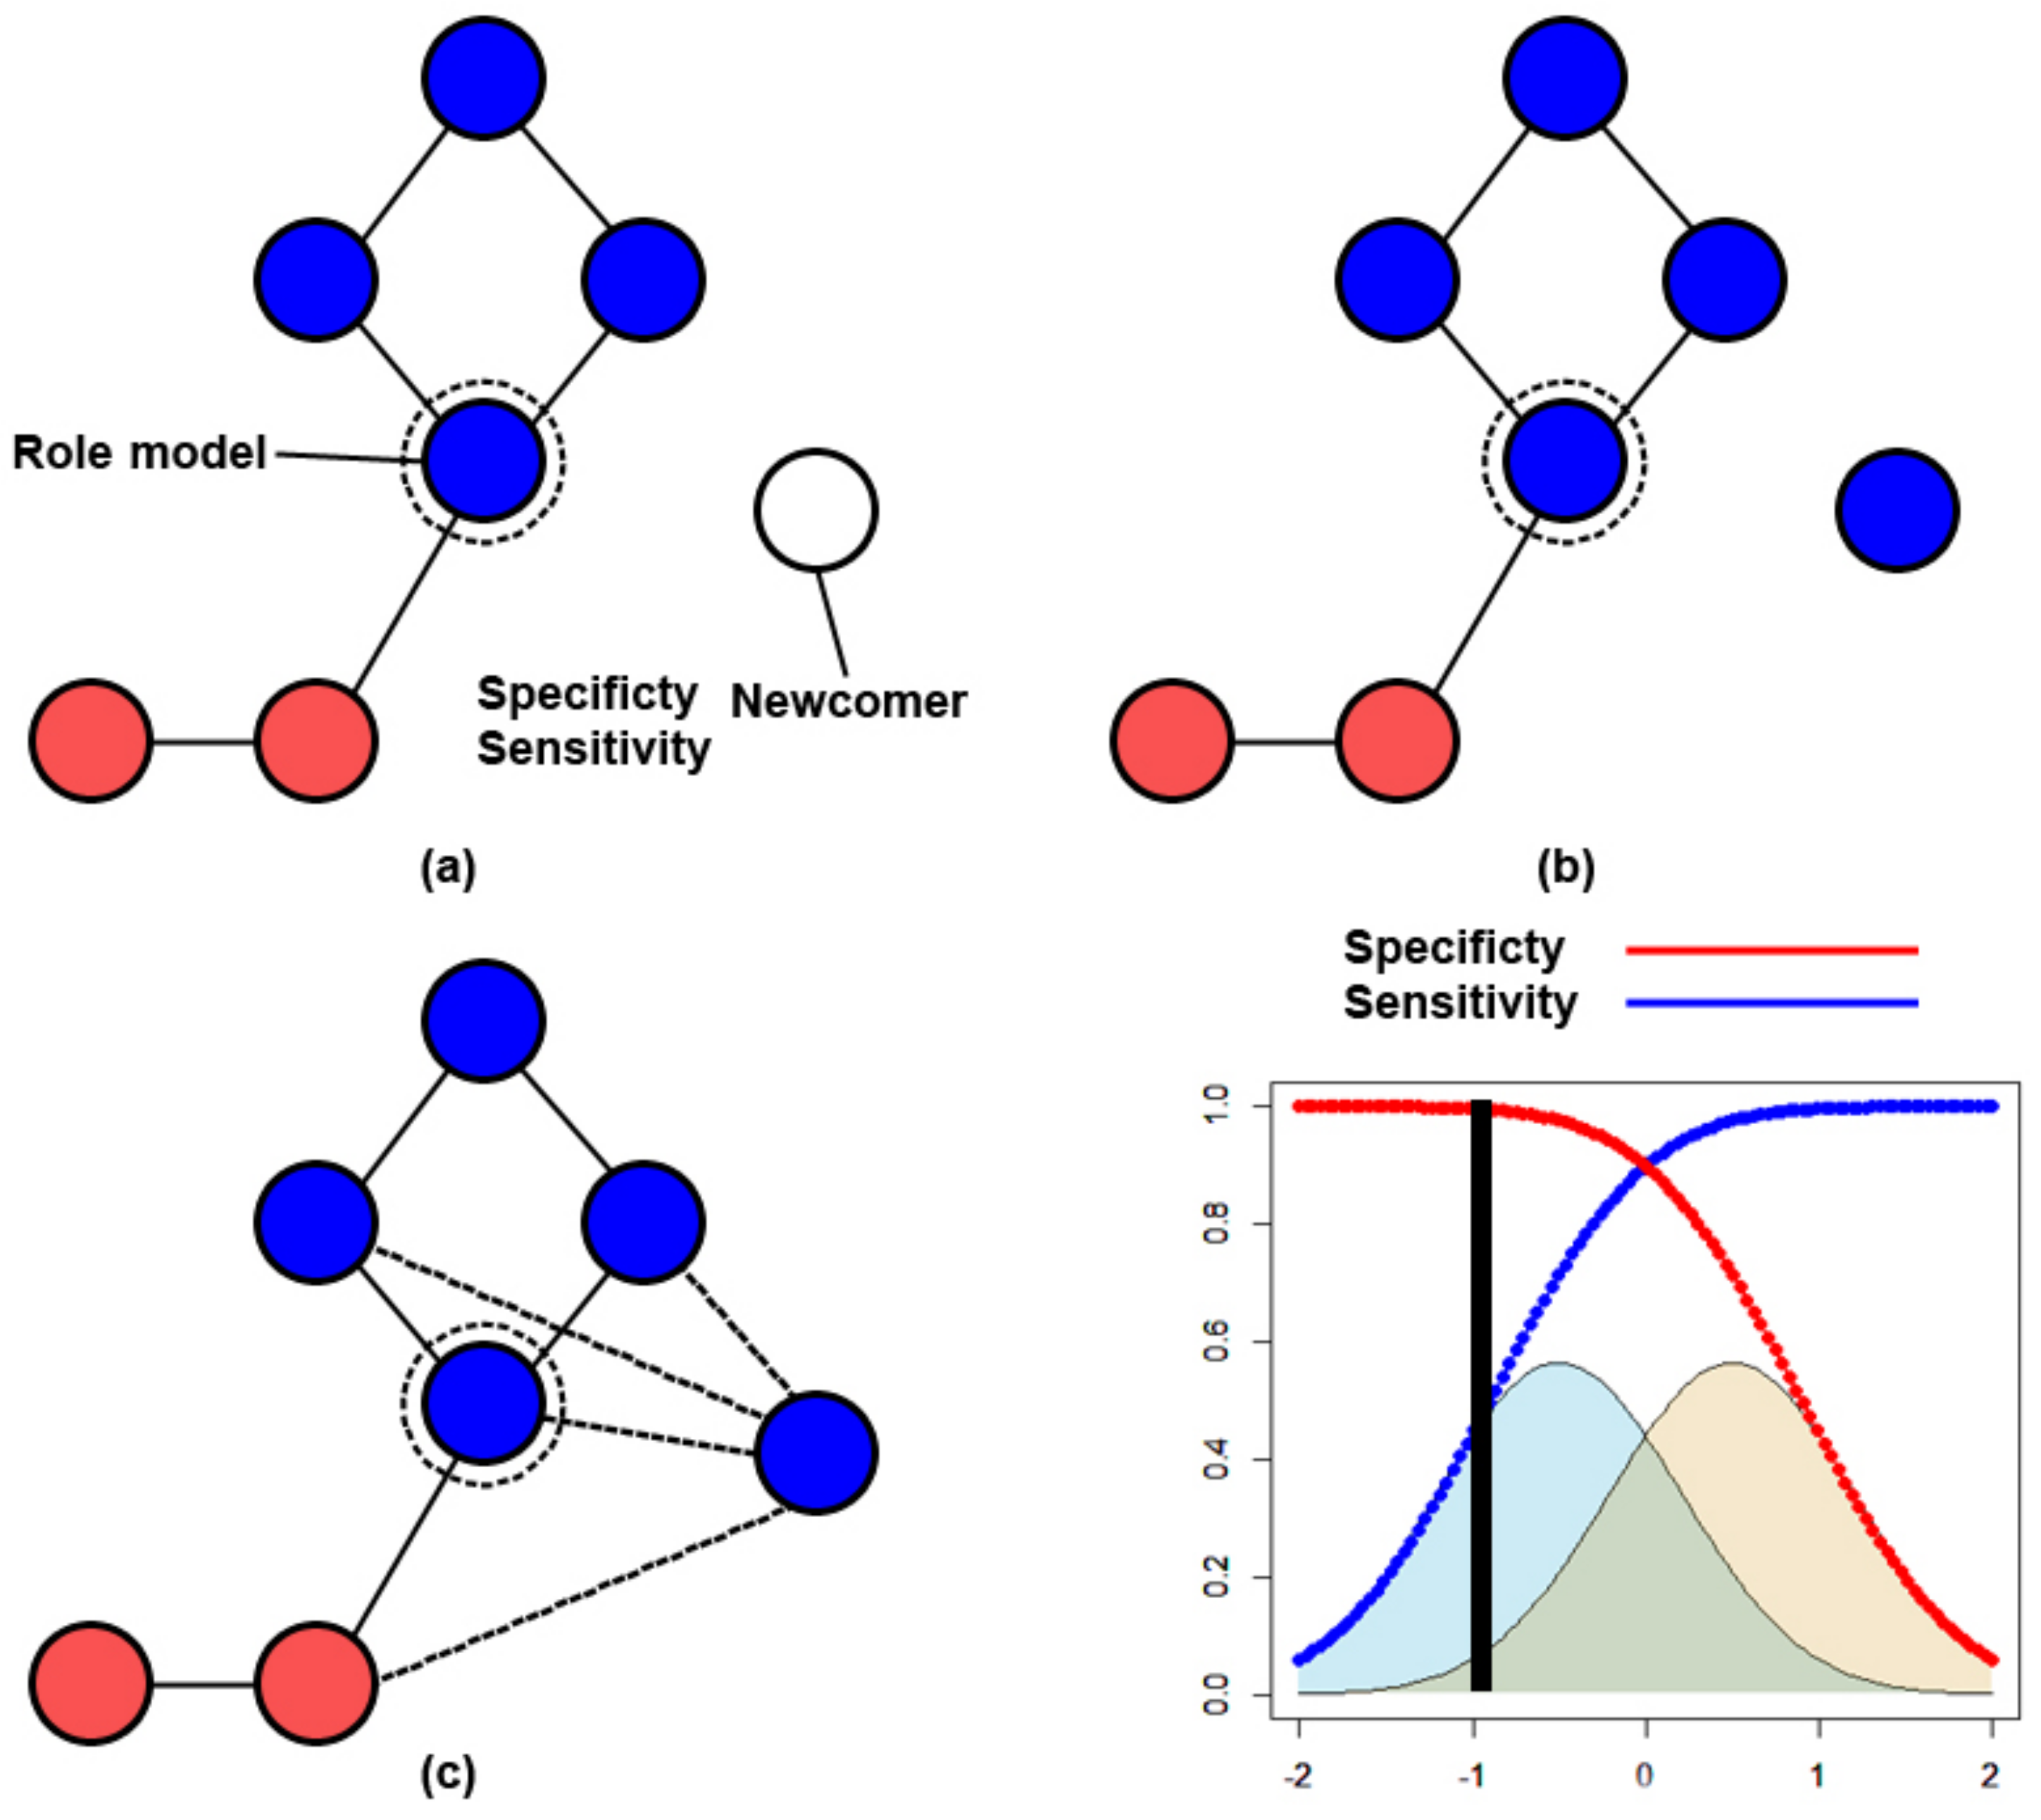
2.2. Information-Based Decision Making

Following [17], once the newcomer has been added to the network, it will then determine which of the role model’s neighbours it will form connections with (Figure 2c). Initially, this is achieved by utilising two fixed Gaussian distributions in order to model the presence of private information. Both distributions are created with a μ 2 of 0.5 with both peaks being set 1 apart from each other, with a μ of −0.5 for ϕ c and a μ of 0.5 for ϕ d . The use of the two overlapping distributions ϕ c and ϕ d models the imperfect ability of the newcomer to observe and distinguish cooperative nodes from cheating ones [17]. In conjunction with these distributions, individual x will make use of its decision threshold, τ x , in order to attempt to identify its potential neighbours as either cooperator or defector. For each node x (either the chosen role model or any of its neighbours) where a connection can be formed, a sample is drawn from either ϕ c or ϕ d based on if the potential neighbour is a cooperator or defector. Should the newcomers τ x value exceed this sample, the private information will indicate that a connection should be made. Public information is also utilised to aid with decision making at this step, as in [17]. Public information is represented by checking if the number of connections a potential neighbour has exceeds the network average. Should this be the case, then the newcomers public information will indicate that a connection should be made. Let P and Q be Boolean variables of whether or not the public and private signals indicate that a connection should be made, respectively.
Private and public information are then combined using two parameters used by newcomers to determine if they will form a connection, following [17]. Parameter p will determine how likely a newcomer will form a connection when only P is true. Parameter q will govern a similar likelihood for when only Q is true. These parameters p and q are modified to assign more weight to one source of information over the other. The following conditional statements represent individual decision making.
  • If P Q Then Connect
  • If ¬ P ¬ Q Then Do not Connect
  • If P ¬ Q Then Connect with probability p
  • If ¬ P Q Then Connect with probability q
Once an individual has determined which connections it will form, the network will then be updated. After that, an individual is randomly selected from the network to be replaced by the newcomer, keeping the population size fixed as in the Moran process [7].
Where this model differs from [17] is how parameter τ is implemented into the model. In [17], the same τ value is utilised by all newcomers as their decision threshold. In this model, we use parameter σ , to determine how much deviation from parameter τ is allowed; σ is then used to represent the amount of (opinion diversity. When a newcomer is being introduced to the network, a τ (decision threshold) value for this individual is obtained by sampling a Gaussian distribution, ϕ , that utilises parameter τ as mean and parameter σ as standard deviation.
Initially, we assume only the presence of private information and study the effects of increasing diversity of opinion within networks. When public information is added into the model, the emergence of two different types of information cascades are monitored [17]. Illustrations of these cascades can be seen in Figure 3 and Figure 4. The first kind of cascade that is monitored is the P cascade. Within the model, a P cascade is considered to have occurred when an individual’s private information indicates that a connection should be made, but is not due to a false indication from available public information. The other type of cascade that is monitored for is the N cascade. An N cascade is considered to have occurred when an individual’s private information indicates that a connection should not be formed, but is established based on the indication from public information. For both of these types of cascades, the number of cascades and their length are recorded, which is calculated by determining the number of nodes that were part of a cascade (Figure 3 and Figure 4).
We study the dynamics of the model by using several metrics. Average cooperation is used to measure the average number of cooperators present in the network during the simulation. Prosperity indicates the long-term average level of payoff within the network. As simulations progress, the choices made by newcomers, and whether or not they were the correct decisions, are evaluated. If a newcomer correctly forms a connection with cooperator, this will constitute a True Positive ( T P ); if a newcomer correctly rejects a connection with a defector, this will constitute a True Negative ( T N ); if a newcomer incorrectly forms a connection with a defector, this will constitute a False Positive ( F P ); if a newcomer incorrectly rejects a connection with a cooperator, this will constitute a False Negative ( F N ). To evaluate individual ability to differentiate between cooperators and defectors, specificity and sensitivity metrics are used. Specificity is considered as Equation (4) and sensitivity is considered as Equation (5). Specificity will determine how well newcomers are able to identify defectors and sensitivity indicates likewise for cooperators. Another metric that is recorded is the number of transitions that occurred during a simulation. In the scope of this model, a transition occurs when a previously absent strategy emerges as a result of mutation and spreads across the network to the point where it becomes the only strategy. Should this value be large, this will indicate that a network configuration is somewhat unstable.
T N / ( T N + F P )
T P / ( T P + F N )

3. Results

To evaluate how the diversity of opinion can affect cooperation within the model, several series of simulations were carried out. As part of each series, opinion diversity is increased in steps of 0.25, starting at 0 and ending with 1. To gain a reasonable insight into how each model setting affects cooperation, all simulations will run for 10 8 steps. We systematically analyze the model by varying the weight of private and public information, the degree of opinion diversity σ , the decision threshold τ and the strength of selection δ . The simulations are separated into three groups, based on how the two types of information are prioritised, and are further separated into simulations that utilise either weak selection by using δ = 0.001 or strong selection by using δ = 0.1 .

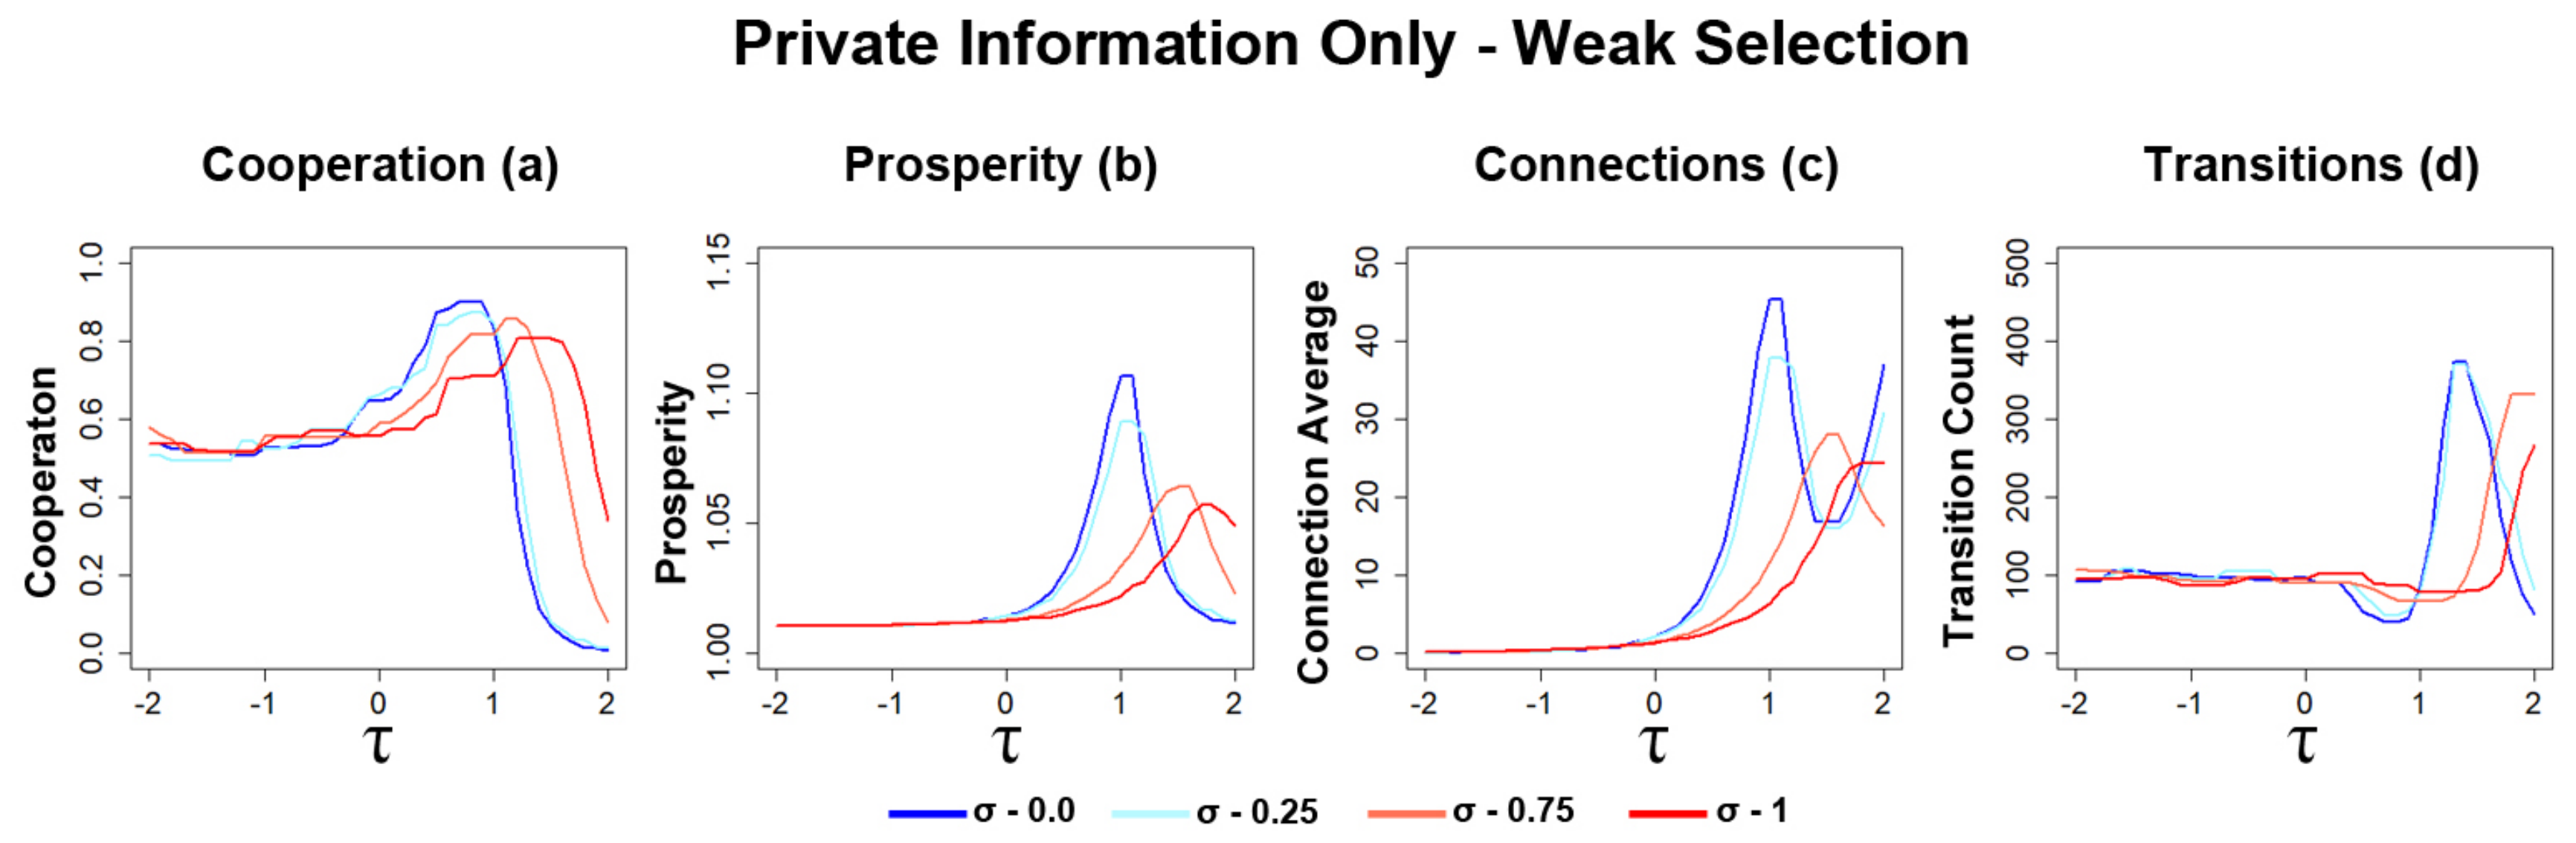
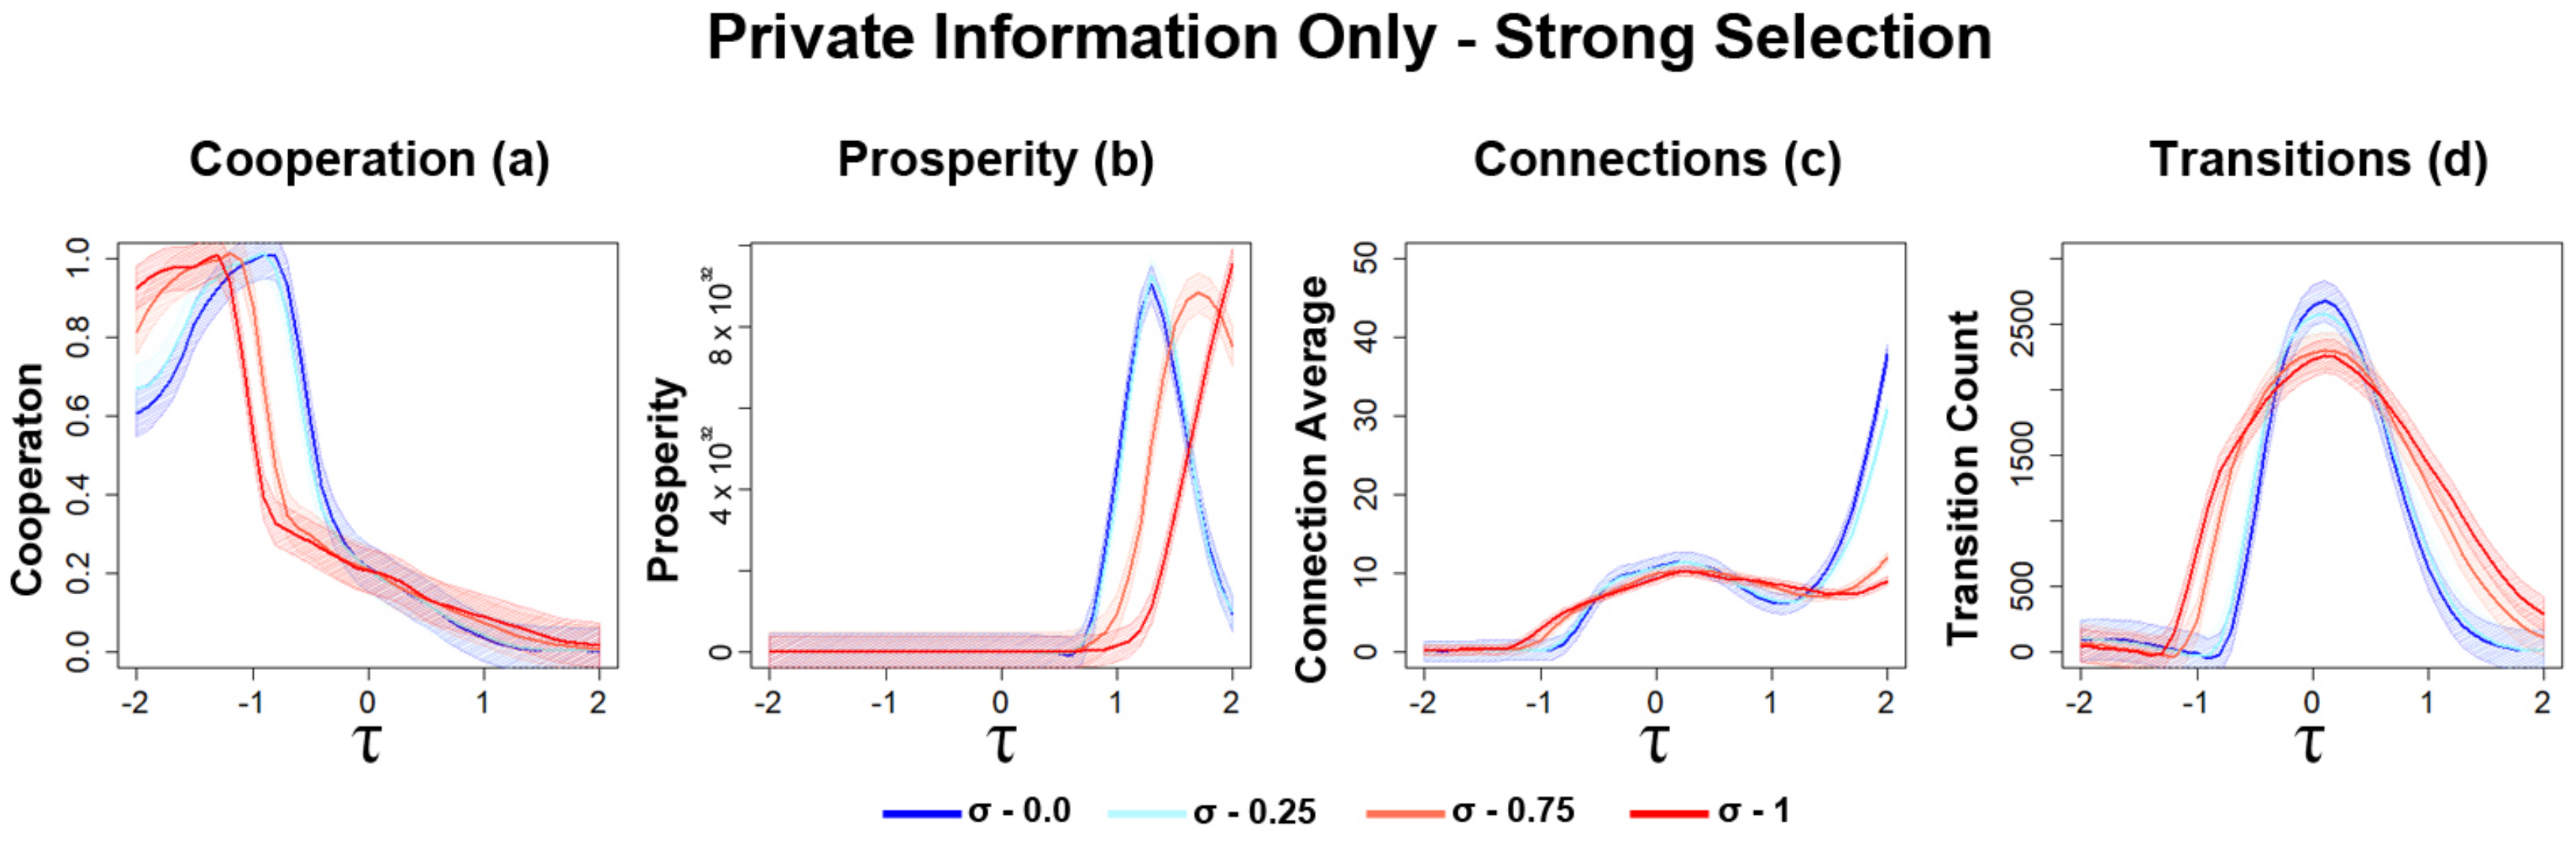
3.1. Private Information Decision Making

3.1.1. Increasing Opinion Diversity Leads to Network Changes

The first series of simulations carried out concerned networks where only private information is used as part of individual decision making. The first of these simulations utilises private information with weak selection. As we can see in Figure 5, nodes are more likely to avoid creating connections with cheaters at higher values of σ as parameter τ is increased. The inverse can also be observed with nodes more likely to form connections at lower τ settings at higher values of σ . These observations line up with observations regarding the level of prosperity seen in Figure 6b. As diversity is increased, the peak of prosperity gradually decreases. As well as this, the eventual collapse in prosperity also becomes more gradual, unlike the sharp decline observed when σ = 0 (Figure 6b).
This same behaviour can also observed for the average level of cooperation (Figure 6a). Networks with higher levels of diversity generally result in less cooperation than networks with no diversity. This observation, along with observations regarding specificity (Figure 5), correlates with the average number of connections individuals formed in simulations (Figure 6c). As diversity increases, nodes become less likely to form connections with other nodes, resulting in less interconnected networks. For larger values of diversity, networks are able to avoid large amounts of defection with a higher τ parameter, but are able to do so with significantly less connections being formed, as seen in Figure 6c. This does appear to come at some notable cost to prosperity (Figure 6b). These results suggest that increasing diversity leads to more isolated communities of nodes rather than highly interconnected networks, which typically pave the way to a collapse in cooperation. Lastly, as diversity increases, the number of transitions that occur within networks gradually decreases (Figure 6d), which suggests that it is more difficult for defectors to take over networks, possibly due to less connections being present between individuals (Figure 6b).

3.1.2. Increasing Selection Strength Leads to Increase in Network Instability

To further understand how opinion diversity can affect cooperation, another series of simulations were carried out with private information only, this time utilising a much stronger selection strength. As observed in previous works [17], networks with strong selection tend to result in a much greater level of connectivity between nodes in the network, which increases the likelihood of transitions occurring.
Results show that networks with some opportune level of diversity are associated with higher levels of prosperity, the sharp decline from each peak also becomes more gradual as diversity increases (Figure 7b). For very high values of opinion diversity, networks are able to avoid a sharp drop in prosperity (Figure 7b). The increasingly gradual decline of prosperity suggests that more cautious nodes are able to aid with curbing disruptive behaviour of more trusting nodes within the network, which may aid with avoiding a collapse in prosperity.
For lower values of τ , the level of cooperation observed generally improves as diversity is increased, suggesting that the presence of more trusting nodes during these simulations are able to yield a higher level of cooperation (Figure 7a). This does seem to come at some cost, the point where cooperation begins to collapse occurs earlier as diversity is increased, suggesting there is a point where the presence of several nodes with a higher decision threshold can be detrimental. Networks with increasing σ leads to a better cooperation performance, although interestingly, the level of cooperation does not follow the average level of prosperity observed in Figure 7b.
We can observe (Figure 7) that simulations with a higher opinion diversity result in networks with more connections (Figure 7c). As τ is increased, this trend reversed, with networks with higher level of diversity resulting in less connections being formed, suggesting that more cautious nodes are able to temper the behaviour of more trusting nodes. Some of this behaviour also aligns with what is observed in the number of transitions (Figure 7d). The initial point where an increase in transitions occurs lines up with the beginning of a decline in cooperation for any value of diversity (Figure 7d). Although simulations with a large value for opinion diversity resulted in earlier increases in the number of transitions, these settings (Figure 7d) are able to avoid the highest number of transitions occurring τ 0 .

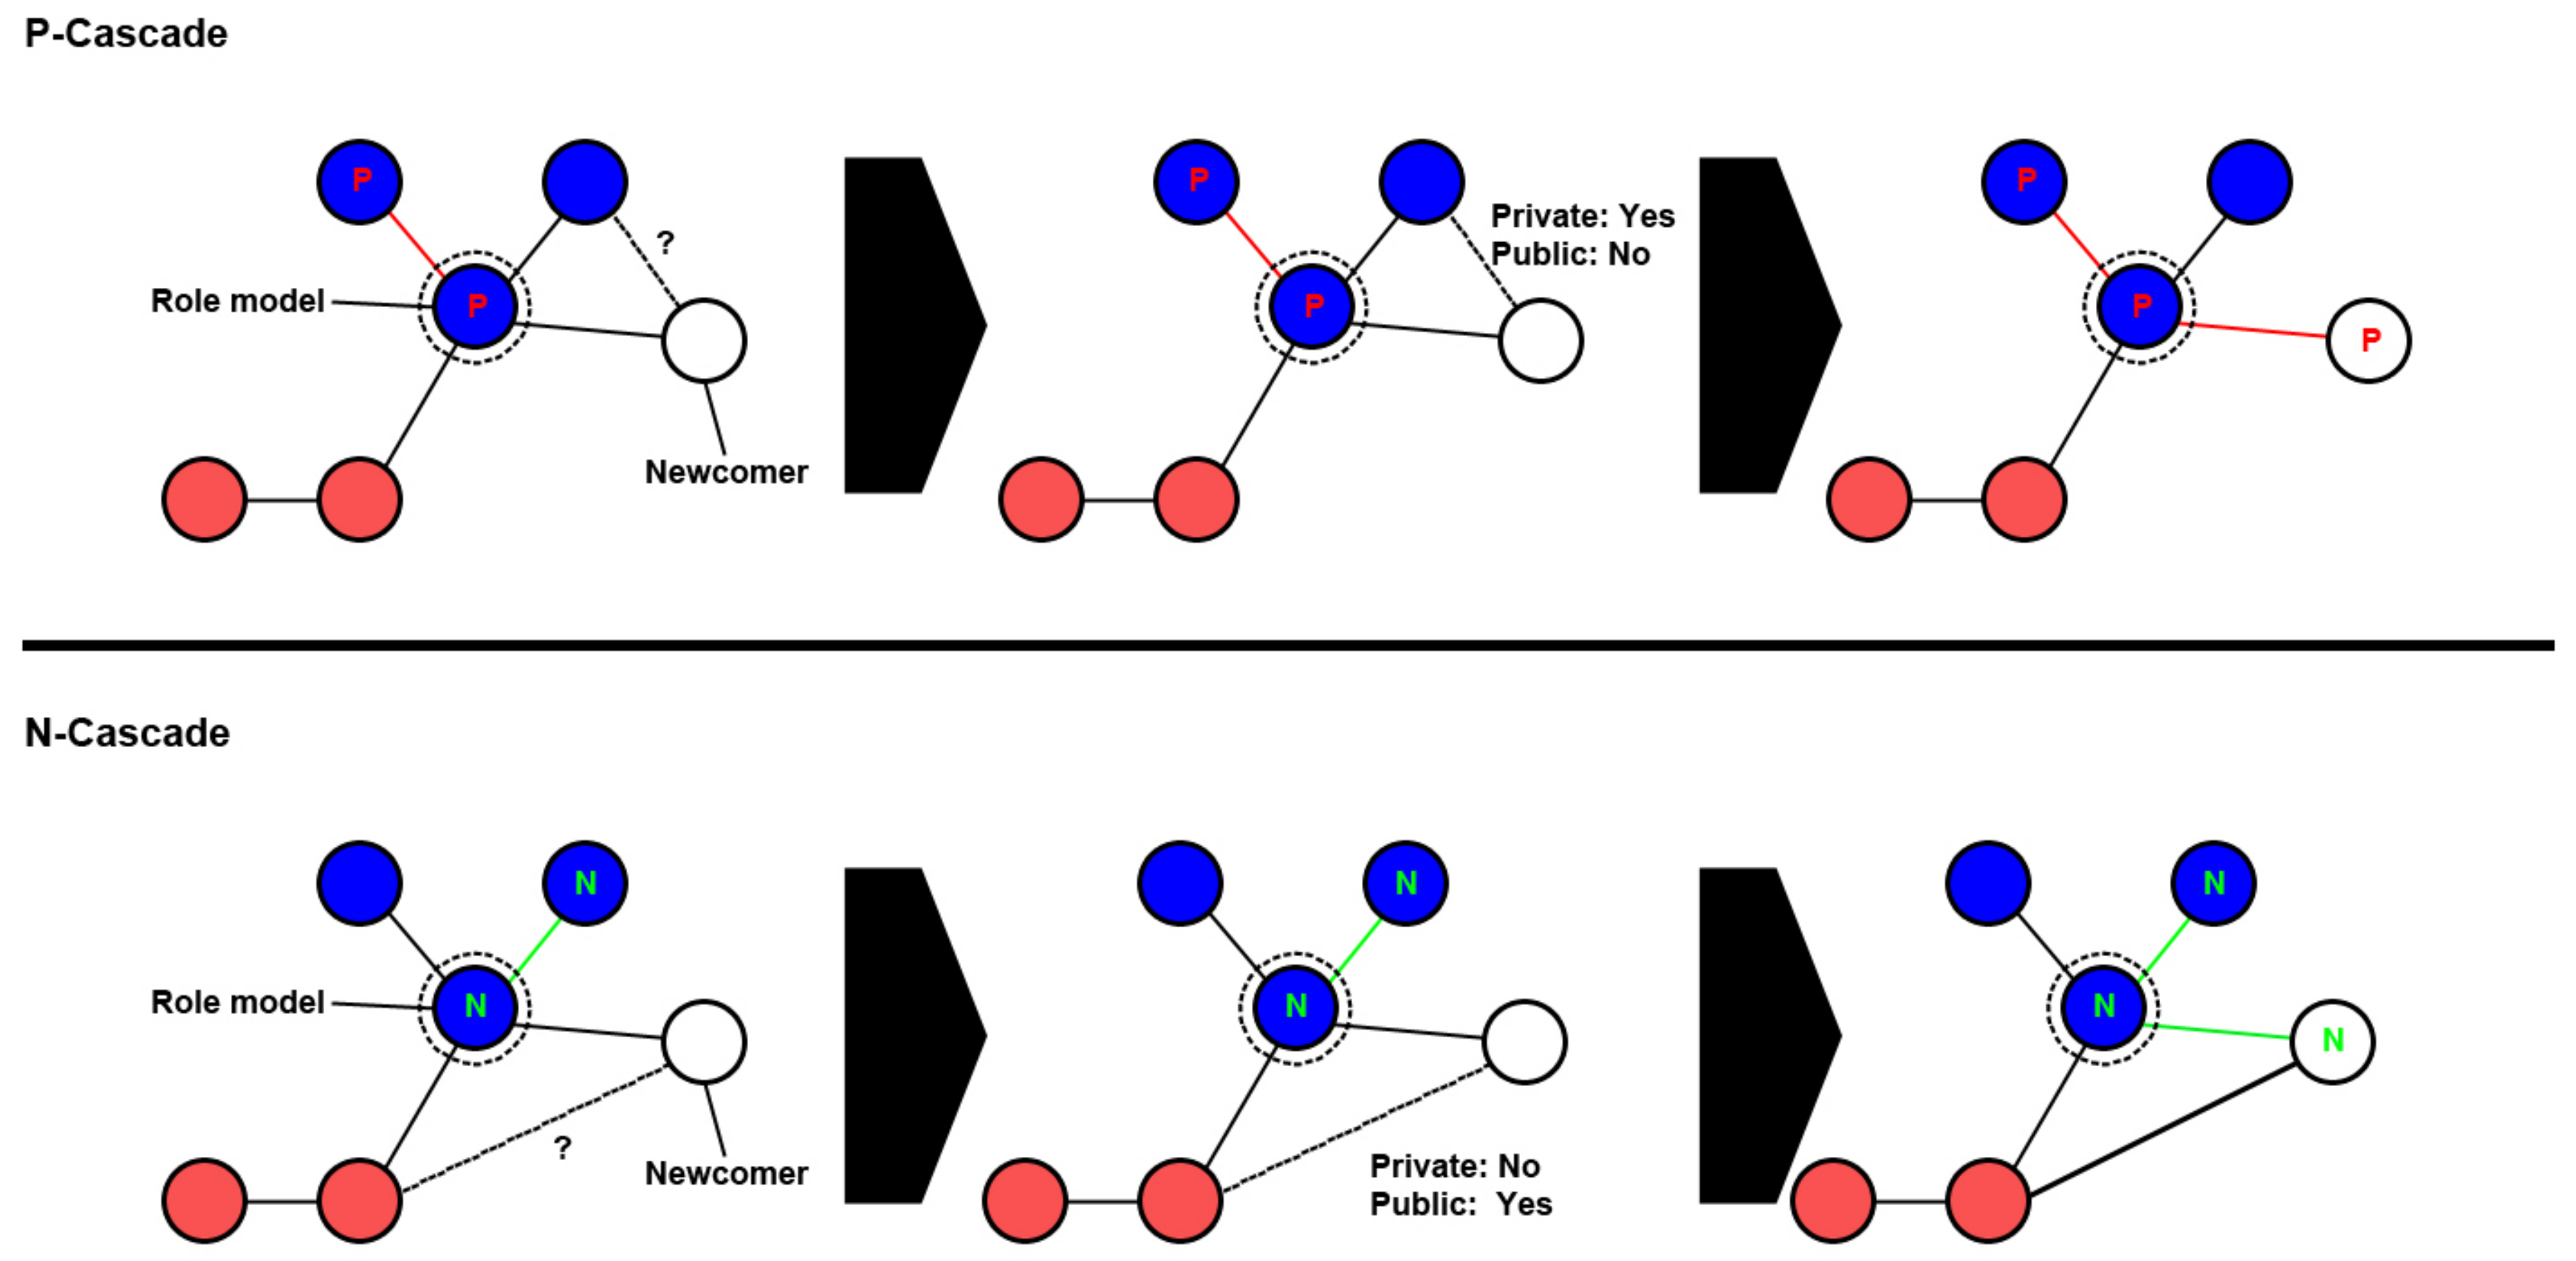
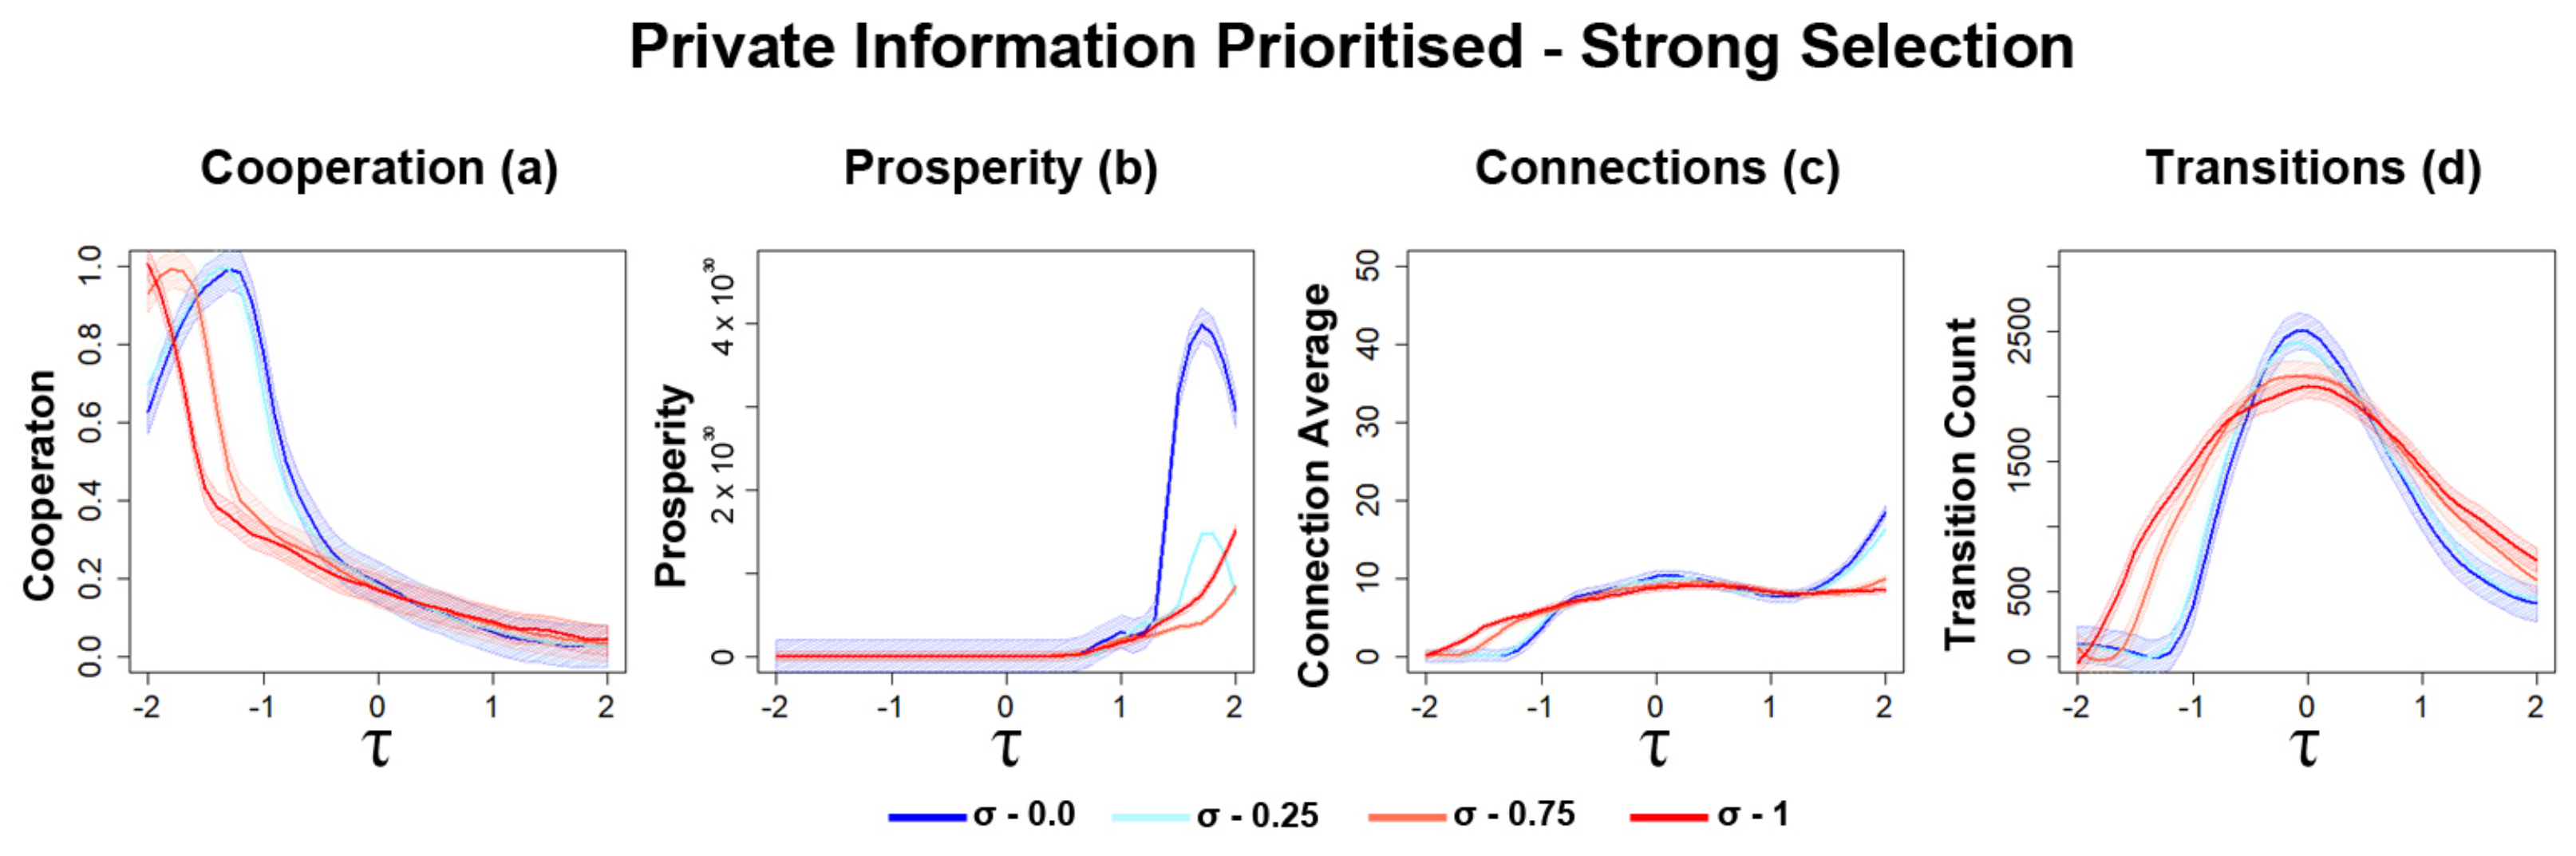
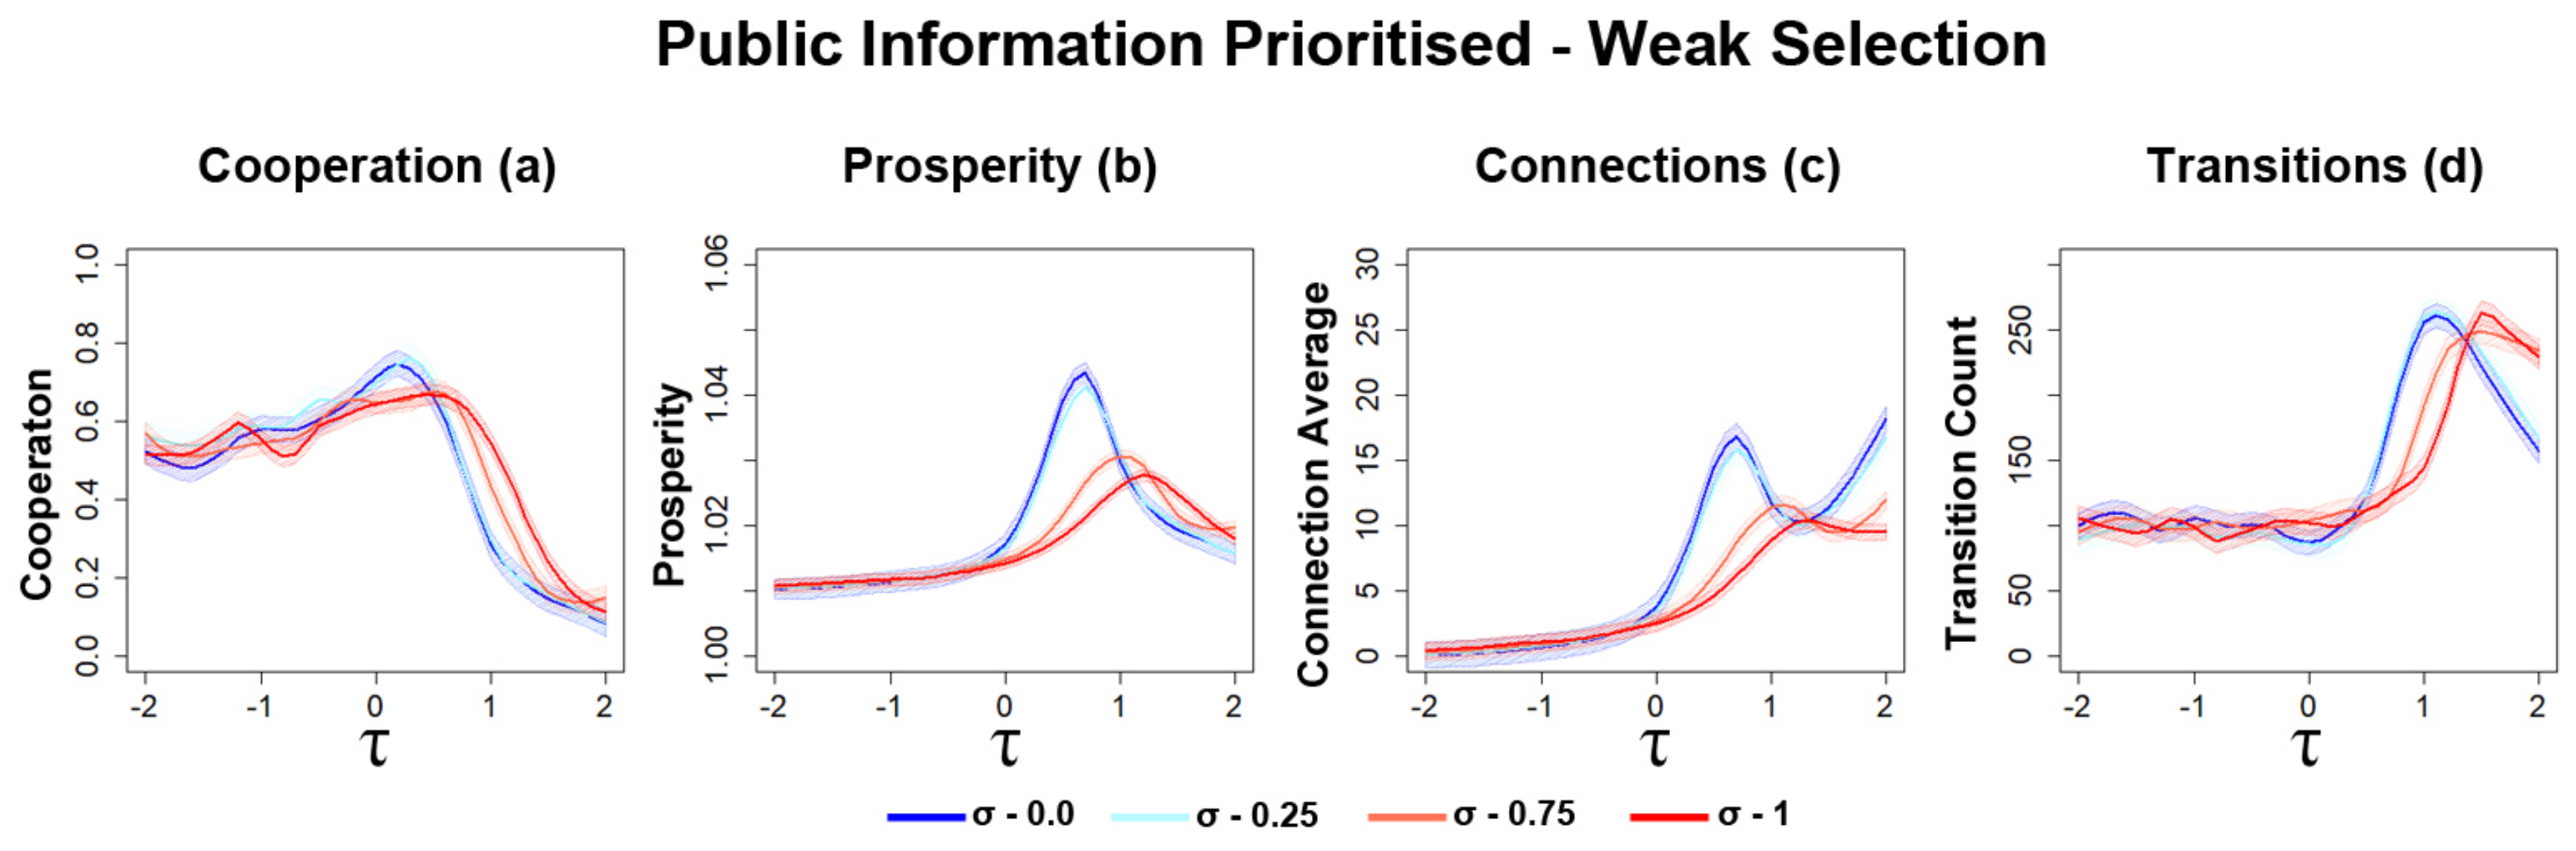
3.2. Private/Public Information Decision Making

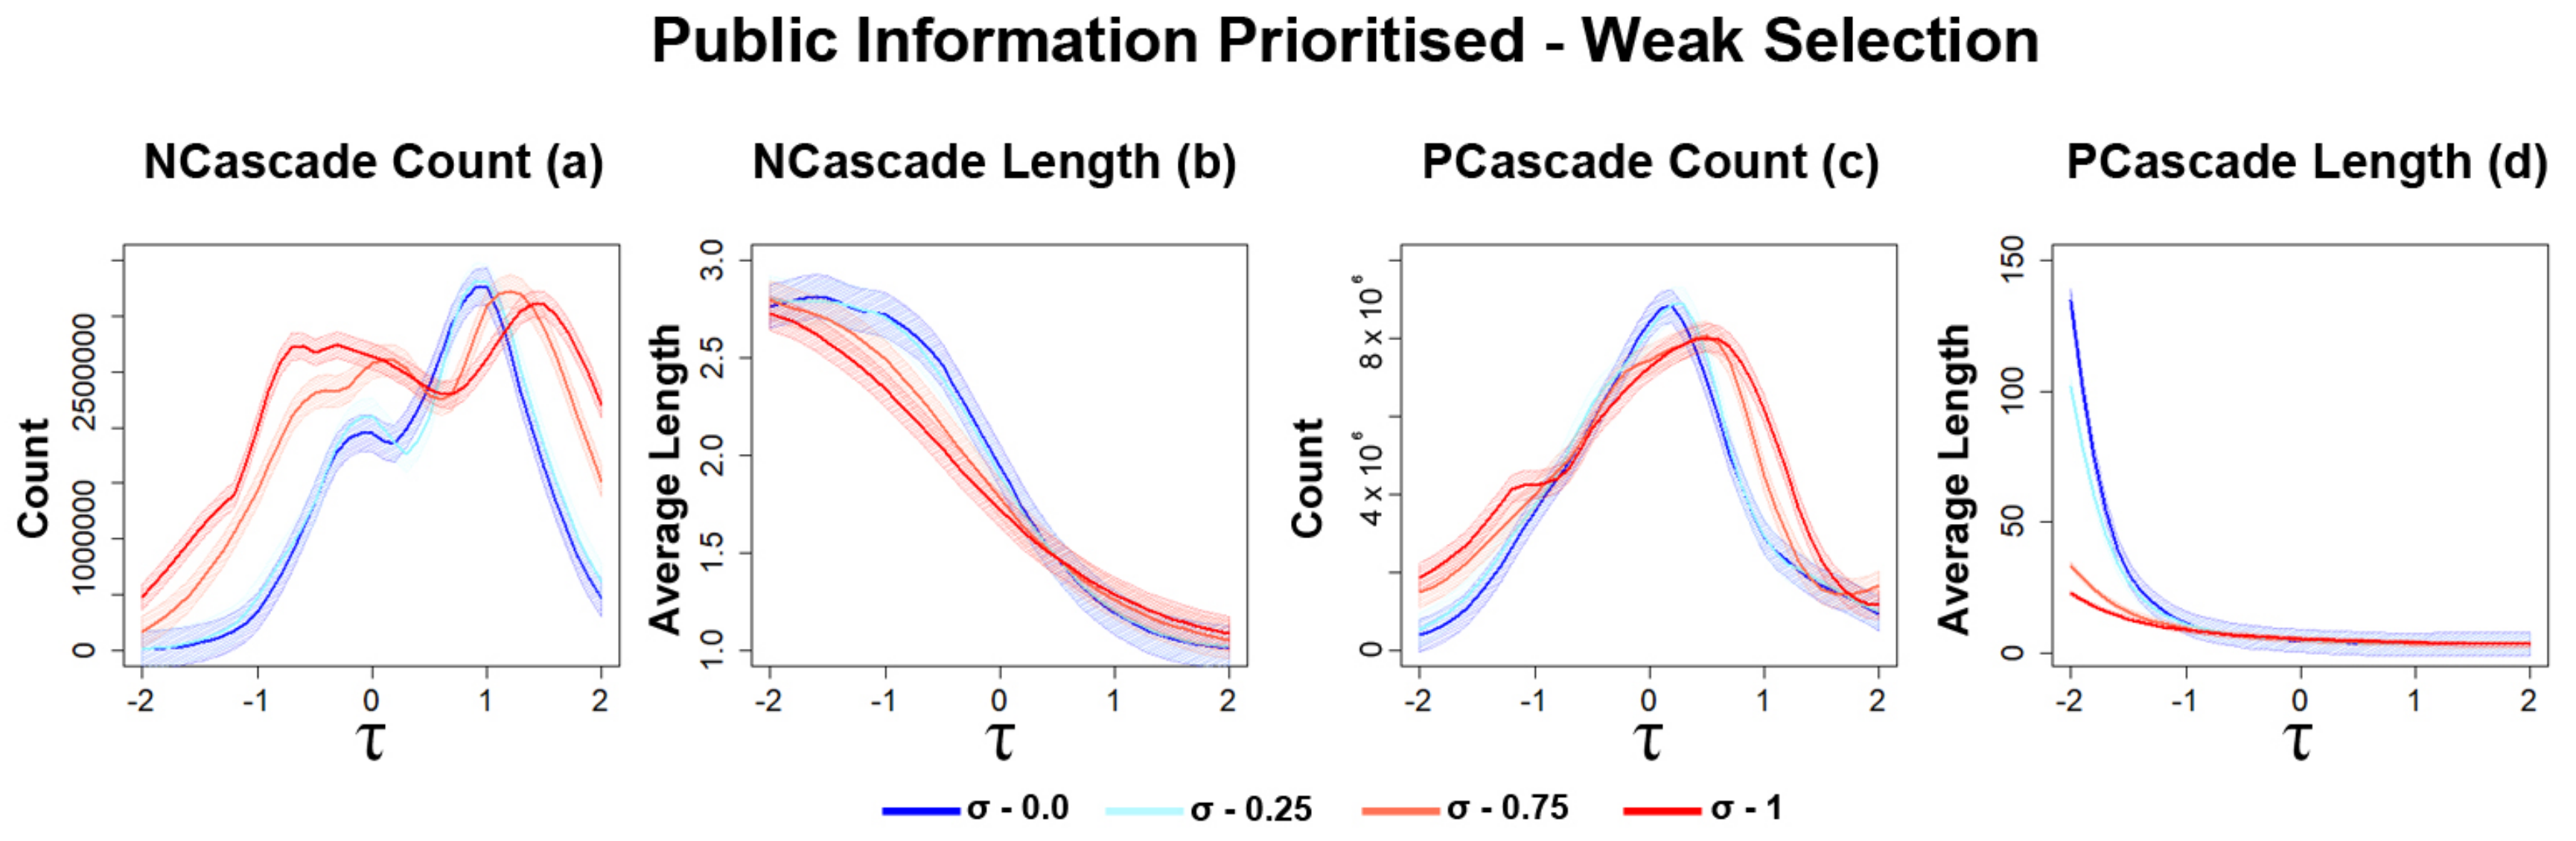
3.2.1. Opinion Diversity Affects the Frequency of Information Cascades

We assume that the decision making utilised in the model combines public and private information as described in Section 2.2. Initially, private information still takes priority over public information available to nodes in the networks, meaning that connections are less likely to be formed when only public information indicates one should be made. With public information added to the model, it is also possible to observe the emergence of information cascades as a consequence of conflicting information. To integrate public information into the following simulations, parameters p and q are utilised (see Section 2.2). In this section, we use p = 0.25 and q = 0.75 , meaning private information remains predominant during decision making. When private information is still predominant in decision making, networks largely behave similarly to the dynamics observed in Figure 6 and Figure 7, where only private information is considered.
As shown in Figure 8b, the maximum amount of prosperity obtained gradually reduces as opinion diversity increases, which could be due to nodes being more cautious and forming less connections. Based on these initial results, it seems that the disruption from public information is rather low when p = 0.25 and q = 0.75 . The level of average cooperation is also similar to that shown in Figure 6a, with the eventual collapse in cooperation happening for higher values of τ and the decline also becoming more gradual (Figure 8a). This also appears to come at some cost for prosperity (Figure 8b). This is further reinforced by observations regarding connectivity, as the average number of connections decreases as diversity increases, suggesting that less trusting nodes being present results in less connections (Figure 8c). Sharp increases in the number of transitions (Figure 8d) can also be observed for higher values of τ as diversity increases.
Moreover, the cascade data provide some interesting results (Figure 9). The first key observation, as in the previous work [17], is that P cascades occur significantly more than N cascades (Figure 9a,c), suggesting cascades tend to occur more for scenarios when private information indicates that a connection should be formed. The next key observation is that cascades for both types generally occur more as diversity increases amongst nodes (Figure 9a,c). This serves as a reminder that, whilst diversity leads to the presence of more cautious nodes and less connections, increasing diversity may also result in the presence of more trusting nodes, which can lead to more cascades occurring. Further, the average length of cascades decreases at lower values of τ as diversity increases and eventually inverts at higher values of τ (Figure 9b,d). This finding is interesting, as this indicates that at lower values of τ , these cascades are generally shallower even though they occur more for networks with a higher level of opinion diversity.

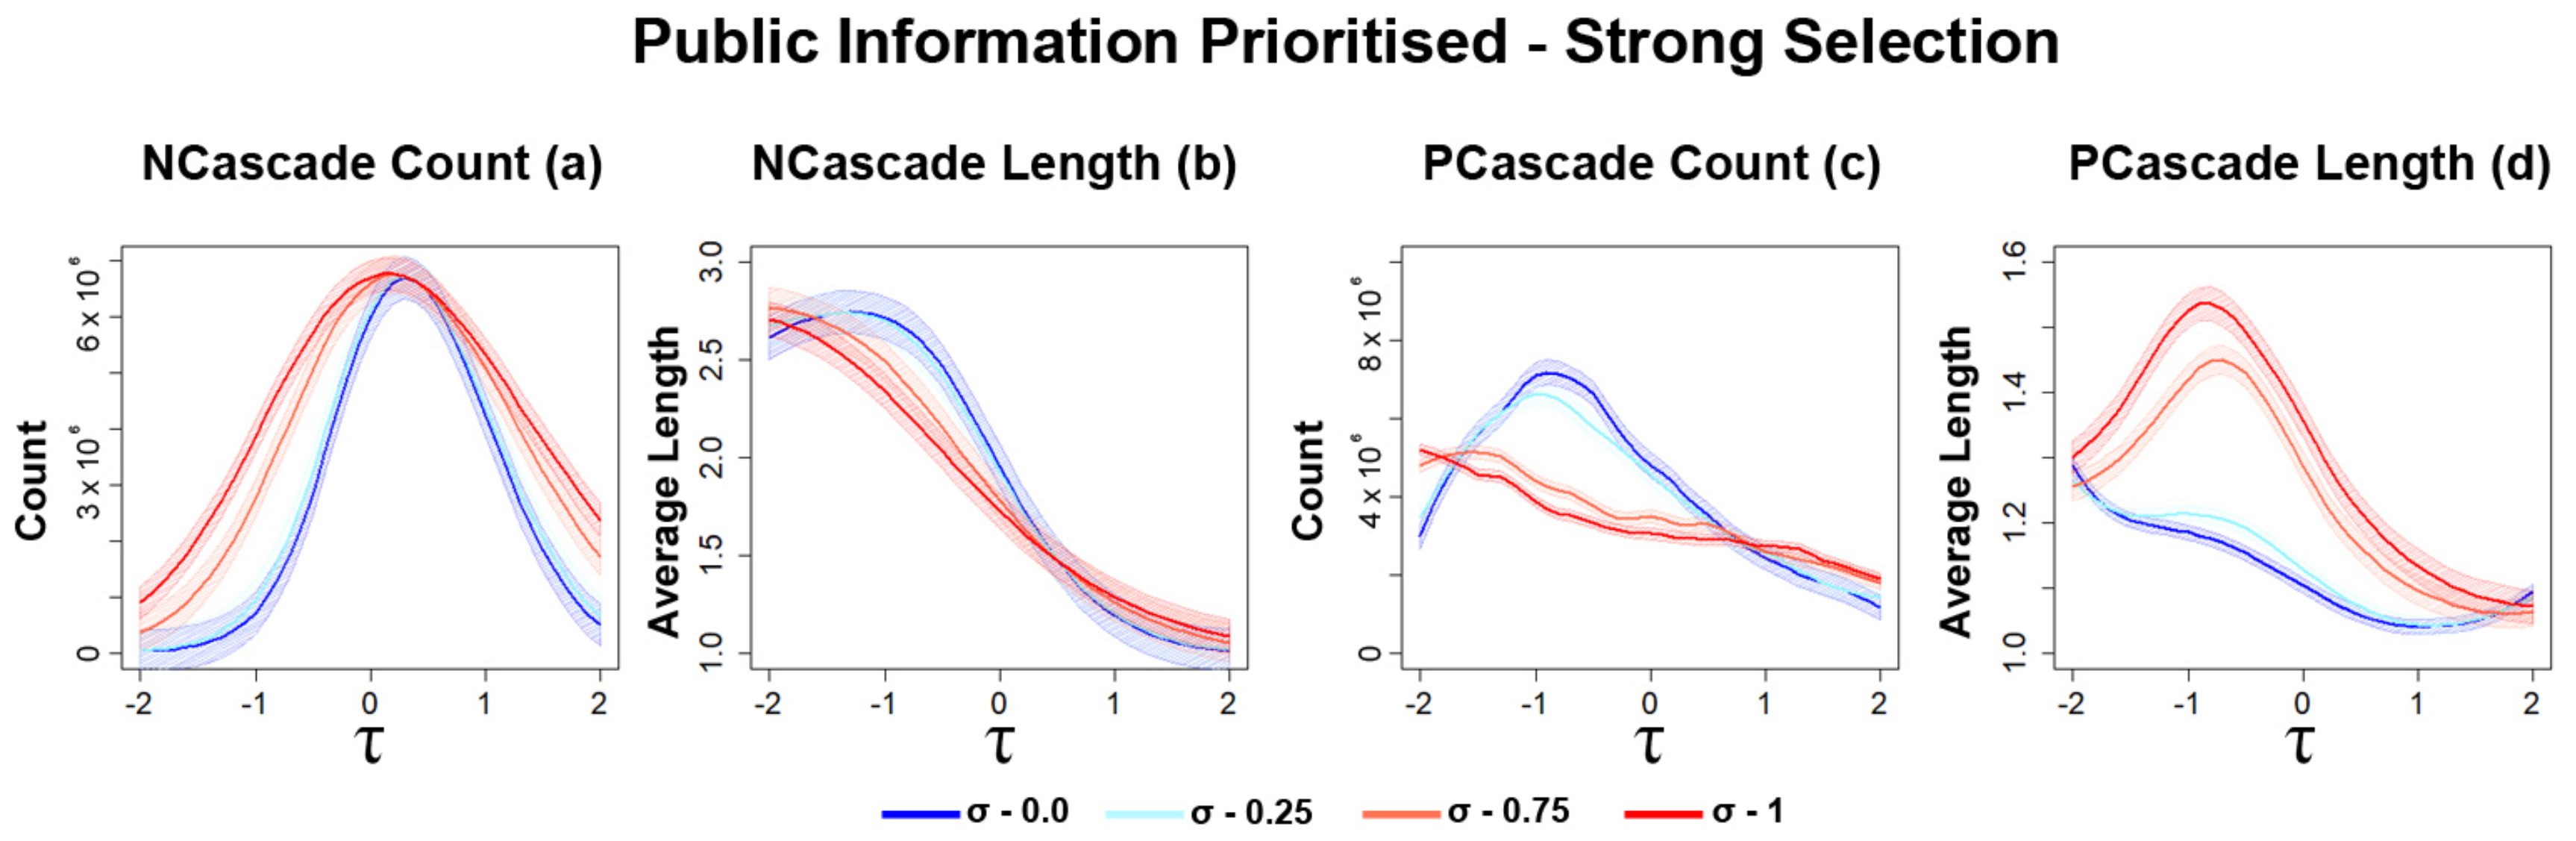
3.2.2. Strong Selection Results in Higher Frequency of Information Cascades

In this section, we increase selection strength and prioritise private information over public information. The level of disruption caused by public information is noticeable but still somewhat limited. The level of prosperity spikes with higher values of τ and gradually decreases as diversity increases (Figure 10b). Although, with the inclusion of public information, these values are significantly higher, suggesting that this type of information does have some effect on nodes within the network and have an effect on network topology. The average level of cooperation (Figure 10a) also illustrates the effect of the inclusion of public information as the point of collapse for each value of σ occurs at lower values of τ than it did for networks observed in Figure 7a. This suggests that the inclusion of public information in networks with strong selection can lead to more defection occurring at lower values of τ . As can be seen in Figure 10c, average connectivity shows that whilst greater diversity results in higher average connectivity at lower values of τ , they are generally lower at higher values of τ . Despite strong selection and the presence of public information, the average number of connections each node possessed is generally lower (Figure 10c) than in the case of Figure 8c where average connectivity was higher. The number of transitions that occur (Figure 10d) is also generally higher for higher levels of diversity, whilst avoiding the highest level of transitions that can be seen for simulations with lower diversity at τ 0 . When comparing Figure 10a with Figure 10c,d, the earlier increases in connections and transitions suggest that public information can affect nodes decision making into being more open to forming connections, making networks susceptible to invasions by defectors and collapses in cooperation, especially for higher values of σ .
As we can see in Figure 11, cascade data show that significantly more cascades occur when the selection is strong. The occurrences of N cascades are largely similar, with a higher level of diversity resulting in more occurrences of these cascades and with a smaller length for certain values of τ (Figure 11a,b). However, we can see that these settings can also affect the presence of P cascades. As we can see in Figure 11c,d, higher levels of diversity generally result in less P cascades whilst still resulting in smaller P cascades. This is particularly interesting considering that the number of connections and transitions for higher levels of diversity were significantly higher at lower values of τ .

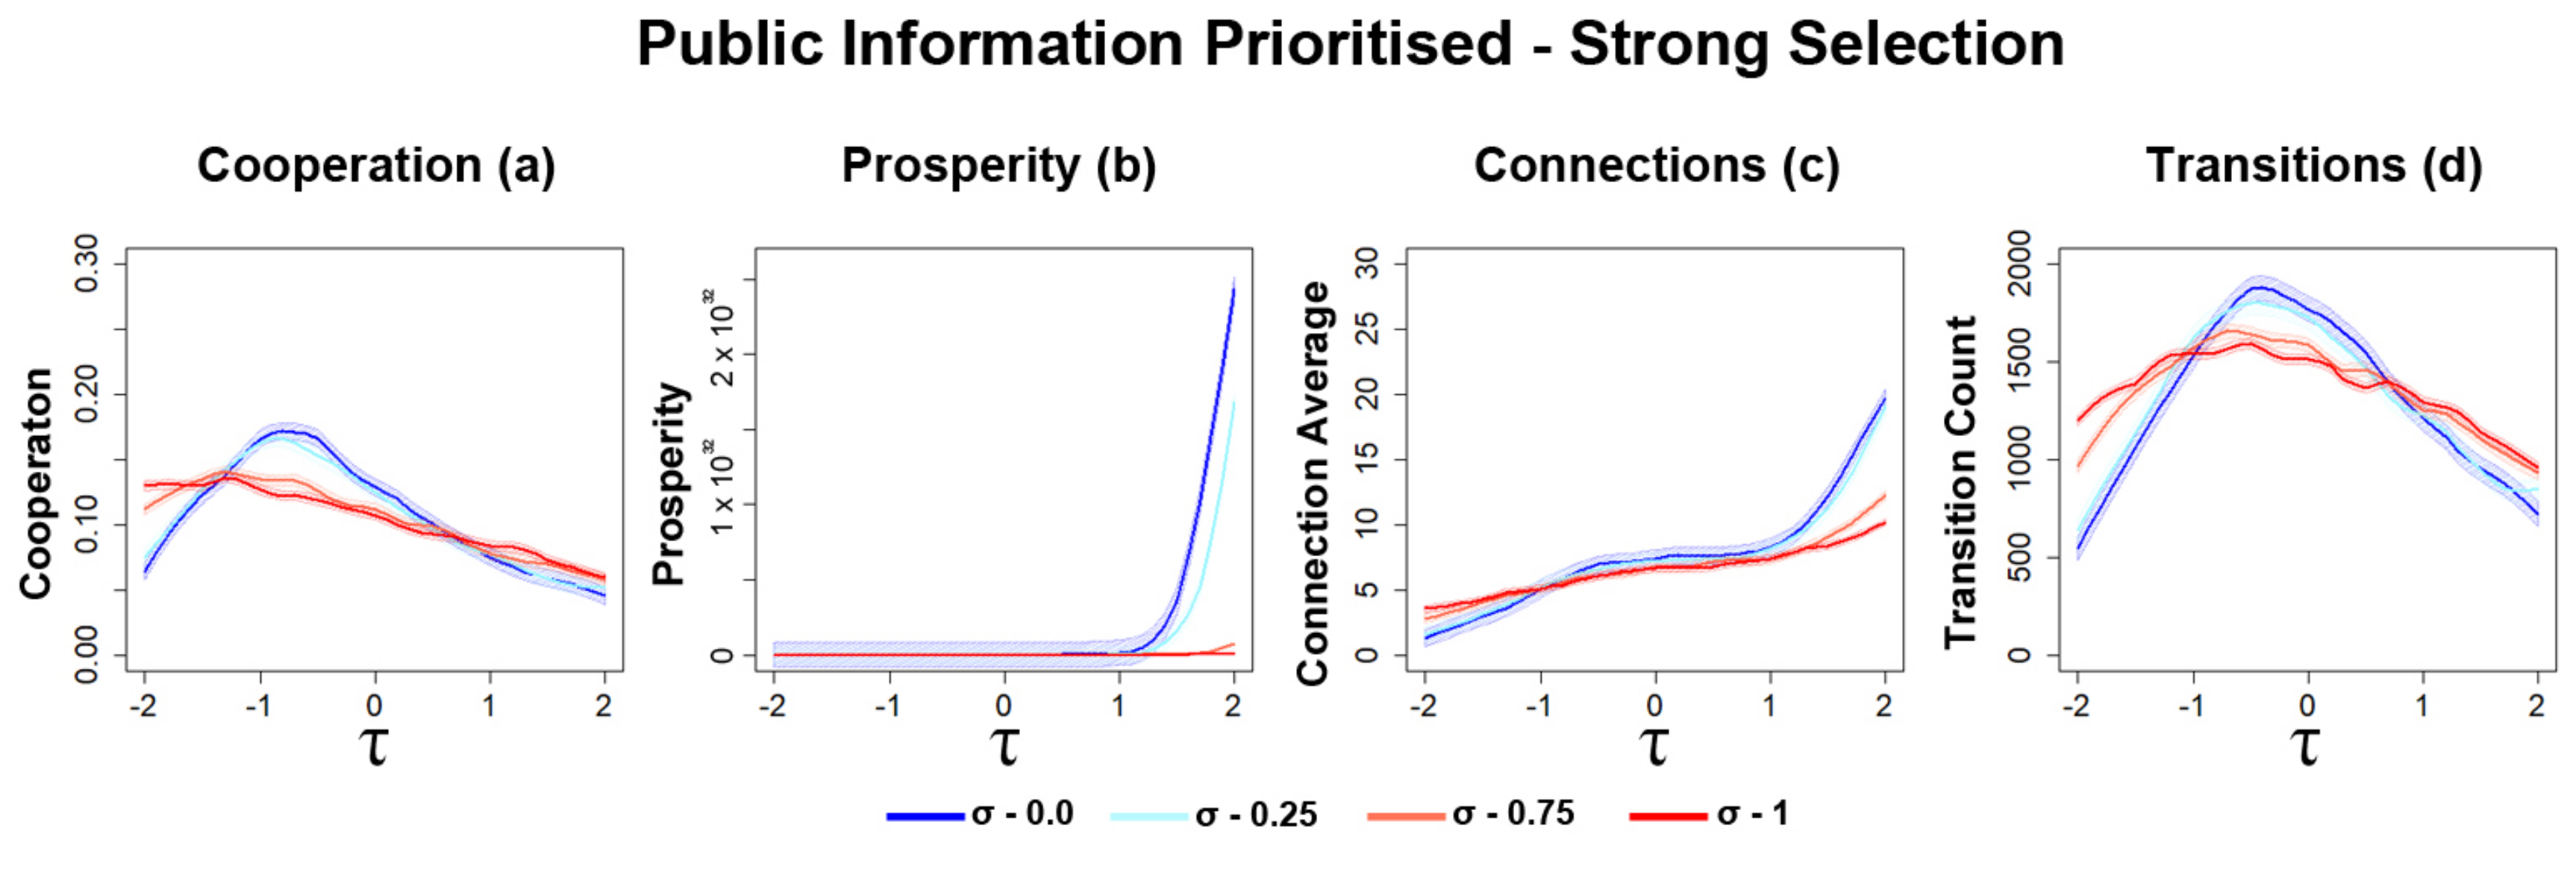
3.2.3. Opinion Diversity Can Mitigate Disruption of Networks

In this section, we carry out further simulations to further evaluate the role of public information. This is achieved by adjusting the probabilities p and q used for balancing public and private information (see Section 2.2). Here, the probabilities p and q are modified so that individuals are far more likely to form a connection when public information indicates a connection should be made. These are set as p = 0.75 and q = 0.25 . This means that public information is prioritised over private information in the decision-making.
The level of average prosperity is still impacted by diversity of opinion, which gradually decreases as the opinion diversity increases (Figure 12b). The average level of cooperation (Figure 12a) shows that there is a general decrease in cooperation across all σ values, suggesting that prioritising public information makes it easier for defectors to take advantage of cooperators. As seen in Figure 12a, higher levels of diversity lead to higher levels of cooperation at higher values of τ . Similar to before (Figure 8a), this appears to come at some cost as lower opinion diversity is associated with higher levels of cooperation at τ 0 . The number of connections (Figure 12c) illustrates a gradual decrease as diversity is increased, correlating with observations regarding prosperity and cooperation (Figure 12a,b). In Figure 12c, we can see the number of connections decreases, suggesting similar behaviour to what has been previously observed at higher values of σ .
Comparing Figure 8d and Figure 12d, we can see that the number of transitions occur in a similar pattern, with the point in which a sharp increase in transitions begins becoming more delayed as diversity of opinion increases and begins at lower values of τ . Figure 13 shows that the overall number and length of cascades significantly increase. As seen in Figure 13a, the number of N cascades that occur increase as diversity increases, although this also results in shorter cascades, as seen in Figure 13b. At some values of τ , this trend reverses, with lower diversity having a higher cascade count, which correlates with the transition data observed in Figure 12d. For τ 0 , networks with higher levels of diversity of opinion briefly result in less cascades compared to lower levels of diversity (Figure 13c). This soon changes as networks begin to experience collapses in cooperation at higher values of τ (Figure 12a). This suggests that higher levels of diversity of opinion can aid with suppressing P cascades and possibly aids with holding off the eventual collapse in cooperation.

3.2.4. Sharp Increases in the Number of Transitions for Strong Selection

The model is then configured to use strong selection whilst prioritising public information. For these simulations, we use p = 0.75 , q = 0.25 and δ = 0.1 . As seen in Figure 14b, the average level of prosperity amongst individuals is greatly impacted and is overall significantly lower, suggesting that any disruption that occurred had a much greater impact on cooperation. The average level of cooperation in Figure 14a, also revealed that networks struggle to produce any cooperation. Figure 14 shows that for a brief period, lower levels of diversity of opinion are able to perform slightly better than higher levels of diversity. As we can see in Figure 14c, the average number of connections is generally lower than in Figure 12c. For lower values of σ , more connections were formed between nodes when τ 0  Figure 14c), which may hint at why more cooperation was observed at lower values of τ when diversity is low.
Another area with a significant increase is the number of transitions (Figure 14d). This suggests that both public information and strong selection contribute significantly to the level of instability that occurs on these networks. For most values of τ , results suggest that higher levels of diversity are able to better suppress the amount of transitions when compared against lower levels of diversity, at some cost to cooperation (Figure 14a,d). The number of cascades that occur in Figure 15a,c are significantly higher when compared to Figure 13a,c, although they are also lower when compared to Figure 11a,c. The most dramatic differences occur for P cascade results. The first notable change is that there is a significant drop in the number of P cascades as the level of opinion diversity increases (Figure 15c), which suggests that the presence of more cautious nodes in the network aids with reducing the number of P cascades. The second notable change is that the length of cascades becomes longer as diversity of opinion increases (Figure 15d).

4. Discussion

Using a novel computational model, we have demonstrated that a diversity of opinion can have an important effect on the dynamics of cooperative networks. Simulations of the model provided insight into how varying private information can affect the makeup of networks and the emergence of information cascades. The presented results suggest that as diversity of opinion is increased, at lower values of τ the decision threshold, nodes are more open to forming connections. Examining specificity in Figure 5 shows that at higher values of τ and as σ opinion diversity is increased, nodes are able to better identify defectors, suggesting intuitively that they are more cautious. This is reflected in the average number of connections observed in Section 3, suggesting that nodes are more likely to form smaller clusters and avoid more densely connected networks, particularly in networks with weak selection. This also results in a notable decrease in both prosperity at higher values of τ and the number of transitions at τ 0 seen in Section 3. These patterns could generally be observed where individual decisions are taken based on mostly public information and selection strength is strong. Both public information and strong selection prove to be significantly disruptive to network dynamics, regardless of the current level of opinion diversity. However, whilst an increased opinion diversity results in higher stability for opportune values of the decision threshold τ , this also produces a noticeable drop in cooperation (Figure 8a and Figure 14a). These alongside connections suggest that nodes may have been contributing towards global cooperative efforts in isolated groups (Figure 8c and Figure 14c).
The results presented and the model introduced could be in future used to simulate and understand the dynamics of other types of games such as those where a level of coordination or consensus [23] between all nodes is required to avoid detrimental, non-cooperative issues [24,25,26]. Something to consider as part of potential future work is the method for assigning opinion values to each individuals. As part of this model, individuals are randomly assigned a opinion value obtained by sampling a Gaussian distribution. Whilst this allows to simplify the model and, at the same time, obtain some initial insight into how diversity of opinion can affect these networks, additional mechanics should be considered to better reflect scenarios this model could be applied to. For example, newcomers joining the network might lean more towards being cautious when there is significant defection taking place and lean more towards an open attitude when defection is not present. Of future interest could also be a more detailed study of the information cascades, in order to properly understand this kinds of cascade structures that commonly occur (e.g., following the work carried out by Leskovec et al. [8], where researchers categorised the kinds of cascades that occurred in a recommendation based network). It could also be of interest to employ a classification study in order to further study the findings that are obtained from these kinds of network models.

5. Conclusions

Overall, these results illustrate that a diversity of opinion amongst individuals can have an impact on both the makeup and level of cooperation that occurs in dynamical networks. These initial findings suggest that, in particular scenarios, higher levels of diversity of opinion can contribute to network stability by suppressing the amount of transitions that occur. This does come at some cost to cooperation and prosperity. Whether or not this is a price worth paying will likely depend on the scenario this model is applied to and the severity of the consequences as a result of a failure to cooperate. It may be of interest to expand upon the limitations that were encountered during this paper to further understand and document the phenomena that was observed. The model was limited to a fixed number of nodes present on the networks, future work may wish to account for models where the number of nodes present can be varying as simulations progress to incorporate more realistic population dynamics. We also assume that nodes copy the connections of other nodes in a copycat attitude, rather than forming connections at random, this may also be worth expanding upon in future works.

Author Contributions

Conceptualization, A.L.M.; Methodology, A.L.M. and M.C.; Software, A.L.M.; Validation, A.L.M. and M.C.; Formal analysis, A.L.M.; Investigation, A.L.M.; Resources, A.L.M.; Data curation, A.L.M.; Writing–original draft preparation, A.L.M.; Writing–review and editing, A.L.M. and M.C.; Visualization, A.L.M.; Supervision, M.C.; Project administration, A.L.M.; Funding acquisition, M.C. All authors have read and agreed to the published version of the manuscript.

Funding

This research received no external funding.

Institutional Review Board Statement

Not applicable.

Informed Consent Statement

Not applicable.

Data Availability Statement

The data presented in this study is available https://stummuac-my.sharepoint.com/:u:/g/personal/55100443admmuacuk/EZ1VEeVvsMFCs3MKRplHaakB5FGmSkE6aDPFLLKkUI-hmQ?e=pqMsYK[here], additionally, they may be requested from the authors.

Acknowledgments

We thank Google for providing some research credits, which allowed for some of the required simulations to be ran on their Google Cloud Platform.

Conflicts of Interest

The authors declare no conflict of interest.

Appendix A. RStudio Functions

Appendix A.1. Standard Error Function

std <- function (x) sd(x)/sqrt((length(x)))

Appendix A.2. Graph Initialisation Function

initGraph <- function(ylim1,ylim2)
plot.new()
plot.window(xlim = c(−2,2), ylim = c(ylim1,ylim2))
axis(1, cex.axis = 1.5)
axis(2, cex.axis = 1.5)
box()

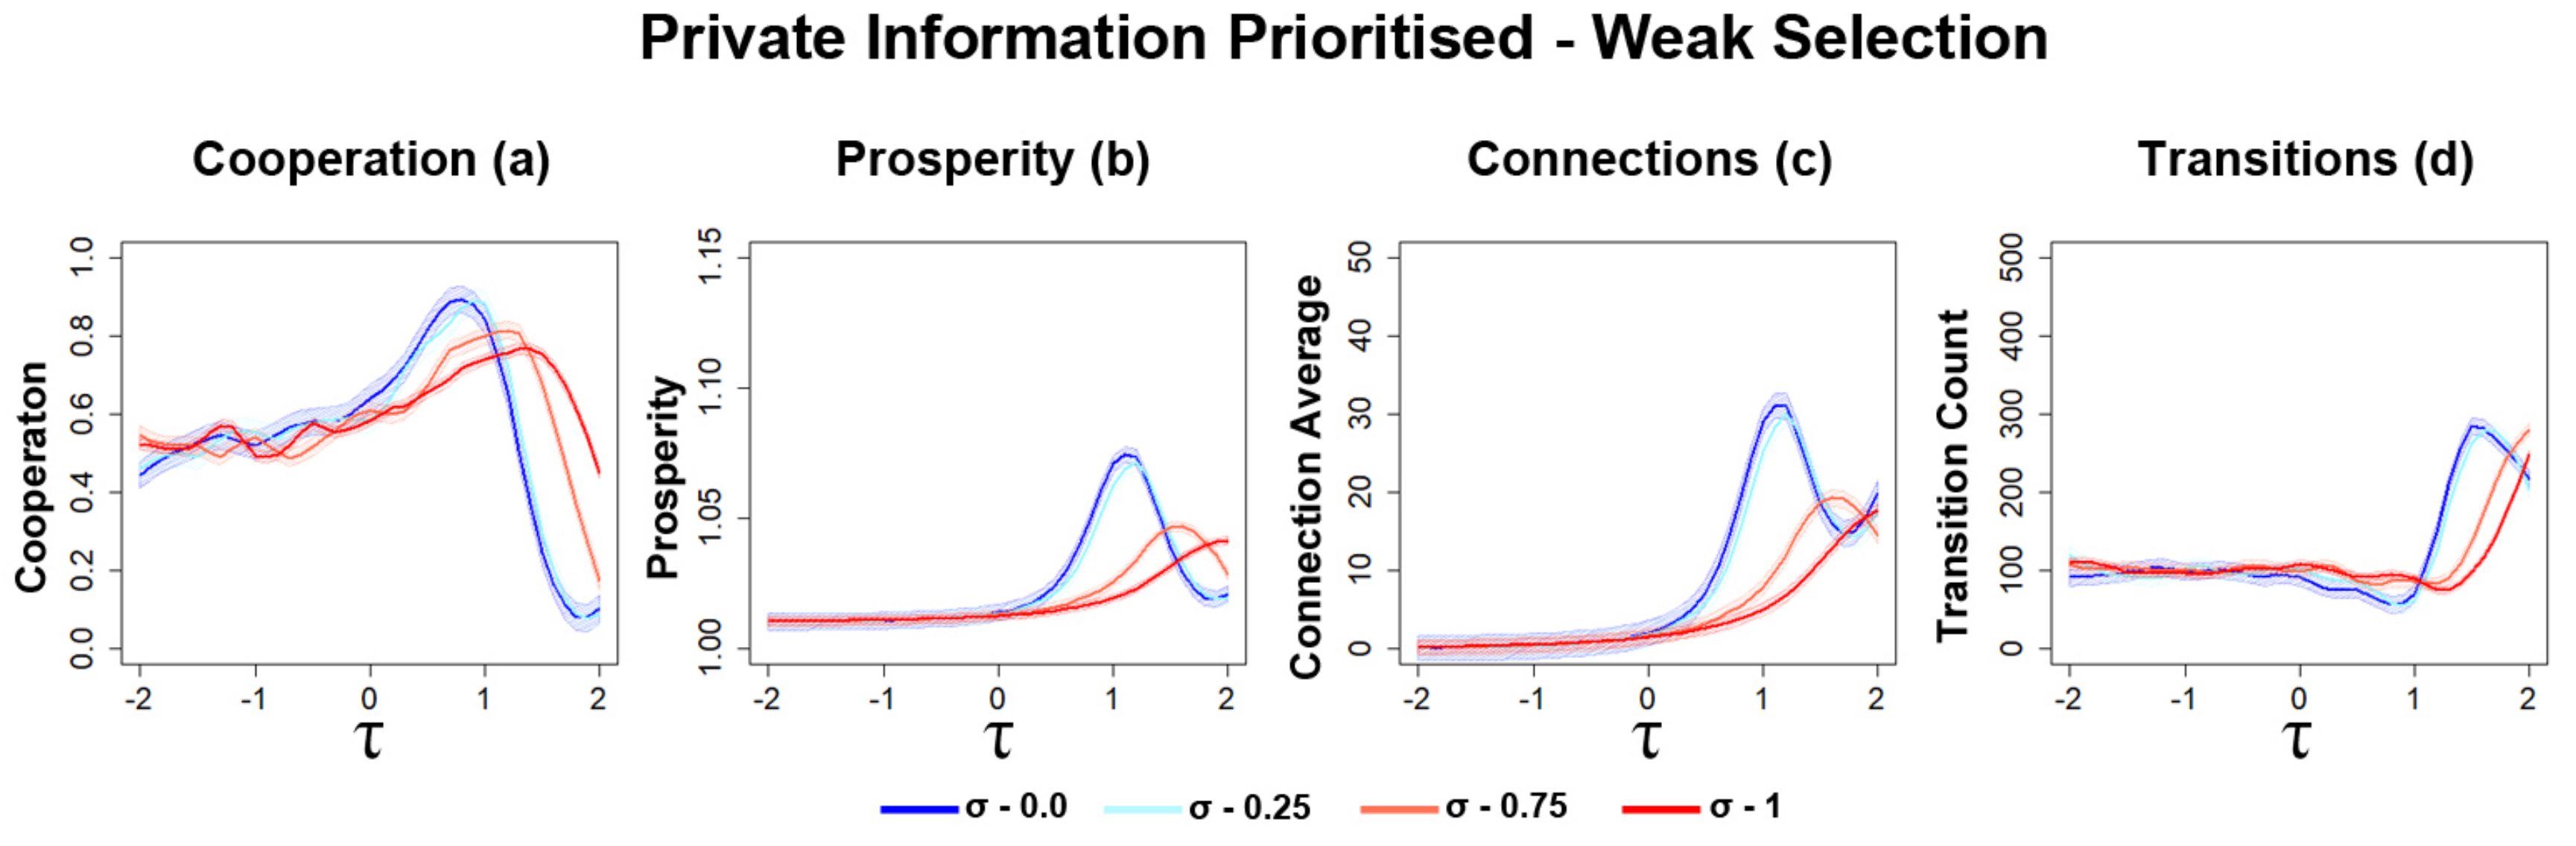
Appendix A.3. Cooperation Plot Function

createCoopOverlapPlots <- function(coop_ds, plot_col, plot_col2) {
loessMod <- loess((ave_coop/100) tau_centre, data = coop_ds, span=0.2);
polygon(c(coop_ds$tau_centre, rev(coop_ds$tau_centre)), c(predict(loessMod) - std (predict(loessMod)), rev(predict(loessMod) + std(predict(loessMod)))), col = plot_col2, density = 50)
lines(coop_ds$tau_centre, ylim = c(0,1), predict(loessMod), type = “l”, col = plot_col, lwd = 2, xlab = “T”,ylab = “”)
par(new = TRUE)
}

Appendix A.4. Prosperity Plot Function

createProspOverlapPlots <- function(coop_ds, plot_col, plot_col2) {
loessMod <- loess(ave_prosp tau_centre, data = coop_ds, span = 0.25);
polygon(c(coop_ds$tau_centre, rev(coop_ds$tau_centre)), c(predict(loessMod) - std (predict(loessMod)), rev(predict(loessMod) + std(predict(loessMod)))), col = plot_col2, density = 50)
lines(coop_ds$tau_centre, ylim = c(0,1), predict(loessMod), type = “l”, col = plot_col, lwd = 2, xlab = “T”,ylab = “”)
par(new = TRUE)
}

Appendix A.5. Degree Plot Function

createDegreeOverlapPlots <- function(coop_ds, plot_col, plot_col2) {
loessMod <- loess(ave_degree tau_centre, data = coop_ds, span = 0.25);
polygon(c(coop_ds$tau_centre, rev(coop_ds$tau_centre)), c(predict(loessMod) - std (predict(loessMod)), rev(predict(loessMod) + std(predict(loessMod)))), col = plot_col2, density = 50)
lines(coop_ds$tau_centre, ylim = c(0,50), predict(loessMod), type = “l”, col = plot_col, lwd = 2, xlab = “T”,ylab = “”)
par(new = TRUE)
}

Appendix A.6. Transition Plot Function

createTransitionOverlapPlots <- function(coop_ds, plot_col, plot_col2) {
loessMod <- loess(transitions tau_centre, data = coop_ds, span = 0.25);
polygon(c(coop_ds$tau_centre, rev(coop_ds$tau_centre)), c(predict(loessMod) - std (predict(loessMod)), rev(predict(loessMod) + std(predict(loessMod)))), col = plot_col2, density = 50)
lines(coop_ds$tau_centre, ylim = c(0,50), predict(loessMod), type = “l”, col = plot_col, lwd = 2, xlab = “T”,ylab = “”)
par(new = TRUE)
}

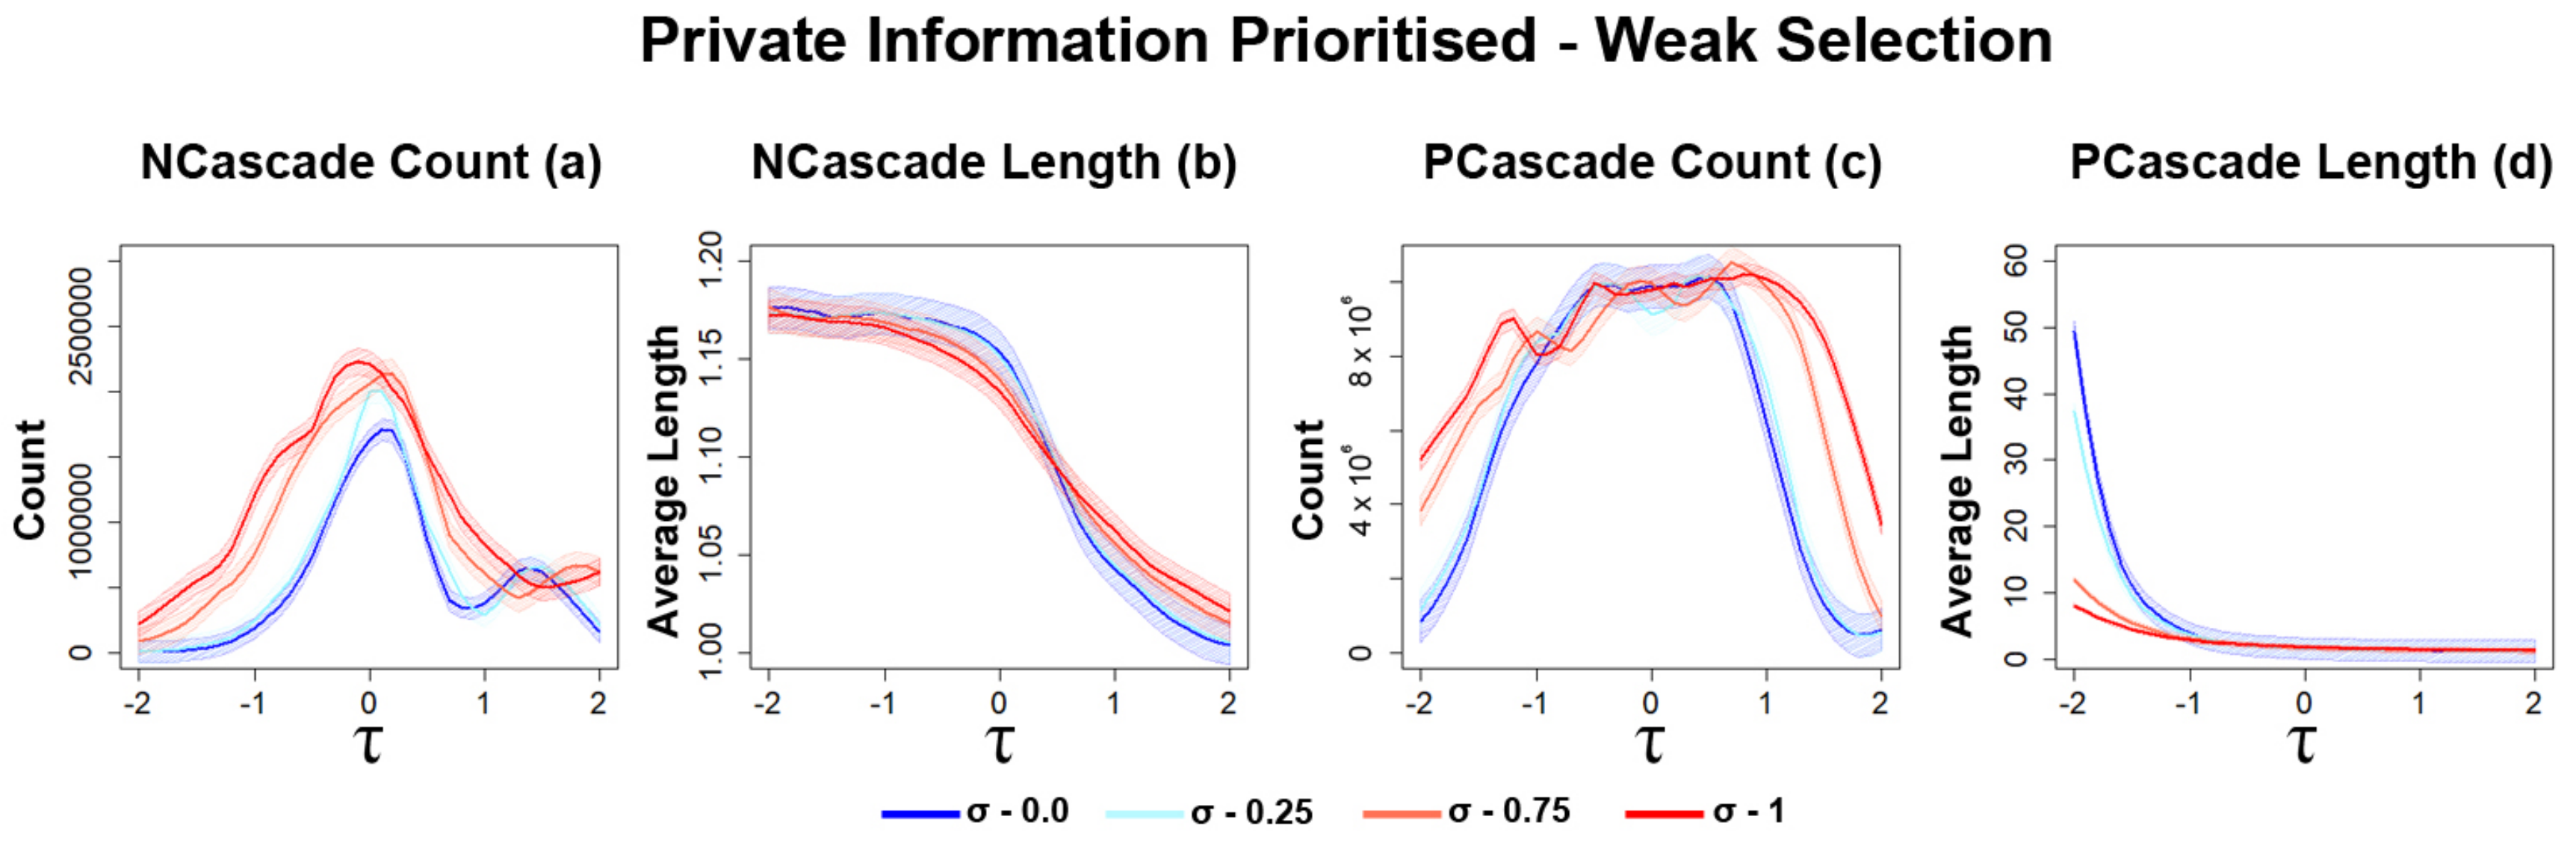
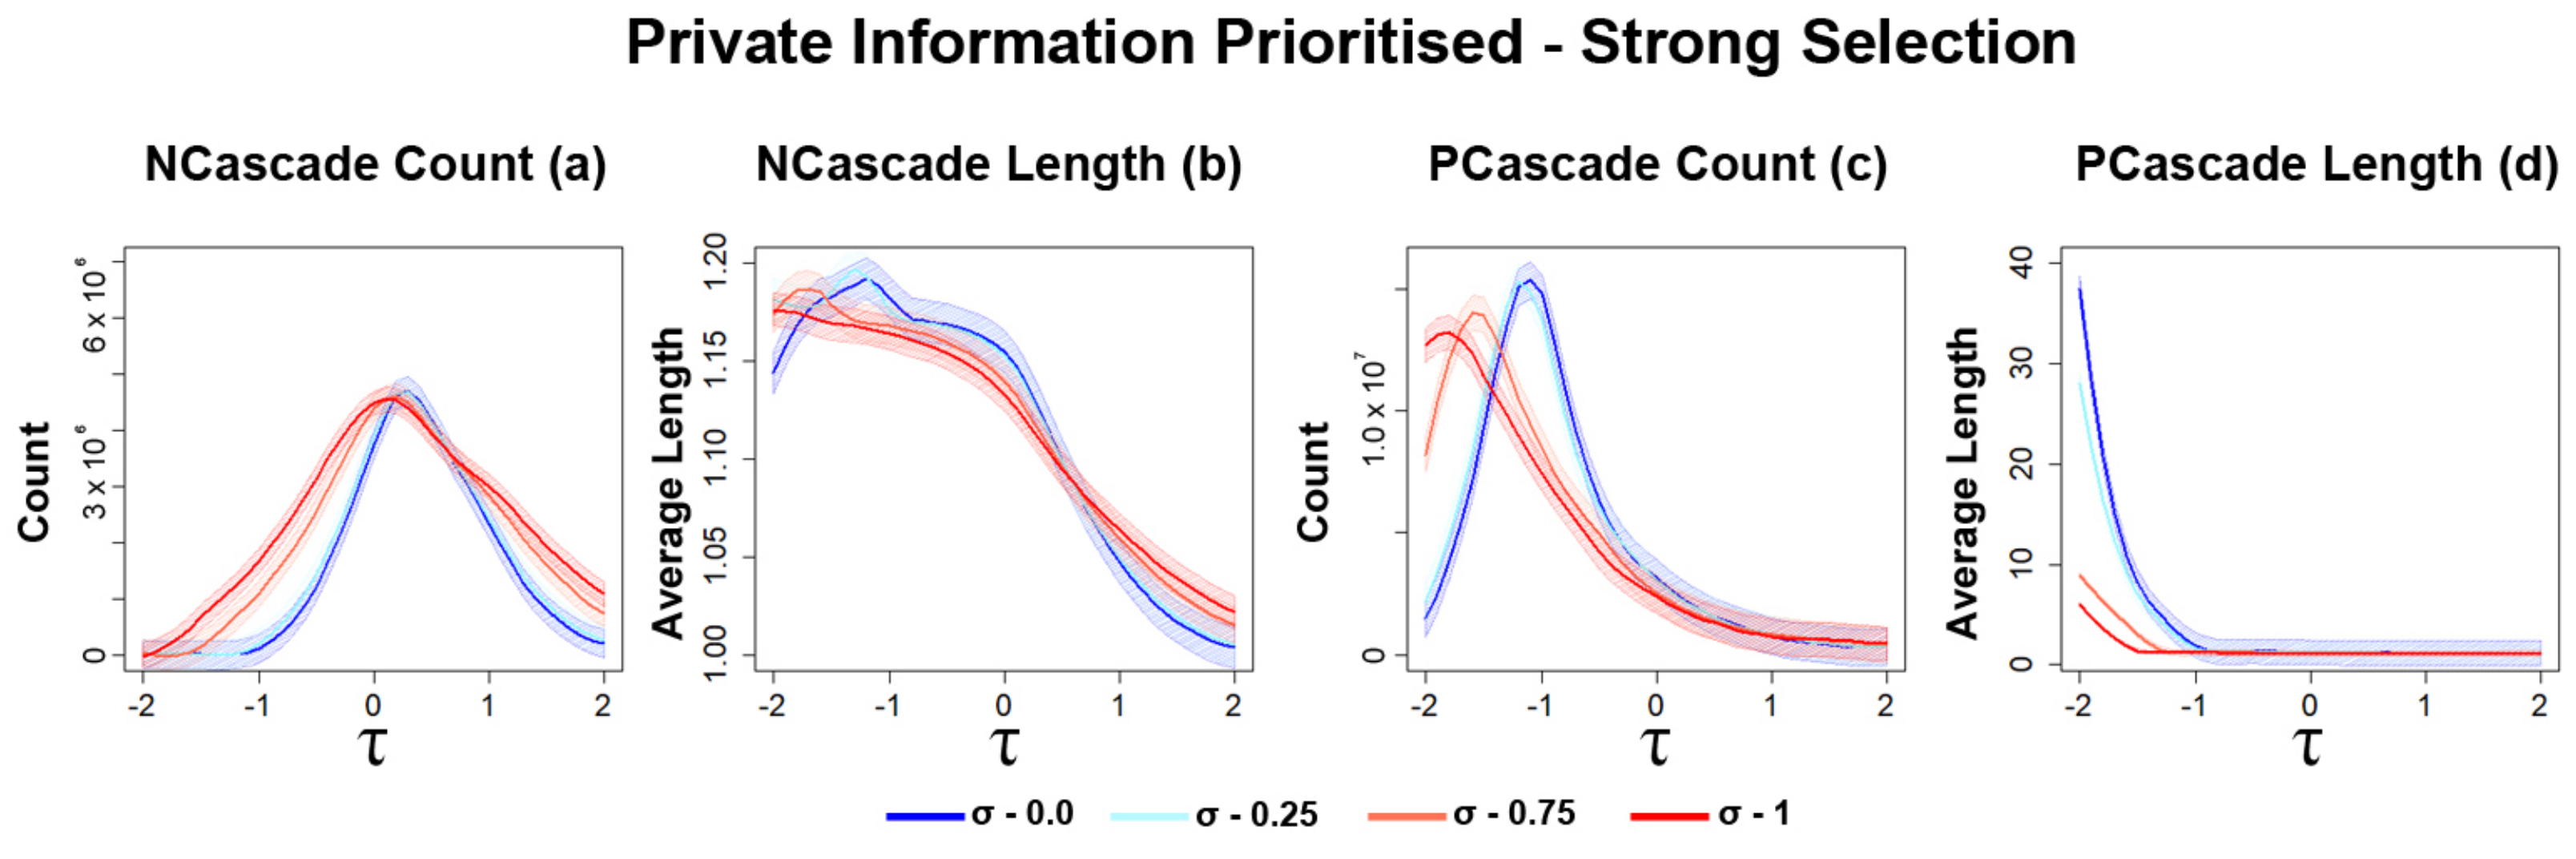
Appendix A.7. NCascade Count Plot Function

createNCascadeCountOverlapPlots <- function(coop_ds, plot_col, plot_col2) {
loessMod <- loess(ncascade_count tau_centre, data = coop_ds, span = 0.25);
polygon(c(coop_ds$tau_centre, rev(coop_ds$tau_centre)), c(predict(loessMod) - std (predict(loessMod)), rev(predict(loessMod) + std(predict(loessMod)))), col = plot_col2, density = 50)
lines(coop_ds$tau_centre, ylim=c(0, 3000000 ), predict(loessMod), type = “l”, col = plot_col, lwd = 2, xlab = “T”,ylab = “”)
par(new = TRUE)
}

Appendix A.8. NCascade Length Plot Function

createNCascadeLengthOverlapPlots <- function(coop_ds, plot_col, plot_col2) {
loessMod <- loess(ncascade_length tau_centre, data = coop_ds, span = 0.25);
polygon(c(coop_ds$tau_centre, rev(coop_ds$tau_centre)), c(predict(loessMod) - std (predict(loessMod)), rev(predict(loessMod) + std(predict(loessMod)))), col = plot_col2, density = 50)
lines(coop_ds$tau_centre, ylim = c(1,1.2), predict(loessMod), type = “l”, col = plot_col, lwd = 2, xlab = “T”,ylab = “”)
par(new = TRUE)
}

Appendix A.9. PCascade Count Plot Function

createPCascadeCountOverlapPlots <- function(coop_ds, plot_col, plot_col2) {
loessMod <- loess(pcascade_count tau_centre, data = coop_ds, span = 0.25);
polygon(c(coop_ds$tau_centre, rev(coop_ds$tau_centre)), c(predict(loessMod) - std (predict(loessMod)), rev(predict(loessMod) + std(predict(loessMod)))), col = plot_col2, density = 50)
lines(coop_ds$tau_centre, ylim = c(0,10.3 ), predict(loessMod), type = “l”, col = plot_col, lwd = 2, xlab = “T”,ylab = “”)
par(new = TRUE)
}

Appendix A.10. PCascade Length Plot Function

createPCascadeLengthOverlapPlots <- function(coop_ds, plot_col, plot_col2) {
loessMod <- loess(pcascade_length tau_centre, data = coop_ds, span = 0.25);
polygon(c(coop_ds$tau_centre, rev(coop_ds$tau_centre)), c(predict(loessMod) - std (predict(loessMod)), rev(predict(loessMod) + std(predict(loessMod)))), col = plot_col2, density = 50)
lines(coop_ds$tau_centre, ylim = c(1,60), predict(loessMod), type = “l”, col = plot_col, lwd=2, xlab = “T”,ylab = “”)
par(new = TRUE)
}

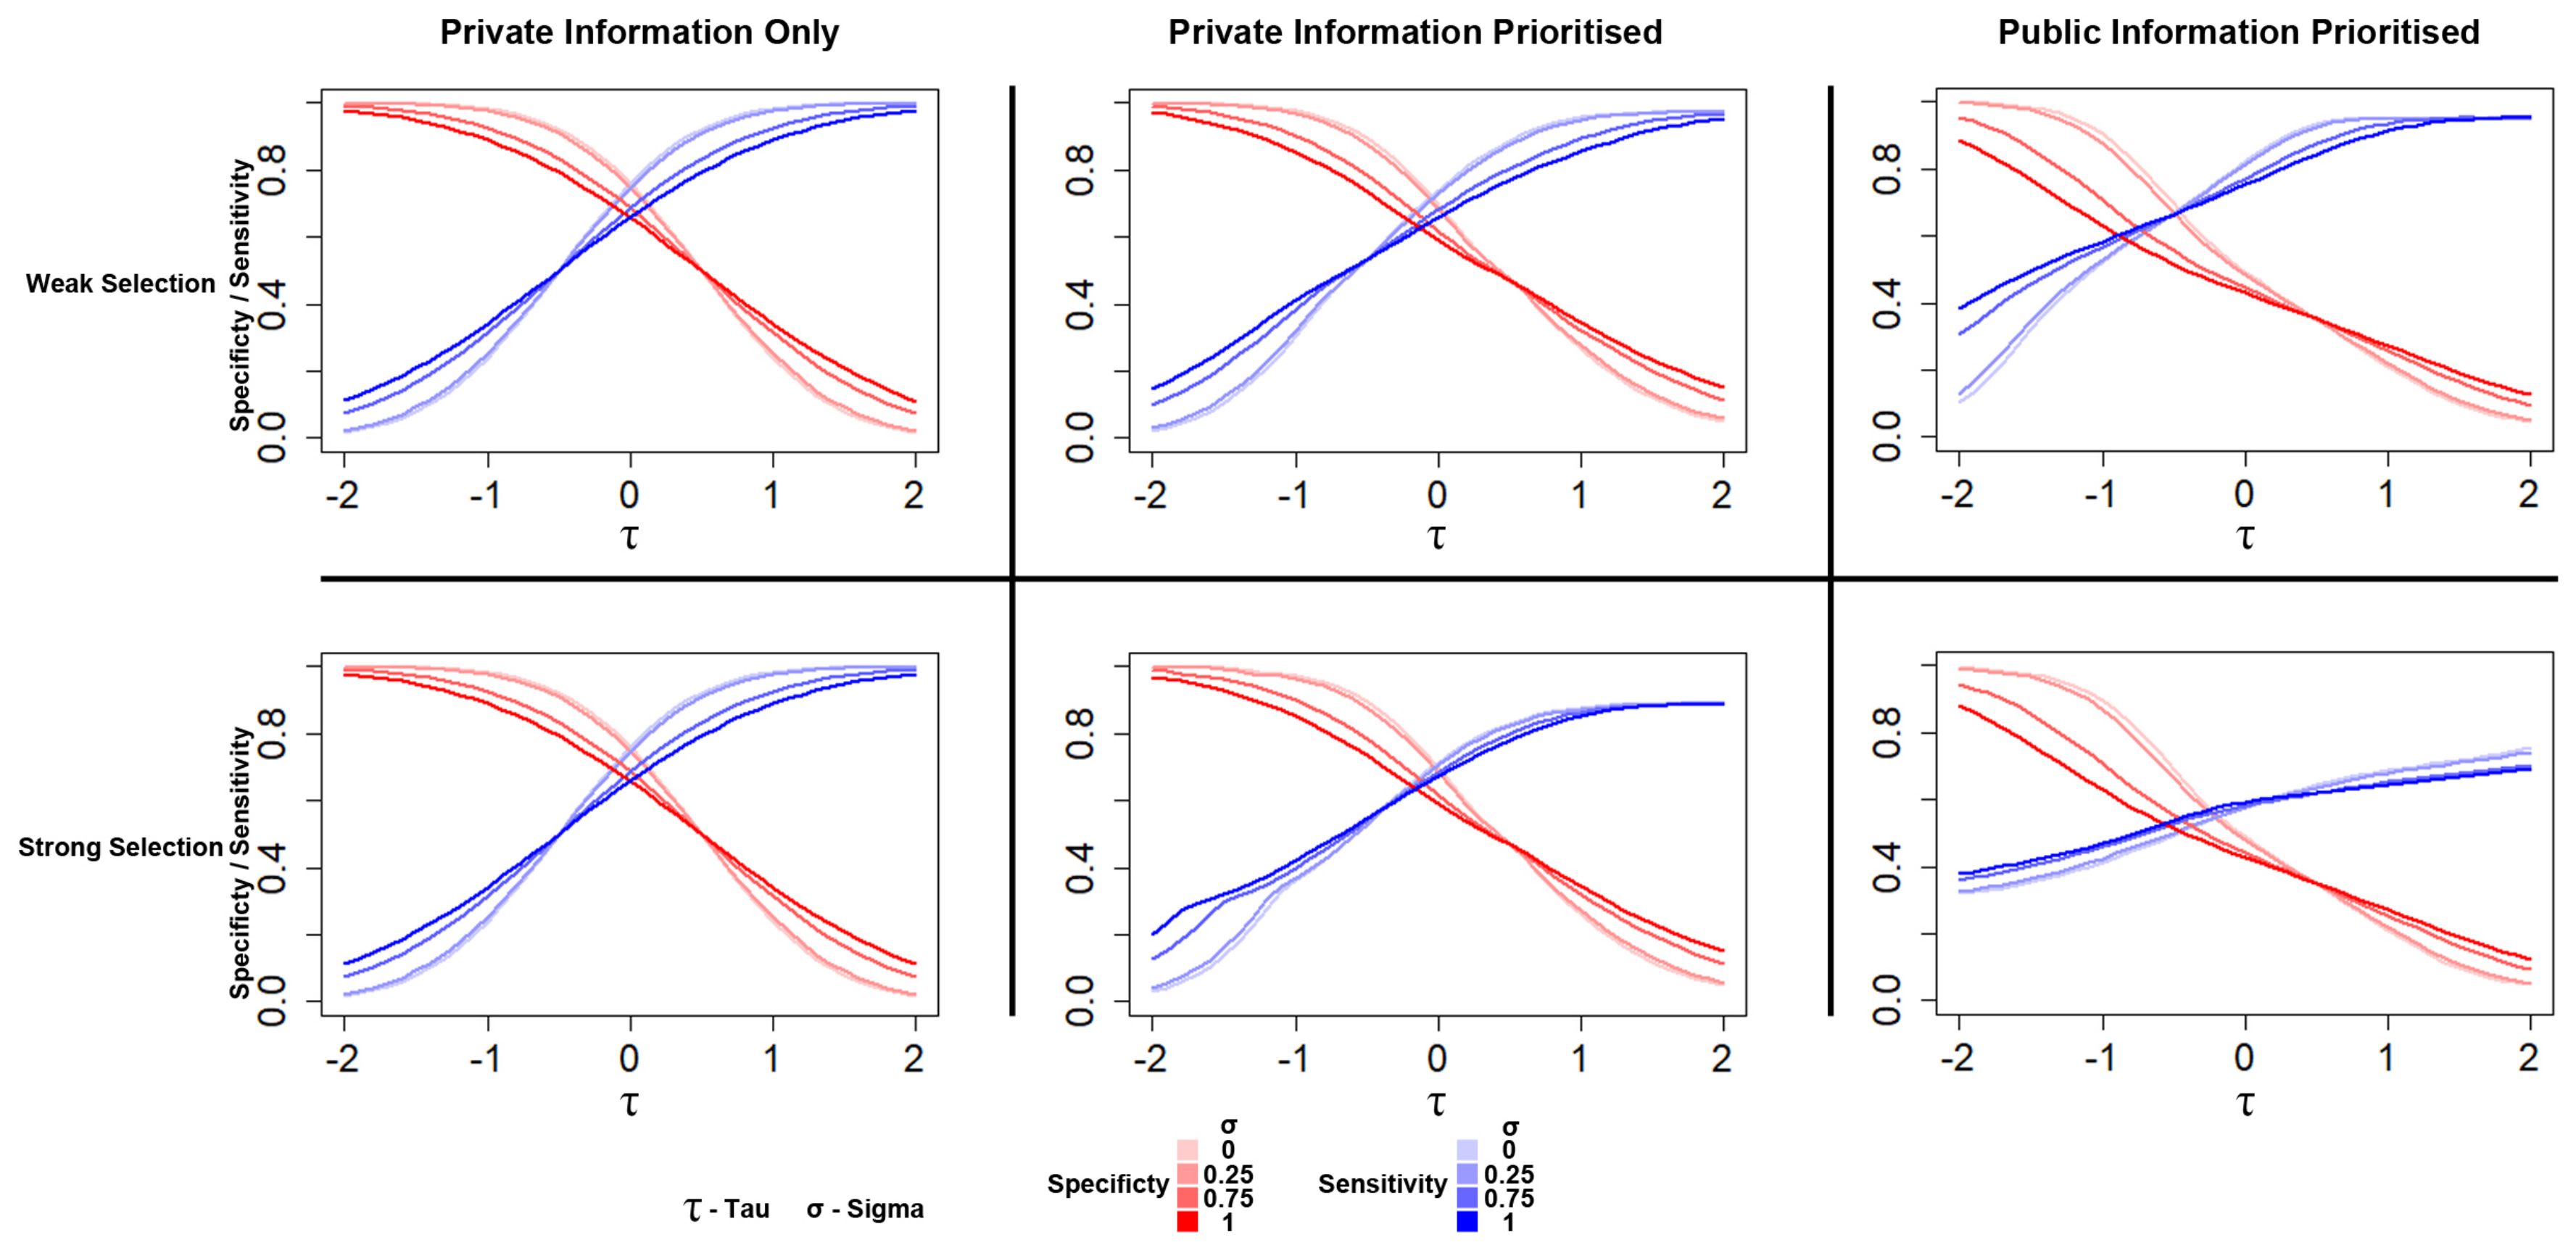
Appendix A.11. Specificity and Sensitivity Plot Function

createSpecSensOverlapPlots <- function(coop_ds, plot_col1, plot_col2){
lines(coop_ds$tau_centre, ylim = c(0,1), coop_ds$spec, type = “l”, col = plot_col1, lwd = 2, xlab = “T”,ylab = “”) par(new = TRUE)
lines(coop_ds$tau_centre, ylim = c(0,1), coop_ds$sens, type = “l”, col = plot_col2, lwd = 2, xlab = “T”,ylab = “”)
par(new = TRUE)
}

References

  1. Easley, D.; Kleinberg, J. Networks, Crowds, and Markets; Cambridge University Press: Cambridge, UK, 2010. [Google Scholar]
  2. Kraft-Todd, G.; Yoeli, E.; Bhanot, S.; Rand, D. Promoting Cooperation in the Field. Curr. Opin. Behav. Sci. 2015, 3, 96–101. [Google Scholar] [CrossRef]
  3. Rand, D.G.; Nowak, M.A. Human Cooperation. Trends Cogn. Sci. 2013, 17, 413–425. [Google Scholar] [CrossRef] [PubMed]
  4. Hauser, O.P.; Hendriks, A.; Rand, D.G.; Nowak, M.A. Think global, act local: Preserving the global commons. Sci. Rep. 2016, 6, 36079. [Google Scholar] [CrossRef] [PubMed] [Green Version]
  5. Levin, S. Crossing Scales, Crossing Disciplines: Collective Motion and Collective Action in the Global Commons. Philos. Trans. R. Soc. B Biol. Sci. 2010, 365, 13–18. [Google Scholar] [CrossRef] [PubMed] [Green Version]
  6. Lloyd, W.F. WF Lloyd on the Checks to Population. Popul. Dev. Rev. 1980, 6, 473–496. [Google Scholar] [CrossRef]
  7. Nowak, M.A. Evolutionary Dynamics: Exploring the Equations of Life; Harvard University Press: Cambridge, MA, USA, 2006. [Google Scholar]
  8. Leskovec, J.; Singh, A.; Kleinberg, J. Patterns of Influence in a Recommendation Network. In Pacific-Asia Conference on Knowledge Discovery and Data Mining; Springer: Berlin, Germany, 2006; pp. 380–389. [Google Scholar]
  9. Maharani, W.; Gozali, A.A.; Adiwijaya. Degree Centrality and Eigenvector Centrality in Twitter. In Proceedings of the 2014 8th International Conference on Telecommunication Systems Services and Applications (TSSA), Kuta, Indonesia, 23–24 October 2014; pp. 1–5. [Google Scholar]
  10. Wooldridge, M. Computation and the Prisoner’s Dilemma. IEEE Intell. Syst. 2012, 27, 75–80. [Google Scholar] [CrossRef]
  11. Bikhchandani, S.; Hirshleifer, D.; Welch, I. Learning from the Behavior of Others: Conformity, Fads, and Informational Cascades. J. Econ. Perspect. 1998, 12, 151–170. [Google Scholar] [CrossRef] [Green Version]
  12. Sánchez, A. Physics of Human Cooperation: Experimental Evidence and Theoretical Models. J. Stat. Mech. Theory Exp. 2018, 2018, 024001. [Google Scholar] [CrossRef] [Green Version]
  13. Wu, B.; Zhou, D.; Fu, F.; Luo, Q.; Wang, L.; Traulsen, A. Evolution of cooperation on stochastic dynamical networks. PLoS ONE 2010, 5, e11187. [Google Scholar] [CrossRef] [PubMed]
  14. Lee, S.; Son, Y.J. Extended Decision Field Theory with Social-Learning for Long-Term Decision-Making Processes in Social Networks. Inf. Sci. 2020, 512, 1293–1307. [Google Scholar] [CrossRef]
  15. Tappin, B.M.; Pennycook, G.; Rand, D.G. Thinking Clearly About Causal Inferences of Politically Motivated Reasoning: Why Paradigmatic Study Designs Often Undermine Causal Inference. Curr. Opin. Behav. Sci. 2020, 34, 81–87. [Google Scholar] [CrossRef]
  16. Busu, M. Game Theory in Strategic Management-Dynamic Games. Theoretical and Practical Examples. Manag. Dyn. Knowl. Econ. 2018, 6, 645–655. [Google Scholar] [CrossRef]
  17. Yang, G.; Csikász-Nagy, A.; Waites, W.; Xiao, G.; Cavaliere, M. Information Cascades and the Collapse of Cooperation. Sci. Rep. 2020, 10, 1–13. [Google Scholar] [CrossRef] [PubMed]
  18. Sood, V.; Redner, S. Voter model on heterogeneous graphs. Phys. Rev. Lett. 2005, 94, 178701. [Google Scholar] [CrossRef] [Green Version]
  19. Xue, M.; Roy, S. Averager-copier-voter models for hybrid consensus. IFAC-PapersOnLine 2016, 49, 1–6. [Google Scholar] [CrossRef]
  20. Avilés, L. Cooperation and non-linear dynamics: An ecological perspective on the evolution of sociality. Evol. Ecol. Res. 1999, 1, 459–477. [Google Scholar]
  21. Traulsen, A.; Shoresh, N.; Nowak, M.A. Analytical results for individual and group selection of any intensity. Bull. Math. Biol. 2008, 70, 1410–1424. [Google Scholar] [CrossRef] [Green Version]
  22. Loess: Local Polynomial Regression Fitting—RDocumentation. Available online: https://www.rdocumentation.org/packages/stats/versions/3.6.2/topics/loess (accessed on 26 April 2021).
  23. Tomassini, M.; Pestelacci, E. Coordination games on dynamical networks. Games 2010, 1, 242–261. [Google Scholar] [CrossRef] [Green Version]
  24. Liu, S.; Zhao, L.; Zhang, J. Strategy Dynamics with Feedback Control in the Global Climate Dilemma Games. In Proceedings of the 2019 IEEE International Conference on Systems, Man and Cybernetics (SMC), Bari, Italy, 6–9 October 2019; pp. 518–522. [Google Scholar]
  25. Pejó, B.; Biczók, G. Corona Games: Masks, Social Distancing and Mechanism Design. In Proceedings of the 1st ACM SIGSPATIAL International Workshop on Modeling and Understanding the Spread of COVID-19, Seattle, WA, USA, 3 November 2020; pp. 24–31. [Google Scholar]
  26. Brodie, B. Strategy in the Missile Age; Princeton University Press: Princeton, NJ, USA, 2015. [Google Scholar]
Figure 1. The payoff matrix that is used to implement the prisoner’s dilemma. The choice each player makes during an interaction with each other will affect the payoff received. Here, b represents the benefits distributed by a cooperator, whilst c represents the cost that the act of cooperating will incur. Parameters should be configured to adhere to the condition of b > c > 0 . In the simulations we use b = 10 and c = 8 .
Mathematics 09 01801 g001
Figure 2. An illustration of the process that is undertaken as a newcomer joins the network at each step during the simulation. Firstly, a newcomer will select an existing node to act as its role model, which is influenced by both nodes current payoff and the current selection strength (a). Following this, the newcomer will adopt a strategy, by either copying the role model or mutating (b). Lastly, the newcomer will then proceed to choose which of the role models neighbours to form connections with, which is achieved by making use of available public and private information (c) [17].
Mathematics 09 01801 g002
Figure 3. Truth table for determining which combination of choices made by nodes are considered as contributing to cascades. The first column indicates whether the choice to connect (C) or not connect (NC) is correct. The second and third columns show the indications from public and private information. The forth column is the actual choice made by the newcomer. The fifth column indicates if a cascade has occurred, either P or N cascade, or if none has occurred with 0.
Mathematics 09 01801 g003
Figure 4. An illustration of the two types of cascades that are monitored and and how they can potentially propagate as newcomers join the network. A P cascade is considered to have occurred when a node does not form a connection with another cooperator based on misleading public information. A N cascade is considered to have occurred when a node incorrectly forms a connection with a defector based on misleading public information. Diagram is based on illustration presented in [17] used to describe the progression of cascades in cooperative networks.
Mathematics 09 01801 g004
Figure 5. Specificity and sensitivity of individual decision making. Plots visualise and compare the specificity and sensitivity values that were recorded from simulations. In general, as diversity of opinion diversity is increased, nodes are able to better identify cheaters at higher τ settings. τ represents the decision threshold. σ represents opinion diversity. Data obtained by running the model for 10 8 steps. Plots produced via RStudio utilising code found in Appendix A.
Mathematics 09 01801 g005
Figure 6. Increasing diversity of opinion leads to less transitions and connections, but also less cooperation. The plots visualise and compare the metrics of cooperation, prosperity, average connectivity and number of transitions for differing levels of opinion diversity. As diversity is increased, the number of transitions and connections decreases at various τ settings. This does appear to come at some cost for the average amount of cooperation and prosperity obtained for higher diversity. Data obtained by running the model for 10 8 steps considering only private information and a δ setting of 0.001. τ represents the decision threshold. σ represents opinion diversity. Shading represents level of standard error calculated for each dataset. Data interpolated utilising RStudio [22]. Plots produced via RStudio utilising code found in Appendix A.
Mathematics 09 01801 g006
Figure 7. Transitions are more frequent in the case of strong selection when only private information is used. The plots visualise and compare the metrics of cooperation, prosperity, average connectivity and number of transitions observed in networks that utilise differing levels of opinion diversity. Although there are some similarities with Figure 6 for how increasing σ can affect cooperation, strong selection clearly leads to an increase in transitions. Networks here struggled to engage in long term cooperation for higher values of τ . Data obtained by running the model for 10 8 steps with only private information and a δ setting of 0.1. τ represents the decision threshold. σ represents opinion diversity. Shading represents level of standard error calculated for each dataset. Data interpolated utilising RStudio [22]. Plots produced via RStudio utilising code found in Appendix A.
Mathematics 09 01801 g007
Figure 8. Limited public information leads to a limited decrease in cooperation. The plots visualise and compare the metrics of cooperation, prosperity, average connectivity and number of transitions for differing levels of opinion diversity. Data obtained by running the model for 10 8 steps with p = 0.25 and q = 0.75 and a δ setting of 0.001. τ represents the decision threshold. σ represents opinion diversity. Shading represents level of standard error calculated for each dataset. Data interpolated utilising RStudio [22]. Plots produced via RStudio utilising code found in Appendix A.
Mathematics 09 01801 g008
Figure 9. Increased opinion diversity generally leads to more, but shallower, information cascades when private information is prioritised. For both cascade types, each graph represents either the number or average length of each cascade type. Data obtained by running the model for 10 8 steps with p = 0.25 and q = 0.75 and a δ setting of 0.001. τ represents the decision threshold. σ represents opinion diversity. Shading represents level of standard error calculated for each dataset. Data interpolated utilising RStudio [22]. Plots produced via RStudio.
Mathematics 09 01801 g009
Figure 10. Public information leads to a moderate loss in cooperation when selection is strong and private information is prioritised. The plots visualise and compare the metrics of cooperation, prosperity, average connectivity and number of transitions for differing levels of opinion diversity. Data obtained by running the model for 10 8 steps with p = 0.25 and q = 0.75 and a δ setting of 0.1. τ represents the decision threshold. σ represents opinion diversity. Shading represents level of standard error calculated for each dataset. Data interpolated utilising RStudio [22]. Plots produced via RStudio utilising code found in Appendix A.
Mathematics 09 01801 g010
Figure 11. Number of P cascades decreases when selection is strong and private information is prioritised. For both cascade types, each graph represents either the number or average length of each cascade type. Under these circumstances, the number of P cascades that occurred gradually decreased as the level of diversity is increased, although there is some increase in areas for N cascades. Data obtained by running the model for 10 8 steps with p = 0.25 and q = 0.75 and a δ setting of 0.1. τ represents the decision threshold. σ represents opinion diversity. Shading represents level of standard error calculated for each dataset. Data interpolated utilising RStudio [22]. Plots produced via RStudio.
Mathematics 09 01801 g011
Figure 12. Prioritising public information leads to a significant drop in cooperation. The plots visualise and compare the metrics of cooperation, prosperity, average connectivity and number of transitions for differing levels of opinion diversity. Data obtained by running the model for 10 8 steps with p = 0.75 and q = 0.25 and a δ setting of 0.001. τ represents the decision threshold. σ represents opinion diversity. Shading represents level of standard error calculated for each dataset. Data interpolated utilising RStudio [22]. Plots produced via RStudio utilising code found in Appendix A.
Mathematics 09 01801 g012
Figure 13. Significant increases in cascades occur when public information is prioritised. For both cascade types, each graph represents either the number or average length of each cascade type. Data obtained by running the model for 10 8 steps with p = 0.75 and q = 0.25 and a δ setting of 0.001. σ represents opinion diversity. Shading represents level of standard error calculated for each dataset. Data interpolated utilising RStudio [22]. Plots produced via RStudio utilising code found in Appendix A.
Mathematics 09 01801 g013
Figure 14. Significant drop in cooperation and increase in transitions occur when public information is prioritised and selection is strong. The plots visualise and compare the metrics of cooperation, prosperity, average connectivity and number of transitions for differing levels of opinion diversity. Data obtained by running the model for 10 8 steps with p = 0.75 and q = 0.25 and a δ setting of 0.1. τ represents the decision threshold. σ represents opinion diversity. Shading represents level of standard error calculated for each dataset. Data interpolated utilising RStudio [22]. Plots produced via RStudio utilising code found in Appendix A.
Mathematics 09 01801 g014
Figure 15. Significant decrease in the number of P cascades occurs when public information is prioritised and selection is strong. For both cascade types, each graph represents either the number or average length of each cascade type. With strong selection and public information, significantly more cascades were recorded during simulations; however, increasing diversity of opinion has a significant impact on the number of P cascades that occurs during simulations. Data obtained by running the model for 10 8 steps with p = 0.75 and q = 0.25 and a δ setting of 0.1. τ represents the decision threshold. σ represents opinion diversity. Shading represents level of standard error calculated for each dataset. Data interpolated utilising RStudio [22]. Plots produced via RStudio utilising code found in Appendix A.
Mathematics 09 01801 g015
Publisher’s Note: MDPI stays neutral with regard to jurisdictional claims in published maps and institutional affiliations.

