Article

Thermodynamic Optimization of a High Temperature Proton Exchange Membrane Fuel Cell for Fuel Cell Vehicle Applications

College of Automobile and Traffic Engineering, Nanjing Forestry University, Nanjing 210037, China
*
Author to whom correspondence should be addressed.
Mathematics 2021, 9(15), 1792; https://doi.org/10.3390/math9151792
Submission received: 9 June 2021 / Revised: 16 July 2021 / Accepted: 20 July 2021 / Published: 28 July 2021
(This article belongs to the Special Issue Mathematical Modeling and Simulation in Mechanics and Dynamic Systems)

Abstract

:
In this paper, a finite time thermodynamic model of high temperature proton exchange membrane fuel cell (HT-PEMFC) is established, in which the irreversible losses of polarization and leakage current during the cell operation are considered. The influences of operating temperature, membrane thickness, phosphoric acid doping level, hydrogen and oxygen intake pressure on the maximum output power density P m a x and the maximum output efficiency η m a x are studied. As the temperature rises, P m a x and η m a x will increase. The decrease of membrane thickness will increase P m a x , but has little influence on the η m a x . The increase of phosphoric acid doping level can increase P m a x , but it has little effect on the η m a x . With the increase of hydrogen and oxygen intake pressure, P m a x and η m a x will be improved. This article also obtains the optimization relationship between power density and thermodynamic efficiency, and the optimization range interval of HT-PEMFC which will provide guidance for applicable use of HT-PEMFCs.

1. Introduction

With the decreasing of oil resources and the worsening of the natural environment, most countries have developed new/renewable energy systems and are trying to change their existing energy structure [1,2,3]. The proton exchange membrane fuel cell (PEMFC) has had considerable attention paid to it due to its excellent performance, including high energy conversion efficiency, low operating temperature, short start-up time, high power density and small size, etc. As a reliable power source, it has been widely used in the field of traffic engineering.
A conventional low-temperature proton exchange membrane fuel cell (LT-PEMFC) operates at 40–80 °C. Liquid water produced by the reaction affects conductivity and gas transmission, which makes the water management and gas management more complicated. In addition, the Nafion membrane at low temperature has low tolerance to CO and S. The high-temperature proton exchange membrane fuel cell (HT-PEMFC) equipped with phosphoric acid-doped polybenzimidazole membrane (PA/PBI) can increase the operating temperature to over the water boiling point (100–200 °C) and maintain high proton conductivity under high temperature operating conditions. Therefore, the corresponding water management system can be simplified greatly and the reaction rate of the cathode and anode can be improved, with a cell efficiency that is higher than LT-PEMFC [4].
In terms of modeling HT-PEMFCs, Cheddie et al. [5] established the output voltage and power density model of HT-PEMFC based on PBI membrane which considered the irreversibilities of activation polarization and ohmic polarization. The results found that the voltage loss was caused by activation polarization and ohmic polarization, and membrane conductivity and catalyst performance affected the polarization loss greatly. Hu et al. [6] presented a two-dimensional model of HT-PEMFC with PA/PBI membrane, in which the polarization loss on the cathode side was mainly considered. The mathematical model of the cathode exchange current density was established by linear sweep voltammetry (LSV) and the ohmic polarization of the cathode is estimated by electrochemical impedance spectroscopy (EIS). Numerical simulation results were in good agreement with the experimental results. Scott et al. [7,8] developed the output voltage and power model of HT-PEMFC and investigated the influence of operating temperature and operating pressure on open-circuit voltage, exchange current density and diffusion coefficient. Kim et al. [9,10] studied the influence of operating conditions on performance degradation of HT-PEMFC. The results showed that the doping level and current density had a significant effect on the durability of HT-PEMFC.
The above mathematical models consider the influence of polarization losses on cell output and degradation, but the influence of irreversibility of leakage current on cell operation is neglected. In addition, in the application of a fuel cell engine, not only the amount but also the quality of energy should be considered, so the efficiency model should be added into the model to study the overall optimization performance.
The fundamental purpose of finite time thermodynamics is to seek ultimate performance of thermodynamic processes and systems with the goal of reducing irreversibility in finite time or under the constraints of finite size [11,12,13,14,15,16]. In terms of thermodynamic optimization research of fuel cells, Watowich et al. [17] applied the optimal control theory to determine the limit of the fuel cell operation process, and the current path and optimal terminal state of the constrained cell in a limited time, so as to provide maximum output power, maximum efficiency and maximum profit. Li et al. [18] utilized finite time thermodynamics in HT-PEMFC performance analysis to investigate the effects of kinds of parameters. Although leakage current was considered, concentration potential was not contained in the reversible potential. Sieniutycz et al. [19,20] established the steady-state model of PEMFC based on finite time thermodynamics. The influence of design and operation parameters on the performance of fuel cells was analyzed, and the power limit was predicted from the perspective of thermodynamic optimization. Li et al. [21] conducted ecological analysis on LT-PEMFC and derived ecological coefficient of performance. In addition to the studies of HT-PEMFC model, lots of development was devoted to materials [22,23,24,25] and component degradation issues [26].
Firstly, aiming at the lack of irreversible factors, this paper established a thermodynamic model that considered various polarizations and leakage current. Secondly, the influences of operating temperature on P m a x and thermodynamic efficiency η m a x were studied. The influences of operating temperature, membrane thickness, phosphoric acid doping level, hydrogen and oxygen intake pressure on the optimal performance are discussed. Finally, the optimal relationship between power density and thermodynamic efficiency is analyzed, and the optimal interval of power density and thermodynamic efficiency is obtained.

2. Thermodynamic Model

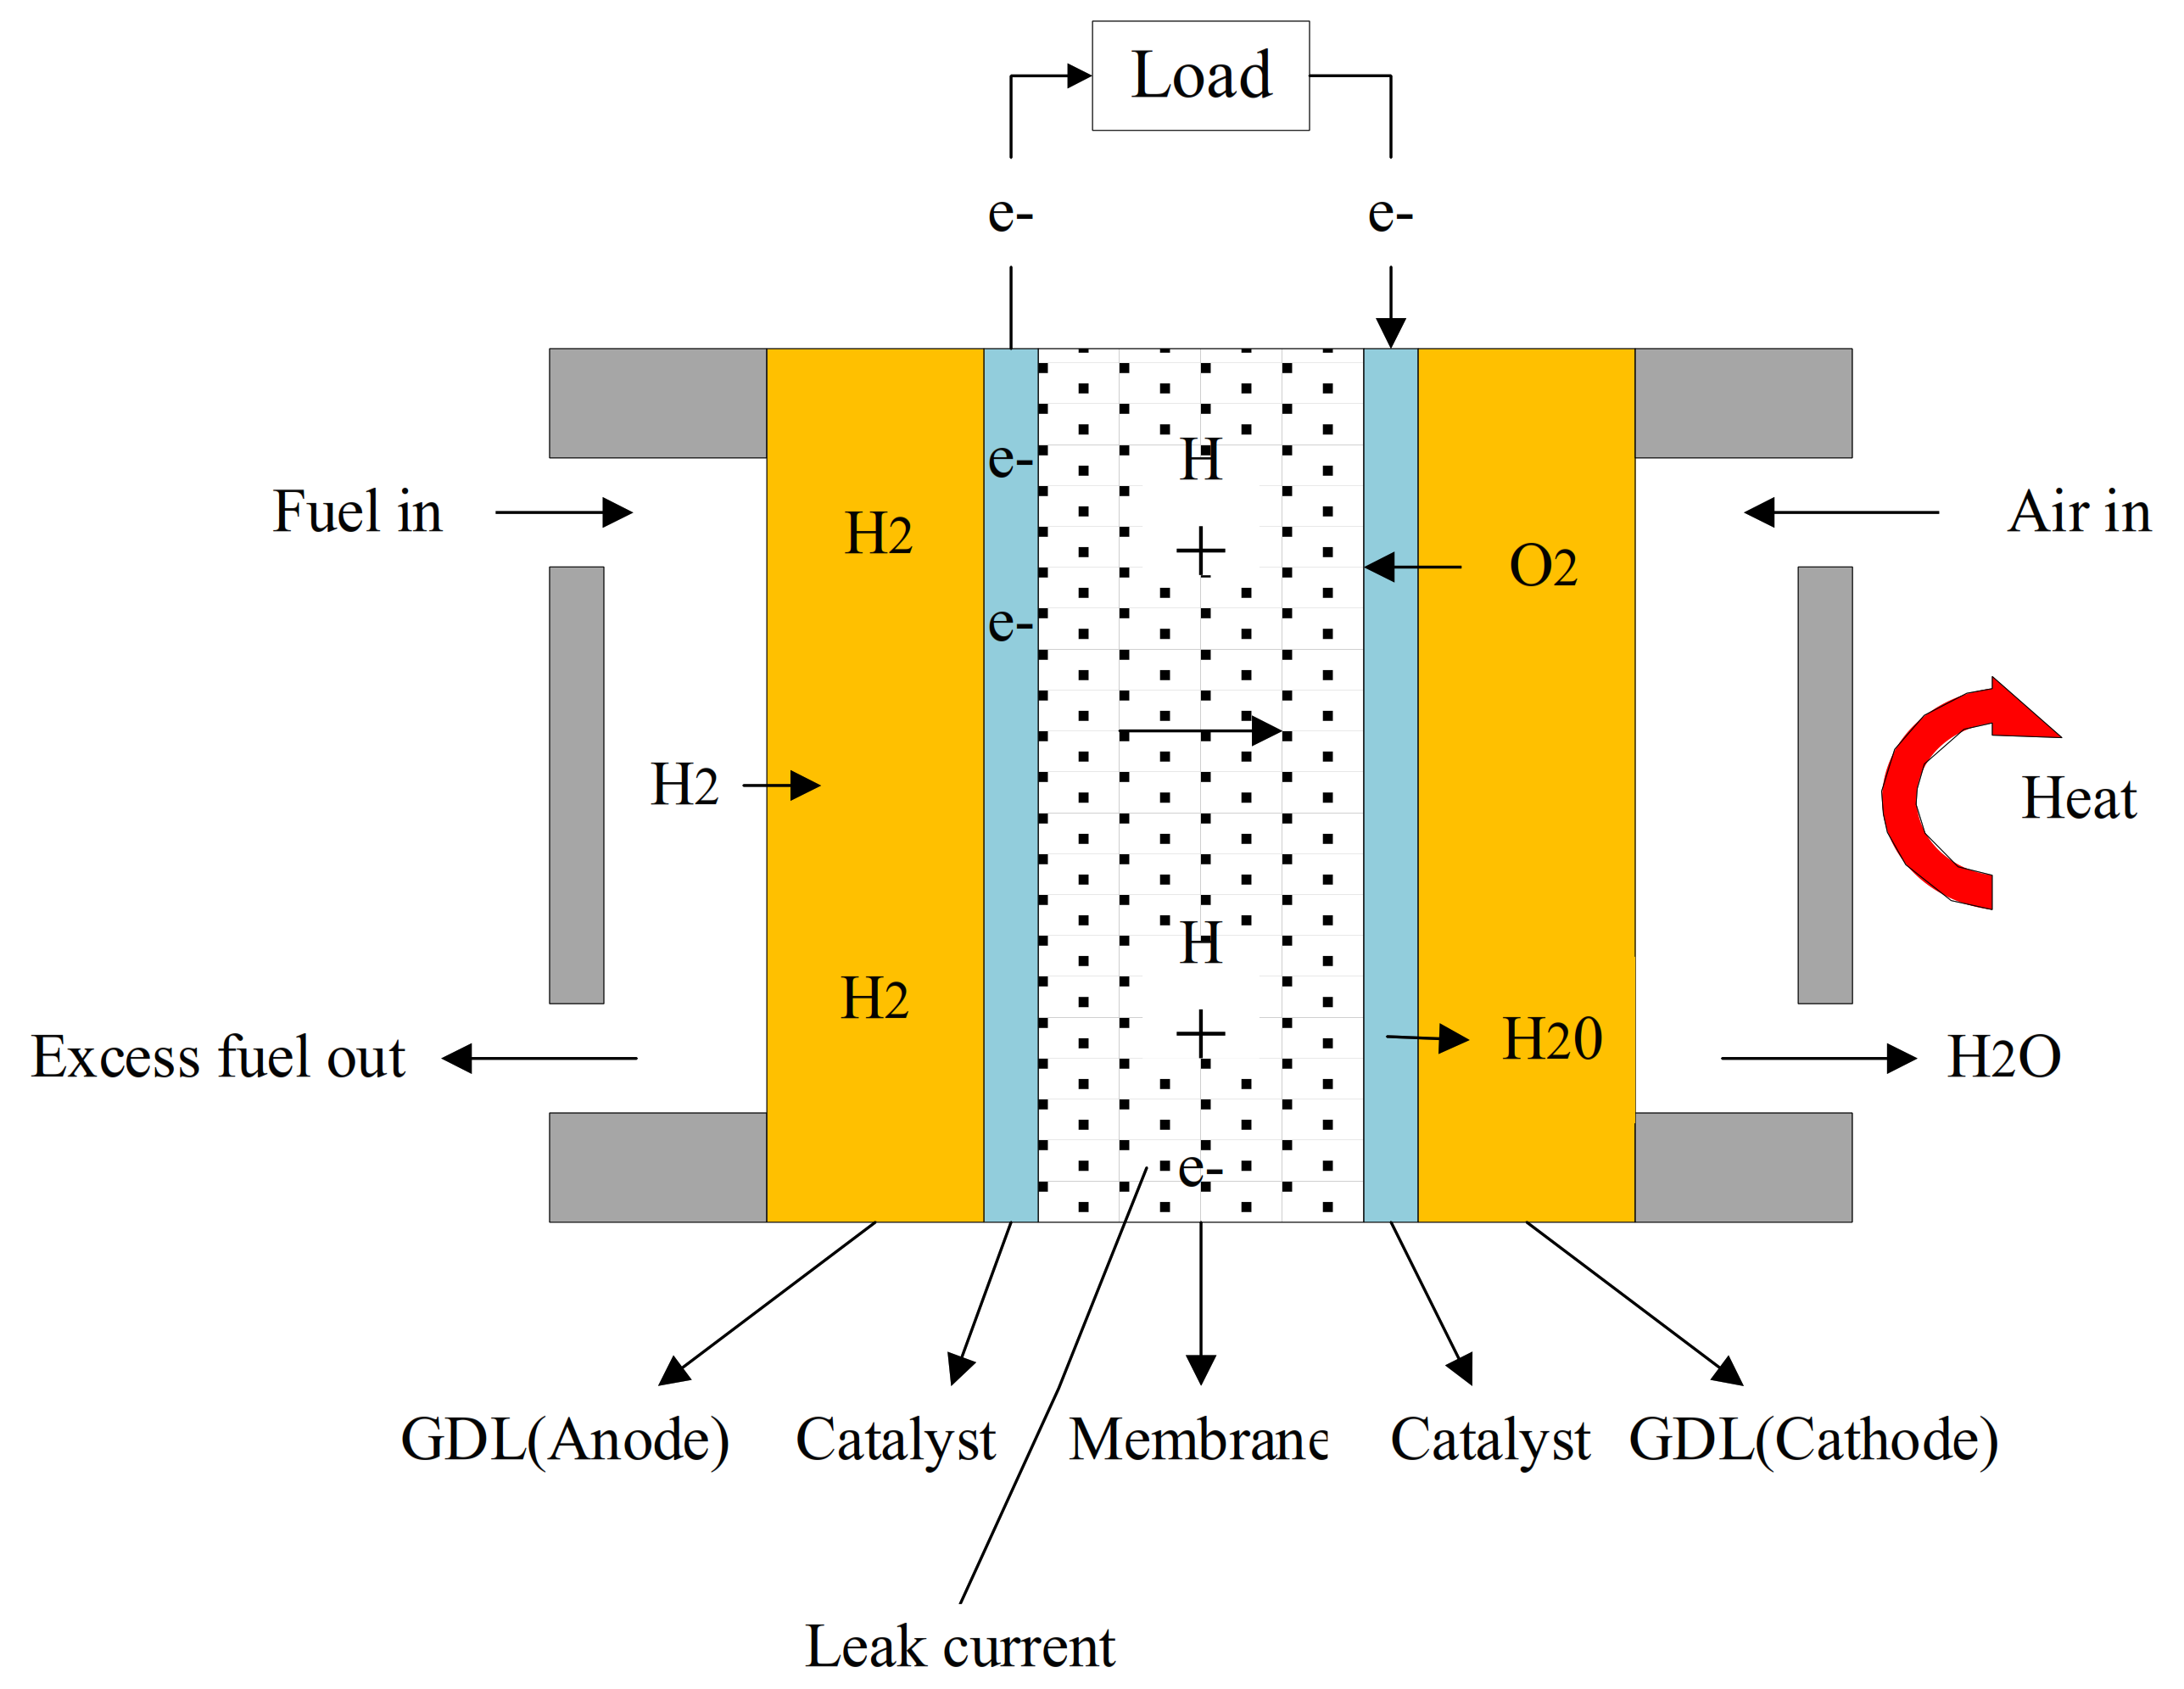
2.1. Internal Processess of HT-PEMFC

As shown in Figure 1, HT-PEMFC converts chemical energy into electrical energy through electrochemical reaction of hydrogen and oxygen.
The mass transfer mechanism of HT-PEMFC is much different from LT-PEMFC. LT-PEMFC basically uses the Nafion membrane and the proton transport carrier sulfonic acid functional group can separate hydrogen ions and form hydronium ions with water molecules under humidified conditions; while in HT-PEMFCs, phosphoric acid replaces the humidified water and chemical reaction and mass transfer are based on a so-called Grotthuss mechanism. The chemical reaction and mass transfer within the anode, the cathode and the membrane can be expressed as Equations (1)–(3):
Anode : H 2 PO 4 + H + = H 3 PO 4
Membrane : H 3 PO 4 + PBI = H 2 PO 4 + PBI · H +
  Cathode : PBI · H + = PBI + H +
When supplying hydrogen to the anode and oxygen to the cathode, hydrogen atoms are separated into hydrogen ions and electrons under the action of anodic catalyst. Hydrogen ions pass through proton exchange membrane and electrons flow to the cathode through the external circuit load; hydrogen ions combine with oxygen atoms and electrons at the cathode to form water molecules at relative higher temperatures over water boiling point. Therefore, water molecules are discharged in the gas phase avoiding water management systems like LT-PEMFCs. The total electrochemical reaction of HT-PEMFC can be formulated as Equations (4)–(6):
Anode   reaction : H 2 2 H + + 2 e
Cathodic   reaction : 2 H + + 1 2 O 2 + 2 e H 2 O gas + heat
Total   reaction : H 2 + 1 2 O 2 H 2 O gas + heat + electricity

2.2. Reversible Output Voltage of HT-PEMFC

For HT-PEMFC, the reversible output voltage can be written as Equation (7),
E r = E r 0 + Δ S n F T T 0 + R T n F ln ( p H 2 p O 2 0.5 p w )
where, E r is obtained under isothermal conditions; E r 0 [18] is the reference standard voltage at ambient temperature and pressure (298.15 K, 1 atm), and its value is 1.185 V; Δ S is the change of standard molar entropy, T is operating temperature of the HT-PEMFC, T 0 is the ambient temperature, R is the gas constant, p H 2 is the intake pressure of hydrogen, p O 2 is the intake pressure of oxygen, and p w is the pressure of discharging water vapor.
The entropy change is related to the operating temperature, Equation (8) [27]:
Δ S n = 18.449 0.01283 T

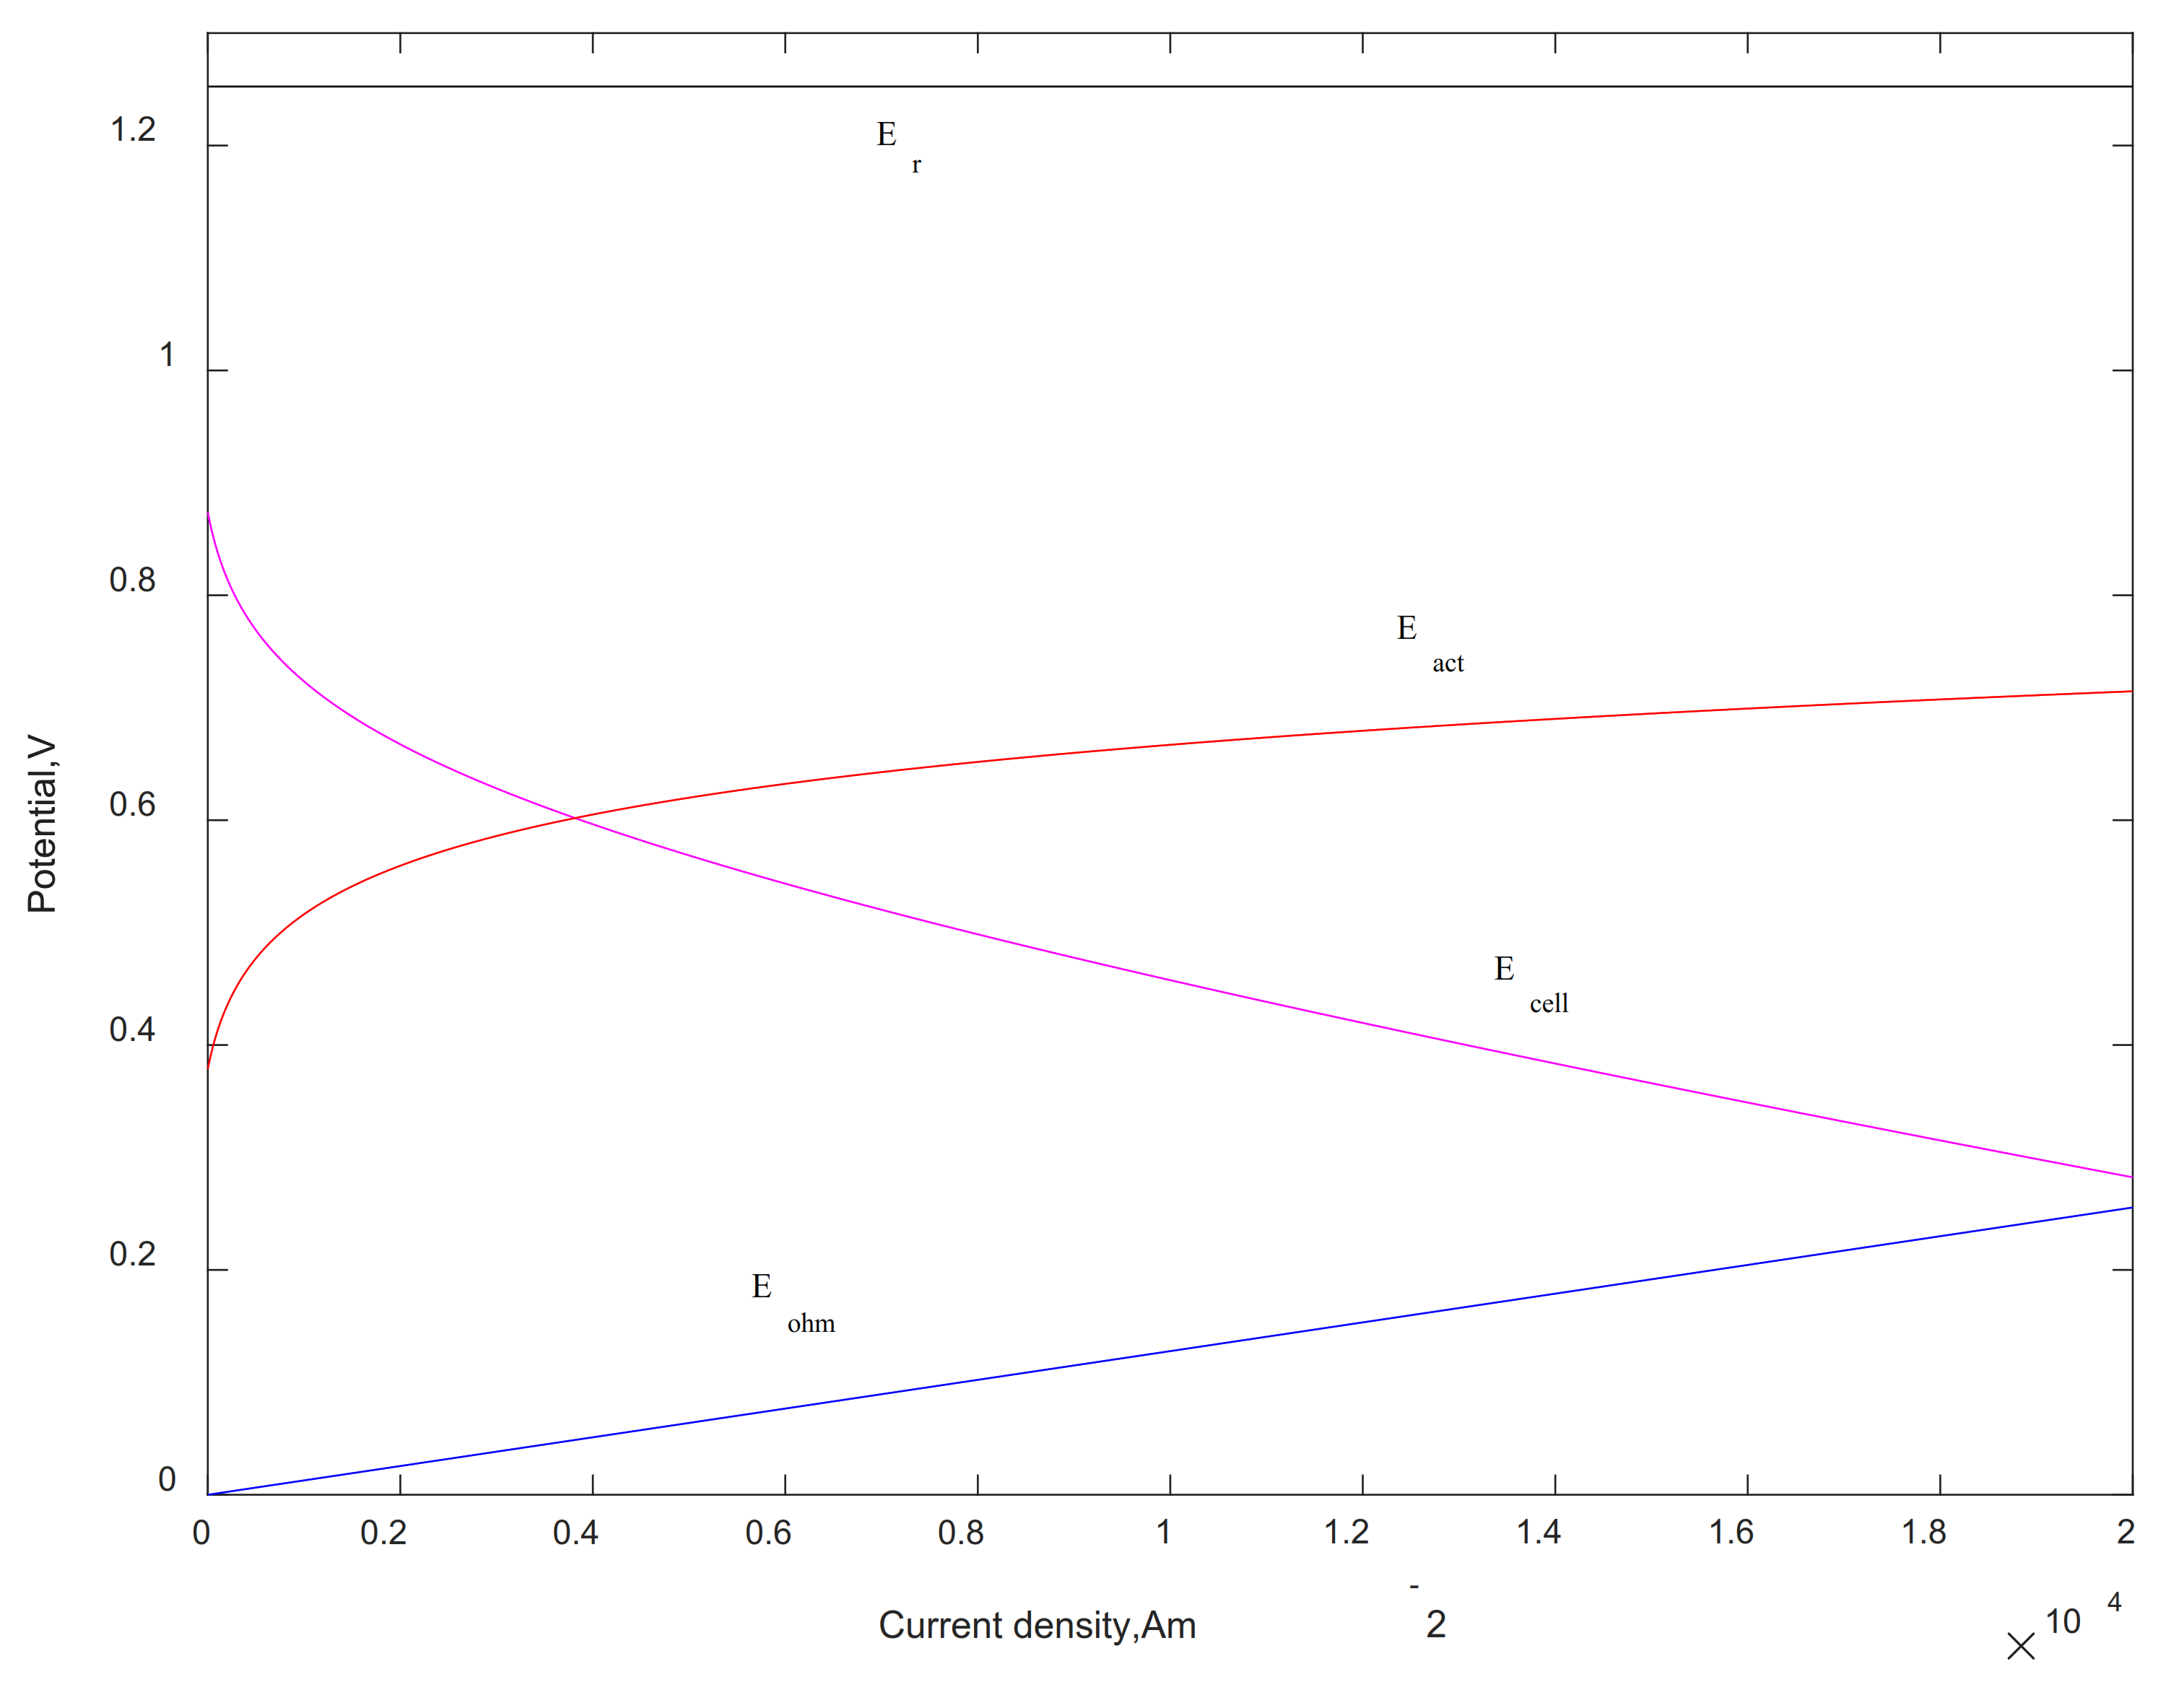
2.3. Irreversible Loss of HT-PEMFC

2.3.1. Polarization Phenomenon

For a single electrode, the electrode potential with no current passing through is the equilibrium potential ( E r ), and the electrode potential with current passing through is E c e l l . In general, E c e l l < E r , the absolute value of electrode potential difference ( | E r E c e l l | ) is overpotential.
The activation overpotential can be written as Equation (9) [5,28]:
E a c t = R T 2 α F ln ( I + I l e a k I 0 )
where, I is current density, I 0 is exchange current density, I l e a k is leakage current density, α is transfer coefficient, E a c t is activation overpotential. Exchange current density can be expressed as Equation (10) [7]:
l n ( I 0 ) = 2.2266 × 1000 T 0.4959
Ohmic overpotential can be calculated as the following Equation (11) [27]:
E o h m = I l m K m + 2 l d σ d e f f
where, l m is membrane thickness, K m is proton conductivity in the membrane phase, l d is thickness of diffusion layer, σ d e f f is electron conductivity. The proton conductivity can be presented as Equation (12) [8]:
K m = 100 T e x p 8.0219 2605.6 70.1 X T
where, X is the doping level of phosphoric acid of the proton exchange membrane.
If the reactant gas or oxidant is not supplied in time, the electrode surface cannot maintain the reactant concentration, and concentration polarization will occur. In HT-PEMFC, the value of the concentration overpotential is already included in the reversible potential.

2.3.2. Leakage Current

Theoretically, the electrolyte is an ionic conductor and has no electron transport. However, in actual operation, some hydrogen and electrons will diffuse from the anode to the cathode through the electrolyte, and a small number of electrons will flow outward through the proton membrane. Such leakage current includes internal current and cross current [29]. Therefore, the total current density generated by the fuel cell is equal to the sum of the output current density and leakage current density,
I g r o s s = I + I l e a k
where I g r o s s represents the total current density generated on the fuel cell electrode, I is the working current density that can be measured through the external load, and I l e a k represents the leakage current density.
Haji [30] found that the leakage current increased with the rise of operating temperature and concluded that leakage current density and operating temperature met the functional relationship:
l n I l e a k = ( 2342.9 1 T + 9.0877 ) × ln 10

2.4. Irreversible Output Voltage

The irreversible output voltage of HT-PEMFC can be expressed as Equation (15),
E c e l l = E r E a c t E o h m E c o n = 1.185 1.91 × 10 4 + 1.33 × 10 7 T T 298.15 + 4.13 × 10 5 T ln P H 2 P O 2 0.5 0.0243 1.72 × 10 5 T ln I + 88458.17 e x p 2342.9 T 3.95 × 10 6 T 3 0.00424 T 2 + 1.523 183 + I l m T 304696.11 e x p 70.1 X 2605.6 T

2.5. Power Density and Efficiency of HT-PEMFC

The power density [31] of HT-PEMFC can be expressed as Equation (16),
P = E c e l l · I = ( E r E a c t E o h m E c o n ) · I                                                                                                                            = 1.185 1.91 × 10 4 + 1.33 × 10 7 T T 298.15 + 4.13            × 10 5 T ln P H 2 P O 2 0.5 0.0243                                                                                                                                                      1.72 × 10 5 T ln I + 88458.17 e x p 2342.9 T 3.95 × 10 6 T 3 0.00424 T 2 + 1.523 183                                                                                                  + I l m T 304696.11 e x p 70.1 X 2605.6 T I × 10 3
The total energy absorbed from hydrogen and oxygen is enthalpy of reaction [32],
Δ H = k d e n k d t h k T j d e n j d t h j T = I n F Δ h T
where Δ h T is molar enthalpy at temperature T, j is component of the reactants, k is component of the products in the reaction.
For the energy conversion device, the basic definition of thermodynamic efficiency is the ratio of actual useful work to the total energy input [33]. Therefore, thermodynamic efficiency of HT-PEMFC can be expressed as Equation (18),
η = P Δ H = E r E a c t E o h m · I Δ H                                                                                                                                                                                                                   = 192970 × 1.185 1.91 × 10 4 + 1.33 × 10 7 T T 298.15         + 4.13                                                             × 10 5 T ln P H 2 P O 2 0.5 0.0243       1.72                                                                                                                                                                           × 10 5 T ln I + 88458.17 e x p 2342.9 T 3.95 × 10 6 T 3 0.00424 T 2 + 1.523 183                                                                                                                                                                         + I l m T 304696.11 e x p 70.1 X 2605.6 T I × 10 3 / · h T

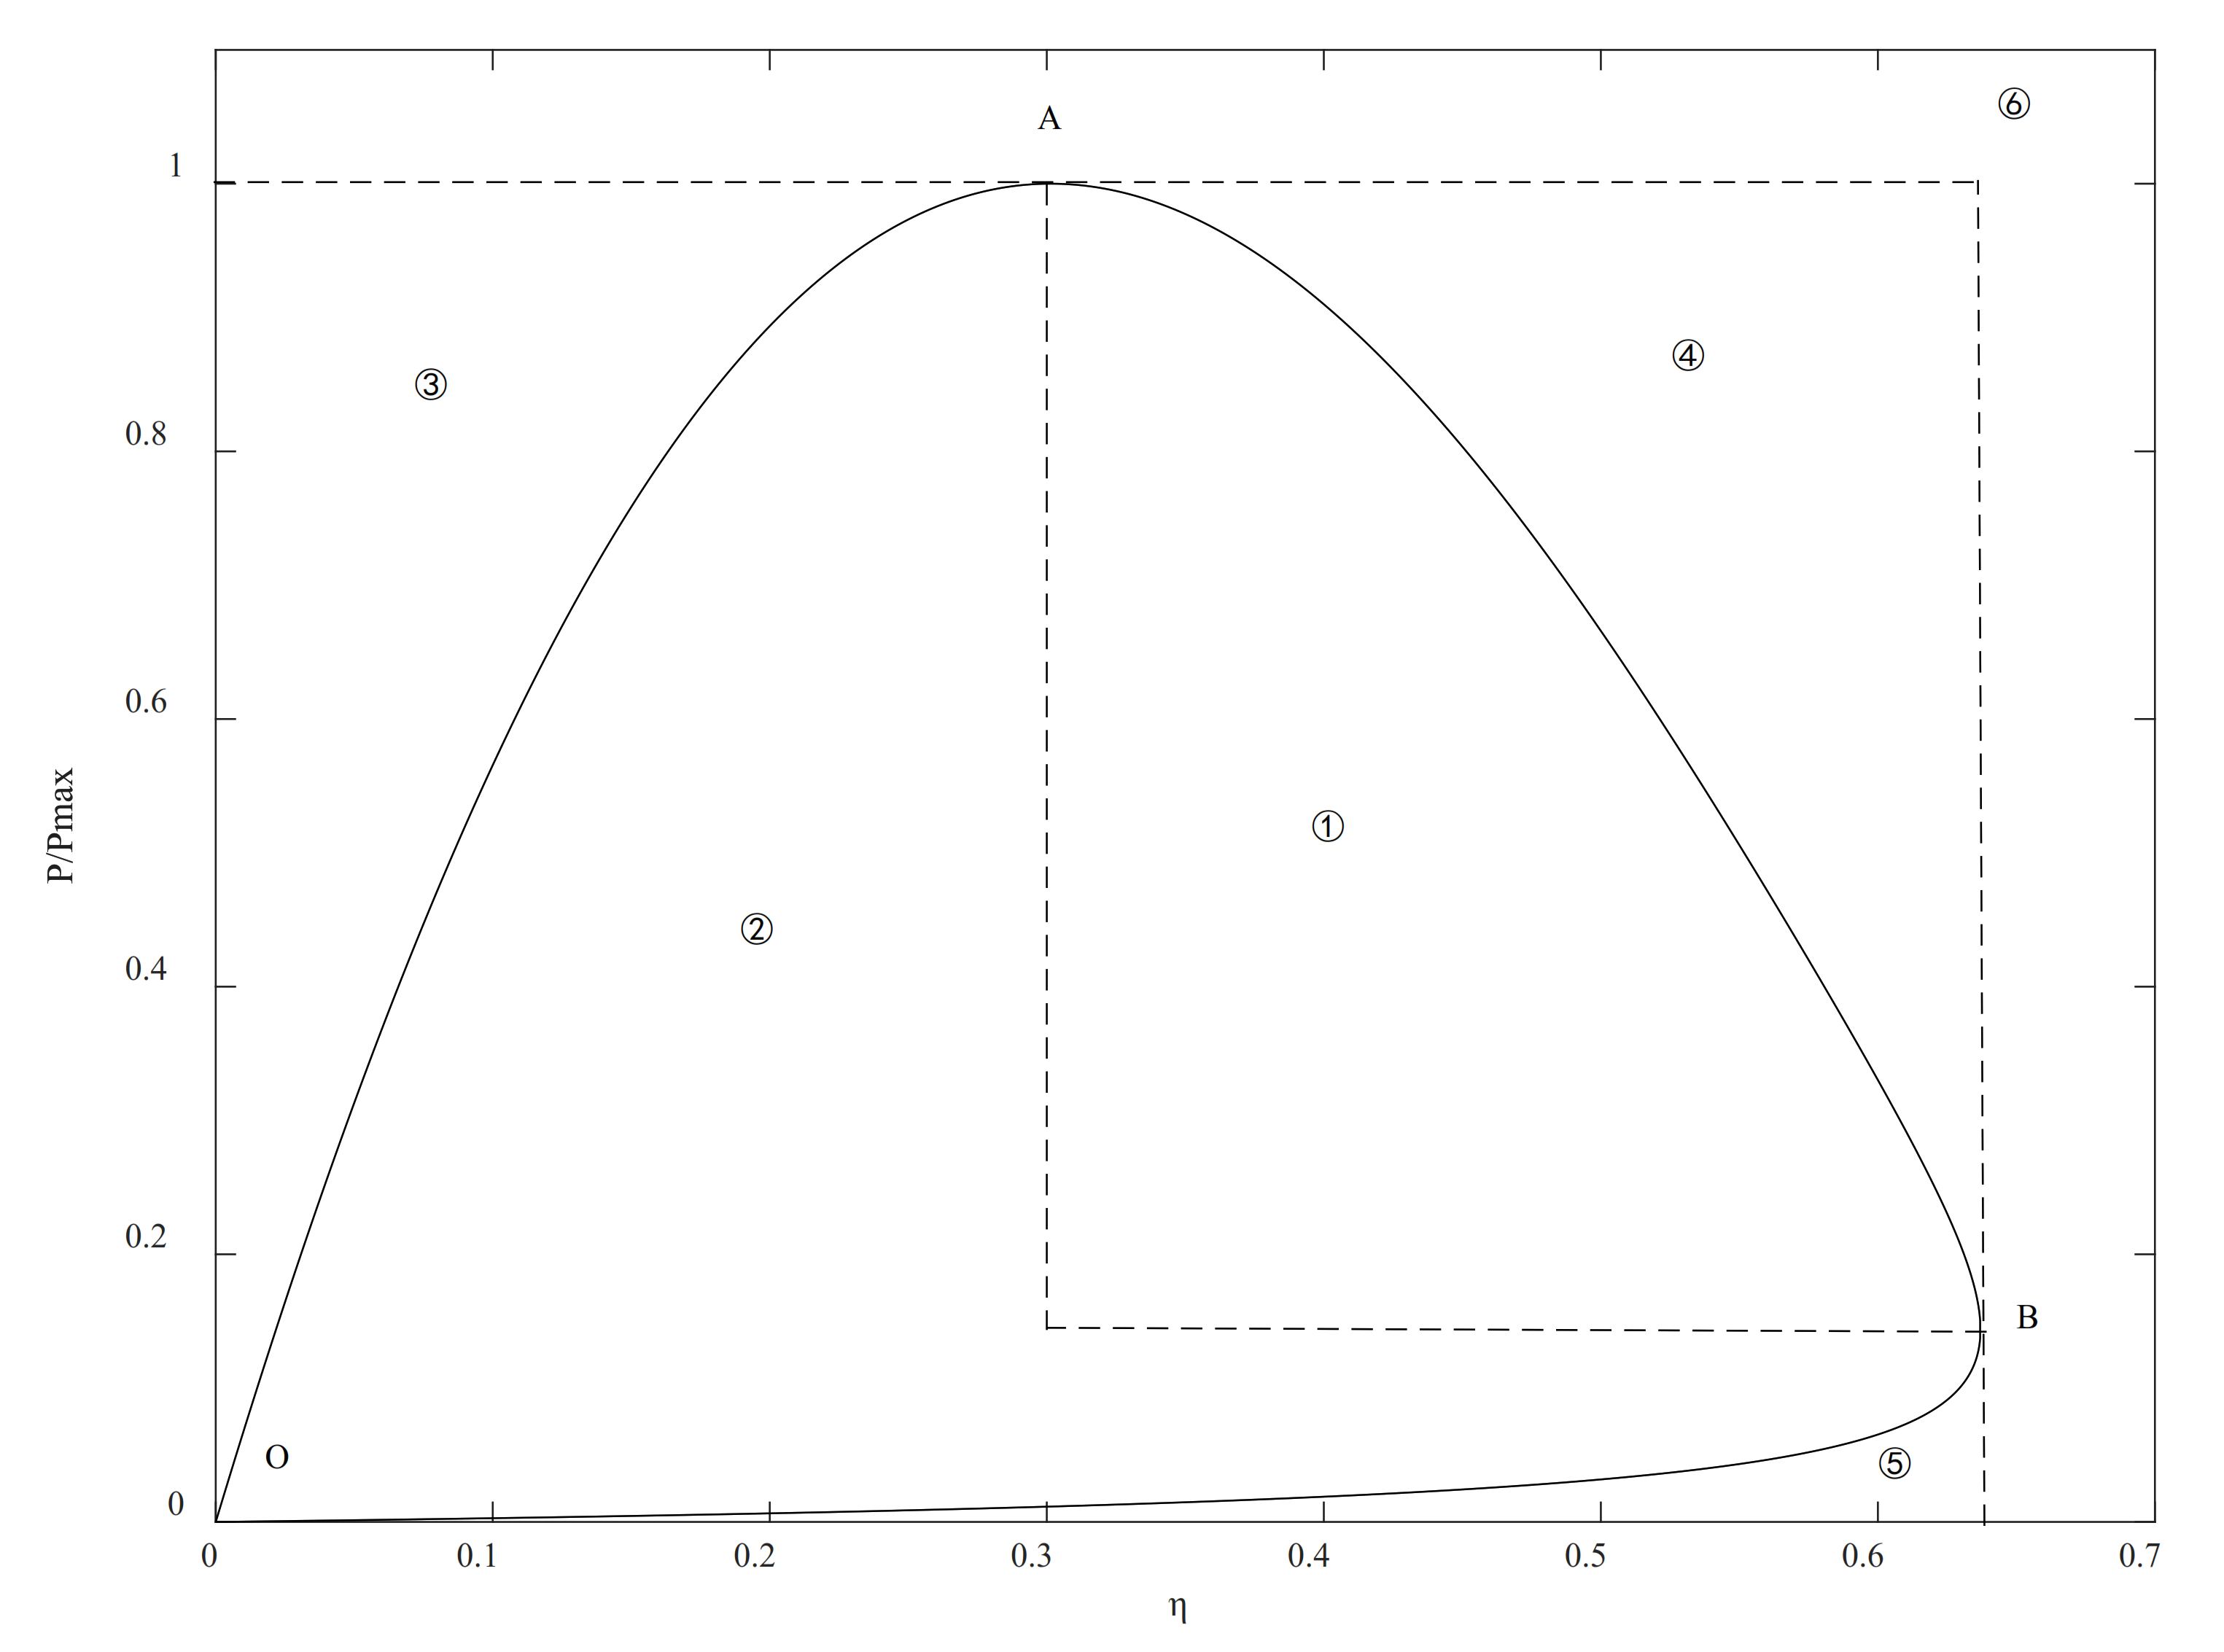
2.6. Thermodynamic Optimization

For HT-PEMFC, P is related to I , T , l m , p H 2 , p O 2 and X , so P can be expressed as Equation (19) [34,35,36,37]:
P = f ( I , T , l m , p H 2 , p O 2 , X )
When the membrane thickness ( l m ), hydrogen intake pressure ( p H 2 ), oxygen intake pressure ( p O 2 ) and membrane acid doping level ( X ) are determined, the power density ( P ) is only related to current density ( I ) and cell operating temperature ( T ), so P can be expressed as Equation (20):
P = g ( I , T )
In Equation (22), when T = T 1 , the power density ( P ) is only related to the current density ( I ), the maximum power density P m a x ( P 1 ) is obtained; when T = T 2 , the power density ( P ) is only related to the current density ( I ), the maximum power density P m a x ( P 2 ) is obtained. By analogy, when T = T n , the maximum power density P m a x ( P n ) can be obtained. And the relationship between P m a x and T can be acquired.
Similarly, when operating temperature T , film thickness l m , oxygen intake pressure p O 2 , and film acid doping level X are determined, the corresponding curve between P m a x and p H 2 can be obtained.
When the operating temperature T , film thickness l m , hydrogen intake pressure p H 2 and film acid doping level X are determined, the corresponding curve between P m a x and p O 2 can be obtained.
Similarly, thermodynamic efficiency ( η ) is related to current density ( I ), cell operating temperature ( T ), membrane thickness ( l m ), hydrogen intake pressure ( p H 2 ), oxygen intake pressure ( p O 2 ) and membrane acid doping level ( X ), so it can be expressed as formula (21):
η = h ( I , T , l m , p H 2 , p O 2 , X )
When the membrane thickness ( l m ), hydrogen intake pressure ( p H 2 ), oxygen intake pressure ( p O 2 ) and membrane acid doping level ( X ) are determined, the thermodynamic efficiency ( η ) is only related to current density ( I ) and cell operating temperature ( T ), so η can be expressed as Equation (22):
η = j ( I , T )
In Equation (22), when T = T 1 , the thermodynamic efficiency ( η ) is only related to the current density ( I ), the maximum thermodynamic efficiency η m a x ( η 1 ) is received; when T = T 2 , the thermodynamic efficiency ( η ) is only related to the current density ( I ), the maximum thermodynamic efficiency η m a x ( η 2 ) is received. By analogy, when T = T n , the maximum thermodynamic efficiency η m a x ( η n ) can be obtained. And the relationship between η m a x and T can be acquired.
Similarly, when operating temperature T , film thickness l m , oxygen intake pressure p O 2 , and film acid doping level X are determined, the corresponding curve between η m a x and p H 2 can be obtained.
When the operating temperature T , film thickness l m , hydrogen intake pressure p H 2 and film acid doping level X are determined, the corresponding curve between η m a x and p O 2 can be obtained.

3. Results and Discussion

The relevant parameters in the HT-PEMFC model are shown in Table 1.
As shown in Table 1, some parameters referenced in this paper are from the literature [27,38]. The choice of any type of fuel cell as the vehicle power is mainly based on the application scenario of the vehicle and the demand of the power plant. Power density, dynamic response, output efficiency, durability and life, fuel form, emission and other aspects are selected as key indicators for passenger vehicles. PEMFC is superior to other fuel cells in terms of efficiency, dynamic response, durability and life, fuel form and emission.

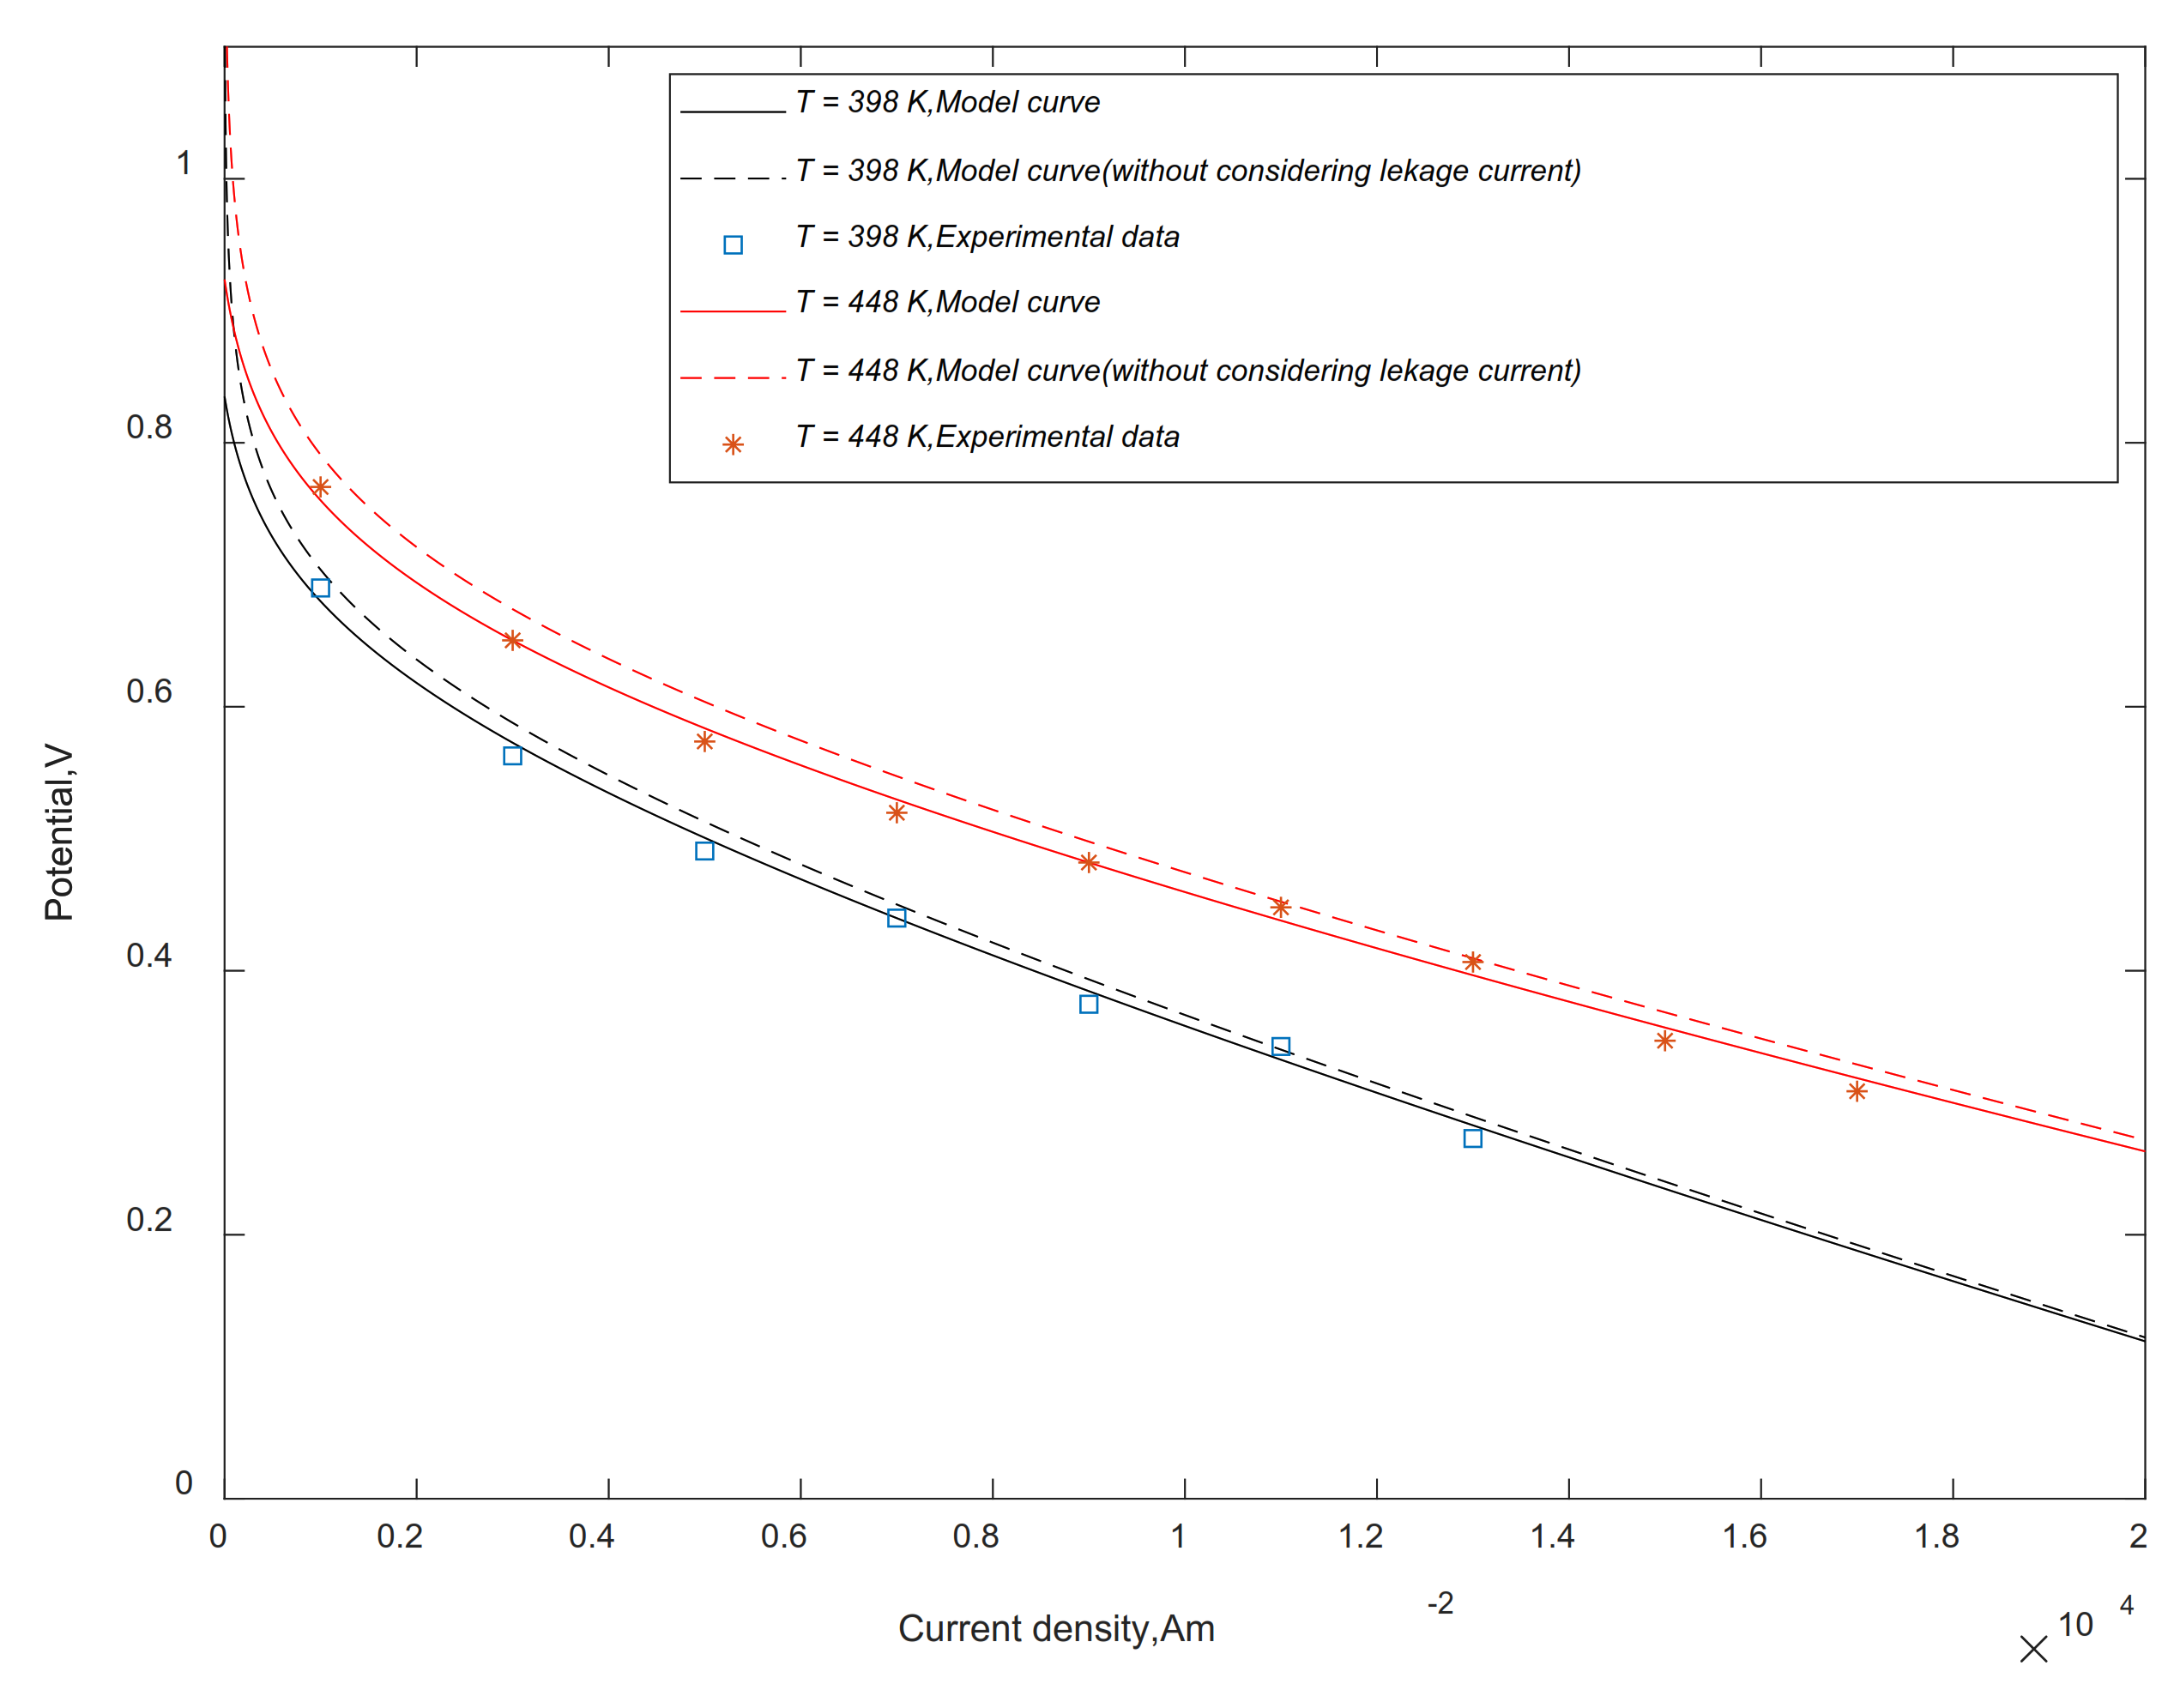
3.1. Model Validation

Figure 2 compares model Formula (15) prediction and experimental data at 398 K and 448 K ( l m = 20   μ m ;   X = 6 ;   p H 2 = 1   atm ;   p O 2 = 1   atm ). The experimental studies in the literature [8] and model studies in the literature [27,38] are both based on HT-PEMFC equipped with PA/PBI membrane and have the same specifications. The results show that the curve predicted by the cell output voltage model has a good agreement with the experimental data. When leakage current is not considered in the model, the output voltage is significantly higher than that predicted by the model, especially in the low current density region. This is mainly because leakage current mainly affects the activation polarization, as shown in Figure 3, the activation polarization potential changes most significantly in the low current density region.
Figure 3 shows the variation curve of reversible voltage, polarized overpotential and irreversible output voltage versus current density of HT-PEMFC. It can be seen that the reversible voltage is a constant independent of current density. The activation overpotential and ohm overpotential increase with the increase of current density, and the activation overpotential changes greatly in the area of low current density. The irreversible output voltage decreases as the current density increases.

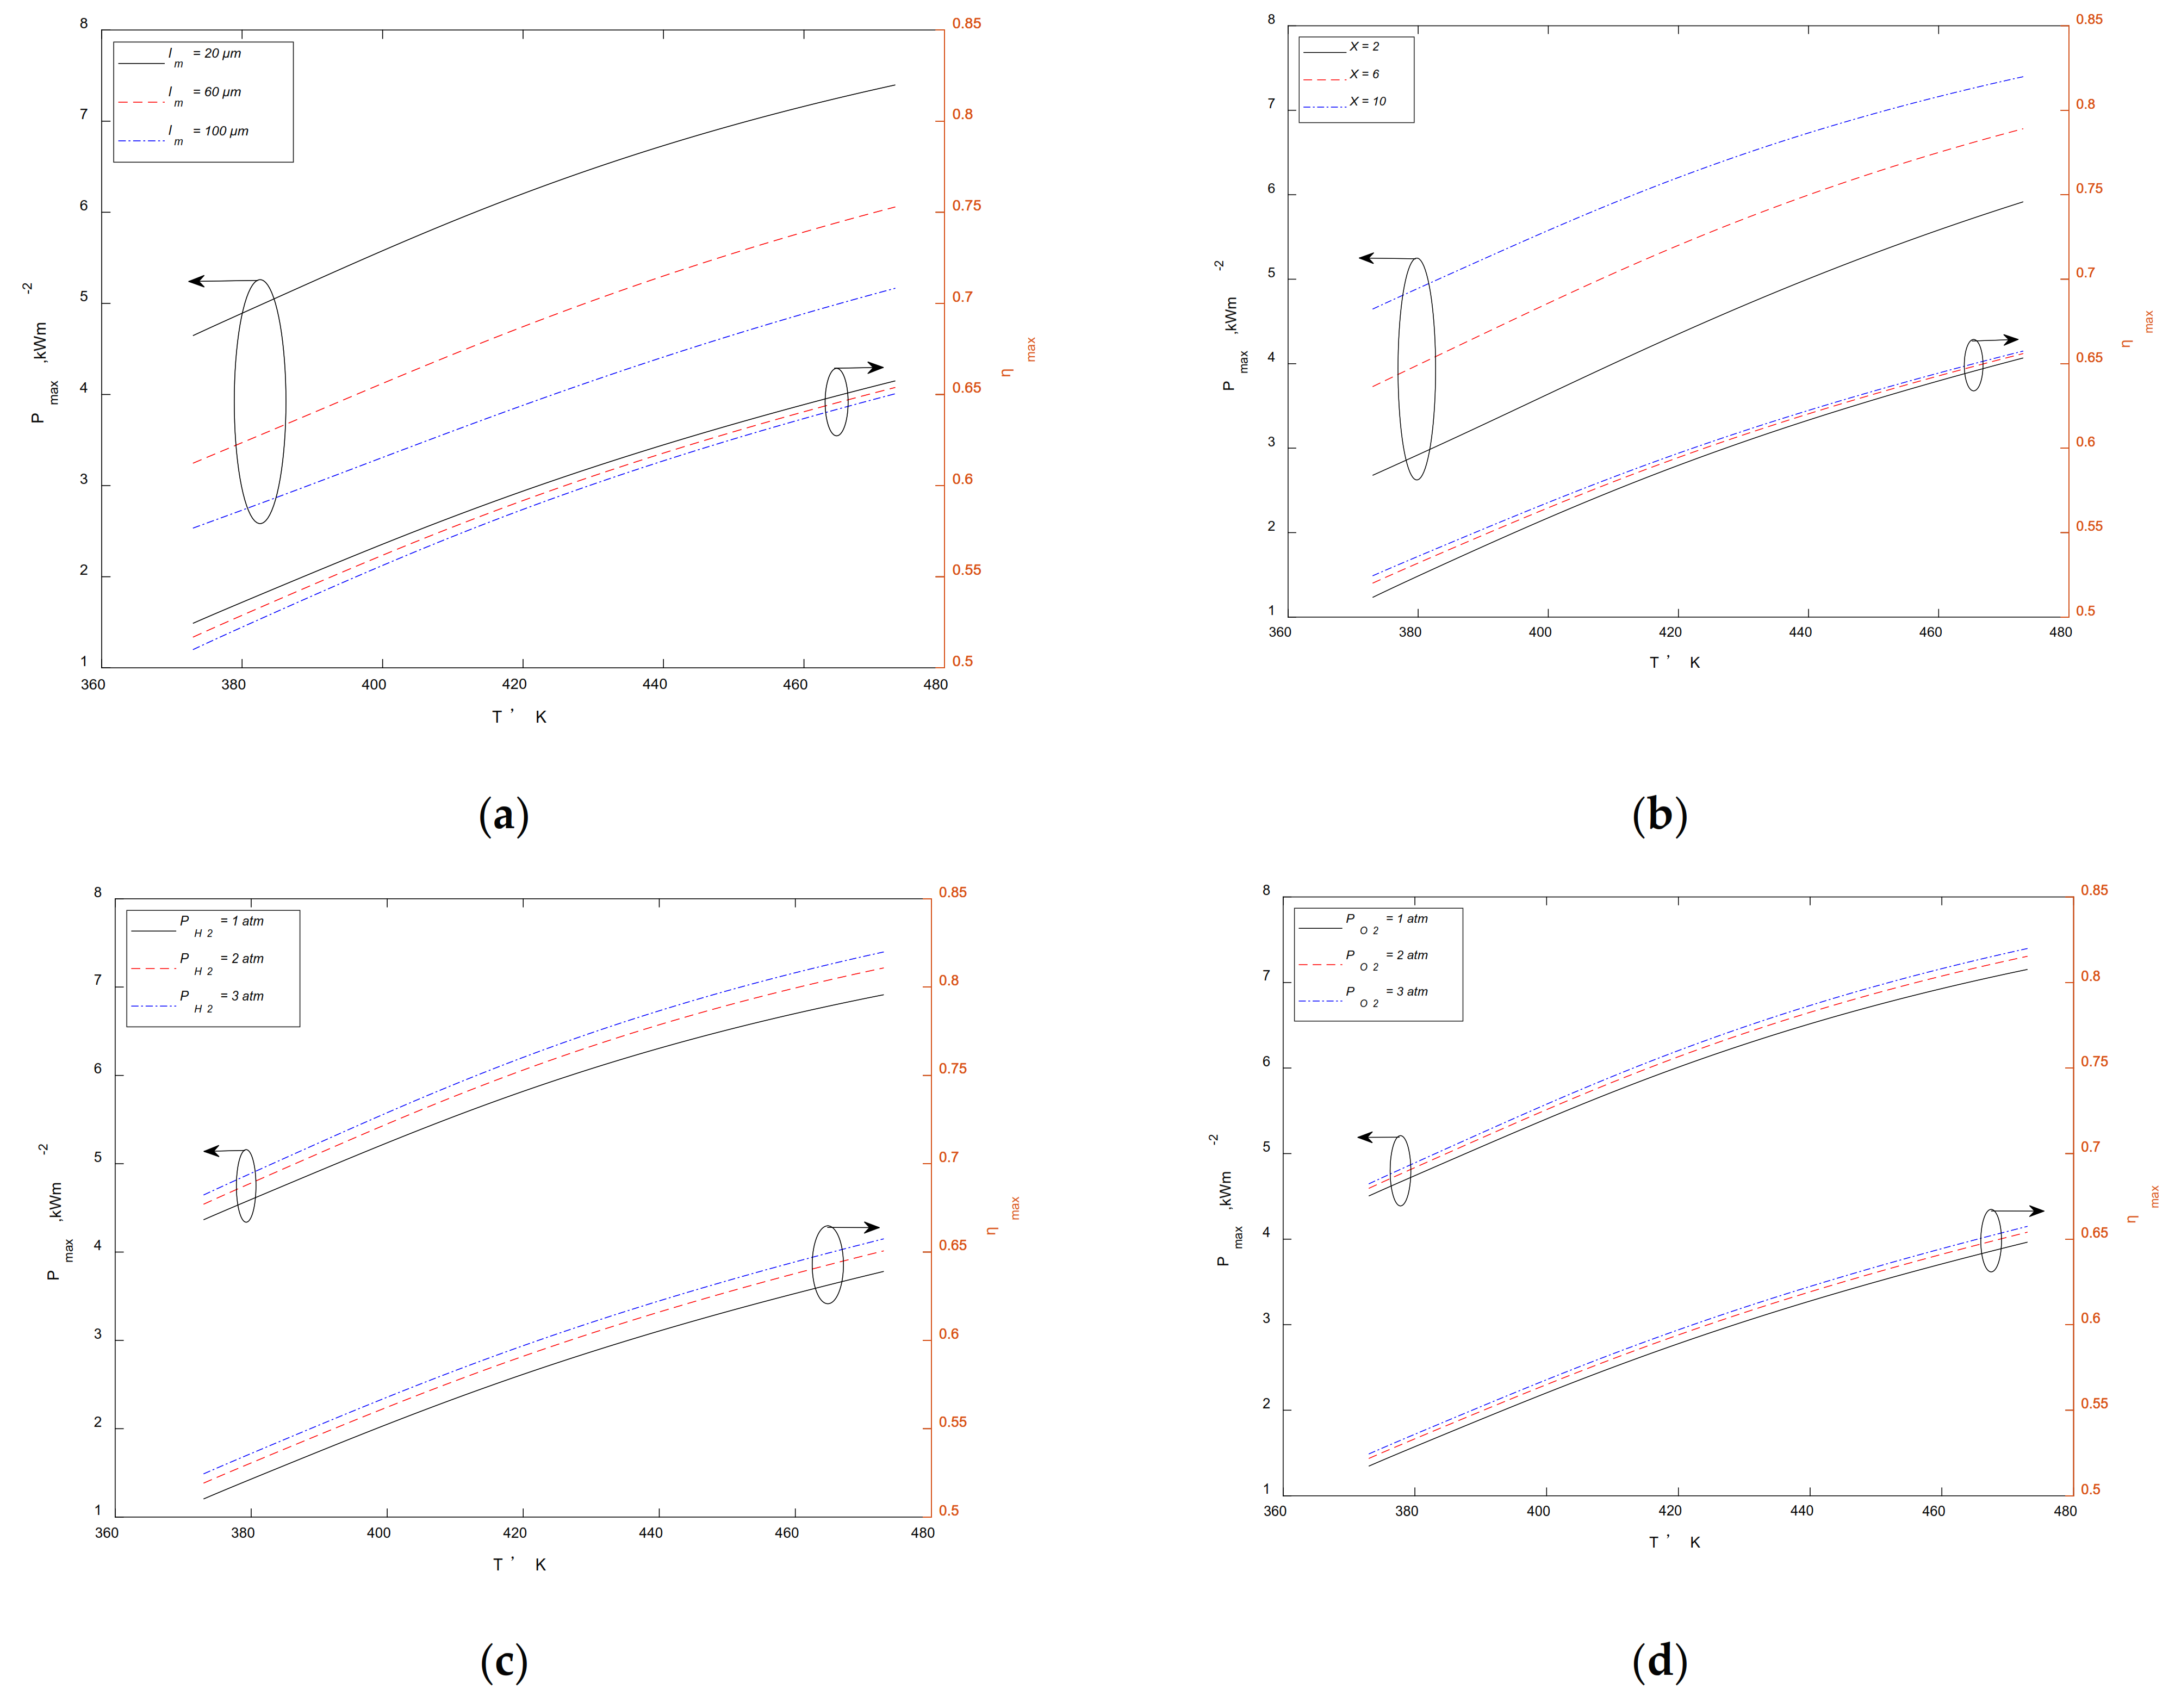
3.2. Maximum Output Performance at a Given Temperature

Figure 4 reflects the influence of operating temperature on P m a x and η m a x of HT-PEMFC. As can be seen from the figures, P m a x and η m a x raise with the increase of temperature. From the perspective of electrochemical kinetics, the increase of operating temperature enhances the proton conductivity of the membrane and reduces the electrochemical polarization of the HT-PEMFC. Moreover, the increase of operating temperature can improve the exchange current density and reduce the activation overpotential, so P m a x and η m a x will be boosted.
Figure 4a shows the impact of operating temperature on P m a x and η m a x of HT-PEMFC under different l m . It can be seen that with the decrease of proton membrane thickness, P m a x and η m a x will increase. If the thickness of proton membrane is reduced, the barrier of ions passing through proton membrane and the ohmic overpotential decrease. Therefore, P m a x and η m a x will be improved. When the temperature is 433 K, P m a x increases by 50% and the η m a x raises by 1.8% under the change of membrane thickness, which indicates that the membrane thickness has little influence on η m a x . The reduction of membrane thickness can improve the performance, but fuel penetration, short circuit and other problems always limit the thickness.
Figure 4b reveals the effect of operating temperature on P m a x and η m a x of HT-PEMFC under different X . It is obvious that with the increase of the acid doping level of the membrane, P m a x and η m a x will improve, and the variation range of the low temperature zone is greater than that of the high temperature zone. The doping level directly affects the proton conductivity of the membrane. The increase of doping level enhances the proton conductivity of the membrane, thus reducing ohmic overpotential. Therefore, P m a x and η m a x will be improved. When the temperature is 373 K, P m a x increases by 84% under the change of doping level; while when the temperature is 473 K, P m a x improves by 52% under the change of doping level. When the temperature is 433 K, the η m a x raises by 0.8% under the change of acid doping level. This indicates that doping level has little effect on η m a x .
Figure 4c displays the influence of operating temperature on P m a x and η m a x of HT-PEMFC under different p H 2 . Obviously, with the increase of hydrogen intake pressure, P m a x and η m a x will improve. The increase in pressure, on the one hand, increases the diffusion rate of the gas and improves the mass transfer of the reaction gas, which increases the reversible electromotive force of the HT-PEMFC; on the other hand, it increases the gas concentration and reduces the effect of concentration polarization on the reversible electromotive force. At the temperature of 433 K, P m a x boosts by 12.5% and the η m a x enhanced by 4.5% under the influence of hydrogen intake pressure.
Figure 4d shows the effect of operating temperature on P m a x and η m a x of HT-PEMFC under different p O 2 . It can be seen that with the increase of oxygen intake pressure, P m a x and η m a x will increase. At the temperature of 433 K, P m a x and the η m a x raises by 6.7% and 2.9% respectively under the change of oxygen intake pressure.

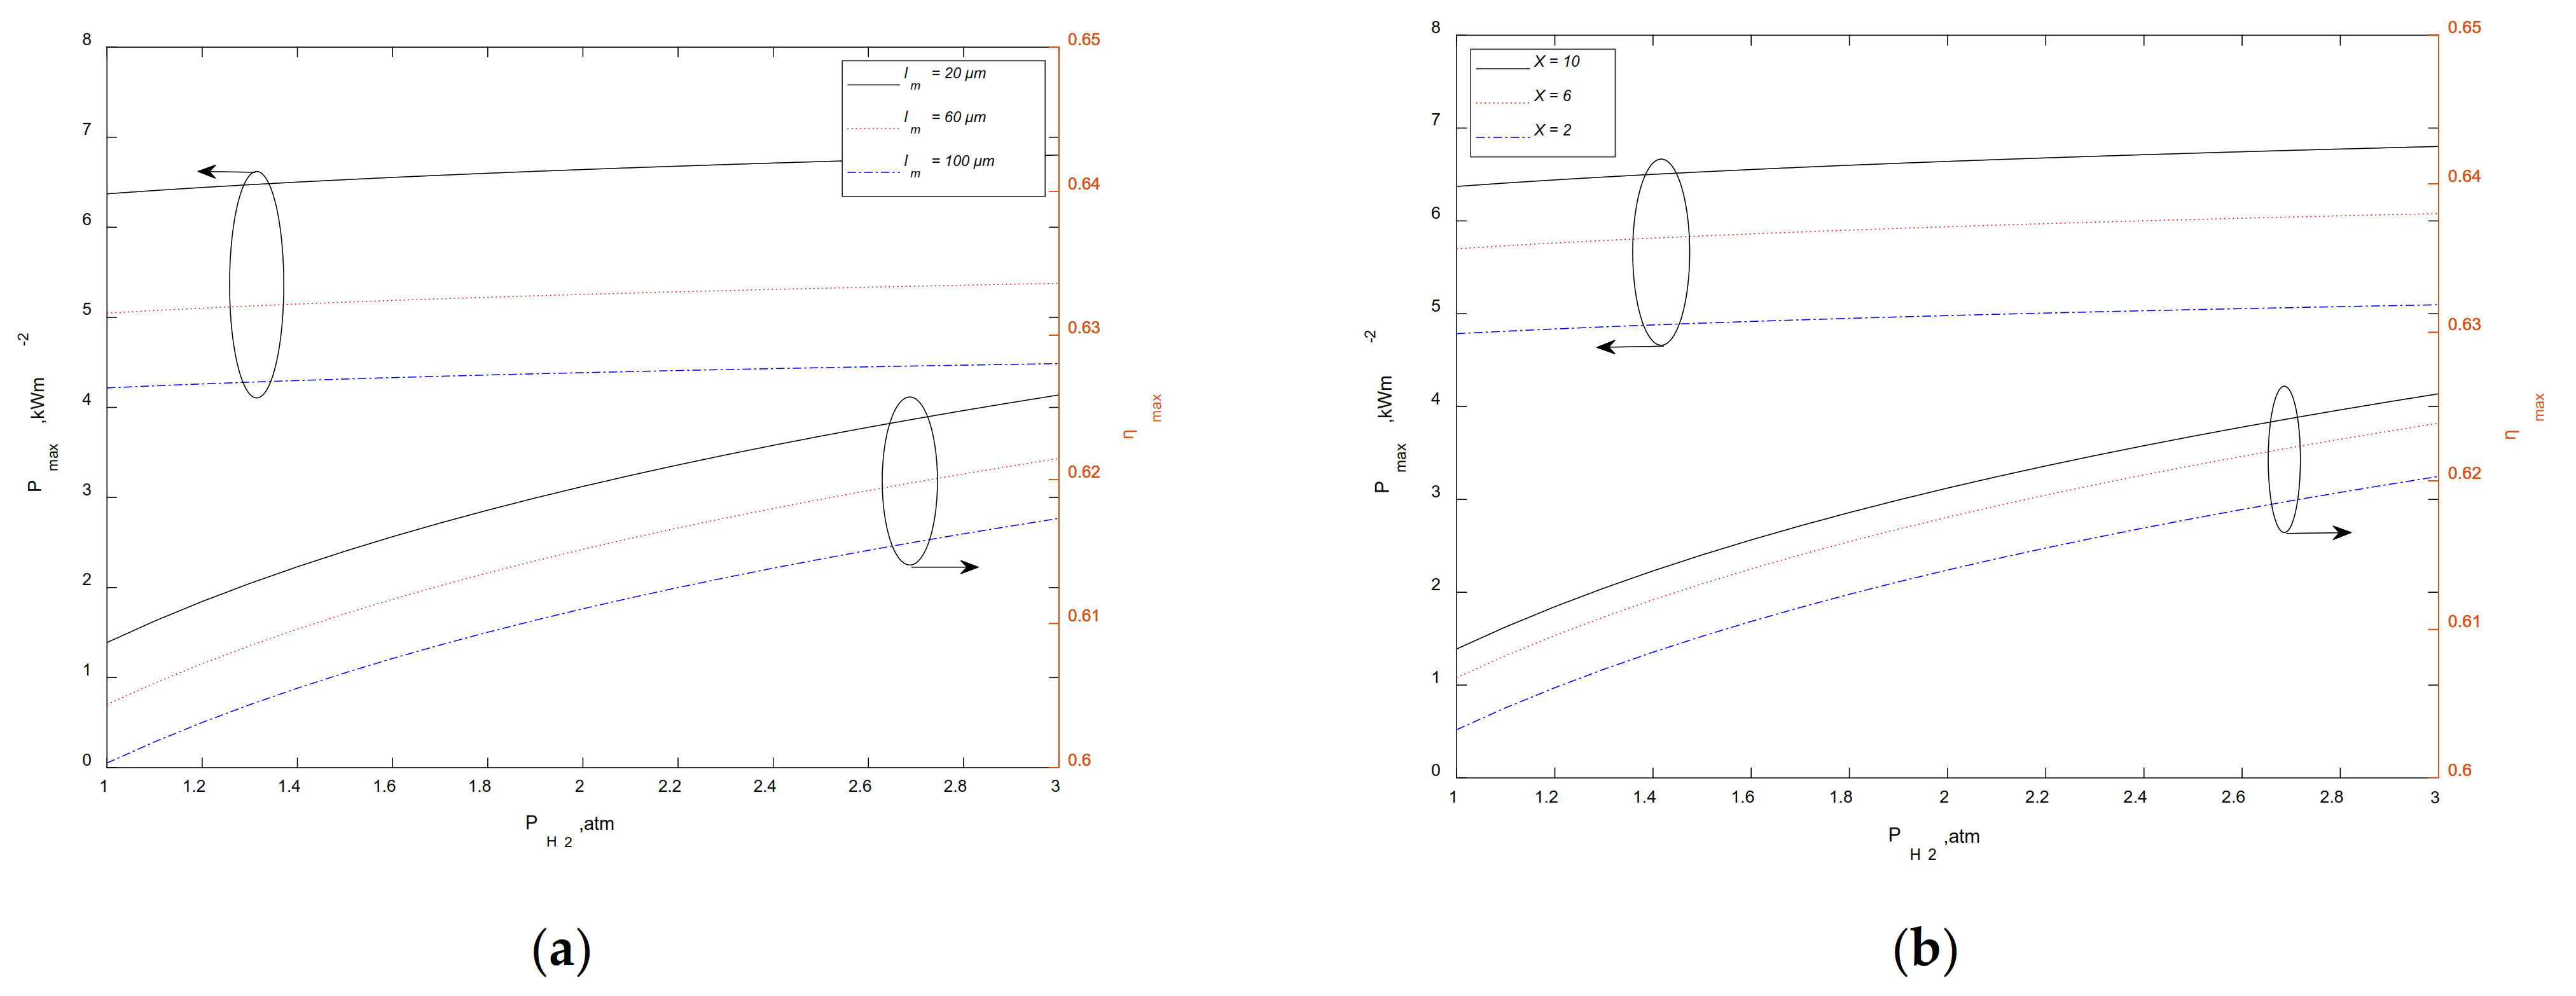
3.3. Maximum Output Performance at a Given p H 2

Figure 5 reflects the effect of hydrogen inlet pressure on P m a x and η m a x of HT-PEMFC with. It can be seen from several figures that P m a x and η m a x increase with the raise of p H 2 , but from a numerical point of view the increase is not large. The rise of pressure not only increases the diffusivity of the bipolar gas, but also improves the concentration of the bipolar gas and boosts the mass transfer of the reaction gas, which will strength the mass transfer of the reaction gas and reduce the influence of concentration polarization on the reversible potential.
Figure 5a shows the impact of p H 2 on P m a x and η m a x of HT-PEMFC under different l m . It can be seen that as l m decreases, P m a x and η m a x will increase. The thinner the proton membrane is, the smaller the barrier for ions to pass through the proton membrane, that is, the ohmic overpotential decreases.
Figure 5b reveals the influence of p H 2 in P m a x and η m a x of HT-PEMFC under different X . It is obvious that as the doping level of phosphoric acid increases, P m a x and
η m a x will increase. The improvement of doping level increases the proton conductivity of the membrane.
Figure 5c displays the impact of p H 2 on P m a x and η m a x of HT-PEMFC under different T . It is obvious that as the temperature rises, P m a x and η m a x will increase, and the increase is relatively large. When the operating temperature increases, the proton conductivity of the membrane improves and electrochemical polarization decreases; at the same time, the increase of operating temperature can boost the exchange current density, which reduces the activation overpotential.
Figure 5d describes the effect of p H 2 on P m a x and η m a x of HT-PEMFC under different p O 2 . As can be seen from Figure 5d, with the increase of p O 2 , P m a x and η m a x will strength. Obviously, p O 2 has little effect on the maximum output of the cell.

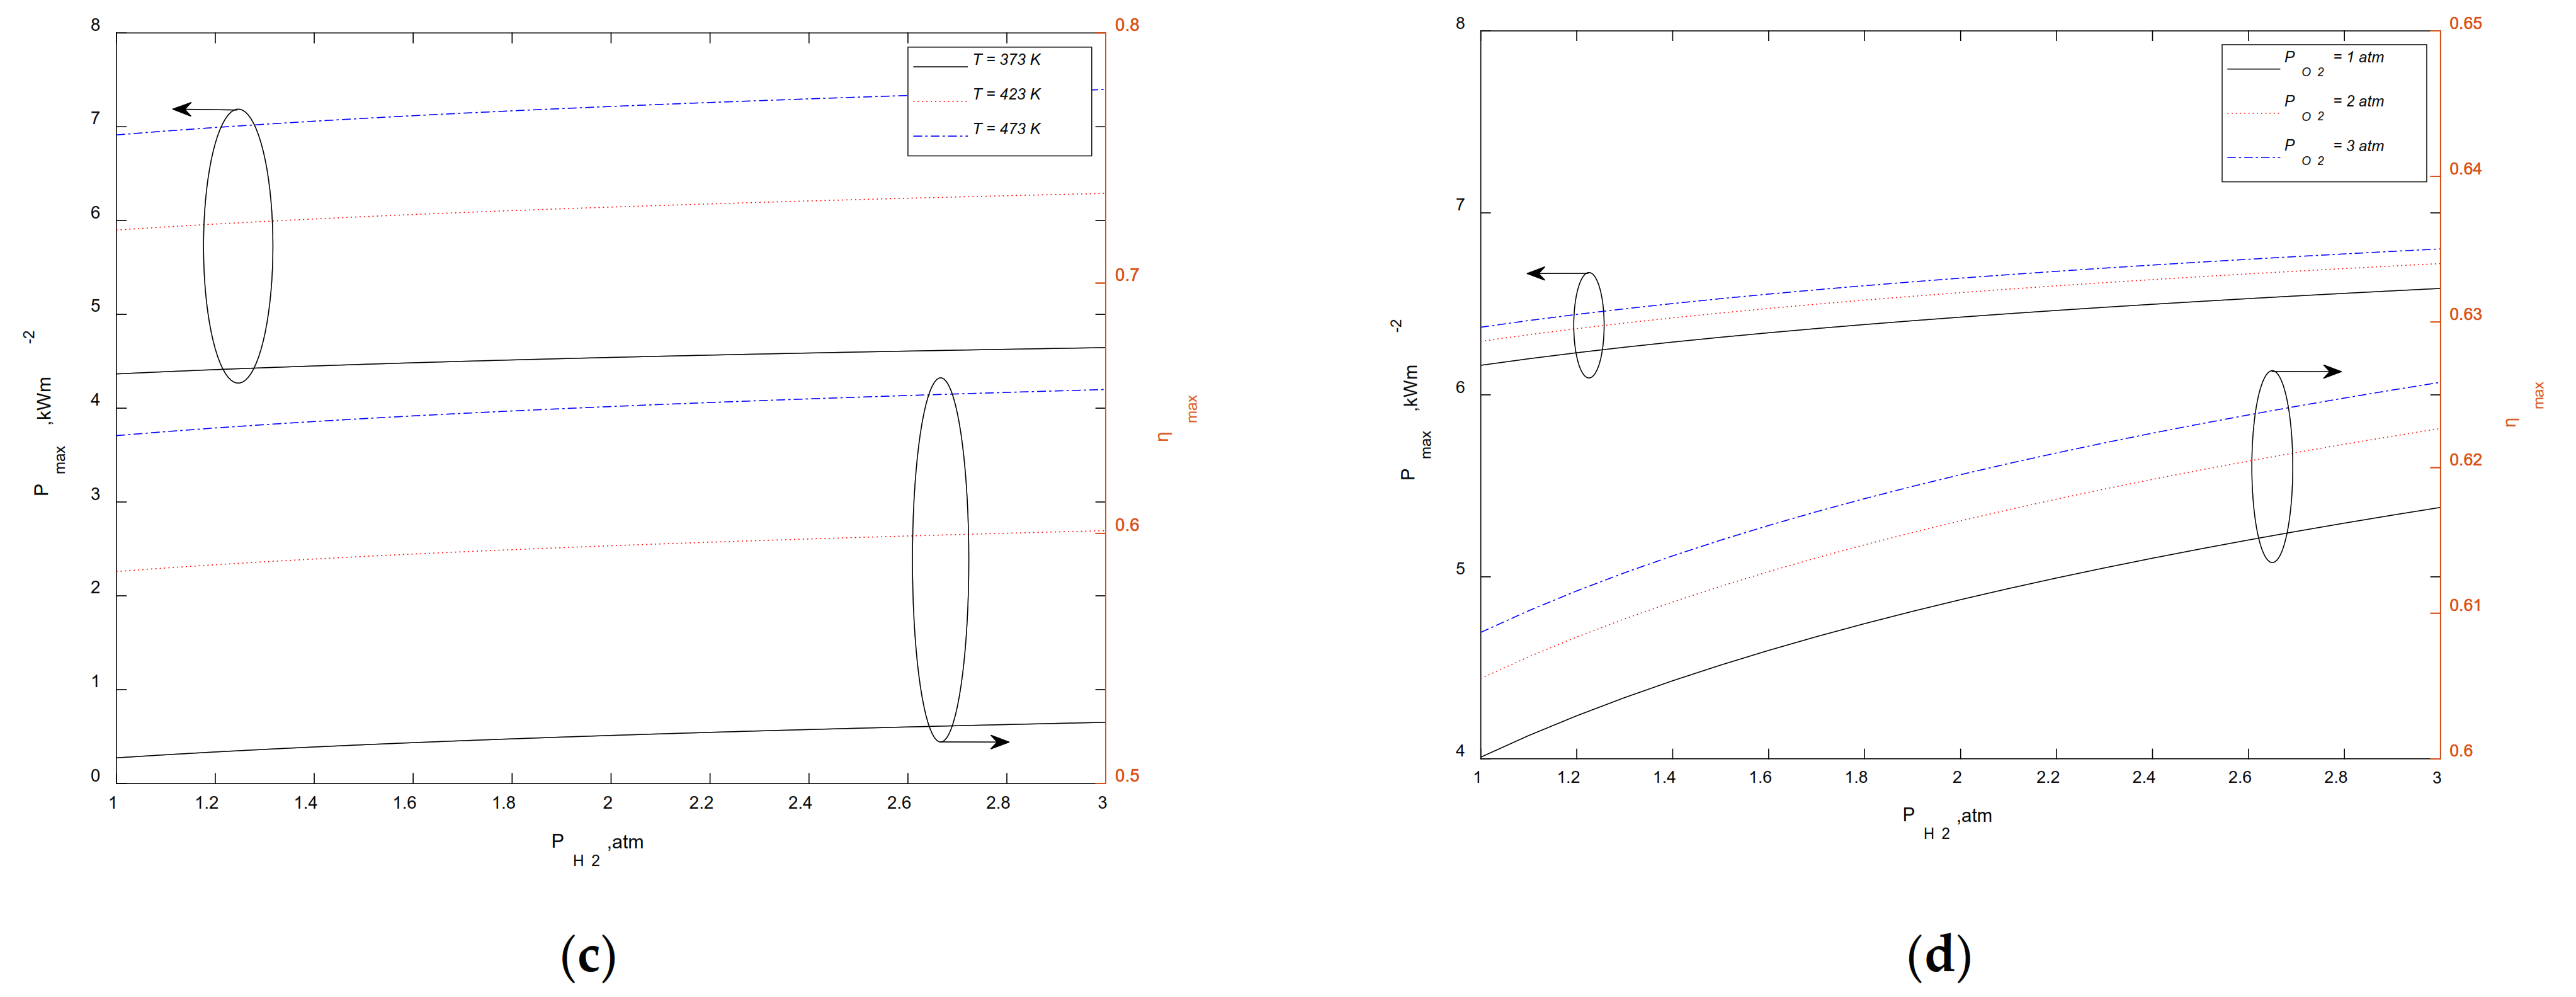
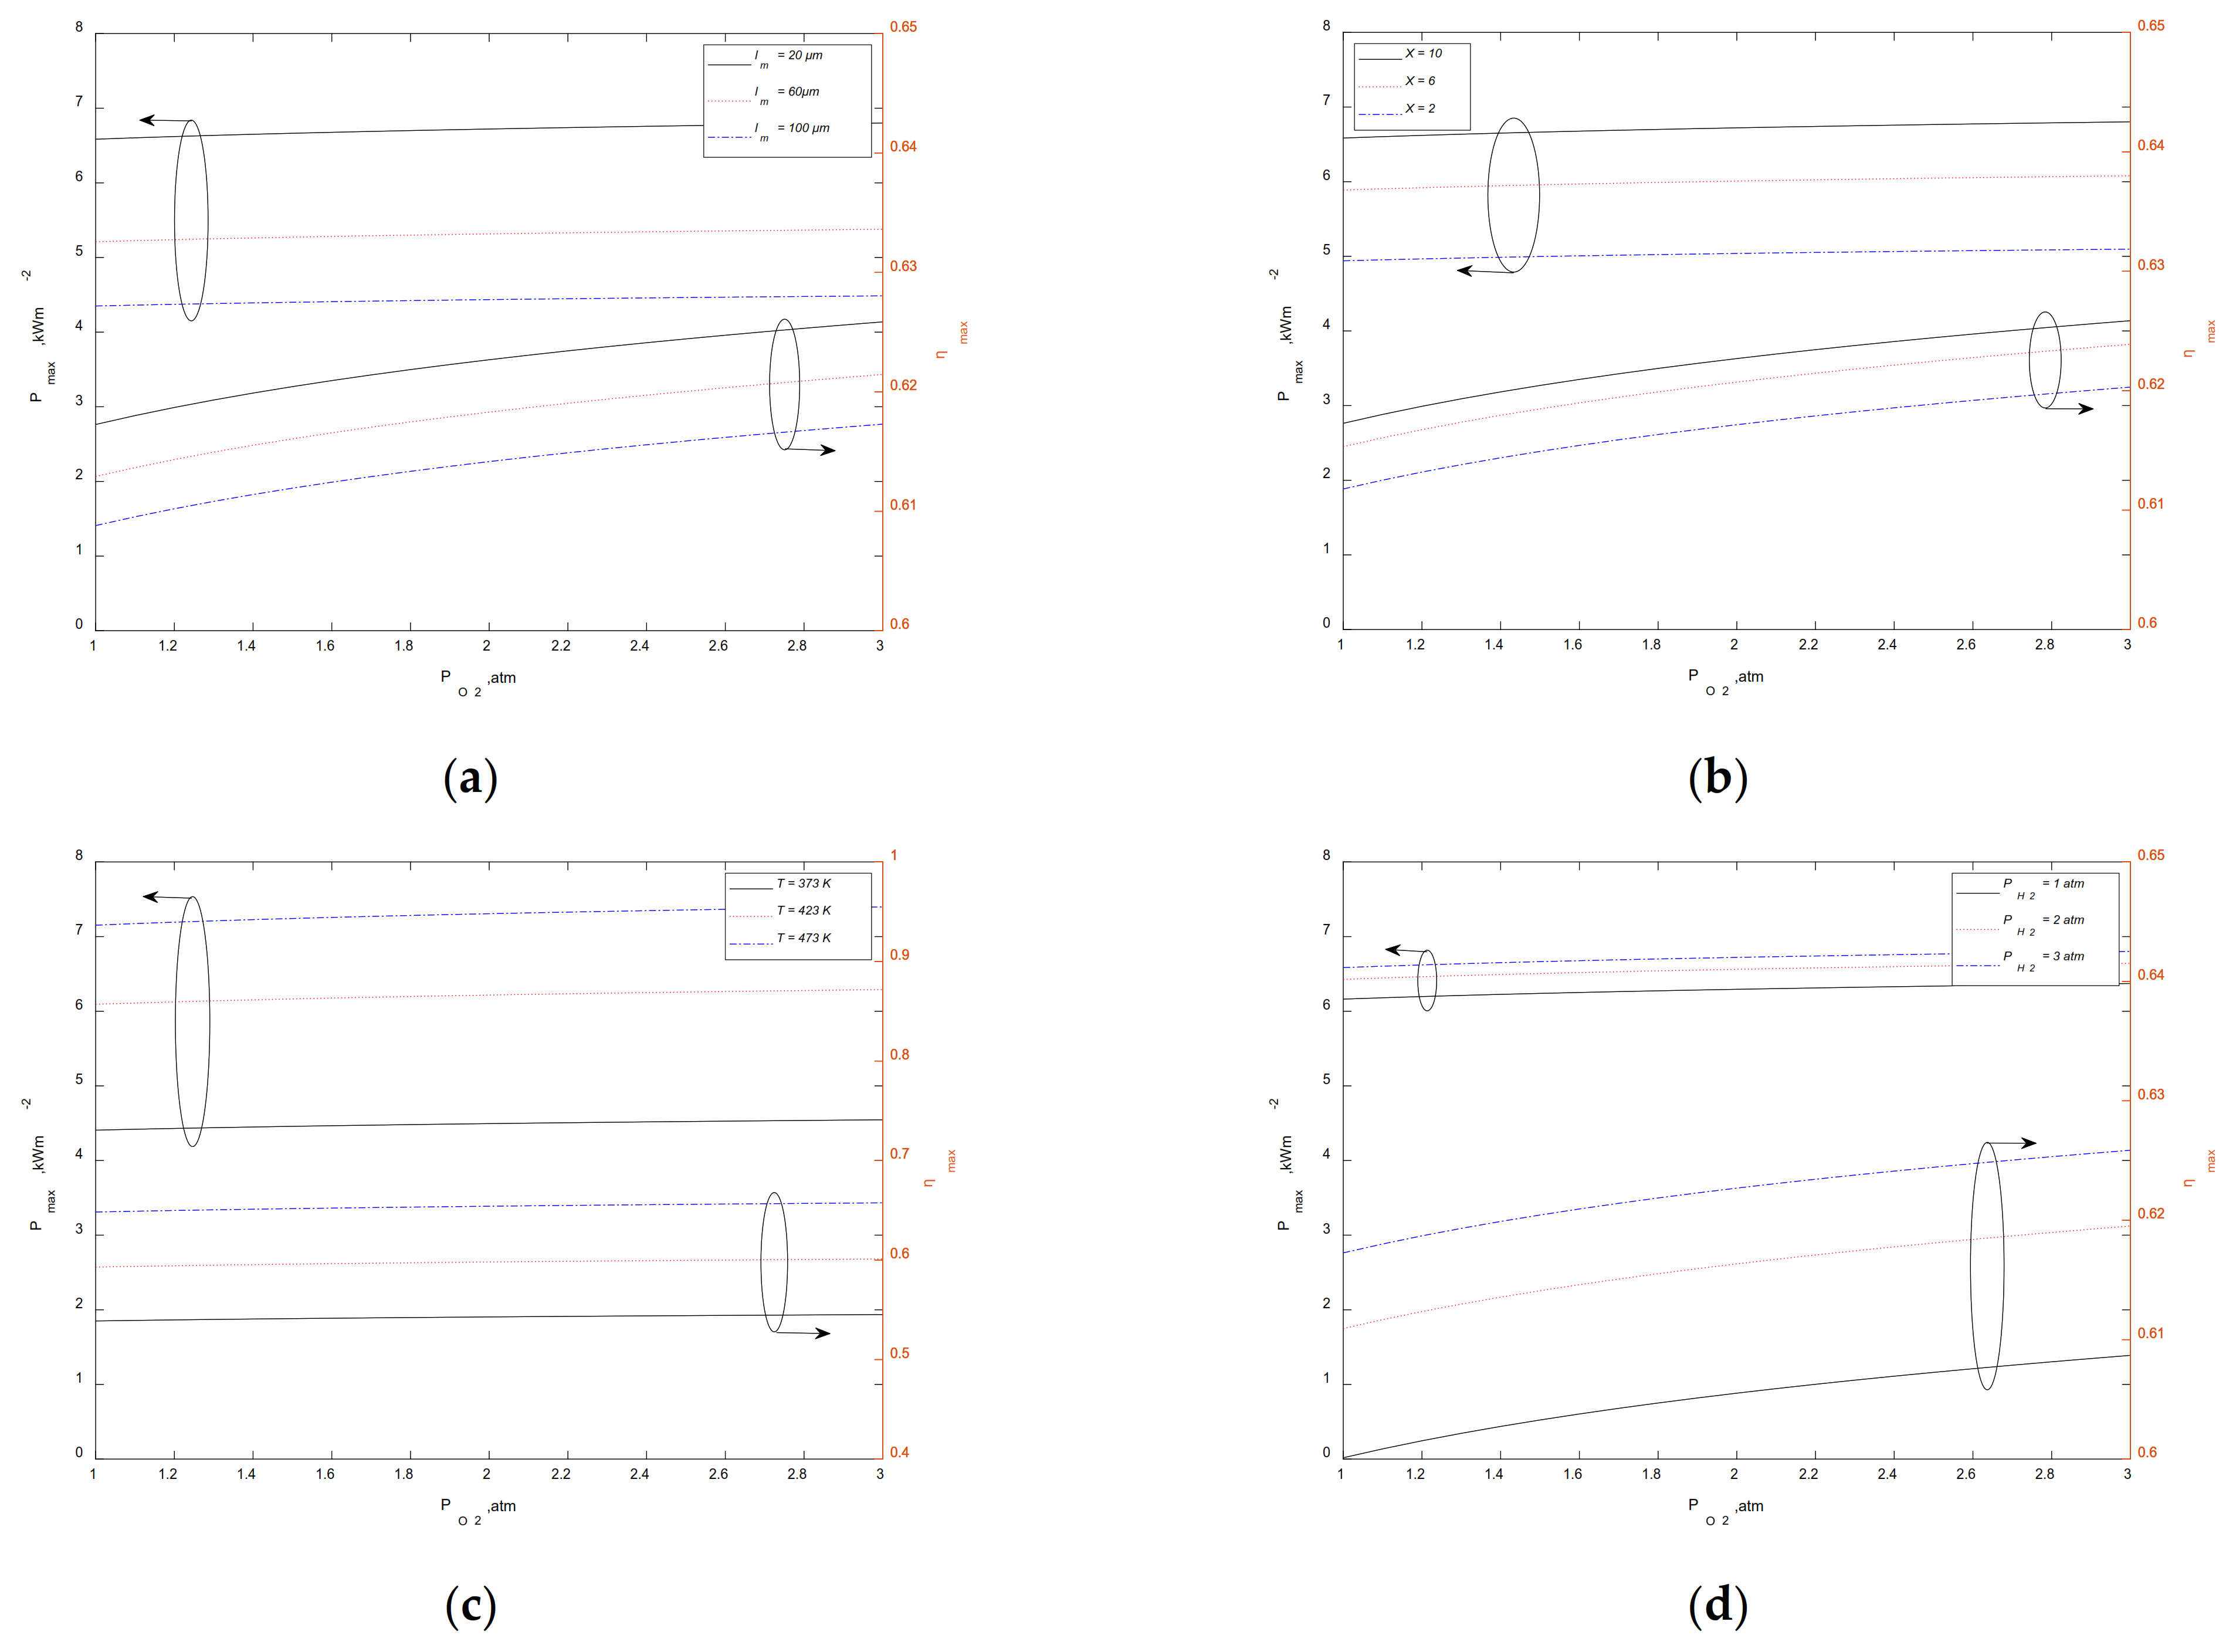
3.4. Maximum Output Performance at a Given p O 2

The influence of oxygen intake pressure on P m a x and η m a x of HT-PEMFC is shown in Figure 6. It can be seen from several figures that P m a x and η m a x raise with the increase of p O 2 , but from a numerical point of view the improvement is not large. The increase in pressure improves the mass transfer of the reaction gas and reduces the influence of concentration polarization on the reversible potential.
Figure 6a reflects the effect of p O 2 on P m a x and η m a x of HT-PEMFC under different l m . It can be seen that as the thickness of the proton film decreases, P m a x and η m a x will increase.
As shown in Figure 6b, p O 2 has a significant effect on P m a x and η m a x of HT-PEMFC under different X . It is obvious that as the doping level of phosphoric acid raises, P m a x and η m a x will improve.
Figure 6c shows the impact of p O 2 on P m a x and η m a x of HT-PEMFC under different T . Obviously, as the temperature increases, P m a x and η m a x will increase and the increase is relatively large.
Figure 6d reveals the effect of p O 2 on P m a x and η m a x of HT-PEMFC under different p H 2 . It is obvious that with the increase of p H 2 , P m a x and η m a x will enhance. It is clear that p H 2 has little effect on the maximum output power P m a x .

3.5. Maximum Output Performance at a Given p O 2

In the application of fuel cell vehicle, not only the quantity but also the quality of energy should be considered. Figure 7 shows the relation curve between power density and thermodynamic efficiency under operating temperature T (453 K), hydrogen and oxygen intake pressure p O 2 ,   p O 2 (3 atm), membrane thickness l m (20 μm) and membrane acid doping level X (10). In order to improve the calculation accuracy, P / P m a x is chosen to transform the engineering problem into a mathematical problem. The curve is the willow leaf curve going back to the origin. As shown in Figure 7, when P = P B ,   η = η m a x and when η = η A ,   P = P m a x . Thus, the optimal region of HT-PEMFC can be obtained.
P B P P m a x ,   η A η η m a x
Curve OABO is an optimization curve derived from the power and efficiency model. When the operating point of the cell is located on the curve AB, its performance reaches the best. When the running point is located in region ①, it has better performance; when the running point is located in the region ②, it has the worst performance. Regions ③④⑤ are unstable region, because these three regions are outside OABO curve; there exists no operation points in the region ⑥ because P > P m a x ,   η > η m a x .

4. Discussion

In this paper, a finite time thermodynamic model of HT-PEMFC is established, which takes the irreversibility caused by polarization and leakage current into account. The influences of operating temperature, proton membrane thickness, proton membrane phosphoric acid doping level, hydrogen intake pressure and oxygen intake pressure on P m a x and η m a x at a given temperature are studied. The results show that P m a x and η m a x both increase with the increase of temperature. When the operating temperature is 433 K, with the decrease of proton membrane thickness, P m a x improves greatly, but the decrease of membrane thickness has little effect on η m a x . As the doping level of proton membrane phosphoric acid increases, P m a x increases by 84% at the temperature of 373 K, and by 52% at the temperature of 473 K. However, the increase of phosphate doping level has little influence on η m a x . The increase of hydrogen intake pressure and oxygen intake pressure will increase P m a x and η m a x . The optimal relationship between power density and thermodynamic efficiency of HT-PEMFC is also studied. The optimal interval of power density and thermodynamic efficiency is P B P P m a x ,   η A η η m a x .

Author Contributions

Conceptualization, Z.M.; formal analysis, B.X.; investigation, B.X. and D.L.; project administration, Z.M.; resources, M.Z.; software, D.L.; supervision, Z.M.; validation, M.Z.; visualization, Y.L.; writing—original draft, B.X.; writing—review & editing, Z.M. All authors have read and agreed to the published version of the manuscript.

Funding

We gratefully acknowledge the financial support of the National Natural Science Foundation of China (No. 51176069) and Scientific Research Foundation of Nanjing Forestry University (No. GXL2018004).

Institutional Review Board Statement

Not applicable.

Informed Consent Statement

Not applicable.

Data Availability Statement

Not applicable.

Conflicts of Interest

The authors declare no conflict of interest.

References

  1. Liu, S.Q.; Jia, L.M. Review on sustainable development of forest-based biodiesel. J. Nanjing For. Univ. Nat. Sci. Ed. 2021, 44, 216–224. [Google Scholar]
  2. Yao, J.J.; Feng, X.Q.; Xiao, H.; Zheng, Y.; Zhang, C.L. Improvement effects of different solid waste and their disposal by products on saline-alkali soil in Huanghua Port. J. Nanjing For. Univ. Nat. Sci. Ed. 2021, 45, 45–52. [Google Scholar] [CrossRef]
  3. Zhang, Z.G. Researches on green features and category architecture of green strategies of renewable-resource-based enterprises: A case study of forestry enterprise. J. Nanjing For. Univ. Nat. Sci. Ed. 2020, 44, 1–8. [Google Scholar] [CrossRef]
  4. Sun, Y.F. High Temperature Proton Exchange Membrane Technology Improvement Research. Appl. Energy Technol. 2018, 6, 50–52. [Google Scholar]
  5. Cheddie, D.; Munroe, N. Analytical correlations for intermediate temperature PEM fuel cells. J. Power Sources 2006, 160, 299–304. [Google Scholar] [CrossRef]
  6. Hu, J.W.; Zhang, H.M.; Hu, J.; Zhai, Y.F.; Yi, B.L. Two dimensional modeling study of PBI/H3PO4 high temperature PEMFCs based on electrochemical methods. J. Power Sources 2006, 160, 1026–1034. [Google Scholar] [CrossRef]
  7. Cheddie, D.F.; Munroe, N.D.H. A two-phase model of an intermediate temperature PEM fuel cell. Int. J. Hydrogen Energy 2007, 32, 832–841. [Google Scholar] [CrossRef]
  8. Scott, K.; Pilditch, S.; Mamlouk, M. Modelling and experimental validation of a high temperature polymer electrolyte fuel cell. J. Appl. Electrochem. 2007, 37, 1245–1259. [Google Scholar] [CrossRef]
  9. Kang, T.; Kim, M.; Kim, J.; Sohn, Y.J. Numerical modeling of the degradation rate for membrane electrode assemblies in high temperature proton exchange membrane fuel cells and analyzing operational effects of the degradation. Int. J. Hydrogen Energy 2015, 40, 5444–5455. [Google Scholar] [CrossRef]
  10. Kim, M.; Kang, T.; Kim, J.; Sohn, Y.J. One-dimensional modeling and analysis for performance degradation of high temperature proton exchange membrane fuel cell using PA doped PBI membrane. Solid State Ionics 2014, 262, 319–323. [Google Scholar] [CrossRef]
  11. Cheddie, D.; Munroe, N. Mathematical model of a PEMFC using a PBI membrane. Energy Convers. Manag. 2006, 47, 1490–1504. [Google Scholar] [CrossRef]
  12. Qin, W.X.; Qin, X.Y.; Chen, L.G. Finite time thermodynamics optimization of an irreversible KCS-34 cycle coupled to variable temperature heat reservoirs. Energy Conserv. 2018, 37, 69–74. [Google Scholar]
  13. He, S.; Lin, L.Y.; Wu, Z.X.; Chen, Z.M. Application of Finite Element Analysis in Properties Test of Finger-jointed Lumber. J. Bioresour. Bioprod. 2020, 5, 124. [Google Scholar] [CrossRef]
  14. Zhao, X.Y.; Huang, Y.J.; Fu, H.Y.; Wang, Y.L.; Wang, Z. Deflection test and modal analysis of lightweight timber floors. J. Bioresour. Bioprod. 2021, 6, 266–278. [Google Scholar] [CrossRef]
  15. Yang, J.; Zhang, Y.C.; Zhou, L.; Zhang, F.S.; Jing, Y.; Huang, M.Z.; Liu, H.B. Quality-related monitoring of papermaking wastewater treatment processes using dynamic multiblock partial least squares. J. Bioresour. Bioprod. 2021. [Google Scholar] [CrossRef]
  16. Hu, T.P.; Yu, Z.; Guo, L.; Xu, C.Y. Thermodynamic self-consistent dynamic model of wood dust explosion. J. For. Eng. 2019, 4, 29–34. [Google Scholar]
  17. Stanley, J.; Watowich, R.; Stephen, B. Optimal current paths for model electrochemical systems. J. Phys. Chem. B 1986, 90, 4624–4631. [Google Scholar]
  18. Li, D.; Li, S.; Ma, Z.; Xu, B.; Lu, Z.; Li, Y.; Zheng, M. Ecological Performance Optimization of a High Temperature Proton Exchange Membrane Fuel Cell. Mathematics 2021, 9, 1332. [Google Scholar] [CrossRef]
  19. Sieniutycz, S. Thermodynamics of Power Production in Fuel Cells. Chem. Process. Eng.-Inz. 2010, 31, 81–105. [Google Scholar]
  20. Sieniutycz, S.; Poswiata, A. Thermodynamic aspects of power production in thermal, chemical and electrochemical systems. Energy 2012, 45, 62–70. [Google Scholar] [CrossRef]
  21. Li, C.J.; Liu, Y.; Xu, B.; Ma, Z.S. Finite Time Thermodynamic Optimization of an Irreversible Proton Exchange Membrane Fuel Cell for Vehicle Use. Processes 2019, 7, 419. [Google Scholar] [CrossRef] [Green Version]
  22. Muthuraja, P.; Prakash, S.; Shanmugam, V.M.; Radhakr sihnan, S.; Manisankar, P. Novel perovskite structured calcium titanate-PBI composite membranes for high-temperature PEM fuel cells: Synthesis and characterizations. Int. J. Hydrogen Energy 2018, 43, 4763–4772. [Google Scholar] [CrossRef]
  23. Miansari, M.; Sedighi, K.; Amidpour, M.; Alizadeh, E.; Miansari, M. Experimental and thermodynamic approach on proton exchange membrane fuel cell performance. J. Power Sources 2009, 190, 356–361. [Google Scholar] [CrossRef]
  24. Peng, X.R.; Zhang, Z.K.; Zhao, L.Y. Analysis of Raman spectroscopy and XPS of plasma modified polypropylene decorative film. J. For. Eng. 2020, 5, 45–51. [Google Scholar]
  25. Yu, P.J.; Zhang, W.; Chen, M.Z.; Zhou, X.Y. Plasma-treated thermoplastic resin film as adhesive for preparing environmentally-friendly plywood. J. For. Eng. 2020, 5, 41–47. [Google Scholar]
  26. Lobato, J.; Rodrigo, M.A.; Linares, J.J.; Scott, K. Effect of the catalytic ink preparation method on the performance of high temperature polymer electrolyte membrane fuel cells. J. Power Sources 2006, 157, 284–292. [Google Scholar] [CrossRef]
  27. Guo, X.R.; Zhang, H.C.; Zhao, J.P.; Wang, F.; Wang, J.T.; Miao, H.; Yuan, J.L. Performance evaluation of an integrated high-temperature proton exchange membrane fuel cell and absorption cycle system for power and heating/cooling cogeneration. Energy Convers. Manag. 2019, 181, 292–301. [Google Scholar] [CrossRef]
  28. Chan, S.H.; Khor, K.A.; Xia, Z.T. A complete polarization model of a solid oxide fuel cell and its sensitivity to the change of cell component thickness. J. Power Sources 2001, 93, 130–140. [Google Scholar] [CrossRef]
  29. Andreadis, G.M.; Podias, A.K.M.; Tsiakaras, P.E. The effect of the parasitic current on the direct ethanol PEM fuel cell operation. J. Power Sources 2008, 181, 214–227. [Google Scholar] [CrossRef]
  30. Haji, S. Analytical modeling of PEM fuel cell i-V curve. Renew. Energy 2011, 36, 451–458. [Google Scholar] [CrossRef]
  31. Wu, Z.; Zhu, P.F.; Yao, J.; Tan, P.; Xu, H.R.; Chen, B.; Yang, F.S.; Zhang, Z.X.; Ni, M. Thermo-economic modeling and analysis of an NG-fueled SOFC-WGS-TSA-PEMFC hybrid energy conversion system for stationary electricity power generation. Energy 2020, 192, 116613. [Google Scholar] [CrossRef]
  32. Zhao, Y.R.; Ou, C.J.; Chen, J.C. A new analytical approach to model and evaluate the performance of a class of irreversible fuel cells. Int. J. Hydrogen Energy 2008, 33, 4161–4170. [Google Scholar] [CrossRef]
  33. Zhang, X.; Cai, L.; Liao, T.J.; Zhou, Y.H.; Zhao, Y.R.; Chen, J.C. Exploiting the waste heat from an alkaline fuel cell via electrochemical cycles. Energy 2018, 142, 983–990. [Google Scholar] [CrossRef]
  34. Zhou, S.J.; Wang, P.; Zhang, M.; Chen, S.Z.; Xu, W.; Zhu, L.T.; He, X.Q.; Gong, S.R. Effects of atmospheric acid deposition on root physiological characteristics of Pinus massoniana seedlings. J. Nanjing For. Univ. Nat. Sci. Ed. 2021, 44, 111–118. [Google Scholar] [CrossRef]
  35. Xiong, G.K.; Li, Y.Q.; Xiong, Y.Q.; Duan, A.G.; Cao, D.C.; Sun, J.J.; Nie, L.Y.; Sheng, W.T. Effects of low stand density afforestation on the growth, stem-form and timber assortment structure of Cunninghamia lanceolata plantations. J. Nanjing For. Univ. Nat. Sci. Ed. 2021, 45, 165–173. [Google Scholar] [CrossRef]
  36. Ji, X.L.; Yang, P. The exploration of the slope displacement with vegetation protection under different rainfall intensity. J. For. Eng. 2020, 5, 152–156. [Google Scholar]
  37. Li, X.S.; Deng, T.T.; Wang, M.H.; Ju, S.; Li, X.C.; Li, M. Linear positioning algorithm improvement of wood acoustic emission source based on wavelet and signal correlation analysis methods. J. For. Eng. 2020, 5, 138–143. [Google Scholar]
  38. Guo, Y.H.; Guo, X.R.; Zhang, H.C.; Hou, S.J. Energetic, exergetic and ecological analyses of a high-temperature proton exchange membrane fuel cell based on a phosphoric-acid-doped polybenzimidazole membrane. Sustain. Energy Technol. 2020, 38, 100671. [Google Scholar] [CrossRef]
Figure 1. Working principle of HT–PEMFC.
Mathematics 09 01792 g001
Figure 2. Comparison of model curve and experimental data.
Mathematics 09 01792 g002
Figure 3. Reversible voltage, polarized overpotential and irreversible output voltage of HT-PEMFC.
Mathematics 09 01792 g003
Figure 4. Effect of operating temperature on P m a x and η m a x of HT-PEMFC under different parameters. (a) Different l m ; (b) different X ; (c) different p H 2 ; (d) different p O 2 .
Mathematics 09 01792 g004
Figure 5. Effect of operating temperature on P m a x and η m a x of HT-PEMFC under different parameters. (a) Different l m ; (b) different X ; (c) different T; (d) different p O 2 .
Mathematics 09 01792 g005aMathematics 09 01792 g005b
Figure 6. Effect of operating temperature on P m a x and η m a x of HT-PEMFC under different parameters. (a) Different l m ; (b) different X ; (c) different T; (d) different p H 2 .
Mathematics 09 01792 g006
Figure 7. Optimization relationship between P and η .
Mathematics 09 01792 g007
Table 1. Relevant data of HT-PEMFC.
ParameterValue
current density, I   A   m 2 0–20,000 [27]
operating temperature, T   K 373–473 [20]
intake pressure, p H 2 , p H 2   atm 1–3 [27]
thickness of membrane, l m   μ m 20, 60, 100 [27]
doping level, X   2, 6, 10 [27]
electronic number, n 2
faraday constant, F   C   mol 1 96,485
ambient temperature, T 0   K 298.15
transfer coefficient, α 0.25 [20]
diffusion layer thickness, l d   m 2.6 × 10 4 [20]
electron conductivity, σ d e f f   S   m 1 53 [20]
Publisher’s Note: MDPI stays neutral with regard to jurisdictional claims in published maps and institutional affiliations.

