Abstract
COVID-19 infections have plagued the world and led to deaths with a heavy pneumonia manifestation. The main objective of this investigation is to evaluate the performance of certain economies during the crisis derived from the COVID-19 pandemic. The gross domestic product (GDP) and global health security index (GHSI) of the countries belonging–or not–to the Organization for Economic Cooperation and Development (OECD) are considered. In this paper, statistical models are formulated to study this performance. The models’ specifications include, as the response variable, the GDP variation/growth percentage in 2020, and as the covariates: the COVID-19 disease rate from its start in March 2020 until 31 December 2020; the GHSI of 2019; the countries’ risk by default spreads from July 2019 to May 2020; belongingness or not to the OECD; and the GDP per capita in 2020. We test the heteroscedasticity phenomenon present in the modeling. The variable “COVID-19 cases per million inhabitants” is statistically significant, showing its impact on each country’s economy through the GDP variation. Therefore, we report that COVID-19 cases affect domestic economies, but that OECD membership and other risk factors are also relevant.
1. Introduction and Review of Literature
The first cases reported through global news of pneumonia derived from an unknown pathogen virus were in December 2019, in Wuhan, China [1,2]. The pathogen was detected as a novel enveloped ribonucleic acid betacoronavirus [3]. This pathogen has been named severe acute respiratory syndrome coronavirus 2 (SARS-CoV-2) [3], also known currently as COVID-19. The virus belongs to the phylogenetic tree of SARS-CoV [4].
The World Health Organization (WHO) declared the COVID-19 outbreak to be a global pandemic. On 27 March 2020, the number of cases exceeded 500,000, and it has continued to rise since that date [5]. Over 170 countries have been affected, with the United States (US) having the most confirmed cases [6]. Through their policies, governments have implemented processes to contain the virus [7,8].
Outbreaks of diseases such as SARS require special attention [9] because their economic, social and financial impact can be potentially significant. Different studies considering belongingness or not to the Organization for Economic Cooperation and Development (OECD) have analyzed the effect of COVID-19 on countries’ economies [10,11,12,13]. Some investigations indicate that there are no adequate econometric models to estimate: (i) the probable cost of a pandemic; (ii) the benefits of policies to mitigate the effects of diseases; or (iii) the distribution of disease’s costs and benefits within an economy [14]. However, some findings suggest that increases in COVID-19 infected cases and deaths are associated with a significant increase in market illiquidity and volatility [15,16]. Moreover, restrictions and lockdowns imposed by governments for social protection contribute to the deterioration of liquidity and stability of markets.
The COVID-19 pandemic could have a real economic and financial impact, as the gross domestic product (GDP) and hours worked fall by 20% (from trend). The GDP is the most employed measure of the country’s global economic activity. It represents the totality of final goods and services produced within a country during a specified time, such as one year. Some studies indicate that it is difficult for countries to recover their economic levels prior to the pandemic crisis [17]. A relationship between US returns, uncertainty, and COVID-19 cases during the first and second waves of the outbreak could be replicated by the rest of the world [18].
To the best of our knowledge, no studies have statistically evaluated the effect of the COVID-19 pandemic on the economy of countries belonging or not to the OECD. Therefore, econometric models are needed to make this evaluation. This affirmation is supported by our review of the literature, which has also allowed us to identify variables included in similar studies, as shown in Table 1. This table reports variables which are linked to our research, such as COVID-19 cases, economic effects and their relationship to COVID-19, the GDP of a country, the belongingness or not to the OECD, and the global health security index (GHSI), linking our study to countries’ health indicators.

Table 1.
Variable(s) used in the literature for the indicated year, reference, and author(s).
Therefore, the objective of this research is to statistically evaluate the economic effect of the crisis generated by the COVID-19 pandemic on countries. We evaluate the performance of the countries’ economies belonging or not to the OECD.
Statistical models are formulated to study the effect of the COVID-19 pandemic on these economies and to test the heteroscedasticity phenomenon. We use, as the response variable, the GDP variation/growth, which is calculated as a percentage over a year. For example, if in the year 2019 a country has a GDP of $M and in the year 2020 has a GDP of $N, then the GDP variation percentage in 2020 is (N/M) 100%. The GDP variation percentage (ΔGDP%) indicates the progress of the country’s economy. Note that the ΔGDP% is employed instead of the logarithm because the time unit utilized in the measurement refers to one year. In contrast, the logarithmic is commonly used for temporary variations that tend to zero out. The logarithmic approximation is good for small changes, but the metrics can be different for large percentage increases. The covariates (independent variables) that could model the response (dependent) variable already mentioned are the following:
- (i)
- The number of COVID-19 cases per million inhabitants, with a negative effect over the ΔGDP% being expected [30,31];
- (ii)
- The GHSI, where a relationship between the health impact of the COVID-19 pandemic and the ΔGDP% is expected;
- (iii)
- The country’s average risk and its standard deviation (StdDev) with this risk being measured by country default spreads (CDS), where a higher risk StdDev is expected to have a negative impact on the ΔGDP%;
- (iv)
- Belongingness of the country to the OECD group, where a positive effect on the ΔGDP% is expected if the country belongs to the OECD;
- (v)
- The GDP per capita (GDPpc) in each country, where a higher ΔGDP% is expected for OECD countries when facing the COVID-19 pandemic [32,33].
Thus, in this research, our hypothesis is that the COVID-19 pandemic has had a negative effect on the evolution of a country’s economy, measured through the variation in its GDP. Therefore, the contribution of this research is to evaluate, through econometric models, the effect generated by the health crisis derived from the COVID-19 pandemic in the economic performance of the countries belonging or not to the OECD. In summary, a statistical analysis is conducted, considering the ΔGDP% as response variable, and the number of COVID-19 cases per million inhabitants, the GHSI, the belongingness or not to the OECD group, and country risk measures, as the covariates.
The rest of the paper is organized as follows: in Section 2, the statistical model is formulated together with the methodology to be used. Furthermore, in this section, the specification of models and variables is stated. Section 3 reports the results obtained from the statistical analysis when applying the econometric models with and without considering heterogeneity. In this section, some indications and recommendations are also included. In Section 4, we provide the conclusions, discussions, limitations, and ideas for further research of this study.
2. Material and Methods
This section provides details about the data, the specification of the variables, an exploratory data analysis, and the statistical models.
2.1. The Data
The data employed in the present investigation (in short, “COVID-19 economic data”) were obtained from Bloomberg at:
https://bba.bloomberg.net/?utm_source=bloomberg-menu&utm_medium=bcomand (accessed on 26 June 2021), and from the GHSI at:
https://www.ghsindex.org/wp-content/uploads/2019/10/2019-Global-Health-Security-Index.pdf (accessed on 26 June 2021).
The data of GDP variation percentage (in short “ΔGDP%” or “GDP%”) in 2020 were secured from the International Monetary Fund at:
https://www.imf.org/en/Publications/WEO/weo-database/2020/October/download-entire-database (accessed on 26 June 2021).
The number of COVID-19 infected patients (in short “COVID-19 cases” or “cases”) was obtained from:
https://ourworldindata.org/coronavirus-source-data (accessed on 26 June 2021).
The data for each country were collected through the links mentioned above. We considered cases with strong COVID-19 impacts, which was useful for our research. According to the International Monetary Fund, the countries analyzed, and their respective ΔGDP% that corresponds to the annual variation of GDP in 2020, are presented in Table 2. Our study focused on the period between July 2019 and May 2020 of the CDS on government bonds, from execution to five years. The before-mentioned Bloomberg database provided them to measure the state of the economy before the generation of high levels of contagion derived from the COVID-19 pandemic. Although CDS premiums do not capture the exact default risk, the literature has documented that they are considered reliable and among the best default risk measures available [34]. Additionally, the CDS is used in [35] for risk analysis and bond spreads because they are positively correlated with premium risk measures. We also considered data on the health conditions of the countries in the sample from the GHSI for the year 2019 and the number of patients who died from COVID-19 during the peak of the pandemic between March 2020 and 31 December 2020.
Table 2.
GDP% of the indicated country in 2020 (Source: International Monetary Fund).
2.2. Specification of Variables and Data Exploratory Analysis
To conduct the modeling, we used a set of variables and their functional forms described in the recent economic literature [14]. The notation and specification for the variables (namely response and covariates ) to be considered in the modeling for the country i are the following:
- is the ΔGDP%;
- is the value of related to the disease rate measured by the number of COVID-19 cases at the peak of the pandemic per million inhabitants from its start in March 2020 until 31 December 2020;
- is the value of associated with the GHSI for 2019;
- is the value of , the logarithm of the risk average;
- ) is the value of , the logarithm of the risk StdDev;
- is the value of , a dichotomous variable for OECD belongingness;
- is the value of , which is a control variable linked to the GDPpc;
A descriptive summary of the data considered in this research is presented in Table 3, where the linear relationship of the variables is shown in Figure 1. Pearson correlations of the indicated variables are in the upper triangular of this figure; the corresponding scatter plots are in its lower triangular; and the histograms of each variable are in its diagonal. As displayed in Figure 1, we detected possible correlations among the response ΔGDP% and the covariates: Cases, Health, RiskAve, and RiskStdDev, which justified the use of multiple linear regression models. Nevertheless, when analyzing the existing correlations between the covariates of the model, we suspected possible multicollinearity. Thus, to assess collinearity based on Model 3 with constant variance specified in Section 2.4, we calculated the variance inflation factors (VIF) given by: and . Note that the variance of the estimated coefficient of log (RiskAve) is inflated by a factor of 8.24, making it the largest one. This indicates that log (RiskAve) is correlated with some of the covariates of the model. However, large VIF values, that is, greater than 10, suggest a multicollinearity problem as mentioned in p. 200 of [36] and in [37]. Therefore, no collinearity problems were detected in our case study.
Table 3.
Descriptive statistics of the indicated variable with COVID-19 economic data.
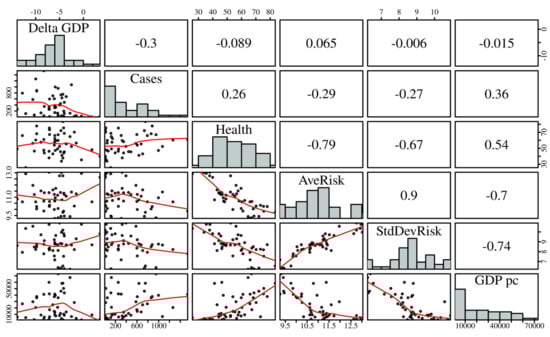
Figure 1.
Scatterplots, histograms, and Pearson correlations of the indicated variables with COVID-19 economic data.
The analysis of outliers provided information regarding unusual values of our response variable conditioned to the set of covariates. In contrast, the analysis of leverages, based on the diagonal elements of the projection matrix, included information on atypical values of the covariates. Figure 2a does not show evident leverage points, based on Model 3 considering heterogeneity, which is supported by the scatterplots. However, a deeper leverage analysis should be further studied with full diagnostic tools, which is beyond the objective of the present investigation. Figure 2b shows residual values that are slightly outside the range (−2.2) and the possible presence of a non-constant error variance. Hence, we detected the presence of outliers that require the use of more sophisticated models and/or robust statistical methods [38,39], which is also beyond the objective of the present investigation. In addition, we detected heterogeneity which was modeled in our study.
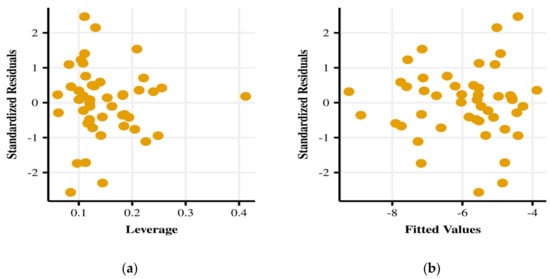
Figure 2.
Plots of leverage (a) and fitted values (b) versus standardized residuals.
2.3. The Statistical Models
Based on [40,41,42,43,44,45], we formulated a statistical model to describe the relationship between the response variable and covariates mentioned above, stated as:
where corresponds to the vector of observed values of the covariates X above defined; and T is a vector of regression parameters to be estimated.
In addition, in the model formulated in Equation (1), is the error term, which is assumed to be Gaussian distributed, centered on zero, and independent of the other errors. Similarly, is the term of the error for the country which is different from the country . Note that the variance of the error, represented by in Equation (1), is assumed to depend on covariates X, with being the vector of observed covariates for country and T is a vector of regression parameters associated with these covariates.
We used maximum likelihood (ML) and generalized least squares (GLS) methods to estimate the model parameters, namely and , following the methodology described in [46] and compared the robustness of the methods with the ordinary least squares (OLS) estimator. The ML and GLS estimators were more efficient compared to the OLS estimator when the heteroscedasticity was correctly specified. In addition, it is possible to utilize the generalized method of moments (GMM) to estimate the parameters. Nevertheless, for small samples, GMM estimators are biased [47,48,49]. In [48], the author showed that the ML estimator had the highest efficiency in comparison to the unweighted GMM and optimally weighted GMM estimators (based on an unrestricted simple estimator). Note that, only in the case of restricted normality, the GMM estimator performs better. Therefore, due to its good properties, we decided to employ the ML estimator to perform the statistical modeling. Specifically, the ML estimation is more efficient when assuming a suitable model specification and in cases of small samples [50].
2.4. Specification of Models
Based on the specification for the response formulated in Equation (1), we propose the following three models assuming (a) normally distributed errors, (b) independency of the model errors, and (c) heterogeneity or homogeneity of variances for these errors:
[Model 1]
where , for , with as indicated below Equation (1), and
- (i)
- is the GDP variation percentage in the country i;
- (ii)
- is the number of COVID-19 cases per million inhabitants in the country i;
- (iii)
- is the GHSI in the country i;
- (iv)
- is the logarithm of the risk average measured through CDS in the country i;
- (v)
- is the logarithm of the risk standard StdDev through CDS in the country i.
[Model 2]
where , , for , with as indicated above, and
- (i)
- is the GDP variation percentage in the country i;
- (ii)
- is the number of COVID-19 cases per million inhabitants in the country i;
- (iii)
- is the GHSI in the country i;
- (iv)
- is the logarithm of the risk average measured through CDS in the country i;
- (v)
- is the logarithm of the risk StdDev in the country i;
- (vi)
- is an indicator of OECD belongingness in the country i.
[Model 3]
where , for , with as indicated above, and
- (i)
- is the GDP variation percentage in the country i;
- (ii)
- is the number of COVID-19 cases per million inhabitants in the country i;
- (iii)
- is the GHSI in the country i;
- (iv)
- is the logarithm of the risk average measured through CDS in the country i;
- (v)
- is the logarithm of the risk StdDev in the country i;
- (vi)
- is an indicator of OECD belongingness in the country i;
- (vii)
- is the GDP per capita in the country i.
As mentioned, we assumed:
- (a)
- Normally distributed errors, that is, ;
- (b)
- Independency of the model errors, that is, under normality, we have , for , with as indicated below Equation (1);
- (c)
- Homogeneity or heterogeneity of variances for these errors. The homogeneity of variances assumption indicates that , for all , that is, we are only modeling the mean of because is assumed as constant (homogeneous). However, if is not constant (heterogeneous) by , we must also model it asthat is,where is the covariate associated with the country , with .
3. Results
In this section, we describe the econometric models and provide the numerical results of the statistical analysis when applying these models with and without considering heterogeneity.
3.1. Statistical Analysis under Homogeneity
Table 4 reports the results of regression analyses for the three models without considering heterogeneity. From this table, for all models, we can observe that:
Table 4.
Parameter estimate, (t-statistic, p-value, with its significance in parenthesis), and indicators of the listed model with COVID-19 economic data without considering heterogeneity.
- The COVID-19 cases per million inhabitants are significant statistically, indicating the effect that this variable has on each country’s economy in this study;
- In general, by increasing one case per million inhabitants, under the condition that all the remaining covariates remain fixed, we harm the GDP of 0.0026%, or 2.6%, per 1000 infected per million inhabitants on average;
- The results of the proposed models show an of 12.6% on average, implying a low level of regression adjustment and suggesting that another type of model specification is required for better characterization.
3.2. Statistical Analysis under Heterogeneity
Next, we studied the heteroscedasticity of the regression model by using the Breusch–Pagan test, which indicated that:
- The null hypothesis of homoscedasticity was rejected for Models 1 and 2 at a 10% significance;
- In the case of Model 3, the homoscedasticity hypothesis was not rejected.
Table 5 reports the linear regressions considering the effect of heteroscedasticity. These models incorporate the same covariates when modeling the variance (heteroscedasticity). From Table 5, for the model that considers the heteroscedasticity effect, note that:
Table 5.
Parameter estimate, (t-statistic, p-value, with its significance in parenthesis), and indicators for the listed model considering heteroscedasticity with COVID-19 economic data.
- Models 1 and 2 presented significant parameters for the covariates: COVID-19 cases and log(RiskStdDev);
- All models rejected the null hypothesis that the coefficients defining the variance are equal to zero, suggesting that a model does not need to remove the covariates related to the variance for its adequate specification.
- For Model 1, we detected the GDP variation percentage of the countries decreased by 0.0031 when COVID-19 cases increased by one point, under the condition that all the remaining covariates remain fixed.
- For Model 2, this increase was 0.0029, implying a 3% drop in the GDP variation percentage for each 1000 infected people per million inhabitants at the COVID-19 peak, showing a link between the health impact of the pandemic and the economic impact of the countries under study.
- OECD belongingness showed a negative effect, under the condition that all the remaining covariates remain fixed, implying that the economy of OECD countries was more strongly impacted when facing the pandemic phenomenon. However, it is not significant for our model.
- Nevertheless, countries with a higher logarithm of the risk StdDev were negatively impacted, suggesting the existence of other mechanisms affecting the economy of countries when facing problems due to the global pandemic.
- For both models, the variables that were not significant are log(RiskAve) and Health.
4. Conclusions and Future Research
In this research, the impact that the COVID-19 pandemic has had on countries’ economies was evaluated, showing an average negative result of 3% in the GDP for every 1000 people per million inhabitants. In addition, we were able to identify that the more developed countries, considered as those belonging to the OECD, did not suffer a higher impact on their GDP. Therefore, there is no statistically significant effect that connects belongingness to the OECD and the pandemic phenomenon on the economies of the countries. In addition, it seems that information about the pandemic is artificially added to the global story presented and affects the model only through the number of positive cases. However, in principle, developed countries have a higher capacity to respond to a sanitary emergency. This suggests to us the existence of other mechanisms that affect the economic performance of these countries, which are not directly attributable to the health impact derived from the COVID-19 pandemic. Otherwise, countries with a higher logarithm of the risk standard deviation are negatively affected.
We should mention some limitations to this study related to data collection and outlying observations. The databases only provided information for the period between July 2019 and May 2020. For future research, it is necessary to update the data set. In addition, the utilization of robust methods to outliers [38] for the estimation of model parameters is also of empirical interest.
An issue to be further studied is the efficiency of the variables in the securities markets [51,52]. Moreover, generalizations to multivariate models [53], incorporation of temporal [54], spatial [55] and quantile [55,56] regression structures in the modeling, as well as errors in variables [57] and PLS regression [37], should also be considered using the variables: GHSI, country risk, and OECD membership as relevant in relation to countries’ economies.
The use of global and local influence methods [58], as well as leverage, to diagnose atypical observations are needed. These methods are an appropriate step to employ in all statistical/econometric modeling. Furthermore, there exists a potential use in machine, deep, and statistical learning models [39,59,60,61]. Future research will consider other variables and relationships, such as production linkages and employment effects of the COVID-19 pandemic phenomena. Moreover, it would be interesting to consider models with interaction terms connecting the number of COVID-19 cases with other covariates. Another way around would be to compare the model proposed in the present investigation with a similar model estimated with data from a pre-pandemic period.
Consequently, the methodology introduced in this study proposes challenges and offers open theoretical and numerical issues that deserve to be further analyzed. Research on these issues is in progress, and their results will be reported in future publications.
Author Contributions
Data curation, H.d.l.F.-M., K.C.-J., R.R.; formal analysis, H.d.l.F.-M., K.C.-J., R.R., V.L.; investigation, H.d.l.F.-M., K.C.-J., R.R.; methodology, H.d.l.F.-M., K.C.-J., R.R., V.L.; writing—original draft, H.d.l.F.-M., K.C.-J., R.R.; writing—review and editing, V.L. All authors have read and agreed to the published version of the manuscript.
Funding
Research work of H.d.l.F.-M was partially supported by grant Núcleo de Investigación en Data Analytics/VRIEA/PUCV/039.432/2020 from the Vice-Rectory for Research and Advanced Studies of the Pontifical Catholic University of Valparaíso, Chile. Research of V.L. was partially supported by FONDECYT, grant number 1200525, from the National Agency for Research and Development (ANID) of the Chilean government under the Ministry of Science, Technology, Knowledge and Innovation.
Institutional Review Board Statement
Not applicable.
Informed Consent Statement
Not applicable.
Data Availability Statement
The data used to support the findings of this study can be secured from the websites indicated in Section 2.1 or under request from the authors.
Acknowledgments
The authors would also like to thank the Editor and five reviewers for their constructive comments which led to improving the presentation of the manuscript.
Conflicts of Interest
The authors declare no conflict of interest.
References
- Huang, C.; Wang, Y.; Li, X.; Ren, L.; Zhao, J.; Hu, Y.; Zhang, L.; Fan, G.; Xu, J.; Cao, B.; et al. Clinical features of patients infected with 2019 novel coronavirus in Wuhan, China. Lancet 2020, 395, 497–506. [Google Scholar] [CrossRef] [Green Version]
- Guan, W.J.; Ni, Z.Y.; Hu, Y.; Liang, W.H.; Ou, C.Q.; He, J.X.; Liu, L.; Shan, H.; Lei, C.L.; Hui, D.S.C.; et al. Clinical Characteristics of Coronavirus Disease 2019 in China. N. Engl. J. Med. 2020, 382, 1708–1720. [Google Scholar] [CrossRef]
- Lu, R.; Zhao, X.; Li, J.; Niu, P.; Yang, B.; Wu, H.; Wang, W.; Song, H.; Huang, B.; Zhu, N.; et al. Genomic characterisation and epidemiology of 2019 novel coronavirus: Implications for virus origins and receptor binding. Lancet 2020, 395, 565–574. [Google Scholar] [CrossRef] [Green Version]
- Chan, J.F.W.; Yuan, S.; Kok, K.H.; To, K.K.W.; Chu, H.; Yang, J.; Xing, F.; Liu, J.; Yip, C.C.Y.; Poon, R.W.S.; et al. A familial cluster of pneumonia associated with the 2019 novel coronavirus indicating person-to-person transmission: A study of a family cluster. Lancet 2020, 395, 514–523. [Google Scholar] [CrossRef] [Green Version]
- WHO. Coronavirus Disease 2019 (COVID-19). Situation Report-67; World Health Organization: Geneva, Switzerland, 2019; Available online: https://www.who.int/docs/default-source/coronaviruse/situation-reports/20200327-sitrep-67-covid-19.pdf?sfvrsn=b65f68eb_4 (accessed on 6 June 2021).
- Dayong, Z.; Min, H.; Qiang, J. Financial markets under the global pandemic of COVID-19. Financ. Res. Lett. 2020, 36, 1544–6123. [Google Scholar]
- Bei, C.; Liu, S.; Liao, Y.; Tian, G.; Tian, Z. Predicting new cases of COVID-19 and the application to population sustainability analysis. Account. Financ. 2021. [Google Scholar] [CrossRef]
- Friedson, A.I.; McNichols, D.; Sabia, J.J.; Dave, D. Shelter-in-place orders and public health: Evidence from California during the COVID-19 pandemic. J. Policy Anal. Manag. 2021, 40, 258–283. [Google Scholar] [CrossRef]
- Keogh-Brown, M.R.; Wren-Lewis, S.; Edmunds, W.J.; Smith, R.D. The macroeconomic impact of pandemic influenza: Estimates from models of the United Kingdom, France, Belgium and the Netherlands. Eur. J. Health Econ. 2010, 11, 543–554. [Google Scholar] [CrossRef]
- Harjoto, M.A.; Rossi, F. Market reaction to the COVID-19 pandemic: Evidence from emerging markets. Int. J. Emerg. Mark. 2021. [Google Scholar] [CrossRef]
- Popkova, E.; DeLo, P.; Sergi, B.S. Corporate Social Responsibility amid Social Distancing During the COVID-19 Crisis: BRICS vs. OECD Countries. Res. Int. Bus. Financ. 2021, 55, 101315. [Google Scholar] [CrossRef] [PubMed]
- Sadeh, A.; Radu, C.F.; Feniser, C.; Borsa, A. Governmental intervention and its impact on crowth, economic development, and technology in OECD countries. Sustainability 2021, 13, 166. [Google Scholar] [CrossRef]
- Salisu, A.A.; Akanni, L.O. Constructing a Global Fear Index for the COVID-19 Pandemic. Emerg. Mark. Financ. Trade 2020, 56, 2310–2331. [Google Scholar] [CrossRef]
- Chahuán-Jiménez, K.; Rubilar, R.; de la Fuente-Mella, H.; Leiva, V. Breakpoint analysis for the COVID-19 pandemic and its effect on the stock markets. Entropy 2021, 23, 100. [Google Scholar] [CrossRef] [PubMed]
- Baig, A.S.; Butt, H.A.; Haroon, O.; Rizvi, S.A.R. Deaths, panic, lockdowns and US equity markets: The case of COVID-19 pandemic. Financ. Res. Lett. 2021, 38, 101701. [Google Scholar] [CrossRef] [PubMed]
- Ngo, V.M.; Nguyen, H.H. Are fear and hope of the COVID-19 pandemic responsible for the V-shaped behaviour of global financial markets? A text-mining approach. Appl. Econ. Lett. 2021, 1–11. [Google Scholar] [CrossRef]
- Costa, C.J.; Garcia-Cintado, A.C.; Marques, K. Macroeconomic policies and the pandemic-driven recession. Int. Rev. Econ. Financ. 2021, 72, 438–465. [Google Scholar] [CrossRef]
- Yousfi, M.; Ben Zaied, Y.; Ben Cheikh, N.; Ben Lahouel, B.; Bouzgarrou, H. Effects of the COVID-19 pandemic on the US stock market and uncertainty: A comparative assessment between the first and second waves. Technol. Forecast. Soc. Chang. 2021, 167, 120710. [Google Scholar] [CrossRef]
- El-Morshedy, M.; Altun, E.; Eliwa, M.S. A new statistical approach to model the counts of novel coronavirus cases. Math. Sci. 2021, 1–14. [Google Scholar] [CrossRef]
- Altig, D.; Baker, S.; Barrero, J.M.; Bloom, N.; Bunn, P.; Chen, S.; Davis, S.J.; Leather, J.; Meyer, B.; Mihaylov, E.; et al. Economic uncertainty before and during the COVID-19 pandemic. J. Public Econ. 2020, 191, 104274. [Google Scholar] [CrossRef]
- Canelli, R.; Fontana, G.; Realfonzo, R.; Passarella, M.V. Are EU Policies Effective to Tackle the Covid-19 Crisis? The Case of Italy. Rev. Political Econ. 2021, 33, 432–461. [Google Scholar] [CrossRef]
- Havrlant, D.; Darandary, A.; Muhsen, A. Early estimates of the impact of the COVID-19 pandemic on GDP: A case study of Saudi Arabia. Appl. Econ. 2021, 53, 1317–1325. [Google Scholar] [CrossRef]
- Hürtgen, P. Fiscal space in the COVID-19 pandemic. Appl. Econ. 2021, 1–16. [Google Scholar] [CrossRef]
- Jena, P.R.; Majhi, R.; Kalli, R.; Managi, S.; Majhi, B. Impact of COVID-19 on GDP of major economies: Application of the artificial neural network forecaster. Econ. Anal. Policy 2021, 69, 324–339. [Google Scholar] [CrossRef]
- Li, W.; Chien, F.; Kamran, H.W.; Aldeehani, T.M.; Sadiq, M.; Nguyen, V.C.; Taghizadeh-Hesary, F. The nexus between COVID-19 fear and stock market volatility. Econ. Res. Ekon. Istraživanja 2021, 1–22. [Google Scholar] [CrossRef]
- Marti, L.; Puertas, R. European countries’ vulnerability to COVID-19: Multicriteria decision-making techniques. Econ. Res. Ekon. Istraživanja 2021, 1–12. [Google Scholar] [CrossRef]
- Shafiullah, M.; Khalid, U.; Chaudhry, S.M. Do stock markets play a role in determining COVID-19 economic stimulus? A cross-country analysis. World Econ. 2021. [Google Scholar] [CrossRef]
- Welfens, P.J.J. Macroeconomic and health care aspects of the coronavirus epidemic: EU, US and global perspectives. Int. Econ. Econ. Policy 2020, 17, 295–362. [Google Scholar] [CrossRef]
- Kinnunen, J.; Akademi, T.A.; Georgescu, I. Bucharest University of Economics Disruptive Pandemic as a Driver towards Digital Coaching in OECD Countries. Rev. Rom. Pentru Educ. Multidimens 2020, 12, 55–61. [Google Scholar] [CrossRef]
- Wei, C.; Lee, C.C.; Hsu, T.C.; Hsu, W.T.; Chan, C.C.; Chen, S.C.; Chen, C.J. Correlation of population mortality of COVID-19 and testing coverage: A comparison among 36 OECD countries. Epidemiol. Infect. 2021, 149, e1. [Google Scholar] [CrossRef] [PubMed]
- Wildman, J. COVID-19 and income inequality in OECD countries. Eur. J. Health Econ. 2021, 22, 455–462. [Google Scholar] [CrossRef] [PubMed]
- König, M.; Winkler, A. Monitoring in real time: Cross-country evidence on the COVID-19 impact on GDP growth in the first half of 2020. COVID Econ. 2020, 57, 132–153. [Google Scholar]
- Kucukefe, B. Clustering macroeconomic impact of COVID-19 in OECD countries and China. Ekonomi Politika Ve Finans Araştırmaları Dergisi 2020, 5, 280–291. [Google Scholar]
- Pan, J.; Singleton, K.J. Default and recovery implicit in the term structure of sovereign CDS spreads. J. Financ. 2008, 63, 2345–2384. [Google Scholar] [CrossRef] [Green Version]
- Fontana, A.; Scheicher, M. An analysis of euro area sovereign CDS and their relation with government bonds. J. Bank. Financ. 2016, 62, 126–140. [Google Scholar] [CrossRef]
- Hair, J.F., Jr.; Black, W.C.; Babin, B.J.; Anderson, R.E. Multivariate Data Analysis; Pearson: Harlow, UK, 2014. [Google Scholar]
- Huerta, M.; Leiva, V.; Liu, S.; Rodriguez, M.; Villegas, D. On a partial least squares regression model for asymmetric data with a chemical application in mining. Chemom. Intell. Lab. Syst. 2019, 190, 55–68. [Google Scholar] [CrossRef]
- Velasco, H.; Laniado, H.; Toro, M.; Leiva, V.; Lio, Y. Robust Three-Step Regression Based on Comedian and Its Performance in Cell-Wise and Case-Wise Outliers. Mathematics 2020, 8, 1259. [Google Scholar] [CrossRef]
- James, G.; Witten, D.; Hastie, T.; Tibshirani, R. An Introduction to Statistical Learning; Springer: Cham, Switzerland, 2013; Volume 112, p. 18. [Google Scholar]
- Kokholm, T. Pricing and hedging of derivatives in contagious markets. J. Bank. Financ. 2016, 66, 19–34. [Google Scholar] [CrossRef]
- Oikonomikou, L.E. Modeling financial market volatility in transition markets: A multivariate case. Res. Int. Bus. Financ. 2018, 45, 307–322. [Google Scholar] [CrossRef] [Green Version]
- Lewis, V.; Roth, M. The financial market effects of the ECB’s asset purchase programs. J. Financ. Stab. 2019, 43, 40–52. [Google Scholar] [CrossRef]
- Ahundjanov, B.B.; Akhundjanov, S.B.; Okhunjanov, B.B. Information Search and Financial Markets under COVID-19. Entropy 2020, 22, 791. [Google Scholar] [CrossRef]
- Umaña-Hermosilla, B.; de la Fuente-Mella, H.; Elórtegui-Gómez, C.; Fonseca-Fuentes, M. Multinomial logistic regression to estimate and predict the perceptions of individuals and companies in the face of the COVID-19 pandemic in the Ñuble Region, Chile. Sustainability 2020, 12, 9553. [Google Scholar] [CrossRef]
- De la Fuente-Mella, H.; Vallina, A.; Solis, R. Stochastic analysis of the economic growth of OECD countries. Econ. Res. Ekon. Istraživanja 2020, 33, 2189–2202. [Google Scholar] [CrossRef] [Green Version]
- Greene, W.H. Econometric Analysis; Pearson: New York, NY, USA, 2018. [Google Scholar]
- Altonji, J.G.; Segal, L.M. Small-Sample Bias in GMM Estimation of Covariance Structures. J. Bus. Econ. Stat. 1996, 14, 353. [Google Scholar] [CrossRef] [Green Version]
- Clark, T.E. Small-sample properties of estimators of nonlinear models of covariance structure. J. Bus. Econ. Stat. 1996, 14, 367–373. [Google Scholar]
- Santos, L.; Barrios, E.B. Small Sample Estimation in Dynamic Panel Data Models: A Simulation Study. Open J. Stat. 2011, 1, 58–73. [Google Scholar] [CrossRef] [Green Version]
- Harvey, A.C. Estimating Regression Models with Multiplicative Heteroscedasticity. Econometrica 1976, 44, 461. [Google Scholar] [CrossRef]
- De la Fuente-Mella, H.; Rojas, J.L.; Leiva, V. Econometric modeling of productivity and technical efficiency in the Chilean manufacturing industry. Comput. Ind. Eng. 2020, 139, 105793. [Google Scholar] [CrossRef]
- Vallina, A.M.; de la Fuente-Mella, H.; Solis, R. International trade and innovation: Delving in Latin American commerce. Acad. ARLA 2020, 33, 535–547. [Google Scholar] [CrossRef]
- Díaz-García, J.A.; Galea, M.; Leiva, V. Influence diagnostics for multivariate elliptic regression linear models. Commun. Stat. Theory Methods 2003, 32, 625–641. [Google Scholar] [CrossRef]
- Leiva, V.; Saulo, H.; Souza, R.; Aykroyd, R.G.; Vila, R. A new BISARMA time series model for forecasting mortality using weather and particulate matter data. J. Forecast. 2021, 40, 346–364. [Google Scholar] [CrossRef]
- Sánchez, L.; Leiva, V.; Galea, M.; Saulo, H. Birnbaum-Saunders Quantile Regression Models with Application to Spatial Data. Mathematics 2020, 8, 1000. [Google Scholar] [CrossRef]
- Saulo, H.; Dasilva, A.; Leiva, V.; Sánchez, L.; de la Fuente-Mella, H. Log-symmetric quantile regression models. Stat. Neerl. 2021. [Google Scholar] [CrossRef]
- Carrasco, J.M.F.; Figueroa-Zuñiga, J.I.; Leiva, V.; Riquelme, M.; Aykroyd, R.G. An errors-in-variables model based on the Birnbaum–Saunders distribution and its diagnostics with an application to earthquake data. Stoch. Environ. Res. Risk Assess. 2020, 34, 369–380. [Google Scholar] [CrossRef]
- Liu, Y.; Mao, C.; Leiva, V.; Liu, S.; Neto, W.A.S. Asymmetric autoregressive models: Statistical aspects and a financial application under COVID-19 pandemic. J. Appl. Stat. 2021, 1–25. [Google Scholar] [CrossRef]
- Elzeki, O.M.; Shams, M.; Sarhan, S.; Elfattah, M.A.; Hassanien, A.E. COVID-19: A new deep learning computer-aided model for classification. PeerJ Comput. Sci. 2021, 7, e358. [Google Scholar] [CrossRef] [PubMed]
- Palacios, C.; Reyes-Suárez, J.; Bearzotti, L.; Leiva, V.; Marchant, C. Knowledge Discovery for Higher Education Student Retention Based on Data Mining: Machine Learning Algorithms and Case Study in Chile. Entropy 2021, 23, 485. [Google Scholar] [CrossRef] [PubMed]
- Bustos, N.; Tello, M.; Droppelmann, G.; Garcia, N.; Feijoo, F.; Leiva, V. Machine learning techniques as an efficient alternative diagnostic tool for COVID-19 cases. Signa Vitae 2021. [Google Scholar] [CrossRef]
Publisher’s Note: MDPI stays neutral with regard to jurisdictional claims in published maps and institutional affiliations. |
© 2021 by the authors. Licensee MDPI, Basel, Switzerland. This article is an open access article distributed under the terms and conditions of the Creative Commons Attribution (CC BY) license (https://creativecommons.org/licenses/by/4.0/).