
A New Birnbaum–Saunders Distribution and Its Mathematical Features Applied to Bimodal Real-World Data from Environment and Medicine


Abstract
:1. Introduction
2. The Birnbaum–Saunders Distribution
2.1. Definition
2.2. Justifying the BS Distribution in Environmental and Medical Contexts
3. The BS Distribution under Bimodality
3.1. Probability Density Function
3.2. Cumulative Distribution Function and BBS3 Properties
- (i)
- .
- (ii)
- If , .
3.3. Cumulant Generating Function
3.4. Moments
4. Inference
4.1. Moment Estimators
4.2. Maximum Likelihood Estimators
5. Numerical Applications
5.1. Simulation Algorithm and Computer Characteristics
- n: The length of the .
- Y: A random variable with distribution.
- : The BBS3 PDF with .
- : A lower limit for the BBS3 numbers to be generated with .
- : The maximum value of with .
- : A random variable with a uniform distribution in , U in short.
- : A random variable with a U distribution.
| Algorithm 1: Acceptance–rejection algorithm to generate numbers from the distribution |
 |
5.2. Results of the Simulation Study
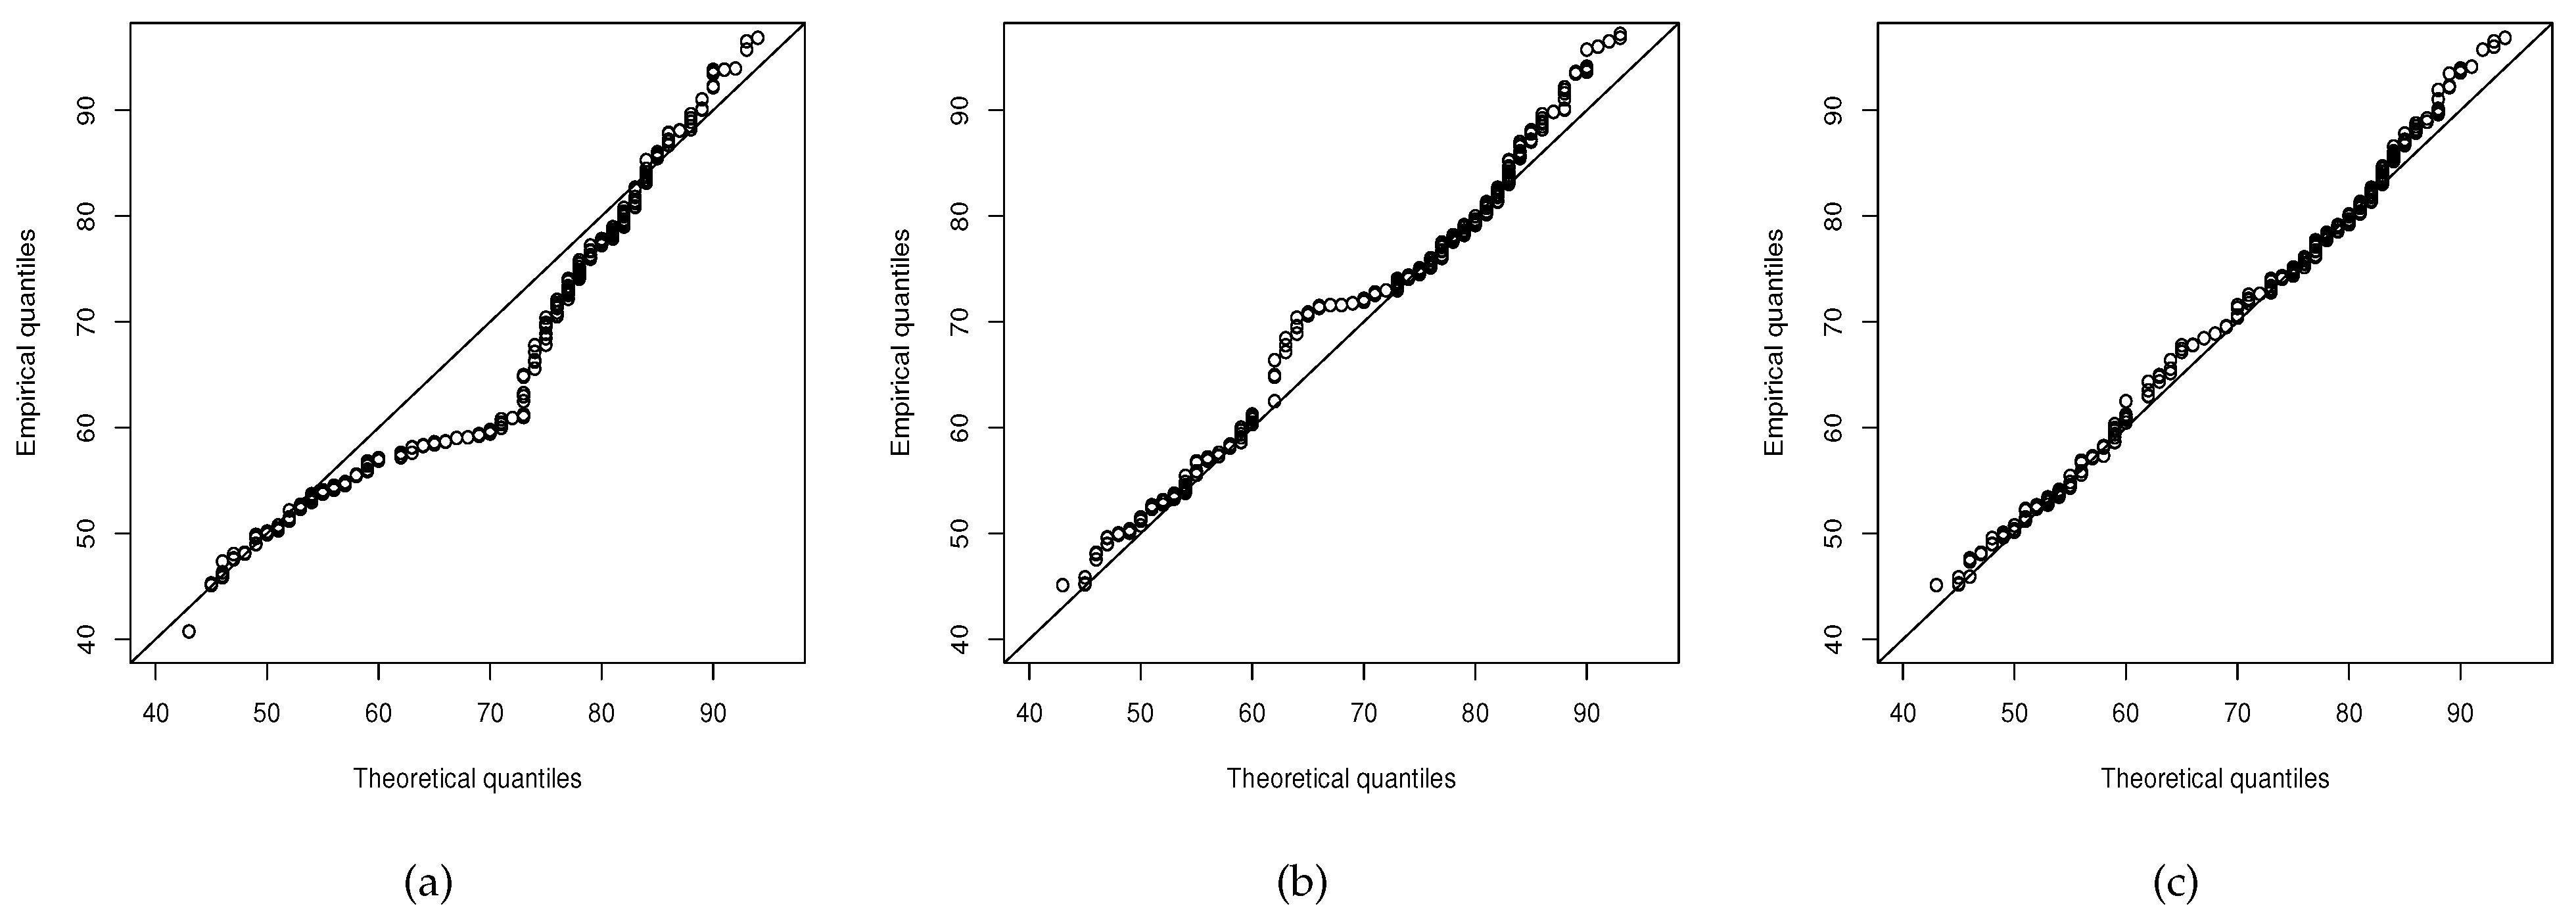
5.3. Illustrative Example I with Real-World Data
5.4. Illustrative Example II with Real-World Data
6. Conclusions, Limitations and Future Investigation
Author Contributions
Funding
Institutional Review Board Statement
Informed Consent Statement
Data Availability Statement
Acknowledgments
Conflicts of Interest
References
- Johnson, N.L.; Kotz, S.; Balakrishnan, N. Continuous Univariate Distributions; Wiley: New York, NY, USA, 1994; Volume 1–2. [Google Scholar]
- Balakrishnan, N.; Gupta, R.C.; Kundu, D.; Leiva, V.; Sanhueza, A. On some mixture models based on the Birnbaum-Saunders distribution and associated inference. J. Stat. Plan. Inference 2011, 141, 2175–2190. [Google Scholar] [CrossRef]
- Birnbaum, Z.W.; Saunders, S.C. A new family of life distributions. J. Appl. Probab. 1969, 6, 319–327. [Google Scholar] [CrossRef]
- Leiva, V.; Saunders, S.C. Cumulative damage models. In Wiley StatsRef: Statistics Reference Online; Wiley: Hoboken, NJ, USA, 2015; pp. 1–10. [Google Scholar]
- Leiva, V. The Birnbaum-Saunders Distribution; Academic Press: New York, NY, USA, 2016. [Google Scholar]
- Balakrishnan, N.; Kundu, D. Birnbaum-Saunders distribution: A review of models, analysis, and applications. Appl. Stoch. Model. Bus. Ind. 2019, 35, 4–49. [Google Scholar] [CrossRef] [Green Version]
- Leao, J.; Leiva, V.; Saulo, H.; Tomazella, V. Incorporation of frailties into a cure rate regression model and its diagnostics and application to melanoma data. Stat. Med. 2018, 37, 4421–4440. [Google Scholar] [CrossRef]
- Balakrishnan, N.; Leiva, V.; Sanhueza, A.; Vilca, F. Estimation in the Birnbaum-Saunders distribution based on scale-mixture of normals and the EM-algorithm. Stat. Oper. Res. Trans. 2009, 33, 171–192. [Google Scholar]
- Bhatti, C. The Birnbaum-Saunders autoregressive conditional duration model. Math. Comput. Simul. 2010, 80, 2062–2078. [Google Scholar] [CrossRef]
- Kotz, S.; Leiva, V.; Sanhueza, A. Two new mixture models related to the inverse Gaussian distribution. Methodol. Comput. Appl. Probab. 2010, 12, 199–212. [Google Scholar] [CrossRef]
- Aslam, M.; Jun, C.H.; Ahmad, M. New acceptance sampling plans based on life tests for Birnbaum-Saunders distributions. J. Stat. Comput. Simul. 2011, 81, 461–470. [Google Scholar] [CrossRef]
- Santos-Neto, M.; Cysneiros, F.J.A.; Leiva, V.; Barros, M. On a reparameterized Birnbaum-Saunders distribution and its moments, estimation and applications. REVSTAT Stat. J. 2014, 12, 247–272. [Google Scholar]
- Marchant, C.; Leiva, V.; Cysneiros, F.J.A. A multivariate log-linear model for Birnbaum-Saunders distributions. IEEE Trans. Reliab. 2016, 65, 816–827. [Google Scholar] [CrossRef]
- Garcia-Papani, F.; Leiva, V.; Uribe-Opazo, M.A.; Aykroyd, R.G. Birnbaum-Saunders spatial regression models: Diagnostics and application to chemical data. Chemom. Intell. Lab. Syst. 2018, 177, 114–128. [Google Scholar] [CrossRef] [Green Version]
- Athayde, E.; Azevedo, A.; Barros, M.; Leiva, V. Failure rate of Birnbaum-Saunders distributions: Shape, change-point, estimation and robustness. Braz. J. Probab. Stat. 2019, 33, 301–328. [Google Scholar] [CrossRef] [Green Version]
- Chaves, N.L.; Azevedo, C.L.; Vilca, F.; Nobre, J.S. A new Birnbaum-Saunders type distribution based on the skew-normal model under a centered parameterization. Chil. J. Stat. 2019, 10, 55–76. [Google Scholar]
- Mazucheli, J.; Menezes, A.F.B.; Dey, S. The unit Birnbaum-Saunders distribution with applications. Chil. J. Stat. 2018, 9, 47–57. [Google Scholar]
- Leiva, V.; Marchant, C.; Ruggeri, F.; Saulo, H. A criterion for environmental assessment using Birnbaum-Saunders attribute control charts. Environmetrics 2015, 26, 463–476. [Google Scholar] [CrossRef]
- Arrué, J.; Arellano, R.; Gomez, H.W.; Leiva, V. On a new type of Birnbaum-Saunders models and its inference and application to fatigue data. J. Appl. Stat. 2020, 47, 2690–2710. [Google Scholar] [CrossRef]
- Sanchez, L.; Leiva, V.; Galea, M.; Saulo, H. Birnbaum-Saunders quantile regression models with application to spatial data. Mathematics 2020, 8, 1000. [Google Scholar] [CrossRef]
- Mazucheli, M.; Leiva, V.; Alves, B.; Menezes, A.F.B. A new quantile regression for modeling bounded data under a unit Birnbaum-Saunders distribution with applications in medicine and politics. Symmetry 2021, 13, 682. [Google Scholar] [CrossRef]
- Balakrishnan, N.; Leiva, V.; López, J. Acceptance sampling plans from truncated life tests based on the generalized Birnbaum-Saunders distribution. Commun. Stat. Simul. Comput. 2007, 36, 643–656. [Google Scholar] [CrossRef]
- Marchant, C.; Leiva, V.; Cavieres, M.F.; Sanhueza, A. Air contaminant statistical distributions with application to PM10 in Santiago, Chile. Rev. Environ. Contam. Toxicol. 2013, 223, 1–31. [Google Scholar]
- Martinez, S.; Giraldo, R.; Leiva, V. Birnbaum-Saunders functional regression models for spatial data. Stoch. Environ. Res. Risk Assess. 2019, 33, 1765–1780. [Google Scholar] [CrossRef]
- Kannan, G.; Jeyadurga, P.; Balamurali, S. Economic design of repetitive group sampling plan based on truncated life test under Birnbaum—Saunders distribution. Commun. Stat. Simul. Comput. 2021. [Google Scholar] [CrossRef]
- Olmos, N.M.; Martínez-Flórez, G.; Bolfarine, H. Bimodal Birnbaum-Saunders distribution with applications to non negative measurements. Commun. Stat. Theory Methods 2017, 46, 6240–6257. [Google Scholar] [CrossRef]
- Vila, R.; Leao, J.; Saulo, H.; Nabeed, M.; Santos-Neto, M. On a bimodal Birnbaum-Saunders distribution with applications to lifetime data. Braz. J. Probab. Stat. 2020, 34, 495–518. [Google Scholar] [CrossRef]
- Leiva, V.; Tejo, M.; Guiraud, P.; Schmachtenberg, O.; Orio, P.; Marmolejo, F. Modeling neural activity with cumulative damage distributions. Biol. Cybern. 2015, 109, 421–433. [Google Scholar] [CrossRef]
- Elal-Olivero, D. Alpha-skew-normal distribution. Proyecciones 2010, 29, 224–240. [Google Scholar] [CrossRef] [Green Version]
- Ng, H.K.T.; Kundu, D.; Balakrishnan, N. Modified moment estimation for the two-parameter Birnbaum–Saunders distribution. Comput. Stat. Data Anal. 2003, 43, 283–298. [Google Scholar] [CrossRef]
- Azzalini, A.; Bowman, A.W. A look at some data on the old faithful geyser. J. R. Stat. Soc. C 1990, 39, 357–365. [Google Scholar] [CrossRef]
- Reigner, B.G.; Welker, H.A. Factors influencing elimination and distribution of fleroxacin: Metaanalysis of individual data from 10 pharmacokinetic studies. Antimicrob. Agent Chemother. 1996, 40, 575–580. [Google Scholar] [CrossRef] [Green Version]
- Aykroyd, R.G.; Leiva, V.; Marchant, C. Multivariate Birnbaum-Saunders distributions: Modelling and applications. Risks 2018, 6, 21. [Google Scholar] [CrossRef] [Green Version]
- Puentes, R.; Marchant, C.; Leiva, V.; Figueroa-Zúñiga, J.I.; Ruggeri, F. Predicting PM2.5 and PM10 levels during critical episodes management in Santiago, Chile, with a bivariate Birnbaum-Saunders log-linear model. Mathematics 2021, 9, 645. [Google Scholar] [CrossRef]
- Marchant, C.; Leiva, V.; Cysneiros, F.J.A.; Liu, S. Robust multivariate control charts based on Birnbaum-Saunders distributions. J. Stat. Comput. Simul. 2018, 88, 182–202. [Google Scholar] [CrossRef]
- Saulo, H.; Leao, J.; Vila, R.; Leiva, V.; Tomazella, V. On mean-based bivariate Birnbaum-Saunders distributions: Properties, inference and application. Commun. Stat. Theory Methods 2020, 49, 6032–6056. [Google Scholar] [CrossRef]
- Dasilva, A.; Dias, R.; Leiva, V.; Marchant, C.; Saulo, H. Birnbaum-Saunders regression models: A comparative evaluation of three approaches. J. Stat. Comput. Simul. 2020, 90, 2552–2570. [Google Scholar] [CrossRef]
- Leiva, V.; Saulo, H.; Souza, R.; Aykroyd, R.G.; Vila, R. A new BISARMA time series model for forecasting mortality using weather and particulate matter data. J. Forecast. 2021, 40, 346–364. [Google Scholar] [CrossRef]
- Saulo, H.; Leao, J.; Leiva, V.; Aykroyd, R.G. Birnbaum-Saunders autoregressive conditional duration models applied to high-frequency financial data. Stat. Pap. 2019, 60, 1605–1629. [Google Scholar] [CrossRef] [Green Version]
- Huerta, M.; Leiva, V.; Liu, S.; Rodriguez, M.; Villegas, D. On a partial least squares regression model for asymmetric data with a chemical application in mining. Chemom. Intell. Lab. Syst. 2019, 190, 55–68. [Google Scholar] [CrossRef]
- Rodriguez, M.; Leiva, V.; Huerta, M.; Lillo, M.; Tapia, A.; Ruggeri, F. An asymmetric area model-based approach for small area estimation applied to survey data. REVSTAT Stat. J. 2021, 19, 399–420. [Google Scholar]
- Costa, E.; Santos-Neto, M.; Leiva, V. Optimal sample size for the Birnbaum-Saunders distribution under decision theory with symmetric and asymmetric loss functions. Symmetry 2021, 13, 926. [Google Scholar] [CrossRef]
- Martin-Barreiro, C.; Ramirez-Figueroa, J.A.; Nieto, A.B.; Leiva, V.; Martin-Casado, A.; Galindo-Villardón, M.P. A new algorithm for computing disjoint orthogonal components in the three-way Tucker model. Mathematics 2021, 9, 203. [Google Scholar] [CrossRef]
- Martin-Barreiro, C.; Ramirez-Figueroa, J.A.; Cabezas, X.; Leiva, V.; Galindo-Villardón, M.P. Disjoint and functional principal component analysis for infected cases and deaths due to COVID-19 in South American countries with sensor-related data. Sensors 2021, 21, 4094. [Google Scholar] [CrossRef] [PubMed]
- Desousa, M.; Saulo, H.; Leiva, V.; Scalco, P. On a tobit-Birnbaum-Saunders model with an application to medical data. J. Appl. Stat. 2018, 45, 932–955. [Google Scholar] [CrossRef]
- de La Fuente-Mella, H.; Rubilar, R.; Chahuan-Jimenez, K.; Leiva, V. Modeling COVID-19 cases statistically and evaluating their effect on the economy of countries. Mathematics 2021, 9, 1558. [Google Scholar] [CrossRef]
- Azevedo, C.; Leiva, V.; Athayde, E.; Balakrishnan, N. Shape and change point analyses of the Birnbaum-Saunders-t hazard rate and associated estimation. Comput. Stat. Data Anal. 2012, 56, 3887–3897. [Google Scholar] [CrossRef] [Green Version]


| Framework | Item | Cause | Threshold | Effect | Random Variable |
|---|---|---|---|---|---|
| Environmental | Chemical element | Contamination | Target | Emergence | Content |
| Fatigue | Material | Damage | Rupture | Failure | Fatigue life |
| Health metric | Patient | Impulse | To die | Death | Death time |
| Neural spiking | Neuron | Voltage | Firing | Spike | Inter-spike time |
| n | Mean | SD | ALI | C | Mean | SD | ALI | C | Mean | SD | ALI | C | |||
|---|---|---|---|---|---|---|---|---|---|---|---|---|---|---|---|
| 50 | 0.1 | 0.2 | 0.8 | 0.0992 | 0.0067 | 0.0261 | 94.90 | 0.2003 | 0.0036 | 0.0143 | 94.80 | 1.0105 | 0.5855 | 2.2953 | 93.44 |
| 100 | 0.1 | 0.2 | 0.8 | 0.0995 | 0.0047 | 0.0183 | 95.22 | 0.2001 | 0.0024 | 0.0093 | 95.04 | 0.8951 | 0.3361 | 1.3174 | 94.30 |
| 150 | 0.1 | 0.2 | 0.8 | 0.0998 | 0.0038 | 0.0148 | 95.00 | 0.2001 | 0.0020 | 0.0078 | 95.34 | 0.8505 | 0.2367 | 0.9278 | 94.36 |
| 200 | 0.1 | 0.2 | 0.8 | 0.0998 | 0.0033 | 0.0128 | 95.06 | 0.2001 | 0.0017 | 0.0066 | 94.98 | 0.8489 | 0.2089 | 0.8188 | 94.64 |
| 50 | 0.2 | 0.3 | 0.5 | 0.1974 | 0.0165 | 0.0646 | 94.36 | 0.3019 | 0.0138 | 0.0541 | 94.70 | 0.6083 | 0.3473 | 1.3615 | 94.18 |
| 100 | 0.2 | 0.3 | 0.5 | 0.1983 | 0.0114 | 0.0446 | 94.58 | 0.3014 | 0.0094 | 0.0369 | 94.48 | 0.5549 | 0.1918 | 0.7518 | 93.60 |
| 150 | 0.2 | 0.3 | 0.5 | 0.1991 | 0.0095 | 0.0371 | 94.46 | 0.3006 | 0.0076 | 0.0299 | 94.94 | 0.5307 | 0.1422 | 0.5576 | 94.36 |
| 200 | 0.2 | 0.3 | 0.5 | 0.1994 | 0.0083 | 0.0325 | 94.72 | 0.3005 | 0.0067 | 0.0262 | 94.76 | 0.5212 | 0.1203 | 0.4714 | 95.16 |
| 50 | 0.5 | 0.5 | 0.5 | 0.4890 | 0.0601 | 0.2357 | 95.08 | 0.5220 | 0.0829 | 0.3248 | 93.90 | 0.6472 | 0.4457 | 1.7472 | 94.56 |
| 100 | 0.5 | 0.5 | 0.5 | 0.4947 | 0.0395 | 0.1550 | 95.06 | 0.5102 | 0.0537 | 0.2105 | 94.20 | 0.5576 | 0.2155 | 0.8447 | 94.28 |
| 150 | 0.5 | 0.5 | 0.5 | 0.4965 | 0.0323 | 0.1267 | 94.92 | 0.5067 | 0.0431 | 0.1690 | 94.64 | 0.5322 | 0.1494 | 0.5857 | 94.02 |
| 200 | 0.5 | 0.5 | 0.5 | 0.4971 | 0.0273 | 0.1071 | 94.56 | 0.5050 | 0.0365 | 0.1429 | 94.56 | 0.5233 | 0.1263 | 0.4951 | 94.32 |
| 50 | 0.5 | 0.8 | 0.2 | 0.4939 | 0.0439 | 0.1722 | 94.96 | 0.8191 | 0.0957 | 0.3751 | 94.26 | 0.2211 | 0.0969 | 0.3797 | 94.96 |
| 100 | 0.5 | 0.8 | 0.2 | 0.4978 | 0.0301 | 0.1179 | 94.90 | 0.8079 | 0.0643 | 0.2520 | 94.68 | 0.2075 | 0.0547 | 0.2143 | 94.86 |
| 150 | 0.5 | 0.8 | 0.2 | 0.4980 | 0.0245 | 0.0960 | 94.62 | 0.8061 | 0.0516 | 0.2024 | 94.56 | 0.2051 | 0.0440 | 0.1723 | 94.98 |
| 200 | 0.5 | 0.8 | 0.2 | 0.4986 | 0.0216 | 0.0846 | 95.12 | 0.8053 | 0.0451 | 0.1767 | 94.96 | 0.2035 | 0.0380 | 0.1492 | 95.04 |
| 50 | 0.5 | 0.8 | 0.4 | 0.4898 | 0.0560 | 0.2195 | 94.94 | 0.8309 | 0.1239 | 0.4858 | 93.92 | 0.4934 | 0.3101 | 1.2156 | 95.00 |
| 100 | 0.5 | 0.8 | 0.4 | 0.4955 | 0.0374 | 0.1466 | 94.30 | 0.8139 | 0.0823 | 0.3226 | 94.70 | 0.4366 | 0.1479 | 0.5797 | 94.48 |
| 150 | 0.5 | 0.8 | 0.4 | 0.4970 | 0.0305 | 0.1196 | 94.62 | 0.8100 | 0.0652 | 0.2558 | 94.76 | 0.4199 | 0.1089 | 0.4269 | 94.42 |
| 200 | 0.5 | 0.8 | 0.4 | 0.4975 | 0.0258 | 0.1011 | 94.74 | 0.8073 | 0.0554 | 0.2170 | 94.68 | 0.4151 | 0.0908 | 0.3559 | 94.52 |
| 50 | 0.8 | 0.8 | 0.1 | 0.7923 | 0.0670 | 0.2626 | 94.82 | 0.8212 | 0.1195 | 0.4685 | 94.62 | 0.1091 | 0.0397 | 0.1557 | 93.66 |
| 100 | 0.8 | 0.8 | 0.1 | 0.7961 | 0.0478 | 0.1872 | 94.68 | 0.8116 | 0.0830 | 0.3254 | 94.88 | 0.1037 | 0.0251 | 0.0983 | 94.82 |
| 150 | 0.8 | 0.8 | 0.1 | 0.7971 | 0.0386 | 0.1513 | 95.06 | 0.8079 | 0.0663 | 0.2600 | 94.62 | 0.1026 | 0.0200 | 0.0783 | 95.00 |
| 200 | 0.8 | 0.8 | 0.1 | 0.7971 | 0.0333 | 0.1303 | 94.80 | 0.8065 | 0.0564 | 0.2210 | 94.82 | 0.1023 | 0.0170 | 0.0667 | 94.68 |
| n | Mean | SD | ALI | C | Mean | SD | ALI | C | Mean | SD | ALI | C | |||
|---|---|---|---|---|---|---|---|---|---|---|---|---|---|---|---|
| 10 | 0.1 | 0.2 | 0.8 | 0.0928 | 0.0233 | 0.0912 | 97.44 | 0.2014 | 0.0143 | 0.0559 | 94.94 | 0.8100 | 0.0722 | 0.2829 | 95.06 |
| 25 | 0.1 | 0.2 | 0.8 | 0.0973 | 0.0123 | 0.0482 | 96.16 | 0.2007 | 0.0091 | 0.0357 | 95.02 | 0.8073 | 0.0624 | 0.2447 | 95.70 |
| 40 | 0.1 | 0.2 | 0.8 | 0.0984 | 0.0091 | 0.0357 | 94.88 | 0.2005 | 0.0074 | 0.0289 | 95.30 | 0.8044 | 0.0528 | 0.2070 | 96.56 |
| 10 | 0.2 | 0.3 | 0.5 | 0.1873 | 0.0491 | 0.1927 | 94.76 | 0.3094 | 0.0495 | 0.1939 | 94.88 | 0.5334 | 0.1666 | 0.6532 | 95.62 |
| 25 | 0.2 | 0.3 | 0.5 | 0.1953 | 0.0313 | 0.1228 | 95.10 | 0.3035 | 0.0309 | 0.1210 | 94.82 | 0.5232 | 0.1346 | 0.5276 | 95.08 |
| 40 | 0.2 | 0.3 | 0.5 | 0.1970 | 0.0249 | 0.0978 | 95.24 | 0.3025 | 0.0244 | 0.0956 | 94.88 | 0.5193 | 0.1175 | 0.4604 | 95.30 |
| 10 | 0.5 | 0.8 | 0.4 | 0.4925 | 0.0509 | 0.1996 | 98.22 | 0.7449 | 0.1350 | 0.5291 | 96.18 | 0.1278 | 1.3174 | 5.1644 | 98.66 |
| 25 | 0.5 | 0.8 | 0.4 | 0.4963 | 0.0482 | 0.1890 | 99.04 | 0.7608 | 0.1079 | 0.4231 | 93.90 | 0.1715 | 1.1857 | 4.6480 | 98.82 |
| 40 | 0.5 | 0.8 | 0.4 | 0.4973 | 0.0461 | 0.1806 | 98.98 | 0.7675 | 0.0948 | 0.3717 | 90.64 | 0.2090 | 0.8960 | 3.5124 | 97.96 |
| 10 | 0.5 | 0.5 | 0.5 | 0.5017 | 0.0509 | 0.1995 | 98.06 | 0.4818 | 0.0842 | 0.3302 | 90.06 | 0.4354 | 0.4059 | 1.5909 | 88.36 |
| 25 | 0.5 | 0.5 | 0.5 | 0.4994 | 0.0327 | 0.1282 | 98.38 | 0.4961 | 0.0466 | 0.1825 | 96.06 | 0.4963 | 0.2398 | 0.9402 | 95.68 |
| 40 | 0.5 | 0.5 | 0.5 | 0.4996 | 0.0171 | 0.0670 | 95.84 | 0.4986 | 0.0336 | 0.1316 | 96.50 | 0.5030 | 0.1781 | 0.6980 | 96.34 |
| Estimate/Indicator | BBS1 (SE) | BBS2 (SE) | BBS3 (SE) |
|---|---|---|---|
| 0.0898 (0.0045) | 0.1257 (0.0039) | 0.1042 (0.0027) | |
| 65.0852 (0.3740) | 66.9851 (0.4785) | 63.8997 (0.4378) | |
| −2.1242 (0.1392) | −3.8569 (0.0225) | 1.7480 (0.4438) | |
| Log-likelihood | −1054.180 | −1050.573 | −1036.824 |
| AIC | 2114.360 | 2107.146 | 2079.648 |
| BIC | 2129.325 | 2122.111 | 2090.465 |
| KS statistic | 0.1764 | 0.0808 | 0.0735 |
| KS p-value | 0.0004 | 0.3359 | 0.454 |
| n | Mean | SD | CS | CK |
|---|---|---|---|---|
| 172 | 69.623 | 38.0311 | −0.2112 | 2.1637 |
| Estimate/Indicator | BBS1 (SE) | BBS1 (SE) | BBS3 (SE) |
|---|---|---|---|
| 0.4308 (0.0252) | 0.6976 (0.0283) | 0.6784 (0.0442) | |
| 27.9125 (0.9800) | 31.7897 (1.4594) | 15.6625 (1.5963) | |
| −2.5689 (0.1831) | −2.6272 (0.3830) | 0.4213 (0.1031) | |
| Log-likelihood | −870.4175 | −851.217 | −838.790 |
| AIC | 1746.835 | 1708.434 | 1683.580 |
| BIC | 1756.277 | 1717.876 | 1692.602 |
| KS statistic | 0.0698 | 0.0640 | 0.0407 |
| KS p-value | 0.4329 | 0.4949 | 0.7521 |
Publisher’s Note: MDPI stays neutral with regard to jurisdictional claims in published maps and institutional affiliations. |
© 2021 by the authors. Licensee MDPI, Basel, Switzerland. This article is an open access article distributed under the terms and conditions of the Creative Commons Attribution (CC BY) license (https://creativecommons.org/licenses/by/4.0/).
Share and Cite
Reyes, J.; Arrué, J.; Leiva, V.; Martin-Barreiro, C. A New Birnbaum–Saunders Distribution and Its Mathematical Features Applied to Bimodal Real-World Data from Environment and Medicine. Mathematics 2021, 9, 1891. https://doi.org/10.3390/math9161891
Reyes J, Arrué J, Leiva V, Martin-Barreiro C. A New Birnbaum–Saunders Distribution and Its Mathematical Features Applied to Bimodal Real-World Data from Environment and Medicine. Mathematics. 2021; 9(16):1891. https://doi.org/10.3390/math9161891
Chicago/Turabian StyleReyes, Jimmy, Jaime Arrué, Víctor Leiva, and Carlos Martin-Barreiro. 2021. "A New Birnbaum–Saunders Distribution and Its Mathematical Features Applied to Bimodal Real-World Data from Environment and Medicine" Mathematics 9, no. 16: 1891. https://doi.org/10.3390/math9161891
APA StyleReyes, J., Arrué, J., Leiva, V., & Martin-Barreiro, C. (2021). A New Birnbaum–Saunders Distribution and Its Mathematical Features Applied to Bimodal Real-World Data from Environment and Medicine. Mathematics, 9(16), 1891. https://doi.org/10.3390/math9161891