1. Introduction
While the fight to find an effective and permanent cure for COVID-19 continues to challenge scientists, great progress has been made in discovering new information and successful treatments to end this disease.
An important number of mathematical modeling studies have been performed for the COVID-19 epidemic, all of them mainly based on the classical epidemiological model called the susceptible-exposed-infectious-recovered (SEIR) model in order to describe the epidemiological aspects of the transmission dynamics [
1,
2,
3,
4,
5,
6,
7]; however, none of these (and, to our knowledge, none others) have attempted to describe the infection dynamics between the immune system and the virus emphasizing the role of the immune system in the control of the disease.
Usually, coronaviruses infect only the upper respiratory tract and cause simple symptoms. However, more complex coronaviruses (severe acute respiratory syndrome coronavirus (SARS-CoV), Middle East respiratory syndrome coronavirus (MERS-CoV), and SARS-CoV-2 also called COVID-19 virus) can reproduce in the lower respiratory tract, causing pneumonia, which can cause death. For the case of SARS-CoV-2, the virus is transmitted through respiratory droplets and the median incubation period is approximately 4–5 days [
8,
9,
10,
11] and before symptom onset is 6–9 days, with 97.5% of symptomatic patients developing symptoms within 11.5 days [
10]. Most patients with COVID-19 infection typically exhibit a fever and dry cough as some of the main symptoms. Some previous works on SARS-CoV demonstrated that this virus mainly targets airway epithelial cells [
12].
Once a COVID-19 infection begins, there is destruction of epithelial cells, triggering an immune response. The first line of defense is the recruitment of macrophages responding to the damage; at the same time, the secretion of some pro-inflammatory cytokines and chemokines IL-6 and IFN
γ, among others [
13], attracts immune cells, notably T-lymphocytes and B-cells, but more specifically helper T-lymphocytes
of class 1 [
14]. Clinical evidence shows that these cytokine storms mediate lung inflammation, causing septic shock and multi-organ failure, additionally higher levels of interleukines exhibit a dysfunctional immune response [
13].
It is remarkable then that much of the evidence points to a failure in the immune system. B cell responses in patients with COVID-19 occur in accordance with helper T-lymphocytes responses, from around 1 week after symptom onset [
12,
15]. At the beginning of infection, B-cell response in patients typically arises against the N-protein (nucleocapsid protein); then, between day 4 and day 8, antibodies that respond to the S-protein are found [
16,
17], the immune response continues, and it has been found that an antibody-neutralizing reaction begins to develop by week 2, but most usually do it until week 3 [
18,
19]. Given that viral titres peak earlier for SARS-CoV-2 than for SARS-CoV16–19, antibody responses may also arise earlier [
12]. Thus, it seems that immunotherapy with antibodies are likely to be effective against SARS-CoV-2: convalescent serum samples have been infused in clinical trials with apparently good results [
20] and were also previously used successfully in clinics against SARS [
12,
21,
22].
On the other hand, we found another response, one of the adaptive immune system. Here it has been seen that T-cells, both T-lymphocytes, responsible for annihilating virus-infected cells, and helper T-lymphocytes, responsible for cytokine production, which drives immune cell recruitment, are detected around the first week of infection, normally in blood; however, cytotoxic T-lymphocytes are responsible for annihilating virus-infected cells [
12]. Reports of lymphopenia and reduced peripheral T cell levels in COVID-19 patients suggest that T-lymphocytes migrate to the infected site in order to control the infection [
8,
23,
24]. Additionally, it has been found that T cell exhaustion is increased and that functional diversity is decreased, all together predicting a severe form of the disease [
12,
25].
Considering the above evidence, we cannot deny the important role of T-lymphocytes in immune function; nevertheless, several vaccine protocols tested in animals with coronavirus infections showed signs of immunopatologhy associated with helper T-lymphocytes of class 2 rather than protection [
12,
26], so it seems hard in this moment to use some type of T cell-based immunotherapy to alleviate the effects of infection; however, coronavirus-specific T lymphocytes are clearly important in eliminating the virus and controlling disease development and should be considered as immunotherapy strategies [
12].
In this paper, we attempt to model and simulate the novel coronavirus COVID-19 infection in a very simple way. We built a mathematical model of delay differential equations describing a simplified view of the mechanism between the COVID-19 virus and the immune system. The model shows the interactions of cellular and humoral immune responses in terms of the main variables characteristic of the immune response, trying to verify the damage caused by infection in the target organ. Additionally, we proposed two different immunotherapies, one based on the increase in specific antibodies and the other based on the increase in cytotoxic T-lymphocytes. Our numerical results indicate that theorethical immunotherapies are successful in erradicating COVID-19 infections.
The paper is organized as follows: The first section presents an introduction to the novel coronavirus, emphasizing parts of the immune system. The second section presents the mathematical model. The third section presents some numerical results, and finally,
Section 4 presents some concluding remarks.
2. The Mathematical Model
The model that is studied provides a oversimplified view of the interplays between the COVID-19 virus and the immune system, where we proposed that the disease could be treated with immunotherapy. It is important to mention that the system of equations that we propose is similar to that used by Marchuk et al. [
27] for influenza A, although it has been modified to study the infection by COVID-19.
Let us consider the biological meaning of the model’s variables in the context of some processes happening inside the body. The infection processes, multiplication, and annihilation of damaged epithelial cells are localized in the upper and middle parts of respiratory tracts [
27]. The processes of immune reaction occur in a compartment of lymphoid tissue. Neutralization of viruses by antibodies and the annihilation of infected cells by T-lymphocytes takes place in the middle of the respiratory tracts. Taking the latter into account, the model’s variables for antiviral immune response to COVID-19 can be defined as follows:
, concentration of free viruses (particle/mL);
, concentration macrophages that have been stimulated and are localized in the lymphoid tissue (cell/mL);
, concentration of helper T-lymphocytes class 1 that have been activated and mediate the proliferation of cytotoxic T-lymphocytes in lymphoid tissue (cell/mL);
, concentration of class 2 helper T-lymphocytes that have been activated and mediate the proliferation of B-lymphocytes (cell/mL);
, concentration of cytotoxic T-lymphocytes that have been activated in lymphoid tissue (cell/mL);
, concentration of B-lymphocytes in lymphoid tissue (cell/mL);
, concentration of plasma cells (cell/mL);
, concentration of IgG antibody molecules specific to COVID-19 viruses (molecule/mL);
, concentration cells infected by viruses (particularly, the epithelial ones) (cell/mL); and
, concentration of damaged cells (cell/mL).
Then, in order to investigate the properties of the immune system and its dynamical behavior against the COVID-19 virus, a set of mathematical delay differential equations was formulated. Let us then consider the mathematical model proposed mainly based on the work of Marchuk G. et al. [
27].
2.1. Mathematical Equation for the Viruses Circulating Freely in an Organism
The term on the left-hand side of Equation (
1) represents the rate of change in the virus population
, and the first term on the right-hand side indicates the growth of the virus population; a logistic growth law was considered when the viruses are reproduced in the infected cells
. The constant
depends on the rate of replication of viruses; Finally, the parameter
is the so-called carrying capacity (the limit of the maximum population of cells that can be infected).
It is important to notice that Bartholdy et al. [
28], Wodarz et al. [
29], and Arnaout et al. [
30] found that the turnover of free viruses is much faster than that of infected cells, which allowed them to make a quasi-steady-state assumption, that is, the amount of free virus is simply proportional to the number of infected cells. Based on the latter, we consider that free viruses follow similar population dynamics as the host cells. It is well documented that COVID-19 viruses are characterized by a high rate of replication in epithelial cells (1 to 3 days) after the infection; their concentration increases up to
to
(particle/mL), conserved within this range.
It is important to notice that new viruses produced in infected cells return to the plasma as “free viruses”.This stimulus transforms the antigen-presenting cells M into activated macrophages , in turn, producing the annihilation of viruses by antibodies. The following term explains the viruses that abandon the infected cells once the cytotoxic lymphocytes annihilate them.
The third and the fourth terms represent the elimination of free viruses by the interaction with cytotoxic T-lymphocytes and antibodies, respectively. It is worthwhile to mentioning that the variable serves also as a characteristic of edema (build-up of fluid in the body’s tissue that increases pulse rate and raises body temperature; it is thought that it is a defense reaction to the infection by viruses), and the function describes the amplification of two processes: the neutralization and the destruction of , and , respectively. This variable pretends to be related to the increase in the arterial tension for this model.
Additionally, the last two terms report a decrease in the number of viruses caused by the interaction with macrophages and the influence of the invasion of free viruses into healthy cells that became infected , respectively.
2.2. Mathematical Equation for the Stimulated (Antigen-Presenting Cells) Macrophages
Equation (
2) describes the population dynamics of antigen-presenting cells, i.e., the dynamics of the number of macrophages bound to viruses (stimulated macrophages)
. The first term represents the increase in the number of macrophages due to an interaction with antigens (viruses). The second term takes into account natural decrease in the number of macrophages.
2.3. Mathematical Equation for Helper Lymphocytes of Innate Immunity
Equation (
3) is a balanced equation for class 1 helper lymphocytes
; this specific type of lymphocytes provides proliferation of the cytotoxic T-cells. The first term in this equation represents the increment of helper T-lymphocytes due to their interaction with the presenting cells; particularly for this case, the stimulated macrophages are the only presented cells considered. The contact between the antigen-presenting cells
and the helper T-lymphocytes
class 1 expands the population of
cells at a rate
. This expansion is given after the interaction with the stimulated macrophages
, which happens at time
between the macrophages and the activated cytotoxic lymphocytes. The second term expresses the death of the activated helper T-lymphocytes
once the division cycle starts after contact with stimulated macrophages; all of this happens at a rate
. Finally, the maintenance of
cell homeostasis is described in the third term, which is equal to
, when the organism has no reaction to antigens; this happens at a constant rate given by
.
2.4. Mathematical Equation for Helper Lymphocytes of Innate Immunity
Equation (
4) is a balanced equation for class 2 helper lymphocytes
, this specific type of lymphocyte provides proliferation of the B-lymphocytes of innate immunity B(t). The first term in this equation represents the increment of helper T-lymphocytes due to their interaction with the macrophages stimulated by the virus. This expansion shows a rate of
, given for the contact between the macrophages and the
helper lymphocytes cells. The expansion is given after the interaction with the stimulated macrophages
and occurs at a contact time of
. The second term expresses the death of the activated helper T-lymphocytes
once the division cycle starts after contact with stimulated macrophages; all this happens at a rate
. Finally, the maintenance of
cell homeostasis is described in the third term, which is equal to
, when the organism has no reaction to antigens; this happens at a constant rate given by
.
2.5. Mathematical Equation for Cytotoxic T-Cells of Adaptive Immunity
The dynamic of activated cytotoxic T-limphocytes (CTLs),
, is described in Equation (
5). The first term takes into account the expansion of CTLs and its activation. It is considered that the double interaction between the antigen-presenting cells stimulated by virus and the helper TH1 lymphocytes with the inactive cytotoxic lymphocytes begins their activation. It is proposed that this increase happens at a rate
. Additionally, it is considered that the encounter between the inactivated cytotoxic cells and the macrophages and the TH1 cells occurs at a time
. The second term in Equation (
5) represents the decrease in population of CTLs through the elimination of cells infected by virus
; all this happens at a rate
.
This term shows the well-studied phenomenon of the destruction of virus-infected cells by means of cytotoxic CD8 lymphocytes that includes their adherence to these cells until their lysis. More specifically, this interplay between the lymphocytes and the infected cells can be divided into three well-identified phases: (i) the union of the lymphocyte to cell, (ii) the generation of a lethal hit (preparation for its lysis), and (iii) the annihilation of the cell Macken et al. [
31]. In the laboratory, the first step is complex because the lymphocyte has to identify the virus-infected cell followed by a recognition process so that finally the lymphocyte adheres to the infected cell. In fact, motivated by the previous phenomenon (the cytotoxicity of CTLs), Perelson et al. [
32], Macken et al. [
31], and Perelson et al. [
33] developed a quantitative model where cytotoxicity mediated by lymphocytes was studied. In their study, they found (i) that cytotoxic lymphocytes annihilated infected cells by transferring lethal hits to the uninjured cells, (ii) that the time used in this programming for lysis is between 4 and 30 min, and (iii) that one cytotoxic lymphocyte can annihilate up to ten injured cells.
The authors also found a very interesting fact: the mean time between a lymphocyte finding an infected cell and its annihilation takes approximately 55 min. Moreover, if the mean time is measured for greater conjugates (one infected cell and three cytotoxic lymphocytes), it takes only around 30 min. Therefore, the term characterizes the shortening of CTL life spans due to their cytolytic activity against virus-infected target cells displaying class I MHC molecules (some biological evidence can be found in [
34,
35]). Finally, the last term expresses the maintenance of
cells homeostasis, which is equal to
when the organism has no reaction to antigens; this happens at a constant rate given by
.
2.6. Mathematical Equation for B-Lymphocytes of Innate Immunity
The dynamic of the B-lymphocytes of the compartment of lymphoid tissue draining the lungs,
, is described in Equation (
6). The first term takes into account the proliferation of B cells. It is considered that this proliferation is due to the double interaction between the macrophages stimulated by virus and the
lymphocytes with the inactive B cells producing their activation. It is proposed that this expansion is at a rate
. Additionally, it is considered that the encounter between the inactivated cytotoxic cells, the macrophages, and the TH2 cells occurs at the time,
. The second term describes the decrease in B cells as a result of the double interaction with stimulated macrophages and the
cells, where
is the decreasing rate. Finally, the maintenance of B cells homeostasis is described in the third term, which is equal to
, when the organism has no reaction to the antigens; this happens at a constant rate given by
.
2.7. Mathematical Equation for Plasma Cells
Equation (
7) is a balanced equation for the concentration of plasma cells
in lymphoid tissue draining the lungs. The first term takes into account the rate of creation of plasma cells by the interaction with the stimulated B-cells and the macrophages stimulated by virus
. The last term in Equation (
6) accounts for the natural death of these plasma cells at rate
.
2.8. Mathematical Equation for Antibodies
Equation (
8) expresses a balanced equation for antibodies
. The first term on the right-hand side considers the expansion of antibodies governed by a logistic delay equation. The coefficient
depends on the rate of reproduction of antibodies, and the parameter
is its carrying capacity (the limit of the maximum population of antibodies that can be produced); the second term expresses the decrease in antibodies due to the neutralization of viruses at a rate
.
2.9. Mathematical Equation for Cells of a Target Organ Infected by Viruses
The dynamic of the cells infected by virus is described in Equation (
9). The first term takes into account the number of healthy cells (
) that are transformed into infected cells by the action of “free” viruses at a rate
s, the second term represents the elimination of cells infected by virus caused by the interaction with the activated cytotoxic T-lymphocytes, and the natural death of the cells infected by virus is included in the last term of Equation (
9).
2.10. Mathematical Equation for the Malfunctioning Part of a Target Organ Affected by Viruses
The dynamic of the damaged mass of a tissue sensitive to virus,
, is presented in Equation (
10). The first two terms on the right-hand side describes the proliferation of cells eliminated by cytotoxic T-lymphocytes and the proliferation of malfunctioning cells affected by viruses at a rate
, and the natural death of
cells is included in the third term of Equation (
10).
2.11. Mathematical Equation for Body Temperature
It has been noticed that viremia is correlated highly with temperature; a particular case is observed for dengue patients (see, for example, Dengue fever in Tsai et al. [
36]). The results were in line with reports on the high correlation of body temperature with viral load in samples collected from patients for COVID-19 (see Muhammad H. G. et al. [
37]).
Usually, viremia kinetics are characterized by a downward trend, with a peak in the plasma viral RNA levels [
36]. Based on the latter, we suggest the following hypothesis about the mechanism of temperature changes (modeling these changes as an ODE) in the course of an infection disease: Based on clinical data, the initial presentation of the fever in COVID-19 in the first week, during the viral phase of the illness, is a manifestation of the body’s immune response to the viral replication.
Then, we assume that an increase in temperature is due to an increase in the viral load. However, after this increase in temperature, it is observed that, when the immune system acts and decreases the viral load, there is a decrease in temperature. This suggests that the relationship is not linear. We then assume that body temperature depends on the concentration of viruses in the organism. Then, the temperature does not rise if the concentration of viruses is under some threshold
. If the concentration of these viruses grows above the constant
, then we consider that the temperature is proportional to
. The equation that describes this behavior during the illness can be written as follows:
with,
Additionally, it is considered that the temperature of a body is normal when C.
3. Numerical Results
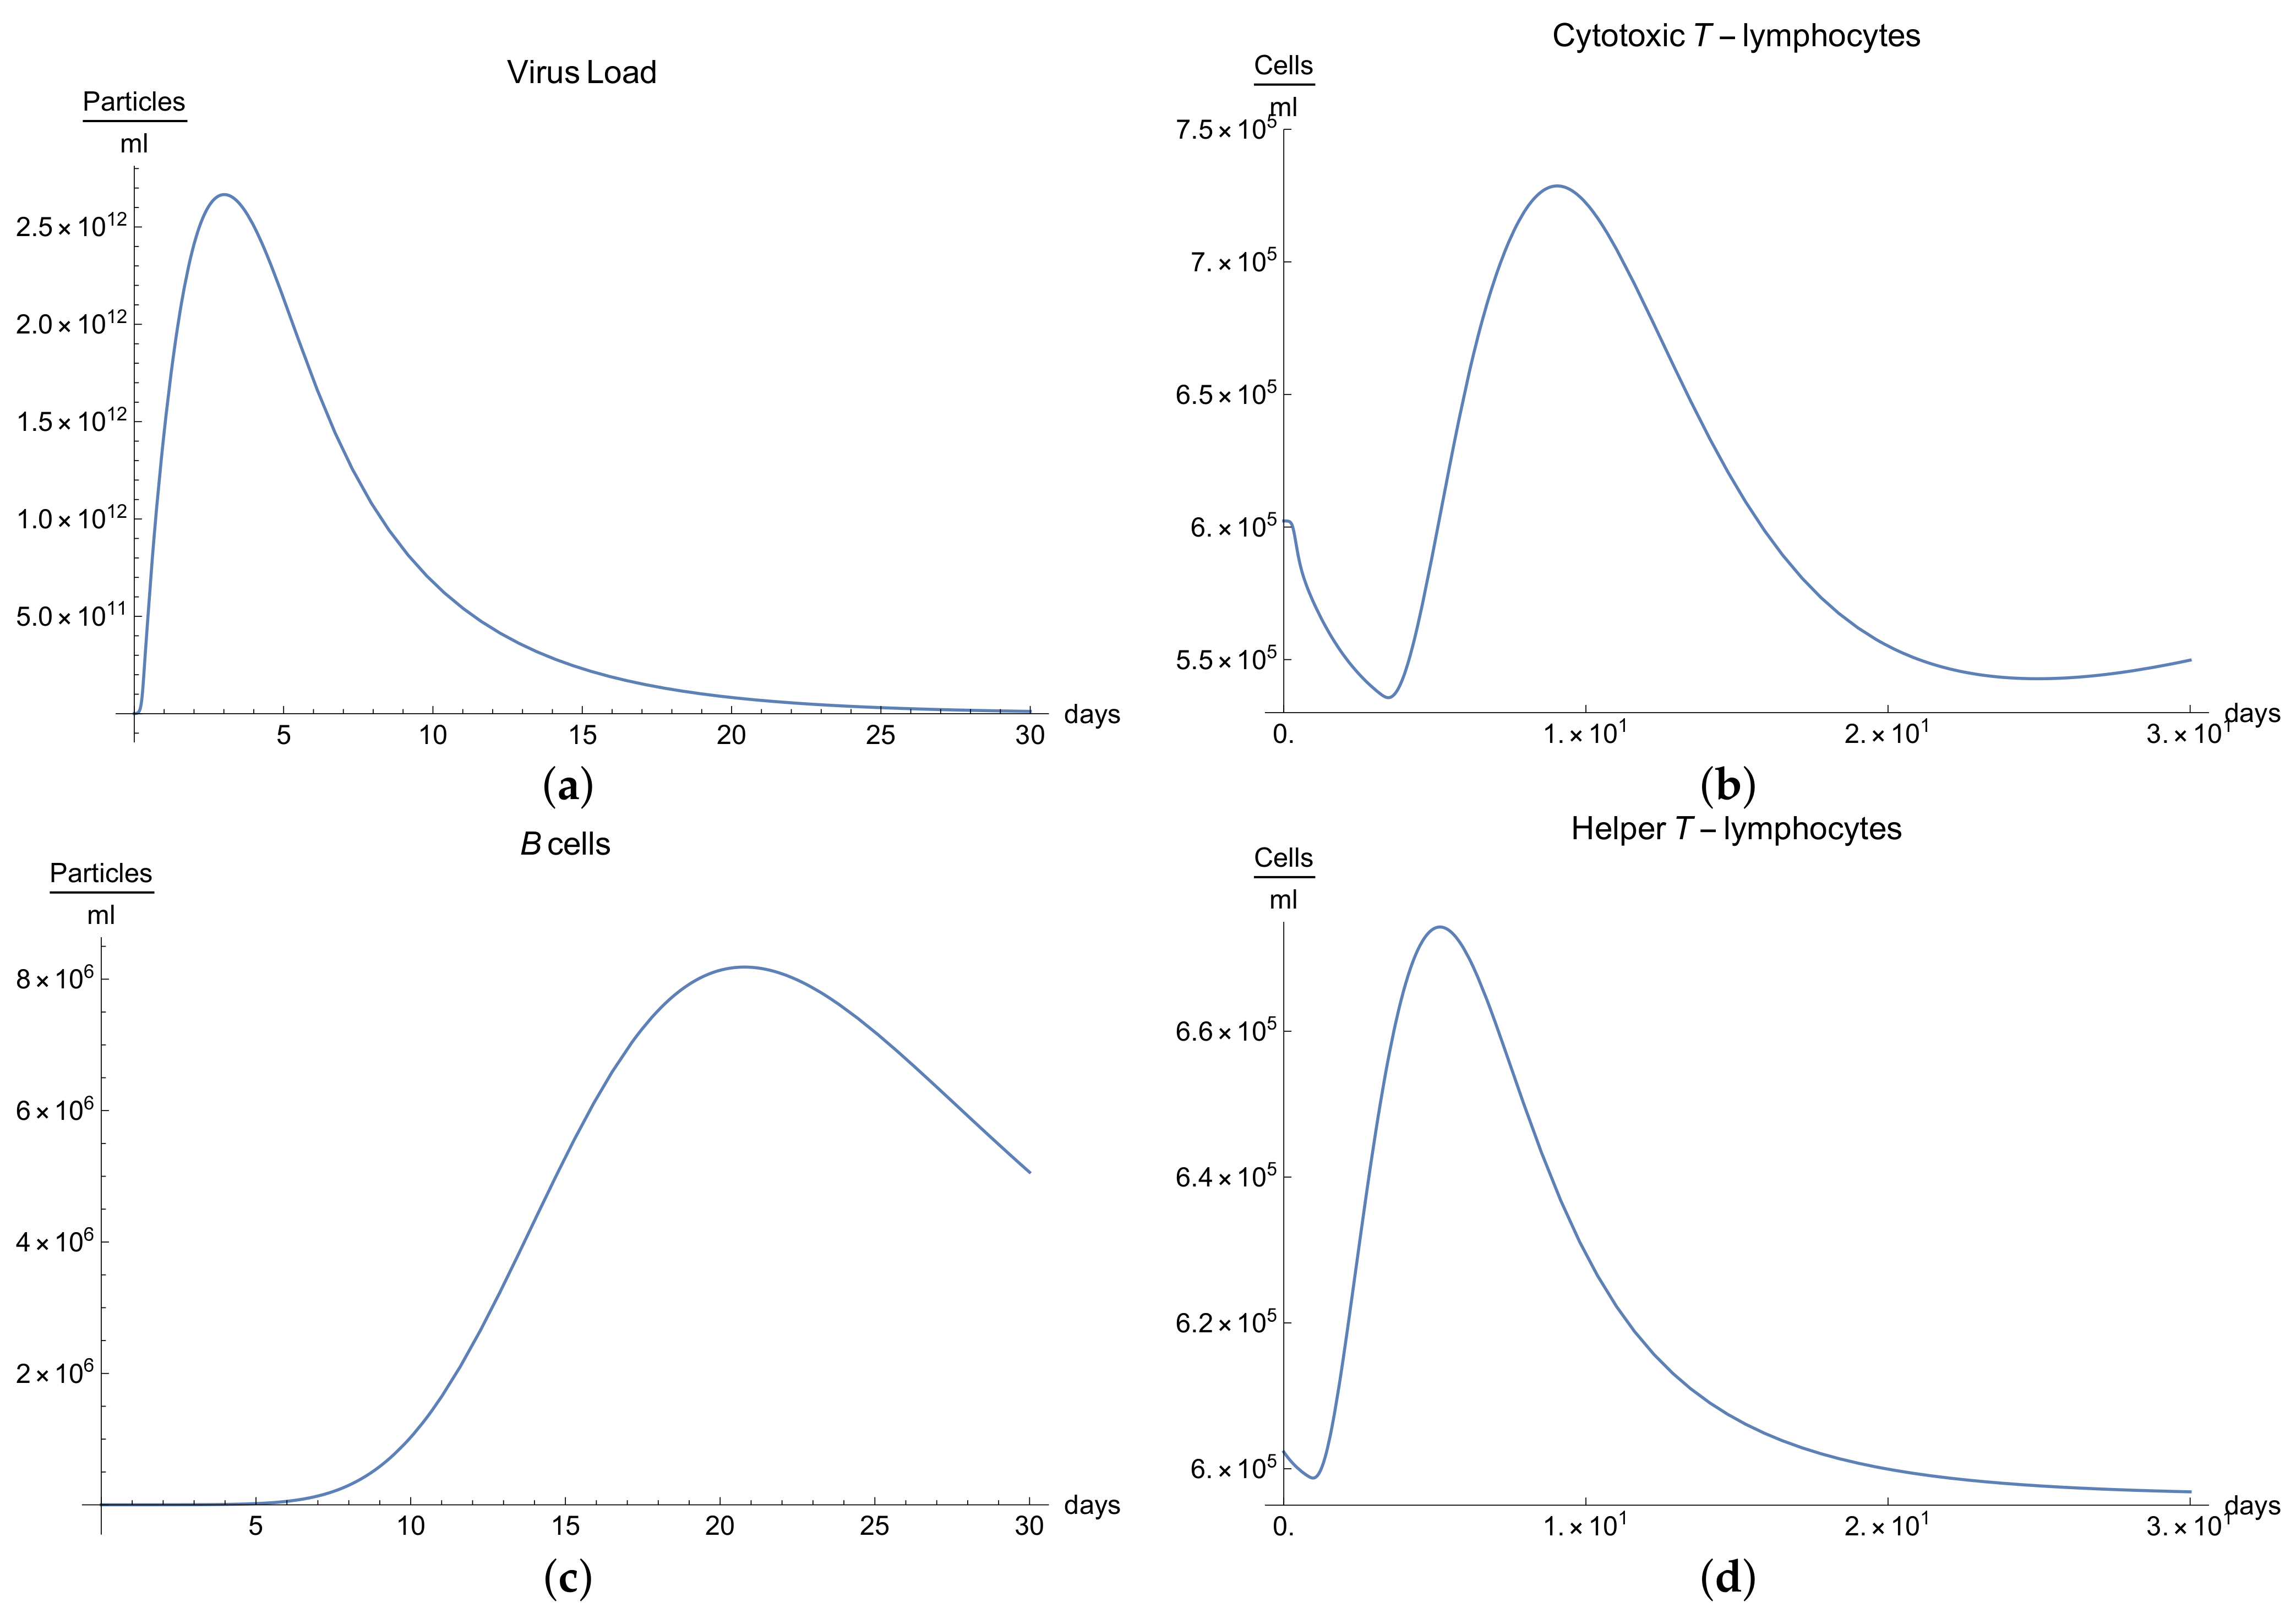
3.1. Immunophysiological Response of COVID-19 Infection in Its “Normal” Form
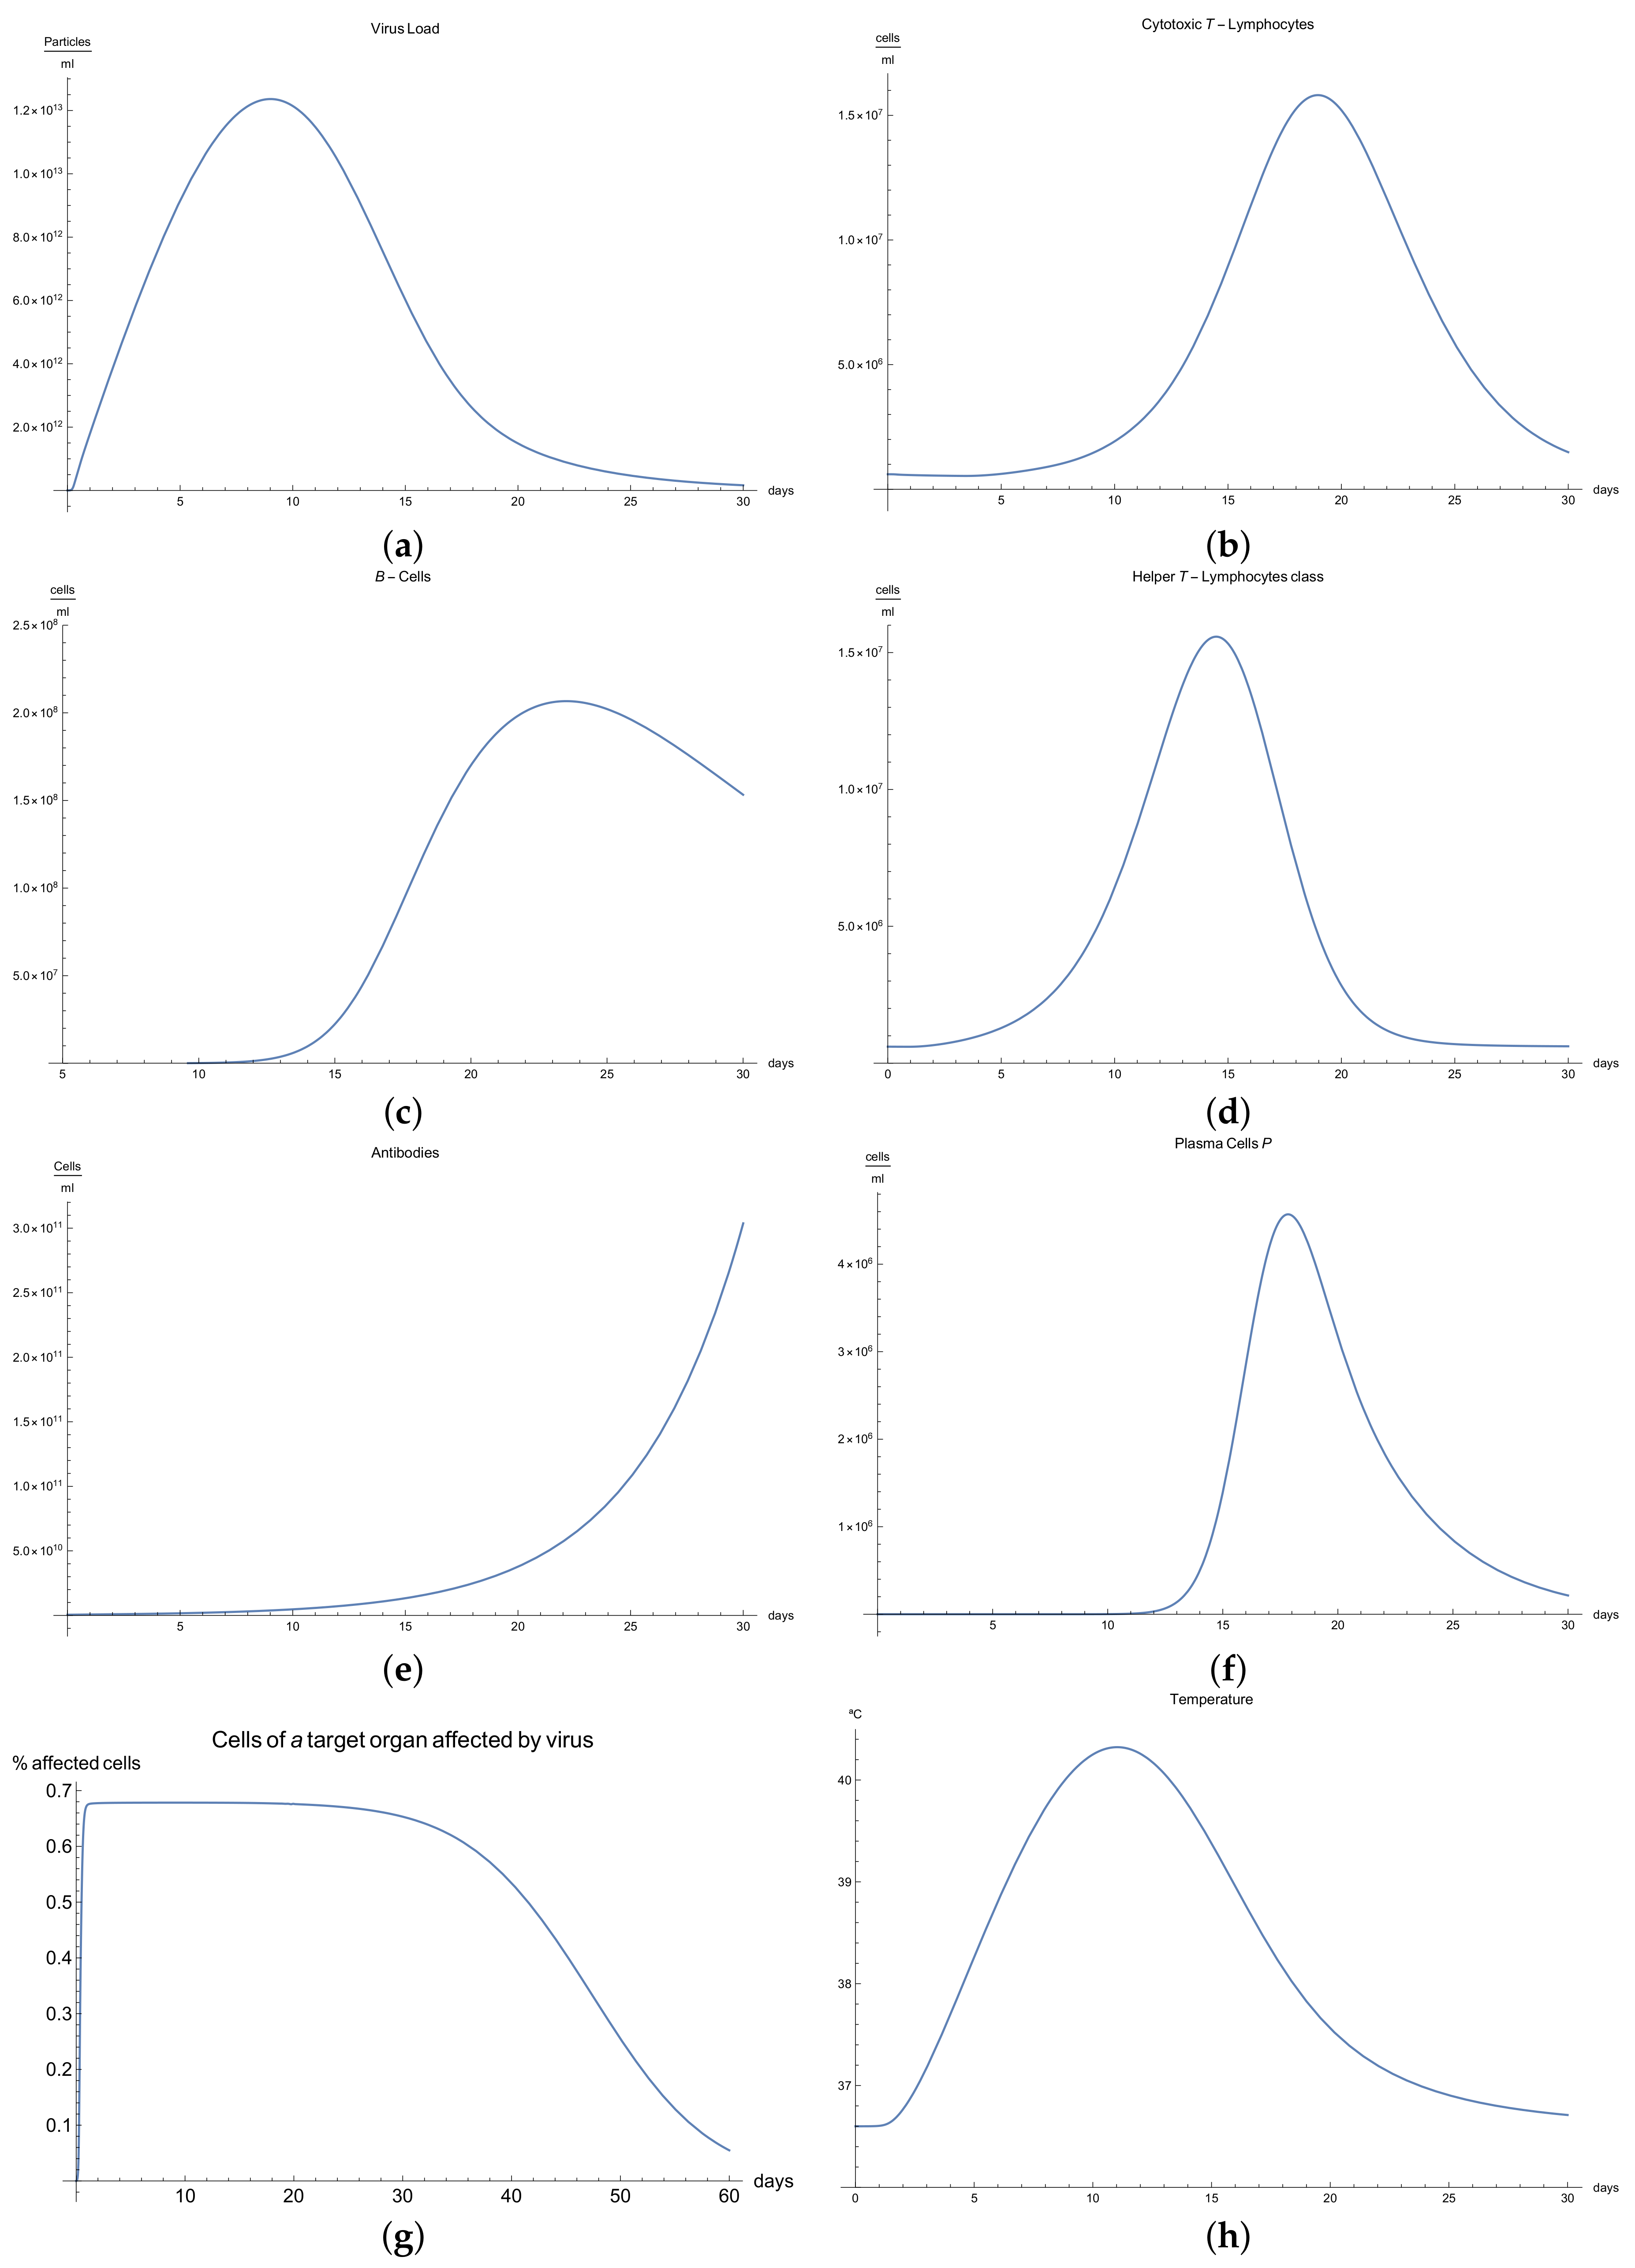
To simulate the dynamics of COVID-19 that accounts for the immunophysiological reaction during the coronavirus SARS COV-2 infection, we consider the system of Equations (1)–(12) with initial conditions 13 and the set of coefficients in
Table 1 as a basis for the mathematical modelling of COVID-19 infection. At first, we can see the behavior for the virus concentration
; see
Figure 1a, which presents the dynamics of the disease in its “not acute” form, for which there is some slight symptoms. It is characterized by rapid growth between days 7 to 10 in very good agreement with the available data [
10]; due to the immune reaction, edema could manifest itself by causing the viral load to drop below a certain level.
It is important to notice that all the parameters considered in the model, from Equations (1) to (11) have their own values given in
Table 2,
Table 3 and
Table 4 respectively.
Immune response to viral antigens penetrating into an organism is determined by two responses: the humoral response, which is activated by B-lymphocytes, which in turn produces antibodies and the adaptive response, which activates the cytotoxic lymphocytes. It is clear from
Figure 1b,c that only after a certain amount of antibodies and cytotoxic T-lymphocytes
is produced until the 5th to 14th days will a stable diminution of V(t) begin down to zero concentrations of the viral load.
The development of disease leads to a significant increase in the temperature, which reaches its maximum 10 days after the beginning of the infection; see
Figure 1h. Finally,
Figure 1g presents
, the percentage of damaged cells in the compartments of the upper respiratory tract epithelium (cell/mL). The pathological process affects some segments of the lungs, which is equal to 60–65% of lung volume, and after day 30, the percentage decreases until it reaches zero.
3.2. Immunophysiological Response of COVID-19 Infection with Immunodeficiency
Immunodeficiency, also known as immunocompromisation, is a state in which the immune system’s ability to fight infectious diseases is compromised. Usually, it presents alongside various clinical manifestations, for instance, the increase in frequency, severity, and duration of the infection [
27]. Many immunologists agree that there are two major groups of immunodeficiencies: primary and secondary [
27,
38]. These form the basis of the diagnosis reported by the World Health Organization (WHO). In the case of primary immunodeficiencies, its genetic origin (loss or malfunction of the gene function) is well established and is grouped basically into defects in humoral immunity and cellular immunity, respectively, among other.
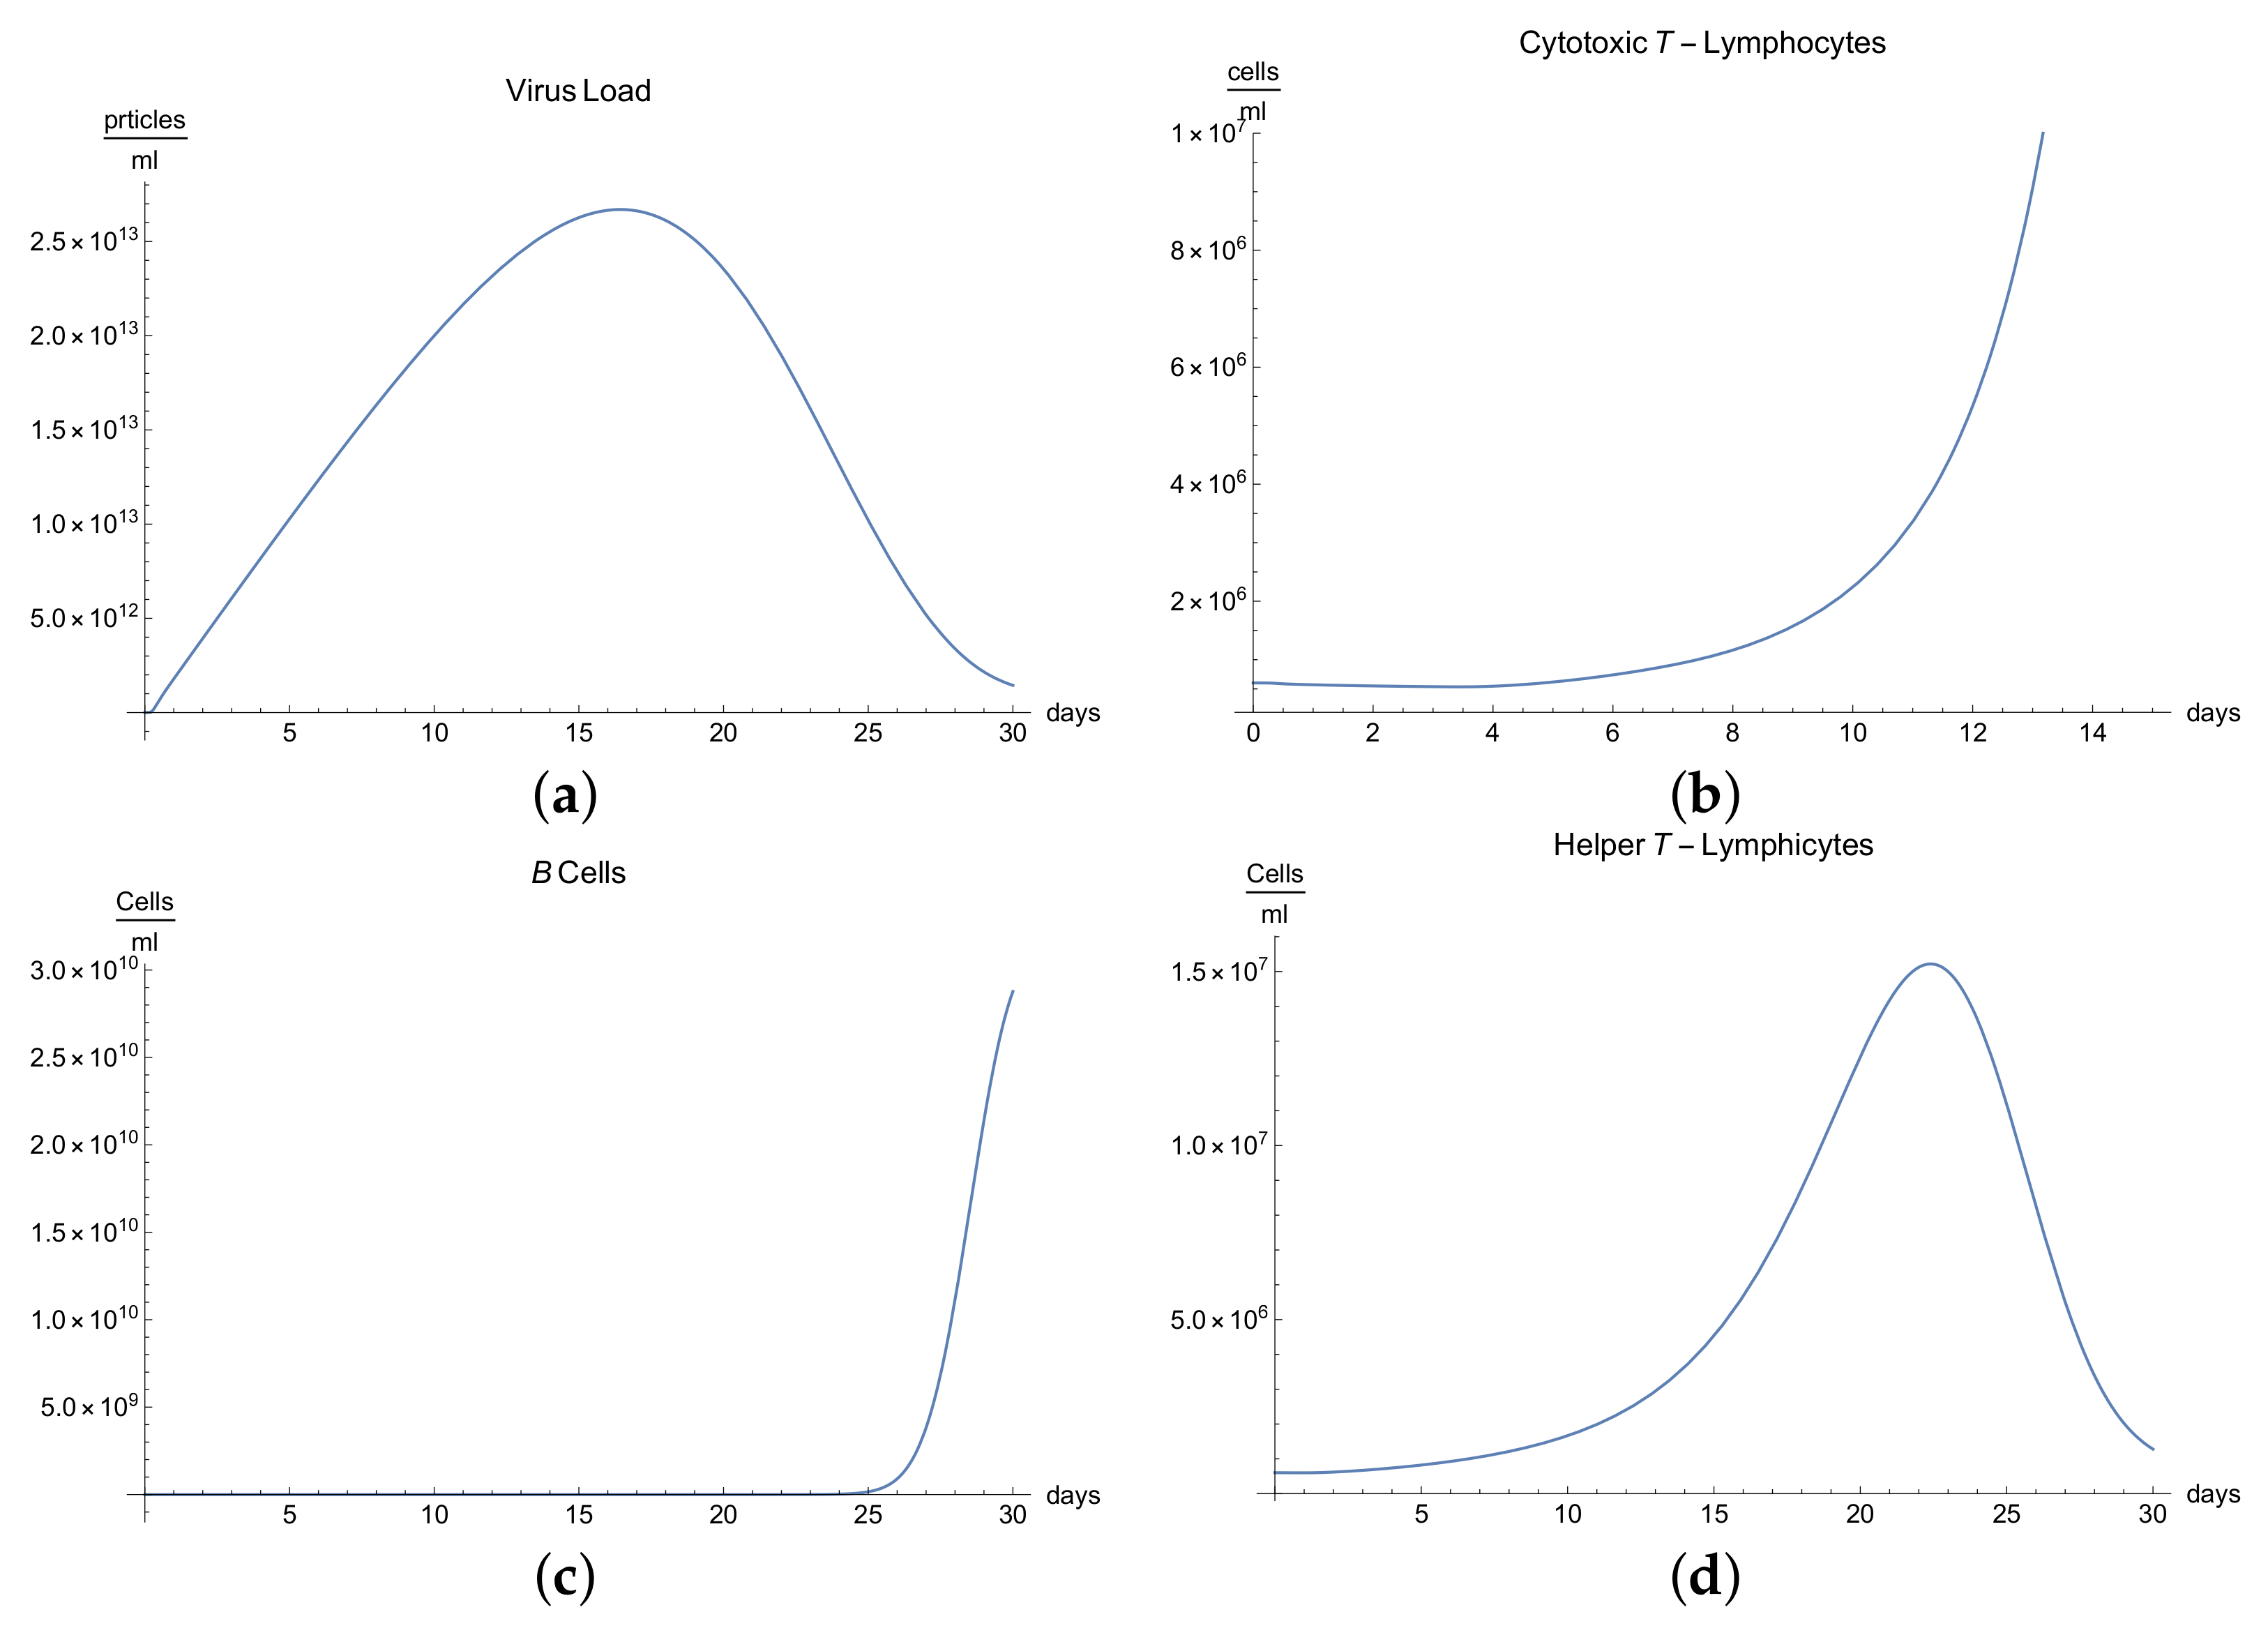
We can observe the behavior for the viral load
; see
Figure 2a, which presents the dynamics of the disease when an organism present an immunodeficiency based in defects in humoral or cellular immunity. It is characterized by a slow growth of the viral load
during the disease compared with “normal” disease (see
Figure 1a). Due to immunodeficiency, the response of the organism is not as fast and complete as the "normal" form, and although in the end it can be seen that the disease is eradicated, the symptoms are more durable, which is observed in
Figure 2a.
It is clear from
Figure 2b,e that only certain quantities of antibodies
and cytotoxic T-lymphocytes
are produced until the 10th day, producing a delay in the immune response, which translate to longer illness.
Many reactions noted in laboratory towards antigens, mitogens, or allogenic cells are related to helper T-lymphocytes and their respective cytokines, which manage the differentiation and division of B and T-lymphocytes. If we observe
Figure 2d, we can see that there is a delay in the production of class 1 helper T-lymphocytes
as a result of this immunodeficiency.
The development of disease leads to a significant increase in temperature, which reaches its maximum 18 days after the beginning of infection; see
Figure 2h.
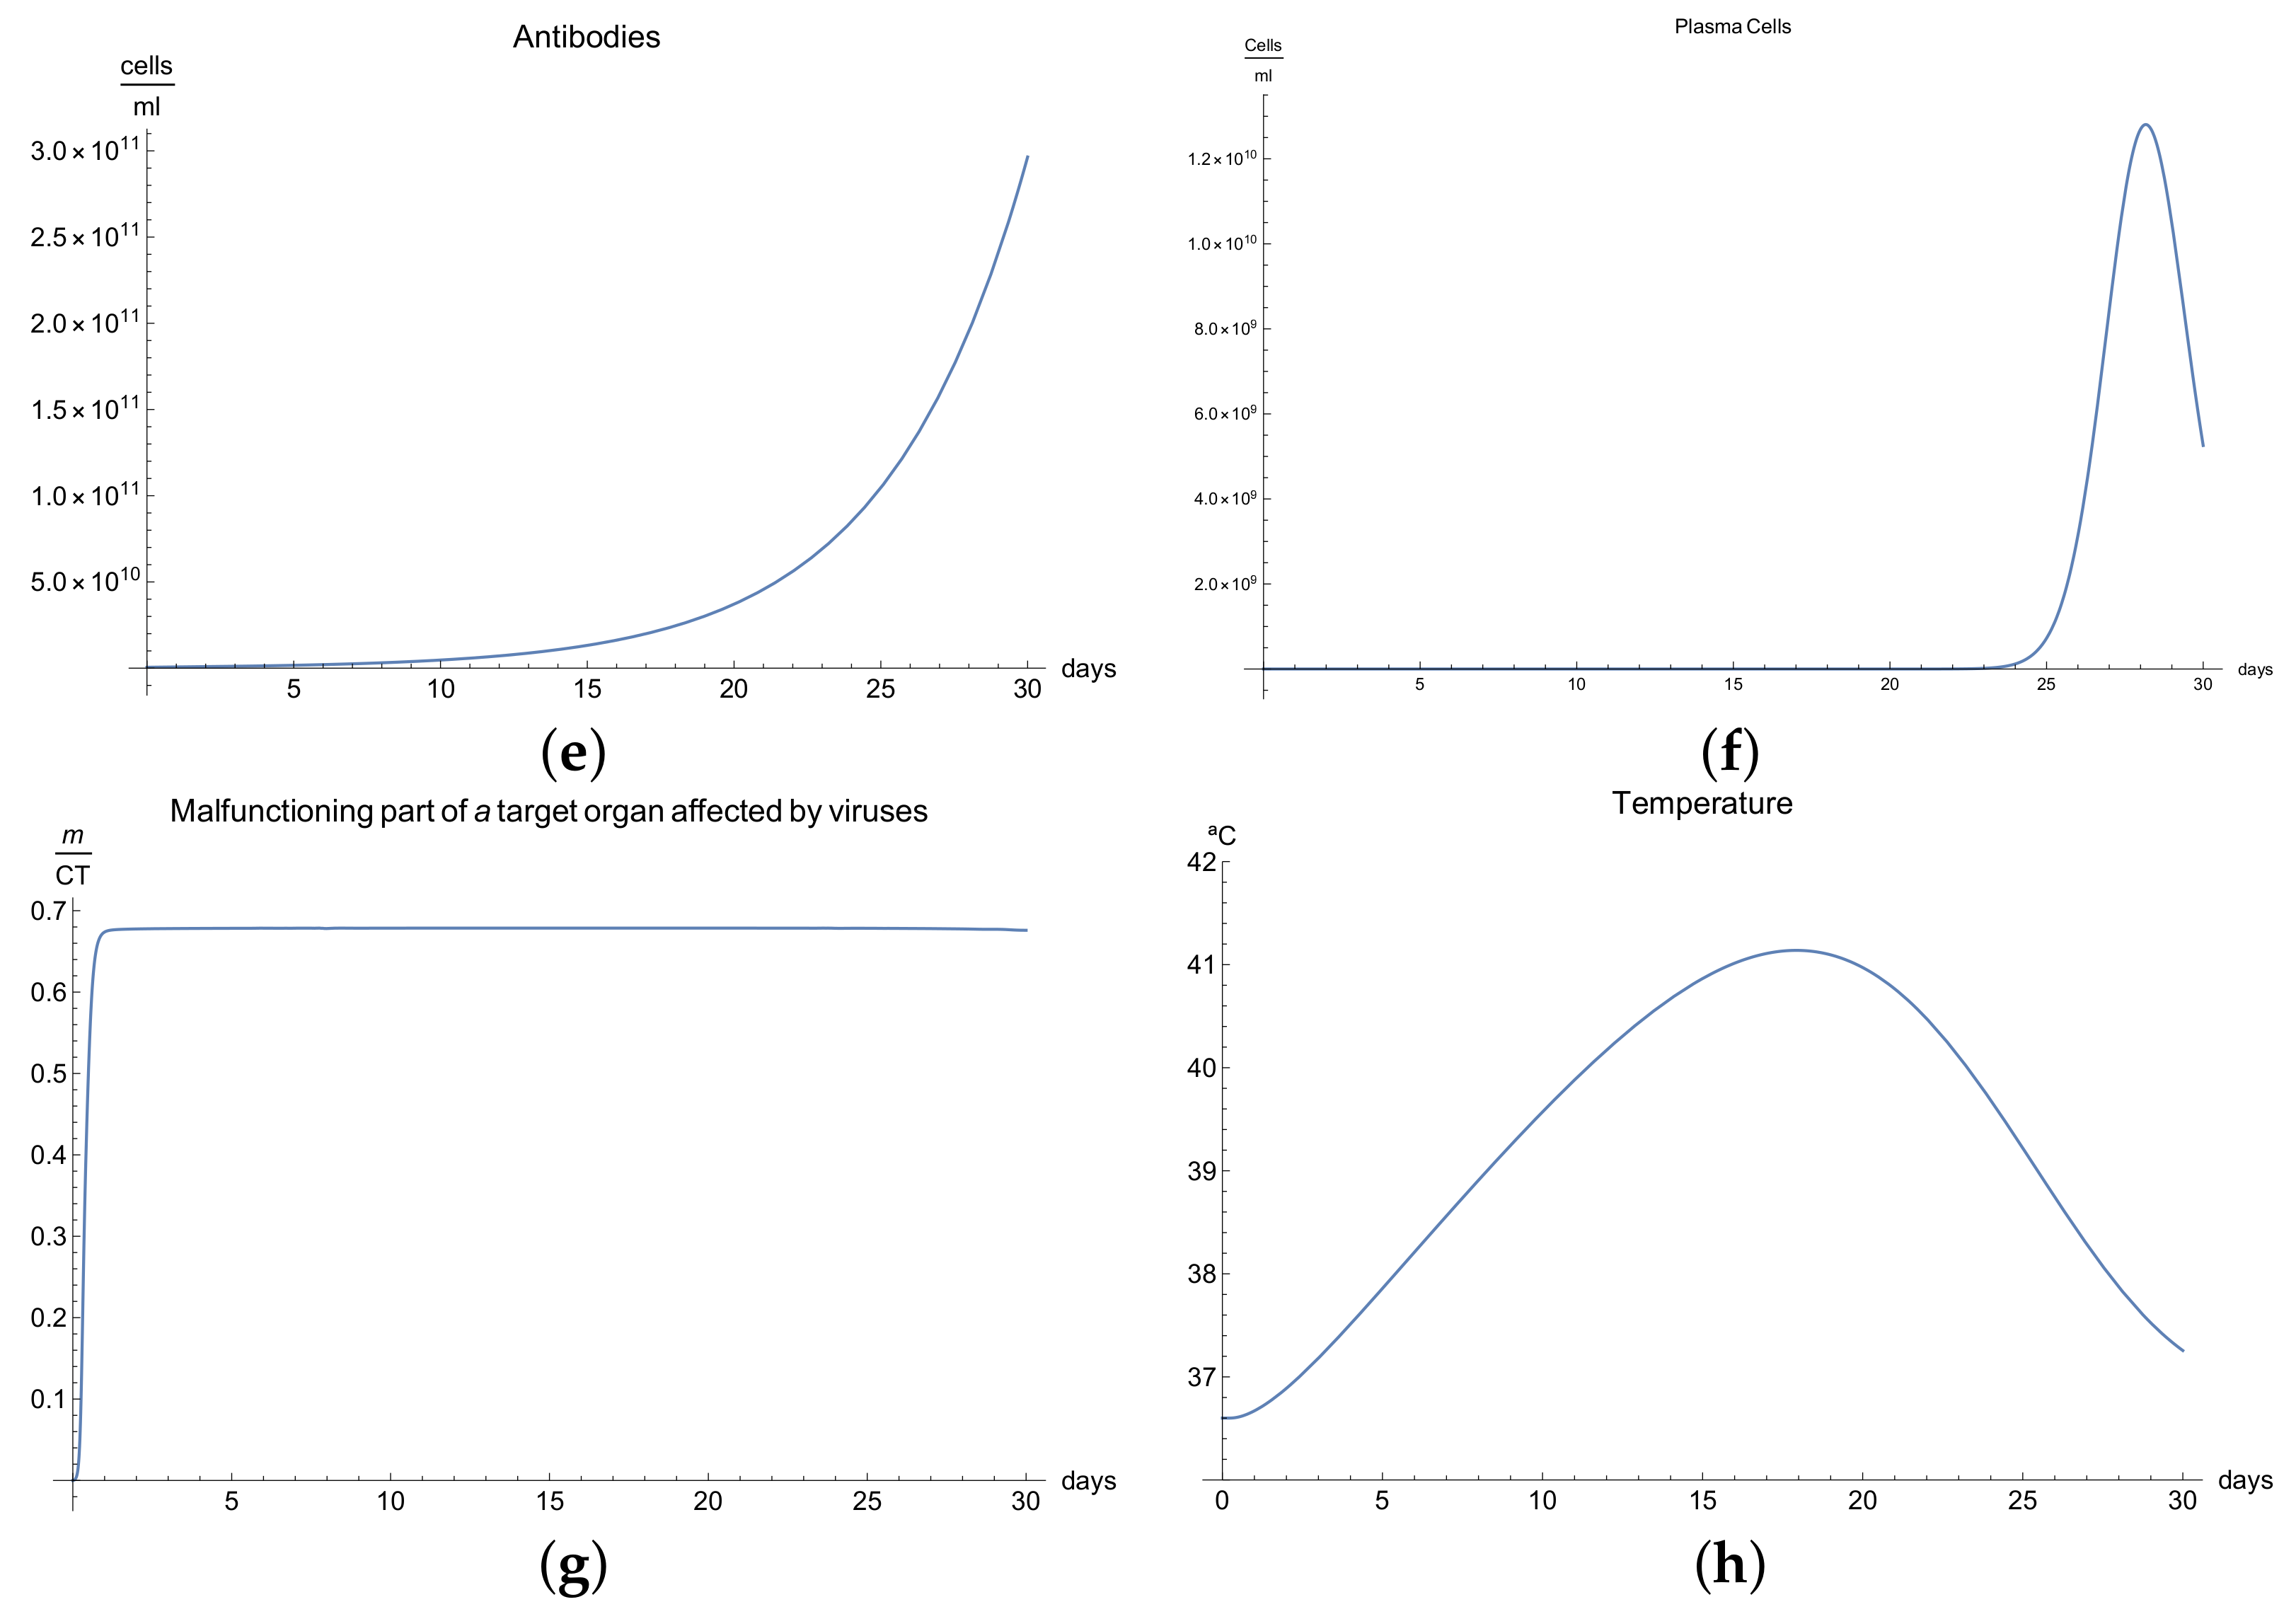
3.3. Immunophysiological Response of COVID-19 Infection in Its "Acute" Form
We call the phase when an antigen that has penetrated into an organism begins to increase its concentration due to proliferation and when this is accompanied by a weak immune response, which has some delayed due to many possible causes so that some pathological changes occurred in a specific organ under the influence of these antigens, the acute form of the disease. In this form of the disease course, the organism experiences an increase in body temperature, intoxication of the organism, and considerable pathological changes in the affected organ, and finally, this acute form ends in a lethal outcome.
We now consider the serious form of disease for which there are severe symptoms. In this case, the behavior of the virus concentration
(see
Figure 3a) is characterized by rapid growth in the first 30 days (there is an abrupt fall in the curve which we suppose is the infection being so severe that the patient dies). The development of an immune response and edema is constant but very slow, and this means that the viral load does not decrease. It is clear from
Figure 3b,c that only certain quantities of antibodies and Cytotoxic T-lymphocytes are produced until day 24.
The development of disease leads to a significant increase in the temperature, which reaches its maximum 28 days after the beginning of the infection; see
Figure 1h. Finally,
Figure 3g presents
, the percentage of damaged cells in the compartments of the upper respiratory tract epithelium (cell/mL). The pathological process affects some segments of the lungs, which after day 25, increases until it reaches 100% of the lung volume, where the patient is supposed to die due to the acuteness of the infection.
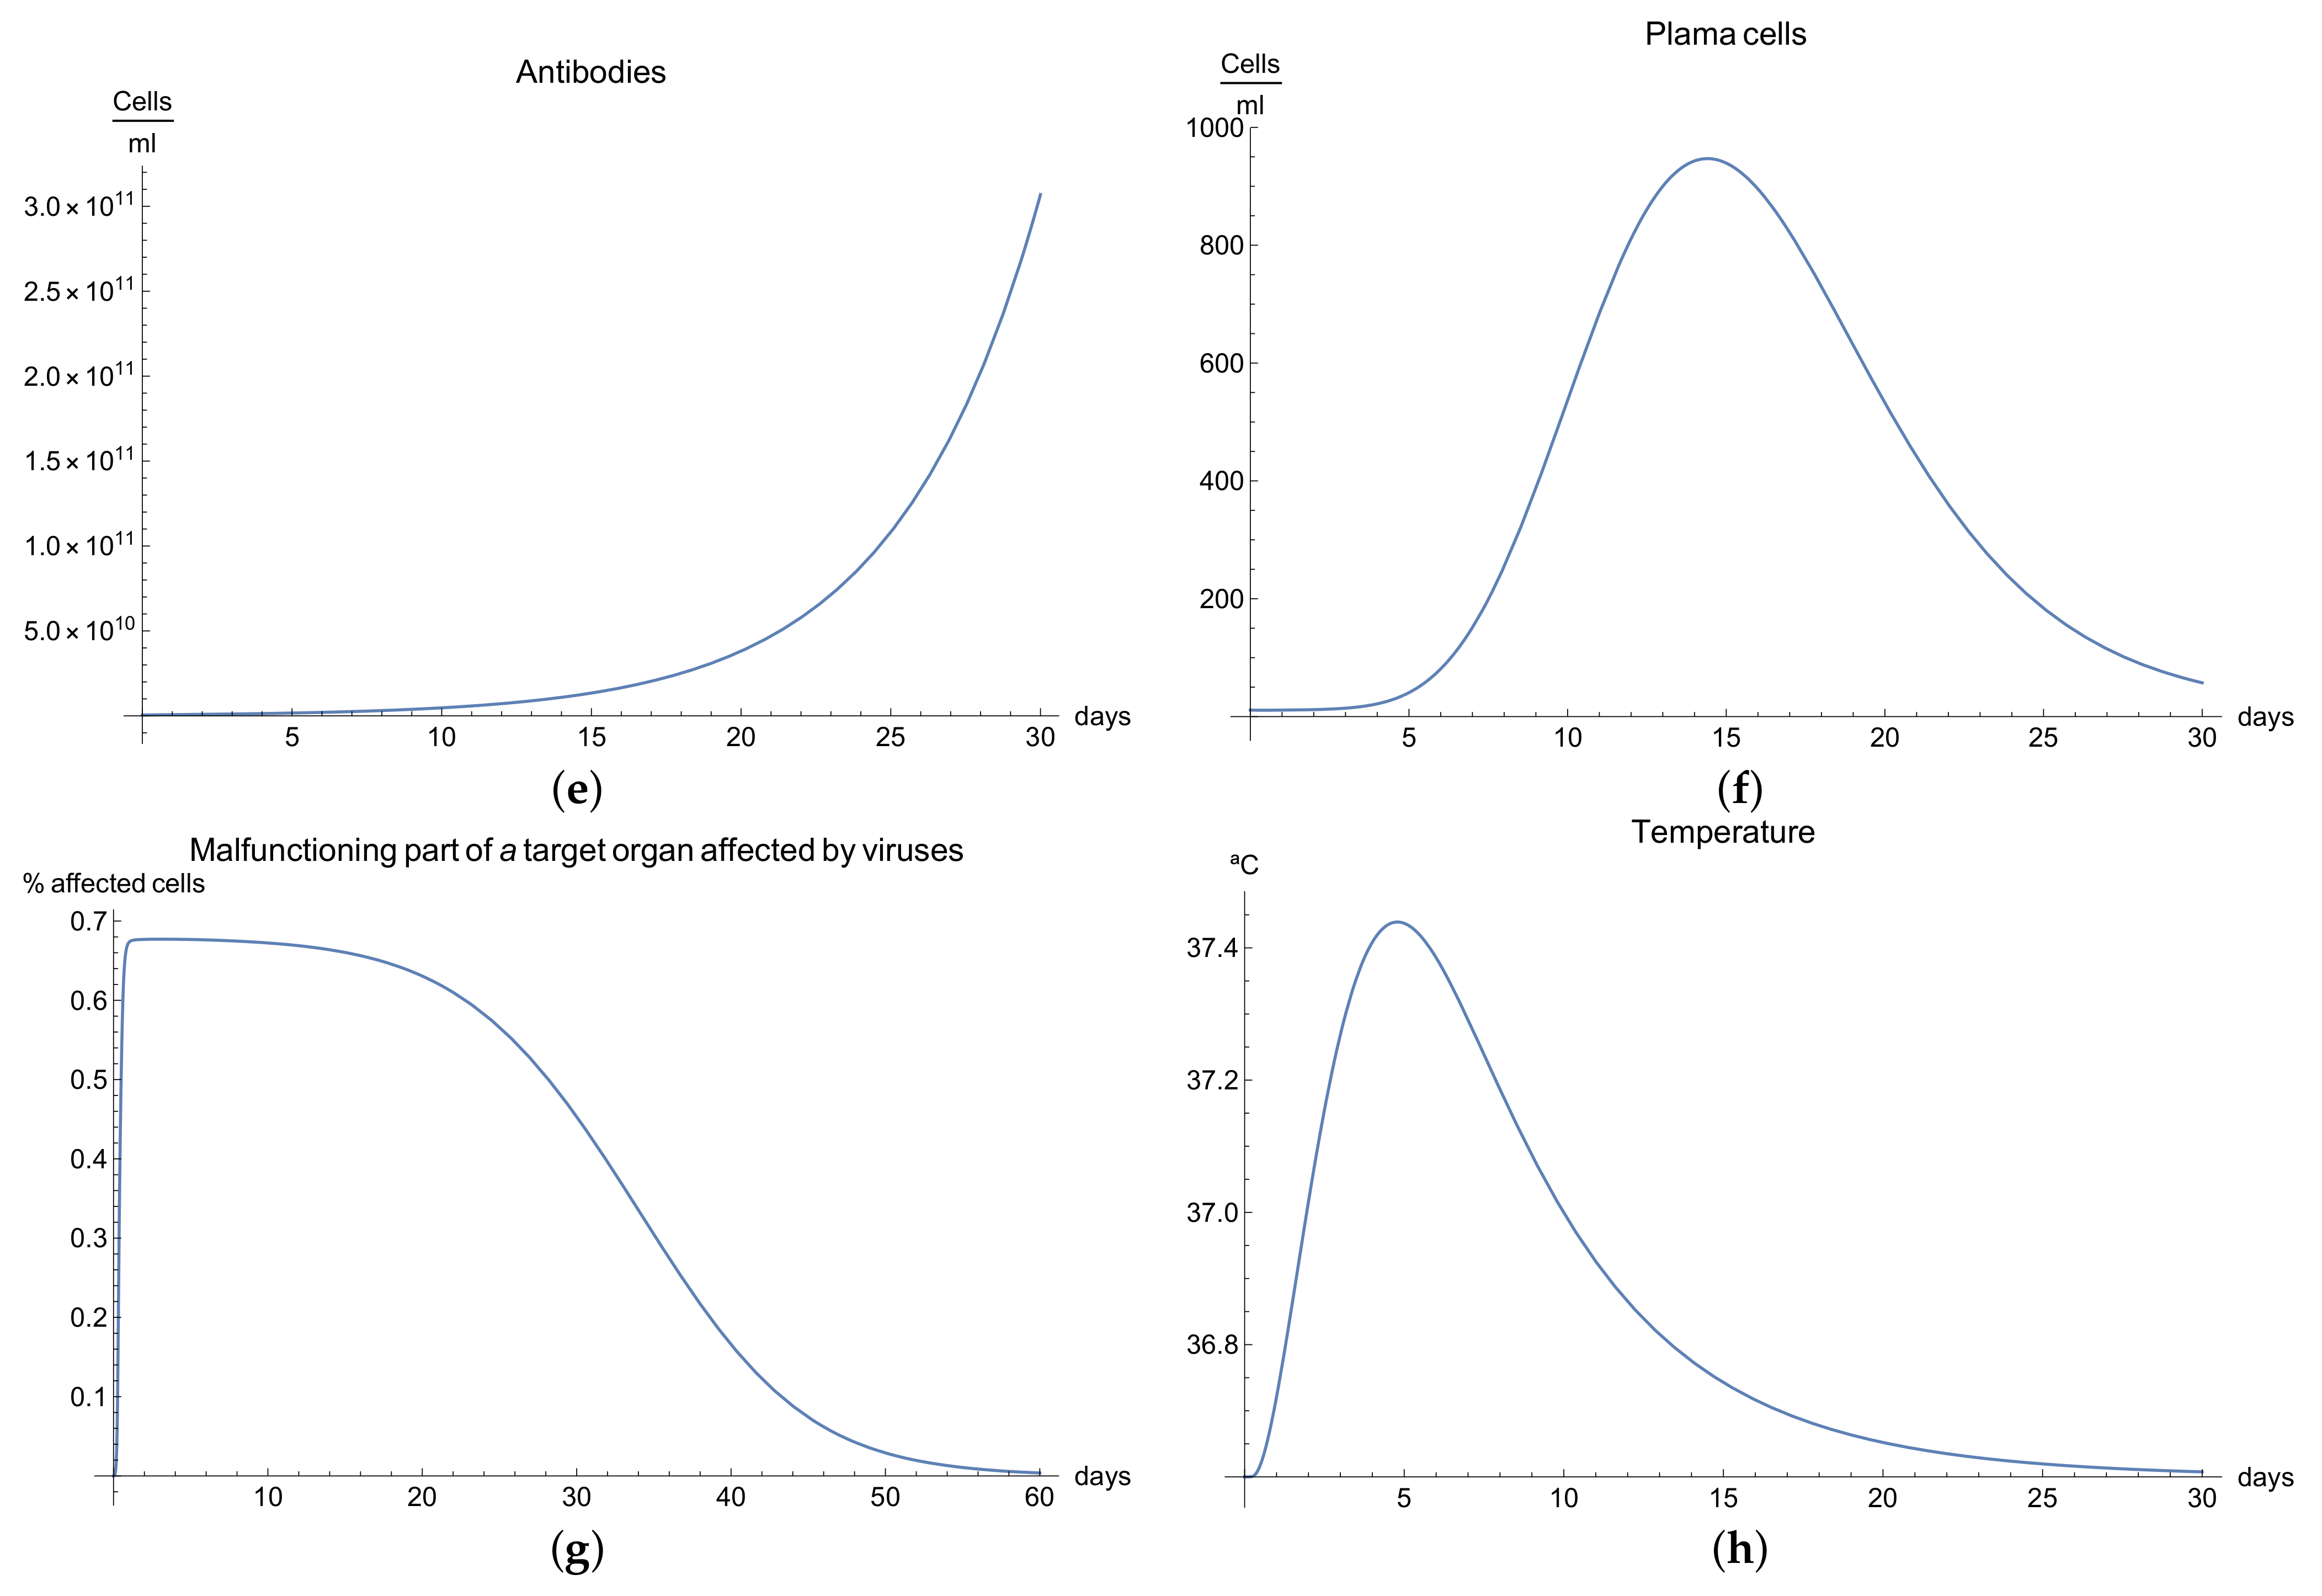
3.4. Immunophysiological Response of COVID-19 Infection When Immunotheraphy Using Antibodies Is Applied
COVID-19 is a challenging disease in many ways. In first place, it has a high potential to spread throughout the world population very quickly. Likewise, its lethal and severe forms occur more frequently in depressed immune systems, so it is plausible to try to use therapy based on strengthening the immune response.
One of these treatments is immunotherapy with antibodies for COVID-19 infection, which activates immune response and stimulates the mechanisms of defence against the disease.
We can observe the behavior for the viral load
; see
Figure 4a, which presents the dynamics of the disease when, in an organism, we boost the immune system, increasing the concentration of antibodies
. It is characterized by very rapid growth of the viral load
during the disease compared with the “normal” disease (see
Figure 1a). It is observed that the maximum is reached on the 3rd day; moreover, we noted that the viral load is reduced only by increasing the concentration of antibodies.
Due to boosting of the response of the organism being very fast and complete in comparison with the “normal” form, in the end, it can be seen that the disease is eradicated in almost 10 days. The increase in the production of B cells and plasma cells in response to immunotherapy is also remarkable; see
Figure 4c,f.
The development of disease leads to a insignificant increase in the temperature, which reaches a maximum 5 days after the beginning of the infection; see
Figure 4h. Finally,
Figure 4g presents
, the percentage of damaged cells in the compartments of the upper respiratory tract epithelium (cell/mL). The pathological process affects some segments of the lungs, which from day 20 started to notably decrease as a consequence of the recovery of the organism due to the immuntherapy and reached 0% of lungs damage.
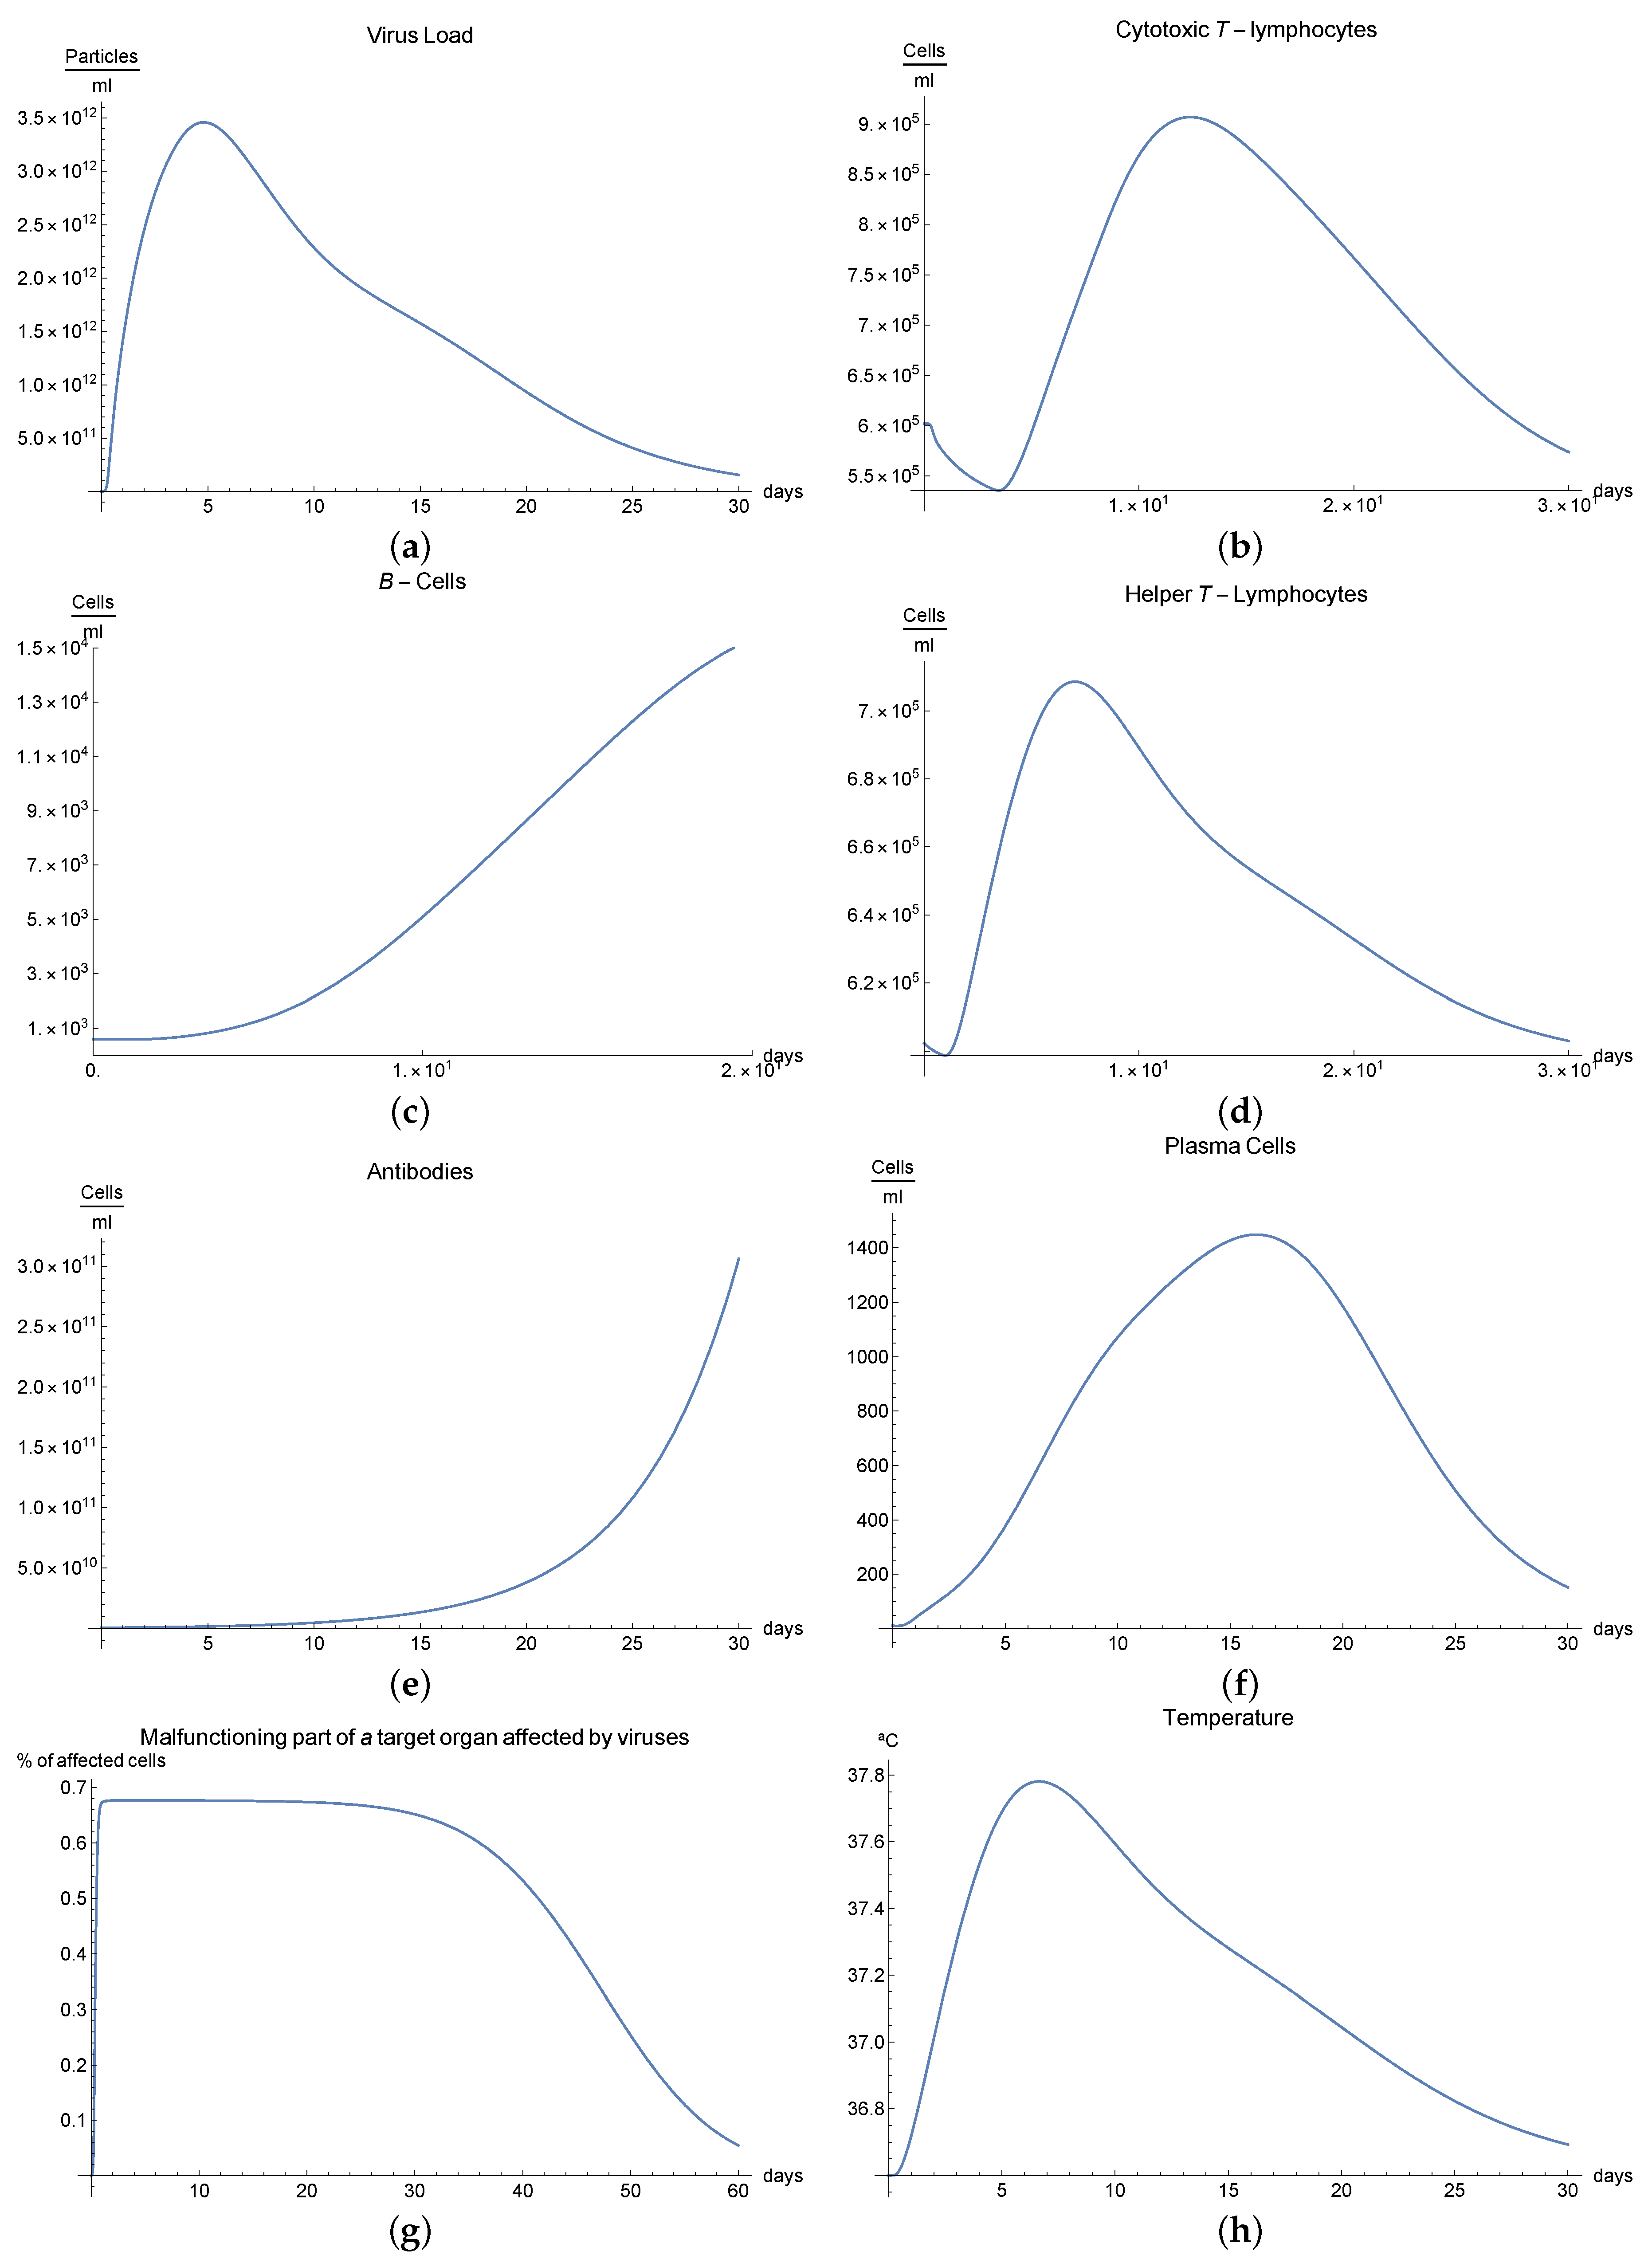
3.5. Immunophysiological Response of COVID-19 Infection When Immunotheraphy of Cytotoxic T-Lymphocytes Is Applied
The human body has two major viral threats: the viruses inside the cell and outside of it, in the plasma. Within the cell, there are different ways in which the immune system can eliminate these viruses; for example, adaptative immune response mediated by cytotoxic T-lymphocytes , which eliminates the organism’s infected cells. Then, we can consider it a fundamental mechanism since millions of viruses are capable of destroying an organism.
A second immunological treatment is immunotherapy for the COVID-19 infection, which activates immune response. These activated CD8+ lymphocytes proliferate and differentiate into the lymphoid organs where they were generated and migrate to eliminate the virus antigens [
5,
10].
We can observe this behaviour for the viral load
; see
Figure 4a, which presents the dynamics of the disease when, in an organism, we boost the immune system, increasing the concentration of cytotoxic T-lymphocytes
. It is characterized by very rapid growth of the viral load
during the disease compared with the “normal” disease (see
Figure 1a). It is observed that the maximum is reached on the 5th day; moreover, we noted that the viral load is reduced until it disappeared on the 30th day.
It is clear from
Figure 5b,e that only certain quantities of antibodies
and cytotoxic T-lymphocytes
are produced in day 5, increasing the number of these cells significantly.
Additionally, it has been observed that proliferative reactions of immune cells are connected to the functional activity of T-helpers producing various lymphokines that control the division and differentiation of T- and B-lymphocytes. If we observe
Figure 5d, there is an important production of helper T-lymphocytes
as result of immunotheraphy.
The development of disease leads to an insignificant increase in temperature, which reaches its maximum 7 days after the beginning of the infection; see
Figure 5h. Finally,
Figure 5g presents
, the percentage of damaged cells in the compartments of the upper respiratory tract epithelium (cell/mL). The pathological process affects some segments of the lungs, which from day 30 started to notably decrease as a consequence of the recovery of the organism due to immuntherapy and reached 0% of lungs damage.
4. Concluding Remarks
When a virus becomes the main enemy of our body, all resources must be directed towards fighting this enemy and, more specifically, our own immune system. This is the case for the novel coronavirus SARS-COV-2, commonly named COVID-19 virus, which since January of 2020 has been affecting the health of millions of humans around the world. In this battle, mathematical models could help us find a mechanism that helps an organism escape from the fatality of this disease. For this purpose, we built a mathematical model of eleven delayed differential equations describing the dynamics between the COVID-19 virus, and cellular and humoral immune responses.
We conducted an analysis of the model exploring different scenarios, and our numerical results indicate for the fist case that the model could reproduce the results available in the literature in a very good agreement; for instance, see
Figure 1a in which the symptom onset is around 6–9 days, with 97.5% of symptomatic patients developing symptoms within 11.5 days [
10,
39,
40].
In our second scenario, we present immunodefficiency based in defects in humoral or cellular immunity; one possible example of this immuno-deficiency is the phenomena called cytotoxic T-lymphocyte exhaustion, which usually reduces the functional diversity of these cells [
25]. We can observe from the behavior of the viral load
(see
Figure 3a) that, due to immunodeficiency, the response of the organism is not as fast and complete as the “normal” form, and although in the end it can be seen that the disease is eradicated, the symptoms are more durable.
In our third scenario, a serious form of the disease was considered for which there are severe symptoms; in this case, the behavior for the viral load
(see
Figure 2a) indicates rapid growth in the first 30 days (there is an abrupt fall in the curve because the infection is so severe that the patient dies), we notice that the development of immune response and edema is constant but very slow, and this means that the viral load never decreases. From
Figure 2b,c, it is clear that only certain quantities of antibodies and cytotoxic T-lymphocytes are produced until day 24, which are not enough to fight against the virus.
In our fourth scenario, this model demonstrates how important gradual stimulation of the immune system is, particularly the levels of lymphocytes, macrophages, immunoglobulins, and other vitally important components of the immune system. In this scenario, we observed that, when we increase the concentration of antibodies in the organism, the viral load did not increase and that the viral load decreases more quickly compared to the first scenario. Then, it is advisable to use this immunotherapy based on the injection of prepared immunoglobulins or donor (passive) antibodies, which may “tip the scale” against the background of intensive antiviral therapy in favor of convalescence before the process becomes fatal. Based on our results, we consider this immunotherapy to be more important in the cases when acuteness of an inflammatory process continues growing and turns into a serious clinical form.
In our last scenario, we proposed immunotherapy based on boosting humoral immune response by augmenting the concentration of specific T-lymphocytes; we demonstrated that an increment in the concentration of these lymphocytes produced a response that reduces the viral load, reaching its maximum on day five, and that the reduction is a result of the therapy and causes faster recovery. Some authors have observed certain immunopathologies associated with vaccines made of inmmue cells tested on animals [
26], which has produced some distrust in this therapy. Nevertheless, based on this model, we consider that creating coronavirus-specific T lymphocytes is clearly important to eliminate the virus in patients with COVID-19.
Finally, we also think that the paper opens the possibility for other diseases (hepatitis, chronic bronquitis, acute pneumonia, dysentry, etc.). It is possible to develop quantitative models of the dynamics for these infectious diseases in order to describe the course of the pathology, the severity, and the possible outcomes. The use of some immunotherapies provides researchers and clinicians with new tools for stimulation of the immune system; the latter can be used to increase the efficiency in the struggle with this disease. Of course, there are many open questions in mathematical modeling that still need to be addressed; among others, is it possible to model some new effects such as the storm of cytokines observed in patients with SARS-COV-2? Is it possible to incorporate other systems such as complements in modeling, etc.? However, it is important to have a good data set in order to calibrate the model. It is clear that not much data are available in this moment, but we have to remember a maxim between modellers: “a mathematical model is as good as the data it uses”.


