Abstract
Several methodologies for academically exploring causality have been addressed in recent years. The decision-making trial and evaluation laboratory (DEMATEL), one of the multiple criteria decision-making (MCDM) techniques, relies on expert judgements to construct an influential network relation map (INRM), revealing the mutual causes and effects of the criteria and dimensions for presentation of the results in a visual manner. The interactional impacts may be evaluated without considering the presumed hypotheses. The DEMATEL has been successfully utilized to assist in complex decision-making problems in various contexts. However, there is controversy about the reliance upon expert judgements, which could be subjective. Thus, this study seeks to overcome this dispute by developing a data-driven, concept-based novel hybrid model which the authors call SEM-DEMATEL. The model first constructs the direct effects between indicators based on structural equation modeling (SEM) and then utilizes DEMATEL to confirm the interdependence among the variables and identify their causes and effects. Finally, an empirical study exploring the key factors affecting mobile payment usage intention is further conducted to demonstrate the feasibility, validity, and reliability of the novel SEM-DEMATEL research approach. The results identify that the perceived value is the key influencing indicator of m-payment usage intention, and the objectivity and efficiency of the research results are compared.
1. Introduction
The importance of effective and precise exploration and clarification of causal relationships among variables or objects is undoubtedly essential in many branches of science. The effectiveness of decision-making is reliant upon accurate and efficacious causal analysis. Mathematical and statistical techniques have been applied to develop more efficient methods to understand and map out casual inferences [1]. These days, numerous causality exploration methods have been utilized in research studies, such as interpretive structural modeling (ISM) [2,3], Granger causality [4,5], transfer entropy [6,7], fuzzy cognitive mapping (FCM) [8], decision-making trial and evaluation laboratory (DEMATEL) [9,10], and structural equation modeling (SEM) [11,12]. Each method has its own specific features, advantages, and respective limitations. Among these, two approaches have become more prominent and widely adopted: SEM, a comprehensive statistical model technique for efficiently specifying and testing all of the relationships among variables, and DEMATEL, a convincing method for confirming interdependence among variables.
SEM, a data-driven research method, has been confirmed to be an effective tool for testing models of predicted relationships among variables and latent indicators [13] and widely employed to establish causal models in different contexts in various disciplines, including human resource management [12], marketing [11], health care [14], tourism management [15], and many others. The SEM technique not only allows users to simultaneously estimate latent, exogenous, and endogenous variables [16,17] but also reveals the reciprocal causal relations between latent variables [17,18]. Most importantly, all the direct and indirect effects among variables and latent indicators can be easily illustrated by accessing data collected through massive surveys [17]. Previous studies confirmed the significance of the data-driven approaches and considered these research methods as exploratory approaches to explore the scientifically valuable patterns [19,20]. This study applies this advantage to offset DEMATEL’s limitation of reliance upon expert opinions.
Several limitations of SEM, such as the large sample size required [13], independent exogenous variables in all equations [13], indispensability of the hypothesized relationship [21], and complicated parameter estimation requirements [22], necessitate over-modification of the research model for providing a better model fit. In particular, the original SEM models have been modified to overturning pre-hypothesis assumptions so that model specification errors cannot be revealed by modification indices [23,24], or the amended model is only applicable for the researcher’s specific sample [25]. The issue of substantiating the trustworthiness of over-trimmed assumptions should be addressed [26]. In this study, the DEMATEL method is applied to avoid the problem and to reveal the intricacies of interdependent causal relationships among the criteria and dimensions.
The DEMATEL method can not only confirm the interdependence [27] but also visualize the complicated causal relationships among the criteria and dimensions through matrices and graphs [28]. In particular, the causal relationships between criteria and domains can be converted into an intelligible structure [27]. In other words, the DEMATEL approach is used to simplify complex situations and problems to assist in effective decision-making. It has been verified that this method can efficiently unravel intertwined and complicated problem groups [28]. Thus, DEMATEL has been extensively applied in a diverse range of areas, such as marketing [29], service quality [10,30], healthcare [31,32], education [33,34], and tourism [35]. However, as noted above, the reliance upon expert judgements may be overly subjective and problematic.
The SEM and DEMATEL causality exploration methods each possess their own strengths and limitations. The novelties of the research approach proposed in this study are illustrated as follows. In order to avoid reliance upon the subjective preferences of the expert system, this study collects survey data and uses an SEM approach to reveal the reciprocal causal relations among criteria and dimensions. Meanwhile, to avoid the requirements of a presumed hypotheses research framework, complicated parameter estimation, and over-modification for a better model fit, DEMATEL is applied to reveal the intricate interdependence of causal relationships among the criteria and dimensions. This novel method not only retains the advantages of both the SEM and DEMATEL methods but also eliminates their limitations. In addition, the consistency of causality of the literature-driven hypotheses of the SEM research framework and the results of the DEMATEL method can be further verified. To summarize, this approach entails the following two steps. Firstly, SEM, a data-driven causality exploration method is implemented to reveal the direct path coefficients between variables and latent indicators. Secondly, the DEMATEL is applied to confirm the interdependence among all of the criteria and dimensions. This new method is called SEM-DEMATEL. In addition, the feasibility, validity and reliability of the SEM-DEMATEL method is demonstrated by applying it to an empirical example exploring the key factors of mobile-payment (m-payment) usage intention.
Today’s world has been heavily impacted by the COVID-19 pandemic. This pandemic has altered consumer behavior [36]. The need to maintain physical distances has led to contactless m-payment becoming an effective epidemic-prevention transaction method. Thus, despite the current severe economic downturn, m-payment transactions are growing. This pandemic has facilitated growth in the mobile-payment market [37] with an immense increase to USD 1146 billion in 2019 and could reach USD 3081 billion globally by 2024, a compound annual growth rate of 23.2% [38]. Continued prosperity along with increased competition between m-payment platforms in the future can be expected. Therefore, this empirical study aims to explore the critical factors affecting mobile-payment users’ usage intention and offer practical suggestions for improving the sustainability of mobile-payment platforms.
The rest of this paper contains the following five segments. Section 2 reviews the literature on the proposed empirical research model. Section 3 explains the novel SEM-DEMATEL method. Section 4 delineates the development of the research framework and details the results. Section 5 includes a discussion and offers managerial implications and practical suggestions. The last section offers some conclusions.
2. Literature Review
This section consists of three segments: a review of the literature related to consumers’ usage intention of m-payment, the methods employed in those studies, and the theoretical background of the research framework constructed in this study.
2.1. M-Payment Usage Intention
In the literature, m-payment is defined as the “payments for goods, services, and bills with a mobile device by taking advantage of wireless and other communication technologies” [39] (p. 165). Progress in technological innovation has encouraged the trend increased m-payment usage [40]. M-payment platforms are searching for ways to improve services and provide customers with functions to enhance user loyalty and usage intention. Considerable research has been conducted to explore various theories and develop research methods in order to investigate the critical factors influencing behavioral intention for m-payment [41,42,43].
Dahlberg et al. [37] utilized the five forces model to analyze the m-payment market and investigate the influencing factors of consumers’ usage intention. Zmijewska and Lawrence [44] developed a research framework comprising both user adoption perspective and infrastructure perspective, such as stakeholder collaboration and regulation, and suggested that because of their mutual dependence and equal significance, these two perspectives should be examined together. Kim et al. [45] proposed a model combining four m-payment system characteristics of mobility, reachability, compatibility, and convenience and two user centric factors of personal innovativeness and m-payment knowledge to investigate the factors influencing usage intention. They argued that perceived usefulness and perceived ease of use were the key elements. Wong et al. [46] employed both the technology acceptance model (TAM) and prospect theory to evaluate the senior generation’s adoption of m-payment. They confirmed that the perceived effectiveness of gamification was significantly influenced by the perceived enjoyment and was the key factor of m-payment usage intention. In their examination of user intention in the Cambodian m-payment market, Do et al. [47] found that expected effort and performance expectancy were the crucial factors of usage intention. Liu et al. [48] considered the factors impacting m-payment usage intention as both beneficial and risky aspects and concluded that the perceived value, perceived risk, and perceived benefit were the crucial factors for adoption intention.
2.2. Existing Research Methods
Numerous studies have applied statistical methods to investigate the factors influencing consumers’ behavioral intentions to adopt mobile payment: most often multiple regression analysis [40], partial least squares-structural equation modelling (PLS-SEM), and SEM. Yang et al. [49] used PLS-SEM to examine the usage intention of e-wallet users and argued that the factors of perceived trust, lifestyle compatibility, facilitating conditions, perceived usefulness, social influence, and perceived ease of use were of concern. Christian et al. [50] also applied PLS-SEM to investigate the usage intention of near-field communication (NFC) mobile payments in Indonesia and emphasized the importance of e-service quality and NFC indicators. Lin et al. [41] utilized SEM to clarify the causal relationships among the dimensions of innovation resistance, perceived usefulness, perceived ease of use, and usage intention. They argued that perceived usefulness and perceived ease of use positively influence usage intention, while innovation resistance negatively impacts both perceived usefulness and perceived ease of use. de Sena Abrahão et al. [43] employed PLS-SEM to survey the adoption of m-payments in Brazil and confirmed that performance expectation, effort expectation, social influence, and perceived risk have positive effects on the user’s behavioral intention.
However, research using MCDM has been limited [51]. Chou et al. [52] employed the analytic hierarchy process (AHP) to evaluate the performance of e-payment systems for online commerce businesses. Osmani et al. [53] also used AHP to investigate Iranian e-payment systems, emphasizing the importance of security infrastructure. Mu and Lee [54] utilized two methods, fuzzy AHP (FAHP) and technique for order preference by similarity to an ideal solution (TOPSIS), to compare the factors of influence for online payment system usage intention in China and Korea and concluded that the most crucial factor for the Chinese was price value, but for Koreans, it was perceived credibility. Kapoor et al. [55] applied fuzzy TOPSIS to evaluate ten literature-derived criteria for m-wallet service quality and confirmed the significance of perceived security, trust, perceived ease of use, perceived usefulness, and responsiveness. Moslehi et al. [56] used a cart algorithm to analyze consumers’ usage intention of e-payment in Iran. They proposed that the most important influencing factors were information and communication technology development, business prosperity, and social-economic indices.
2.3. Evaluating Criteria for M-Payment Usage Intention
Perceived value is defined as the consumer’s overall evaluation of perceived benefits [57]. It has been proven that perceived value has a significantly positive effect on consumers’ usage intention in the m-payment market [48,58]. Shaw and Sergueeva [59] employed the modified unified theory of acceptance and use of technology 2 (UTAUT2) model to explore the factors affecting usage intention in the Canadian m-payment market to find that hedonic motivation and perceived value greatly influenced usage intention. Liu et al. [48] regarded the factors of perceived value, perceived benefit, and perceived risk as the three critical criteria for m-payment usage intention.
Studies have been carried out to further comprehend consumers’ behavioral intention and to explore and classify the essential elements of perceived value in relation to various markets or products [60]. Sheth et al. [61] regarded perceived value as a combination of economic, psychological and sociological perceptions and marketing aspects. They argued that perceived value can be broken down into five categories: functional, social, emotional, epistemic, and conditional value. Furthermore, one research investigated the retail market and categorized perceived value into four segments of emotional value, social value, quality, and price [62]. Holbrook [63] divided perceived value into three categories: self-oriented and other-oriented, intrinsic and extrinsic nature, and active and passive. In the studies examining the perceived value of e-commerce consumers, Overby and Lee [64] emphasized the significance of price saving, time saving, selection, and service; Peng and Liang [65] sorted the perceived value into social value, emotional value, price value, and functional value.
Gamification has been defined as “the use of game design elements, in a non-game context” [66] (p.1) and has been confirmed to increase the user’s engagement and encourage purchasing [67]. Over the last decade, gamification has boomed and attracted a great deal of attention both academically and practically in many fields, such as learning and education [68], human resource management [69], marketing [70], and many others, certainly including the m-payment field. Wong et al. [46] emphasized that the effective application of gamification could stimulate the senior generation’s adoption of mobile payment, with perceived enjoyment being the key factor to improve the effectiveness of gamification. Bùi and Bùi [42] used a modified UTAUT model to examine the consumer’s usage intention of m-payment. They considered the factors of performance expectancy, expected effort, trust, and gamification to have a substantial impact on usage intention.
Meanwhile, several studies have explored the factors of influence on the use of gamification to improve consumer satisfaction, including immersion-related features [71,72], achievement-related features [73], social-relatedness features [71], autonomy needs [74,75], competency needs [74,75], and relatedness needs [74].
Theories developed to explain the increased popularity and consumer acceptance and motivation to use of technology include the technology acceptance model (TAM) [76], innovation of diffusion theory (IDT) [77], theory of planned behavior (TPB) [78], UTAUT [79], and many others. These have been combined [80] or extended one theory [81] to develop different research models. Among those theories, UTAUT, proposed by Venkatesh et al. [82], suggests that consumer behavior related to the adoption of new technological products or systems is impacted by four indicators: performance expectancy, expected effort, social influence, and facilitating conditions. Christian et al. [50] investigated the Indonesian NFC m-payment market. They applied the TAM model to examine the causal relationships among the dimensions of e-service quality, perceived usefulness, NFC indicators, perceived ease of use, and usage intention and declared user behavioral intention to be significantly affected by the NFC indicators of e-service quality. Lin et al. [41] combined TAM and the innovation resistance theory (IRT) to scrutinize the Taiwanese m-payment market and argued that perceived usefulness and ease of use positively impact usage intention, and innovation resistance negatively influences perceived usefulness and perceived ease of use. de Sena Abrahão et al. [43] utilized a modified UTAUT to inspect the Brazilian m-payment users’ motivation and identified that social influence, effort expectation, performance expectation, and perceived risk were crucial influential factors
Additionally, personal innovativeness, referring to the consumer’s individual characteristics for the application of new technological products [50], has also be verified as one of the essential influencing factors of technological product applications [83]. Furthermore, with the world so harshly affected by the spread of COVID-19 since 2020, infection prevention has led consumers to change their payment behavior [36] and adopt contactless payment mode. People’s preference for a contactless payment method has facilitated growth of the m-payment market [37]. Thus, infection prevention is also deemed as one of the criteria motivating consumers’ usage intention of mobile payment.
Based on the afore-mentioned studies, the three dimensions of motivation [41], perceived value [59], and gamification [42,46] are selected to evaluate mobile payment usage intention in this empirical study. In addition, the following criteria are included: gamification, which involves immersion-related features, achievement-related features, social-relatedness features, satisfaction of autonomy needs, competency needs, and relatedness needs; the criteria of motivation, consisting of COVID-19 infection prevention, performance expectancy, expected effort, social influence, and personal innovativeness; and the criteria of perceived value, including functional value, emotional value and social value.
To summarize, three dimensions of motivation (D1), gamification (D2), and perceived value (D3) were identified; 14 criteria were selected (C1 to C14) within these three dimensions to verify the causal relationships among the dimensions and criteria affecting m-payment during the COVID-19 pandemic.
3. Methodology
This section provides an overview of the innovative SEM-DEMATEL method, how it overcomes the disadvantages of the original SEM and DEMATEL approaches, and demonstrates the operational procedures of this new method.
3.1. The Fitness of Combining SEM with DEMATEL
SEM has been widely employed to test hypothesized research models by collecting large-sized samples. The advantages of this approach are that all of the latent, exogenous, and endogenous variables can be estimated contemporaneously, verifying the reciprocal causal relations, and, in particular, revealing all of the direct or indirect effects among the variables and latent indicators. However, the requirements of entangled parameter estimation for model fitting lead to over-modification of the original research model so that it can only be applicable for that specific sample rather than generalizable. Furthermore, the entire SEM research framework has to be hypothesized based on previous studies; the issue of corroborating the trustworthiness of these over-modified assumptions should be of concern. This argument is corroborated by an empirical case in this study.
The DEMATEL is often utilized to develop a total influence relation matrix, which can be used to identify the causes and effects of various indicators. Certainly, this method can be used to confirm the interdependence among the criteria and domains, converting their causal relations into an intelligible structure, for visualization of the complicated causal relations in matrices and graphs. The DEMATEL can simplify intricate situations and problems; however, data are collected from expert judgements, which can be subjective.
The advantages and limitations of these methods complement each other. Thus, this study develops a novel method that combines the benefits of SEM and DEMATEL, which should be more convincing and facilely applicable.
3.2. Innovations and Improvements of the SEM-DEMATEL Method
This SEM-DEMATEL method not only retains the advantages and characteristics of SEM and DEMATEL but also removes their limitations. First of all, the data are derived from the collected surveys. The reciprocal causal relations among criteria and dimensions are revealed by the SEM approach, an improvement over the subjective preferences of expert judgements, as frequently applied in DEMATEL. Secondly, the interdependence and causal relationships among the criteria and dimensions are clarified by the DEMATEL method. Thus, the restrictions on the essentialities of independent exogenous variables, literature-based hypothesized research framework, and complicated parameter estimation can be averted.
3.3. Analytical Processes of the SEM-DEMATEL Method
The proposed SEM-DEMATEL method combines both SEM and DEMATEL methods to reveal the direct path coefficients, confirm the interdependence of criteria and dimensions, and convert their causal relationships into an intelligible structure. In order to distinguish between the traditional DEMATEL approach and the SEM-DEMATEL method, please see Figure 1. The operation process of the traditional DEMATEL is indicated by the black dotted line, and the procedure of the novel method is shown by the green dotted line. The research method was divided into the following four phases:
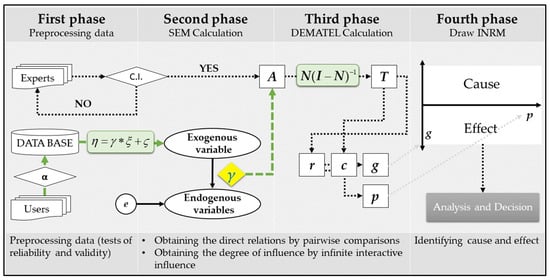
Figure 1.
Analytical processes.
- Preprocessing data: developing the survey, collecting and encoding data, and verifying the validity and reliability of the instrument;
- SEM approach: obtaining the direct relations by pairwise comparisons;
- DEMATEL approach: obtaining the degree of influence by infinite interactive influence;
- Constructing the INRM (influence network relationship map).
- Phase 1: Data Pre-processing
Traditional DEMATEL adopts expert judgements to assist in management decision-making and assumes that the viewpoints of experts from similar fields will be consistent; consensus is reached after digitizing the results of the experts’ evaluations. The traditional DEMATEL can thus be regarded as a consensus-driven approach. In the new method proposed in this study, the data are directly collected by surveys. Thus, the validity and reliability tests of the instrument are required in this phase.
- Step 1: Conduct Validity Tests
Haynes et al. [84] emphasized the significance of content validity and argued that the validity of a measurement illustrates the degree to which the instrument items are relevant to and representative of the measured constructs for a specific assessment purpose. The following process is used to confirm the validity in this study. First, the instrument is developed based on the literature. Second, a panel of experts is asked to assess the degree of representations of the variables; five participants are asked to confirm the clarity of the questionnaire content. Third, further pilot tests are executed and the Bartlett’s test of sphericity conducted [85].
- Step 2: Implement Reliability Tests
The Cronbach’s alpha, deemed an efficient technique to provide an estimate of the reliability [86], is applied in this study following the rule of thumb proposed by George and Mallery [87] as the follows: _ < 0.5→unacceptable, _ > 0.5 →Poor, _ > 0.6 → Questionable, _ > 0.7→ Acceptable, _ > 0.8 → Good, and _ > 0.9 → Excellent.
- Phase 2: Obtaining the Direct Relations by Pairwise Comparisons
- Step 1: Derive the Direct Influence Relations γ by Pairs
Unlike the traditional DEMATEL method, which obtains the initial direct influence relations from the survey responses of the experts [88], this study is based on the data-driven concept where the direct influence relations γ between two criteria are derived by the application of Equations (1) and (2).
where η, γ, and ς, respectively, represent latent dependent variables, direct influence of variables, and error.
- Step 2: Calculate the Direct Influence Relationship Matrix A
Each criterion is set as independent or dependent variables, respectively, as shown in Matrix A. Thus, the direct influence relations for the whole research model can be obtained as follows:
A case study is used for further illustration. For example, an evaluation system consists of three dimensions of D1, D2, and D3. First, D1 is set as an independent variable and D2 as a dependent variable. Using Equations (1) and (2), a12 can be derived. Next, D1 is set as an independent variable and D3 as a dependent variable. Using Equations (1) and (2), a13 can be derived, and so on. Six permutations of the direct influence relations (a12, a13, a21, a23, a31, a32) are systematically revealed, as depicted in Figure 2. The left side of Figure 2 shows the direct influence relations among three dimensions; the right side demonstrates the direct influence relationship matrix derived from the direct influence relations on the left.
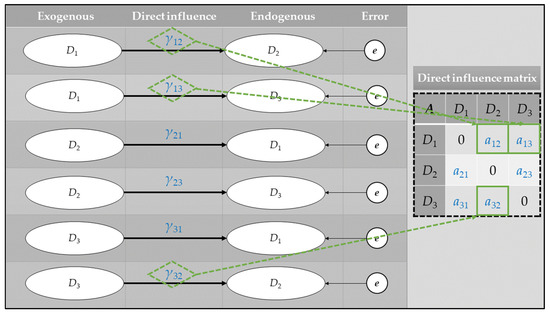
Figure 2.
The process of constructing the direct influence Matrix A.
- Phase 3: Acquiring the Degree of Influence from the Infinite Interactive Influence
- Step 1: Develop the Normalized Direct Influence Relationship Matrix N
Equations (4)–(6) are employed to de-unitize Matrix A to obtain the direct influence relationship Matrix N. Here, Ω represents the maximum sum of rows and columns; nij denotes the normalized element from Matrix A.
- Step 2: Obtain the Total Influence Relationship Matrix T
Based on the Markov chain theory, the total influence relationship Matrix T can be generated by computing the infinite series of interactive effects for each criterion as follows:
- Step 3: Calculate the Influence Relations
The influence relations of the criteria involve the influencing degree, the influenced degree, the total influence degree, and the net influence degree. In this step, Equation (9) is applied to accumulate the sum of the degree of influence of each criterion on the others, denoted as r.
The sum of the degree of influence that a criterion receives from the other criteria can be calculated using Equation (10) and is denoted as c.
The net influence degree, denoted as g, can be obtained by deducting the influenced degree from the influencing degree, as in Equations (11) and (12), and is recognized as the relation of that criterion.
The total influence, denoted as p, can be derived by taking the sum of the influencing and influenced degrees received by a criterion from the other criteria, following Equations (13) and (14); this indicates the prominence of that criterion.
- Phase 4: Drawing the Influence Network Relationship Map
In this phase, the INRM is constructed according to the total influence and the net influence, as depicted as Figure 3. The horizontal and vertical axes represent the influence degree and the causality of the criteria, respectively; the black circle identifies (0, 0). In the next two steps, all of the criteria are projected onto the coordinate axis and the causality diagram constructed for comparison of the mutual influence, verified in the total relationship matrix. The arrow with the greater influence is shown on the right in Figure 3 [89].
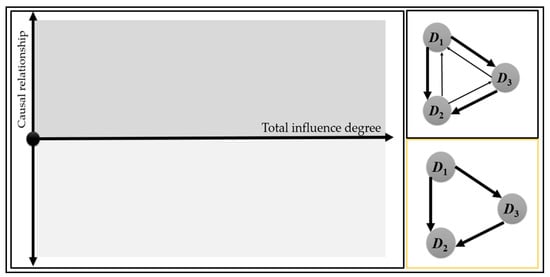
Figure 3.
Constructing the INRM.
4. Empirical Example
With the proliferation of advanced mobile devices and wireless network technologies, the penetration of mobile phones and internet users have increased considerably. This has further driven the mobile-payment (m-payment) market. Massive opportunities and development have led to the prediction of an immense increase in the size of the global m-payment market from $1180 billion in 2019 to up to $4573.8 billion by 2023 [90]. Furthermore, the current world situation has led to people tending to maintain physical distancing and to consider contactless payment as a safer transaction method. The coronavirus pandemic has altered consumers’ payment behavior [36] so that, despite the current severe economic downturn, the m-payment market remains prosperous, and this is expected to continue.
According to the Global Mobile Payment Users Report [91], the top five highest mobile-payment countries are China (81.1%), Denmark (40.9%), India (37.0%), South Korea (36.7%), and Sweden (36.2%). Compared with other countries, China has by far the highest mobile payment adoption rate, with 81.1% of smartphone users. Research and Markets [36] forecasts that the mobile-payment transaction amount in China will reach RMB 777.5 trillion in 2020. The two dominant m-payment platforms in China are Alipay and WeChat Pay, respectively, with more than 1.2 billion and 1.151 billion active users. Doubtless, the mobile payment business in China is not only extremely prosperous and successful but also extremely competitive, particularly for the two m-payment platforms of Alipay and WeChat Pay.
In addition, for m-payment platforms to improve and sustain competitive advantages, it is crucial to comprehend the factors influencing consumers’ usage intention. Efficient and accurate causality exploration leads to precise and advantageous decisions. Thus, this empirical research aims to identify the casual relationships among the criteria and dimensions of consumers’ usage intention in the Chinese m-payment market.
4.1. Identification of Criteria to Construct the Evaluation Framework
The influencing factors on m-payment consumers’ usage intentions have been discussed in numerous studies. Following the SEM approach, the research framework is initially developed based on an intensive review of the literature and then revised according to the results of three focus-group interviews and five individual interviews with academic experts. The research model includes 14 criteria under the three dimensions of motivation, gamification, and perceived value. Descriptions of the criteria appear in Table 1.

Table 1.
The constructed evaluation framework.
The motivation dimension refers to the factors of influence on consumers’ acceptance intentions of m-payment. This dimension comprises prevention of infection by COVID-19, performance expectancy, expected effort, social influence, and personal innovativeness. The gamification features dimension refers to game design elements that could stimulate consumers’ usage intention. This dimension comprises immersion-related features, achievement-related features, social-related features, autonomy needs, competency needs, and relatedness needs. Perceived value refers to the consumer’s overall evaluation of perceived benefits from the adoption of m-payments. It comprises functional value, emotional value, and social value.
4.2. The Data
The instrument used in this study is mainly designed based on previous research, with ratings made using a five-point Likert scale and verified by academic experts. A pilot test with 20 surveys was first conducted; the validity of the measurement was confirmed. For the main surveys, a total of 241 valid samples were assembled. The demographic information for the respondents is shown in Appendix A Table A2. The majority of the 241 respondents were aged 21 to 30 (68.0%), with only 7.1% below 20; most participants were university or college-educated or currently studying (87.1%) and earning a monthly income of less than RMB 4000 (51.9%).
We now discuss the encoding process, taking motivation (D1) as an example. The dimension of motivation involves five criteria: prevention of COVID-19 (C1), performance expectancy (C2), expected effort (C3), social influence (C4), and personal innovativeness (C5); each criterion has at least three items (see Table 2) [94].
Table 2.
The encoded data.
To confirm the scale validity and reliability, the Bartlett’s test of sphericity and Cronbach’s alpha were applied. According to the rule of thumb, as suggested by Kaiser [85] and Field [95], the Kaiser–Meyer–Olkin (KMO) value of 0.891 and the Cronbach’s alpha coefficients of dimensions ranging from 0.928 to 0.863 can be considered as good. The results confirmed that the survey items were relevant to and representative of the target constructs, and the multiple-question Likert scale measurement was reliable. In other words, the validity and reliability of this instrument were considered acceptable.
4.3. Acquiring the Direct and the Total Influence Relations of the Dimensions and Criteria
Unlike the traditional data collecting method of expert judgements used in DEMATEL analysis, the data were collected directly from participants. After encoding the collected data, the direct influence relations were calculated by using Equations (1) and (2). Take dimensions as an example. First, D1 is defined as an exogenous variable, and the other two dimensions (D2 and D3) are defined as endogenous variables. SEM is applied to obtain the direct relations, illustrated as estimates in Table 3 and Table 4. That is, D1 to D2 (0.323) and D1 to D3 (0.435). Following the above process, the D2 and D3 are, respectively, defined as exogenous variables; the direct relations of D2 to D1 (0.297), D2 to D3 (0.462), D3 to D1 (0.526), and D3 to D2 (0.655) are acquired. By analogy, following the same procedures, the direct relations of the criteria for each dimension can be gained by filling in the estimates in the corresponding positions, as depicted in Table 5, Table 6 and Table 7, labeled as Matrix A, and systematically assorted in Table A3. The results further confirm that the direct relations of the dimensions and criteria are statistically significant (p-Value < 0.05).
Table 3.
The direct influence of the dimensions.
Table 4.
The direct and total influence relations matrix of the dimensions.
Table 5.
The direct and total influence relations matrix of D1- motivation.
Table 6.
The direct and total influence relations matrix of D2- gamification.
Table 7.
The direct and total influence relations matrix of D3- perceived value.
The total influence relations, depicted in Table 4, Table 5, Table 6 and Table 7 and labeled Matrix T, are obtained by the application of Equations (4)–(8). The influence relations of the dimensions and criteria shown in Matrix A and Matrix T vary. Instead of assuming that all the exogenous variables are independent, which is not in accordance with the real world, DEMATEL considers the interdependent relationships of the factors when exploring the causality. The outcome can be regarded as corresponding more closely to reality and beneficial to practical decision-makers. Furthermore, unlike SEM, DEMATEL, computing the total interactive effects of each dimension and criterion, can provide more factual influencing degrees of factors.
Among the dimensions, as shown in Matrix A, D1-motivation impacts D3-perceived value more than D2-gamification (shown in Table 4); however, as indicated in Matrix T, D1-motivation impacts D2-gamification and D3-perceived value to the same degree. Furthermore, the effective strength of D1-motivation compared to D2-gamification increases from 0.320 in Matrix A to 1.041 in Matrix T. The degree of influence of hidden interactive effects can be discovered, and this issue should be addressed.
The direct and total relations among the criteria of D1-motivation are summarized in Table 5. Based on the order of the effective strengths, the top two in Matrix A are C1-prevention of COVID-19 infection to C4-social influence, followed by C4-social influence to C2-performance expectancy; however, according to the results in Matrix T, C4-social influence affects C2-performance expectancy the most, followed by the effect of C1-COVID-19 infection prevention on C4-social influence. In other words, in D1-motivation, the influence relations are altered because of the interactive effects among the criteria.
The direct and the total relations among the criteria of D2- gamification are summarized in Table 6. Based on the order of the effective strengths, the top three in Matrix A are C7-achievement features to C8-social features, followed by C6-immersion features to C7-achievement features and C10-competency needs to C11-relatedness needs; however, according to the results in Matrix T, C8-social features affects C7-achievement features the most, followed by C7-achievement features to C11-relatedness needs and C9-autonomy needs to C8-social features.
The direct and the total relations among the criteria of D3- perceived value are clarified in Table 7. In this dimension, the results in Matrix A and Matrix T are similar, both identifying that the greatest impact is from C13-emotional values to C14-social value, followed by C12-functional value to C14-social value.
4.4. Exploring the Influence Degrees of the Dimensions and the Criteria
Table 8 identifies the influence degree (r), the influenced degree (c), the total influence degree (p), and the net influence degree (g) of the dimensions and the criteria. Among the dimensions, according to the r values, D3 has the highest influence degree, followed by D2 and D3; the results for the c values confirm that D2 has the highest influenced degree; as to the total influence degree and the net influence degree, D1 has both the highest p value and g value. That is, perceived value (D3) has the highest prominence (6.959) and is the cause influencing the other two dimensions of gamification (D2; −0.537) and motivation (D1, −0.136).
Table 8.
The degree of influence of the dimensions and criteria.
The dimension of motivation (D1) consists of five criteria: COVID-19 infection prevention (C1), performance expectancy (C2), expected effort (C3), social influence (C4), and personal innovativeness (C5). Based on the p values, the criteria are ranked in the following order of prominence: social influence (C4; 7.594), expected effort (C3; 6.657), COVID-19 infection prevention (C1; 6.445), performance expectancy (C2; 6.429), and personal innovativeness (C5; 4.113). Meanwhile, the g values show that net causes include COVID-19 infection prevention (C1; 0.947), expected effort (C3; 0.572), and social influence (C4; 0.272).
In the dimension of gamification (D2), the p value results identify achievement features (C7; 12.156) as the most prominent, followed by social features (C8; 12.117), autonomy needs (C9; 11.670), immersion features (C6; 10.889), relatedness needs (C11; 10.640), and competency needs (C10; 10.404). The g values verify that the causes are immersion features (C6; 1.650), achievement features (C7; 0.916), and autonomy needs (C9; 0.178).
The dimension of gamification (D3) includes the three criteria of functional value (C12), emotional value (C13), and social value (C14). Based on the p values, they are ranked in order of prominence as follows: social value (C14; 3.634), emotional value (C13; 3.516), and functional value (C12; 3.059). The g values confirm that the causes are functional value (C12; 0.630) and emotional value (C13; 0.498).
Certainly, incorrect causality exploration will result in an improper decision. The INRM helps the decision-maker avoid causal errors by visualizing the interrelationship between indicators and identifying causal relationships among the factors. The INRMs clearly illustrated the causality based on the total influence and the net influence of the dimensions and the criteria as represented in Figure 4.

Figure 4.
INRMs of the dimensions and criteria.
In this empirical case, the findings conclude that the causality of the original literature-driven hypotheses proposed in the SEM model and the results of the SEM-DEMATEL method are different.
5. Discussion
This section involves comparing the discrepancies in the pre-hypothesized literature-driven SEM research model and the results by SEM-DEMATEL method, canvassing the theoretical implications and contributions of the SEM-DEMATEL method, discussing the managerial implications, and proffering suggestions to m-payment platforms.
5.1. Comparison of the Presumed Hypotheses SEM Model and SEM-DEMATEL Method Results
In SEM, the research framework is constructed based on previous research [21]. The proposed model constructed after an intensive literature review is shown on the left of Figure 5. Three hypotheses are proposed.
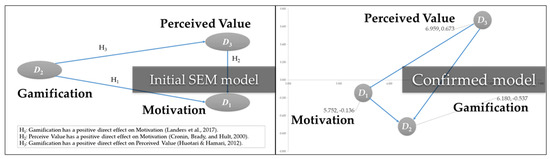
Figure 5.
The initial SEM model and the INRM of dimensions.
Hypothesis 1.
Gamification has a positive effect on motivation [96].
Hypothesis 2.
Perceived Value has a positive effect on motivation [97].
Hypothesis 3.
Gamification has a positive effect on perceived value [98].
However, according to the net influence values obtained in this empirical study, perceived value is confirmed as a causal dimension, influencing the other two dimensions of motivation and gamification, as depicted on the right of Figure 5. Note that this changes the initially proposed research framework as follows:
- Perceived value has a positive effect on gamification;
- Perceived value has a positive effect on motivation;
- Motivation has a positive effect on gamification.
5.2. Theoretical Implications
The SEM and DEMATEL methods have been widely applied and verified as efficient causality exploration research approaches. Both methods have their strengths and weaknesses. SEM has the advantage of being able to acquire estimates of the latent, exogenous, and endogenous variables and the manifestation of causalities between indicators comparatively effortlessly but has the limitation of requiring complicated parameter estimations and literature-driven presumed hypotheses to construct the research framework. DEMATEL, with the features of confirmation of interdependence and the simplification and visualization of confused causal relationships among the criteria and the dimensions, can effectively solve entangled and intricate problems but is dependent upon the subjective preferences of experts.
Significantly, the SEM and DEMATEL methods complement each other, and, therefore, we propose the SEM-DEMATEL research method. This novel method can not only maintain the respective advantages of both of SEM and DEMATEL but also compensate for their ineluctable limitations. This has theoretical implications.
5.3. Managerial Implications
It has been verified that DEMATEL can simplify complicated problems by visualizing complex causality relationships. These advantages assist decision-makers in identifying imperfections in existing systems and allocating limited resources for the most efficient improvement. Thus, based on the findings, the following suggestions are proposed.
Among the three dimensions, the results identify perceived value (D3) as a causal dimension, which simultaneously affects motivation (D1) and gamification (D2). In other words, perceived value (D3) is the most essential influencing indicator of m-payment usage intention. It is recommended that m-payment platforms endeavor to develop effective strategies to increase user satisfaction with perceived value. Meanwhile, the INRM for perceived value (D3) indicates that the criteria of emotional value (C13) and functional value (C12) are causes, which affect social value. In particular, emotional value (C13) has the highest total influence degree and should be considered as a crucial element for the m-platform to maintain its competitive advantages. These findings are consistent with the research of Sheth et al. [61].
In order to increase the m-payment user’s level of satisfaction and emotional value (C13) and further reinforce their loyalty and usage intention, it is suggested that m-payment platforms develop more attractive, entertaining, and novel components by implementing innovative artificial intelligence (AI) technologies like virtual reality (VR), designing more interesting games, providing more interesting interactive activities, or avatar role-playing during the application process. Emotional value can be improved by increased user enjoyment and stimulating their curiosity. To improve functional value (C12), it is suggested that the platform can enrich the functions of the m-payment system with more innovative and creative AI systems, such as offering an online virtual assistant to aid consumers with handling a variety of electricity, water, tax, or credit card bill payments; offering bill due reminder services; and providing consumers with abundant information about traveling, shopping, health-care, or updated infection prevention knowledge; augmenting a variety of new services to raise m-payment user’s perception of functional value.
Within the dimension of motivation (D1), the net influence values show that the criteria of COVID-19 infection prevention (C1), expected effort (C3), and social influence (C4) to be causes, with social influence (C4) being the most influential criterion. In other words, among the criteria in the dimension of motivation (D1), social influence (C4) is the most essential factor that influences usage intention. Therefore, it is suggested that m-payment platforms either create their own apps or use widely applied social platforms, such as Facebook, YouTube, and Instagram to develop strategies, such as the use of incentive rewards and emotional provocation and encouraging users to generate contents, to push ratings, and to increase network traffic.
Within the dimension of gamification (D2), the net influence values indicated that the three criteria of immersion features (C6), achievement features (C7), and autonomy needs (C9) are causal factors. According to the total influence values, achievement features (C7) is the most influential criterion. This result is consistent with the results of Suh et al. [73]. Thus, it is suggested that the m-payment platforms introduce gamification elements such as trophies, badges, leaderboards, and points during the process of accessing m-payment; furthermore, m-payment platforms could also hold competitions regularly and reward winners with points, prizes, discounts, or medals.
To summarize, the results identify the key causes and the most influential criteria for the whole research model and the three dimensions. Among the dimensions, perceived value (D3) plays the most significant role in reinforcing the consumer’s m-payment usage intention. In the dimension of perceived value (D3), social value is the most important factor for improving usage intention. In addition, achievement features (C7) and social influence (C4) are the key factors in gamification (D2) and motivation (D1), respectively.
Precise causality exploration is a prerequisite for efficacious decision-making. The results of this empirical study indicate the causal relationships between the dimensions and the criteria to assist decision-makers in the development of strategies for improvement and practical suggestions for the development of m-payment platforms.
6. Conclusions
A precise causality exploration method is the foundation of effective decision-making. Both SEM and DEMATEL have been confirmed as efficient tools for the verification of causal relationships between complicated variables, but each has its advantages, distinguishing features, and limitations. The SEM method can be used to make estimates of latent, exogenous, and endogenous variables, and verification of the reciprocal causal relations between indicators can be completed simultaneously and facilely. The data-driven results are comparatively convincing. However, this method also requires complex parameter estimations or over-trimming of the initially proposed literature-driven model. The DEMATEL approach allows rigorous confirmations of interdependence and clear visualization of the confused causal relationships among criteria attract; however, it is reliant upon subjective expert judgements for preferences.
This study explores the SEM-DEMATEL method, which combines the advantages of SEM and DEMATEL while overcoming their limitations. The results of causality exploration by this novel method differ from those obtained with the traditional literature-driven SEM research model. Without the complex parameter estimation requirements, this SEM-DEMATEL method is more operationally facile, making it easier for the practitioner to use, and there is no need for over-trimming of the models, so the causality explorations can be more precise.
This novel method was employed in an empirical case study to explore the key factors of m-payment usage intention. The dimension and criteria were categorized into two cause and effect groups based on the net influence degree results. The key influencing factors were identified after exploring the total influence degrees of the dimensions and criteria in the causal groups. The results differed from those obtained with the presumed hypotheses research model and confirm that perceived value simultaneously positively impacts both motivation and gamification, while motivation positively affects gamification. In other words, perceived value plays a significant role in affecting the usage intention of m-payment users, while emotional value is the most crucial factor for improving the consumer’s perceived value, followed by functional value. Based on the findings, some practical suggestions were also proposed. This study makes valuable contributions academically and practically.
Some limitations remain. Firstly, this novel SEM-DEMATEL method was only employed on one case; this could be one of the limitations for verifying the advantages and limitations of this research method. Secondly, the target participants were Alipay and WeChat Pay users only. Thus, obtaining questionnaire responses from more countries and a more diverse group of users would be necessary to generalize the results to global m-payment businesses and allow for a more multifaceted approach.
Future empirical research is suggested to experiment with and make improvements to this new method. Furthermore, while adhering to the core concepts of the SEM-DEMATEL method, different approaches could be added, such as a modified VIKOR method, to clarify the gap between the performance and aspiration levels of the criteria/dimensions. The results of future research can be compared with those described above.
Author Contributions
Conceptualization, C.C.F., J.J.H.L., and S.-W.H.; methodology, S.-W.H.; software, C.C.F. and S.-W.H.; formal analysis, C.C.F. and S.-W.H.; investigation, Y.-C.W.; validation, S.-W.H.; resources, S.-W.H., Y.-C.W., and H.-H.H.; data curation, J.J.H.L.; writing—original draft preparation, C.C.F. and S.-W.H.; reviewing and editing, J.J.H.L.; visualization, S.-W.H. and J.J.H.L.; supervision, G.-H.T. and J.J.H.L.; project administration, G.-H.T. All authors have read and agreed to the published version of the manuscript.
Funding
This research was funded by the Ministry of Science and Technology, Taiwan, grant number MOST 107-2410-H-305-038-MY3, MOST 108-2221-E-305-002-MY3 and MOST 109-2410-H-305-056.
Institutional Review Board Statement
Not applicable.
Informed Consent Statement
Not applicable.
Data Availability Statement
Not applicable.
Acknowledgments
The authors are extremely grateful for the editorial team’s valuable comments on improving the quality of this article.
Conflicts of Interest
The authors declare no conflict of interest.
Appendix A
Table A1.
List of symbols.
Table A1.
List of symbols.
| Term | Definition |
|---|---|
| i | Row |
| j | Column |
| m | Number of Criteria |
| Direct influence relationship matrix | |
| Normalized direct influence relationship matrix | |
| Maximum of the sum of rows and columns | |
| Total influence relationship matrix | |
| Degree of influence | |
| Degree influenced | |
| The degree of net influence | |
| Total influence degree | |
| ξ | Latent independent variable |
| Latent dependent variables | |
| Direct influence of variables | |
| Error |
Table A2.
Demographic profile of the respondents (N = 241).
Table A2.
Demographic profile of the respondents (N = 241).
| Characteristics | Items | Count | Percentage (%) |
|---|---|---|---|
| Gender | Male | 113 | 46.9 |
| Female | 102 | 53.1 | |
| Age | Below 20 | 33 | 13.7 |
| 20–29 | 164 | 68.0 | |
| 30–39 | 29 | 12.0 | |
| 40 and Above | 15 | 6.3 | |
| Education Level | Below high school | 2 | 0.8 |
| High school | 29 | 12.0 | |
| College/University | 189 | 78.4 | |
| Master’s and above | 21 | 8.7 | |
| Occupation | Student | 159 | 66 |
| Businessman/woman | 56 | 23.2 | |
| Teacher | 3 | 1.2 | |
| Retired | 3 | 1.2 | |
| Other | 20 | 8.3 | |
| Monthly Income | Less than RMB 4000 | 125 | 51.9 |
| RMB 4001–RMB 6000 | 34 | 14.1 | |
| RMB 6001–RMB 8000 | 10 | 4.1 | |
| RMB 8001–RMB 10,000 | 19 | 7.9 | |
| Greater than RMB 10,000 | 44 | 18.3 |
Table A3.
The direct influences of criteria.
Table A3.
The direct influences of criteria.
| Dep. | Ind. | Estimate | S.E. | C.R. | P | Dep. | Ind. | Estimate | S.E. | C.R. | P | ||
|---|---|---|---|---|---|---|---|---|---|---|---|---|---|
| C2 | <--- | C1 | 0.710 | 0.123 | 5.769 | *** | C7 | <--- | C6 | 0.988 | 0.136 | 7.285 | *** |
| C3 | <--- | C1 | 0.626 | 0.104 | 6.006 | *** | C8 | <--- | C6 | 0.764 | 0.126 | 6.057 | *** |
| C4 | <--- | C1 | 0.946 | 0.146 | 6.475 | *** | C9 | <--- | C6 | 0.820 | 0.135 | 6.072 | *** |
| C5 | <--- | C1 | 0.542 | 0.127 | 4.258 | *** | C10 | <--- | C6 | 0.633 | 0.125 | 5.078 | *** |
| C1 | <--- | C2 | 0.450 | 0.078 | 5.771 | *** | C11 | <--- | C6 | 0.695 | 0.131 | 5.283 | *** |
| C3 | <--- | C2 | 0.555 | 0.062 | 9.012 | *** | C6 | <--- | C7 | 0.695 | 0.099 | 7.014 | *** |
| C4 | <--- | C2 | 0.701 | 0.085 | 8.258 | *** | C8 | <--- | C7 | 1.272 | 0.140 | 9.107 | *** |
| C5 | <--- | C2 | 0.257 | 0.084 | 3.060 | *** | C9 | <--- | C7 | 0.777 | 0.108 | 7.208 | *** |
| C1 | <--- | C3 | 0.633 | 0.105 | 6.004 | *** | C10 | <--- | C7 | 0.691 | 0.108 | 6.371 | *** |
| C2 | <--- | C3 | 0.917 | 0.101 | 9.070 | *** | C11 | <--- | C7 | 0.684 | 0.108 | 6.308 | *** |
| C4 | <--- | C3 | 0.818 | 0.118 | 6.937 | *** | C6 | <--- | C8 | 0.648 | 0.106 | 6.100 | *** |
| C5 | <--- | C3 | 0.356 | 0.114 | 3.131 | *** | C7 | <--- | C8 | 0.789 | 0.088 | 8.957 | *** |
| C1 | <--- | C4 | 0.647 | 0.116 | 5.563 | *** | C9 | <--- | C8 | 0.805 | 0.101 | 7.981 | *** |
| C2 | <--- | C4 | 0.932 | 0.131 | 7.123 | *** | C10 | <--- | C8 | 0.602 | 0.094 | 6.413 | *** |
| C3 | <--- | C4 | 0.868 | 0.129 | 6.707 | *** | C11 | <--- | C8 | 0.735 | 0.104 | 7.080 | *** |
| C5 | <--- | C4 | 0.711 | 0.150 | 4.728 | *** | C6 | <--- | C9 | 0.595 | 0.097 | 6.120 | *** |
| C1 | <--- | C5 | 0.289 | 0.068 | 4.261 | *** | C7 | <--- | C9 | 0.729 | 0.100 | 7.285 | *** |
| C2 | <--- | C5 | 0.220 | 0.072 | 3.066 | *** | C8 | <--- | C9 | 0.835 | 0.103 | 8.092 | *** |
| C3 | <--- | C5 | 0.171 | 0.055 | 3.129 | *** | C10 | <--- | C9 | 0.794 | 0.105 | 7.548 | *** |
| C4 | <--- | C5 | 0.415 | 0.079 | 5.234 | *** | C11 | <--- | C9 | 0.767 | 0.100 | 7.674 | *** |
| C13 | <--- | C12 | 0.599 | 0.084 | 7.156 | *** | C6 | <--- | C10 | 0.410 | 0.081 | 5.061 | *** |
| C14 | <--- | C12 | 0.915 | 0.112 | 8.141 | *** | C7 | <--- | C10 | 0.522 | 0.081 | 6.457 | *** |
| C12 | <--- | C13 | 0.545 | 0.076 | 7.162 | *** | C8 | <--- | C10 | 0.563 | 0.087 | 6.474 | *** |
| C14 | <--- | C13 | 1.181 | 0.113 | 10.440 | *** | C9 | <--- | C10 | 0.593 | 0.078 | 7.612 | *** |
| C12 | <--- | C14 | 0.355 | 0.045 | 7.949 | *** | C11 | <--- | C10 | 0.863 | 0.089 | 9.719 | *** |
| C13 | <--- | C14 | 0.541 | 0.053 | 10.275 | *** | C6 | <--- | C11 | 0.410 | 0.077 | 5.296 | *** |
| C7 | <--- | C11 | 0.488 | 0.077 | 6.308 | *** | |||||||
| C8 | <--- | C11 | 0.589 | 0.084 | 6.985 | *** | |||||||
| C9 | <--- | C11 | 0.594 | 0.078 | 7.630 | *** | |||||||
| C10 | <--- | C11 | 0.769 | 0.081 | 9.508 | *** |
Note: “***” stands for “p-Value < 0.05”. Dep. stands for Dependent Variable; Ind. stands for Independent Variable.
References
- Hlaváčková-Schindler, K.; Paluš, M.; Vejmelka, M.; Bhattacharya, J. Causality detection based on information-theoretic approaches in time series analysis. Phys. Rep. 2007, 441, 1–46. [Google Scholar] [CrossRef]
- Kaswan, M.S.; Rathi, R. Analysis and modeling the enablers of green lean six sigma implementation using interpretive structural modeling. J. Clean. Prod. 2019, 231, 1182–1191. [Google Scholar] [CrossRef]
- Majumdar, A.; Sinha, S.K. Analyzing the barriers of green textile supply chain management in Southeast Asia using interpretive structural modeling. Sustain. Prod. Consum. 2019, 17, 176–187. [Google Scholar] [CrossRef]
- Troster, V.; Shahbaz, M.; Uddin, G.S. Renewable energy, oil prices, and economic activity: A Granger-causality in quantiles analysis. Energy Econ. 2018, 70, 440–452. [Google Scholar] [CrossRef]
- McGraw, M.C.; Barnes, E.A. Memory matters: A case for Granger causality in climate variability studies. J. Clim. 2018, 31, 3289–3300. [Google Scholar] [CrossRef]
- Huynh, T.L.D. The effect of uncertainty on the precious metals market: New insights from Transfer Entropy and Neural Network VAR. Resour. Policy 2020, 66, 101623. [Google Scholar] [CrossRef]
- Lucchini, M.; Pini, N.; Burtchen, N.; Signorini, M.G.; Fifer, W.P. Transfer entropy modeling of newborn cardiorespiratory regulation. Front. Physiol. 2020, 11, 1095. [Google Scholar] [CrossRef]
- Poomagal, S.; Sujatha, R.; Kumar, P.S.; Vo, D.V.N. A fuzzy cognitive map approach to predict the hazardous effects of malathion to environment (air, water and soil). Chemosphere 2021, 263, 127926. [Google Scholar] [CrossRef]
- Lo, H.W.; Liou, J.J.; Tzeng, G.H. Comments on “Sustainable recycling partner selection using fuzzy DEMATEL-AEW-FVIKOR: A case study in small-and-medium enterprises”. J. Clean. Prod. 2019, 228, 1011–1012. [Google Scholar] [CrossRef]
- Liou, J.J.; Chuang, Y.C.; Zavadskas, E.K.; Tzeng, G.H. Data-driven hybrid multiple attribute decision-making model for green supplier evaluation and performance improvement. J. Clean. Prod. 2019, 241, 118321. [Google Scholar] [CrossRef]
- Dachyar, M.; Banjarnahor, L. Factors influencing purchase intention towards consumer-to-consumer e-commerce. Intang. Cap. 2017, 13, 946–966. [Google Scholar] [CrossRef]
- Alafeshat, R.; Aboud, F. Servant leadership impact on organizational performance: The mediating role of employee engagement. Int. J. Hum. Resour. 2019, 9, 85–100. [Google Scholar] [CrossRef]
- Burnette, J.L.; Williams, L.J. Structural equation modeling (SEM): An introduction to basic techniques and advanced issues. In Research in Organizations: Foundations and Methods of Inquiry; Berrett-Koehler Publishers: San Francisco, CA, USA, 2005; pp. 143–160. [Google Scholar]
- Wang, Y.; Byrd, T.A. Business analytics-enabled decision-making effectiveness through knowledge absorptive capacity in health care. J. Knowl. Manag. 2017, 21, 517–539. [Google Scholar] [CrossRef]
- Liu, A.X.; Hsu, C.H.; Fan, D.X. From brand identity to brand equity: A multilevel analysis of the organization–employee bidirectional effects in upscale hotels. Int. J. Contemp. Hosp. Manag. 2020, 32, 2285–2304. [Google Scholar] [CrossRef]
- Schreiber, J.B.; Nora, A.; Stage, F.K.; Barlow, E.A.; King, J. Reporting structural equation modeling and confirmatory factor analysis results: A review. J. Educ. Res. 2006, 99, 323–338. [Google Scholar] [CrossRef]
- Jeon, J. The strengths and limitations of the statistical modeling of complex social phenomenon: Focusing on SEM, path analysis, or multiple regression models. Int. J. Econ. Manag. 2015, 9, 1634–1642. [Google Scholar]
- Farrell, A.D. Structural equation modeling with longitudinal data: Strategies for examining group differences and reciprocal relationships. J. Consult. Clin. Psychol. 1994, 62, 477–487. [Google Scholar] [CrossRef] [PubMed]
- Maass, W.; Parsons, J.; Purao, S.; Storey, V.C.; Woo, C. Data-driven meets theory-driven research in the era of big data: Opportunities and challenges for information systems research. J. Assoc. Inf. Syst. 2018, 19, 1. [Google Scholar] [CrossRef]
- Günther, W.A.; Mehrizi, M.H.; Huysman, M.; Feldberg, F. Debating big data: A literature review on realizing value from big data. J. Strateg. Inf. Syst. 2017, 26, 191–209. [Google Scholar] [CrossRef]
- Weston, R.; Gore, P.A., Jr. A brief guide to structural equation modeling. Couns. Psychol. 2006, 34, 719–751. [Google Scholar] [CrossRef]
- Byrne, B.M. Structural Equation Modeling with LISREL, PRELIS, and SIMPLIS: Basic Concepts, Applications, and Programming, 1st ed.; Psychology Press: New York, NY, USA, 1998; p. 432. [Google Scholar]
- Bollen, K.A. A new incremental fit index for general structural equation models. Sociol. Methods Res. 1989, 17, 303–316. [Google Scholar] [CrossRef]
- Gerbing, D.W.; Anderson, J.C. On the meaning of within-factor correlated measurement errors. J. Consum. Res. 1984, 11, 572–580. [Google Scholar] [CrossRef]
- Diamantopoulos, A.; Siguaw, J.A. Introducing LISREL: A Guide for the Uninitiated, 1st ed.; SAGE Publications Ltd.: New York, NY, USA, 2000; p. 192. [Google Scholar]
- Wei, P.L.; Huang, J.H.; Tzeng, G.H.; Wu, S.I. Causal modeling of web-advertising effects by improving SEM based on DEMATEL technique. Int. J. Inf. Technol. Decis. Mak. 2010, 9, 799–829. [Google Scholar] [CrossRef]
- Tzeng, G.H.; Chen, W.H.; Yu, R.; Shih, M.L. Fuzzy decision maps: A generalization of the DEMATEL methods. Soft Comput. 2010, 14, 1141–1150. [Google Scholar] [CrossRef]
- Gabus, A.; Fontela, E. World Problems, an Invitation to Further Thought within the Framework of DEMATEL; Battelle Geneva Research Center: Geneva, Switzerland, 1972; pp. 1–8. [Google Scholar]
- Wang, Y.L.; Tzeng, G.H. Brand marketing for creating brand value based on a MCDM model combining DEMATEL with ANP and VIKOR methods. Expert Syst. Appl. 2012, 39, 5600–5615. [Google Scholar] [CrossRef]
- Hsu, C.C.; Liou, J.J.H.; Lo, H.W.; Wang, Y.C. Using a hybrid method for evaluating and improving the service quality of public bike-sharing systems. J. Clean. Prod. 2018, 202, 1131–1144. [Google Scholar] [CrossRef]
- Hsu, W.C.J.; Liou, J.J.H.; Lo, H.W. A group decision-making approach for exploring trends in the development of the healthcare industry in Taiwan. Decis. Support Syst. 2021, 141, 113447. [Google Scholar] [CrossRef]
- Liou, J.J.H.; Lu, M.T.; Hu, S.K.; Cheng, C.H.; Chuang, Y.C. A hybrid MCDM model for improving the electronic health record to better serve client needs. Sustainability 2017, 9, 1819. [Google Scholar] [CrossRef]
- Hu, S.K.; Liou, J.J.; Lu, M.T.; Chuang, Y.C.; Tzeng, G.H. Improving NFC technology promotion for creating the sustainable education environment by using a hybrid modified MADM Model. Sustainability 2018, 10, 1379. [Google Scholar] [CrossRef]
- Jeong, J.S.; González-Gómez, D. Adapting to PSTs’ Pedagogical Changes in Sustainable Mathematics Education through Flipped E-Learning: Ranking Its Criteria with MCDA/F-DEMATEL. Mathematics 2020, 8, 858. [Google Scholar] [CrossRef]
- Zhu, B.W.; Huang, Z.; Xiong, L. Application of the Kano Model and DEMATEL Technique to Explore Sustainable Promotion Strategies for Thai-Chinese Temples as Tourist Attractions. Religions 2020, 11, 199. [Google Scholar] [CrossRef]
- Global and China Mobile Payment Industry Report, 2020–2026. Available online: https://www.researchandmarkets.com/reports/5021655/global-and-china-mobile-payment-industry-report (accessed on 4 May 2020).
- Zhao, Y.; Bacao, F. How Does the Pandemic Facilitate Mobile Payment? An Investigation on Users’ Perspective under the COVID-19 Pandemic. Int. J. Environ. Res. Public Health 2021, 18, 1016. [Google Scholar] [CrossRef]
- Global Mobile Payment Market to Exceed US$ 3081 Billion by 2024, Enhanced Security and Convenience Catalyzing Growth. Available online: https://www.imarcgroup.com/global-mobile-payment-market (accessed on 10 April 2021).
- Dahlberg, T.; Mallat, N.; Ondrus, J.; Zmijewska, A. Past, present and future of mobile payments research: A literature review. Electron Commer. Res. Appl. 2008, 7, 165–181. [Google Scholar] [CrossRef]
- Mobile Payments Worldwide-Statistics Facts. Available online: https://www.statista.com/topics/4872/mobile-payments-worldwide/ (accessed on 10 November 2020).
- Lin, C.W.; Lee, S.S.; Tang, K.Y.; Kang, Y.X.; Lin, C.C.; Lin, Y.S. Exploring the user’s behavior intention on mobile payment by using TAM and IRT. In Proceedings of the 2019 3rd International Conference on E-Society, E-Education and E-Technology, Taichung, Taiwan, 15–17 August 2019. [Google Scholar]
- Bùi, T.T.H.; Bùi, H.T. Gamification impact on the acceptance of mobile payment in Ho Chi Minh City, Vietnam. Int. J. Soc. Sci. Econ. Res. 2018, 3, 4822–4837. [Google Scholar]
- de Sena Abrahão, R.; Moriguchi, S.N.; Andrade, D.F. Intention of adoption of mobile payment: An analysis in the light of the Unified Theory of Acceptance and Use of Technology (UTAUT). RAI Rev. Adm. Inov. 2016, 13, 221–230. [Google Scholar] [CrossRef]
- Zmijewska, A.; Lawrence, E. Implementation models in mobile payments. ACST 2006, 6, 19–25. [Google Scholar]
- Kim, C.; Mirusmonov, M.; Lee, I. An empirical examination of factors influencing the intention to use mobile payment. Comput. Hum. Behav. 2010, 26, 310–322. [Google Scholar] [CrossRef]
- Wong, D.; Liu, H.; Meng-Lewis, Y.; Sun, Y.; Zhang, Y. Gamified money: Exploring the effectiveness of gamification in mobile payment adoption among the silver generation in China. Inf. Technol. People 2021, 34, 1–35. [Google Scholar]
- Do, N.; Tham, J.; Khatibi, A.; Azam, S. An empirical analysis of Cambodian behavior intention towards mobile payment. Manag. Sci. Lett. 2019, 9, 1941–1954. [Google Scholar] [CrossRef]
- Liu, Y.; Yang, Y.; Li, H. A Unified Risk-Benefit Analysis Framework for Investigating Mobile Payment Adoption. In Proceedings of the 2012 International Conference on Mobile Business, Delft, The Netherlands, 21–22 June 2012. [Google Scholar]
- Yang, M.; Mamun, A.A.; Mohiuddin, M.; Nawi, N.C.; Zainol, N.R. Cashless transactions: A study on intention and adoption of e-wallets. Sustainability 2021, 13, 831. [Google Scholar] [CrossRef]
- Christian, L.; Juwitasary, H.; Chandra, Y.U.; Putra, E.P. Evaluation of the E-Service Quality for the Intention of Community to Use NFC Technology for Mobile Payment with TAM. In Proceedings of the 2019 International Conference on Information Management and Technology, Jakarta/Bali, Indonesia, 19–20 August 2019. [Google Scholar]
- Gupta, K.P.; Manrai, R. Prioritizing Factors Affecting the Adoption of Mobile Financial Services in Emerging Markets—A Fuzzy AHP Approach. In Performance Prediction and Analytics of Fuzzy, Reliability and Queuing Models; Springer: Berlin, Germany, 2019; pp. 55–81. [Google Scholar]
- Chou, Y.; Lee, C.; Chung, J. Understanding m-commerce payment systems through the analytic hierarchy process. J. Bus. Res. 2004, 57, 1423–1430. [Google Scholar] [CrossRef]
- Osmani, M.; Moradi, K.; Rozan, M.Z.A.; Layegh, M.A. Using AHP method to evaluate e-payment system factors influencing mobile banking use in Iranian banks. Int. J. Bus. Inf. Syst. 2017, 24, 511–528. [Google Scholar] [CrossRef]
- Mu, H.L.; Lee, Y.C. An application of fuzzy AHP and TOPSIS methodology for ranking the factors influencing FinTech adoption intention: A comparative study of China and Korea. J. Serv. Res. Stud. 2017, 7, 51–68. [Google Scholar]
- Kapoor, A.; Sindwani, R.; Goel, M. Mobile Wallets: Theoretical and Empirical Analysis. Glob. Bus. Rev. 2020, 0972150920961254. [Google Scholar] [CrossRef]
- Moslehi, F.; Haeri, A.; Gholamian, M.R. Investigation of effective factors in expanding electronic payment in Iran using datamining techniques. J. Ind. Syst. Eng. 2019, 12, 61–94. [Google Scholar]
- Zeithaml, V.A. Consumer perceptions of price, quality, and value: A means-end model and synthesis of evidence. J. Mark. 1988, 52, 2–22. [Google Scholar] [CrossRef]
- Liébana-Cabanillas, F.; García-Maroto, I.; Muñoz-Leiva, F.; Ramos-de-Luna, I. Mobile payment adoption in the age of digital transformation: The case of Apple Pay. Sustainability 2020, 12, 5443. [Google Scholar] [CrossRef]
- Shaw, N.; Sergueeva, K. The non-monetary benefits of mobile commerce: Extending UTAUT2 with perceived value. Int. J. Inf. Manag. 2019, 45, 44–55. [Google Scholar] [CrossRef]
- Dastane, O.; Goi, C.L.; Rabbanee, F. A synthesis of constructs for modelling consumers’ perception of value from mobile-commerce (M-VAL). J. Retail. Consum. Serv. 2020, 55, 102074. [Google Scholar] [CrossRef]
- Sheth, J.N.; Newman, B.I.; Gross, B.L. Why we buy what we buy: A theory of consumption values. J. Bus. Res. 1991, 22, 159–170. [Google Scholar] [CrossRef]
- Sweeney, J.C.; Soutar, G.N. Consumer perceived value: The development of a multiple item scale. J. Retail. 2001, 77, 203–220. [Google Scholar] [CrossRef]
- Holbrook, M.B. The nature of customer value: An axiology of services in the consumption experience. Serv. Qual. New Dir. Theory Pract. 1994, 21, 21–71. [Google Scholar]
- Overby, J.W.; Lee, E.J. The effects of utilitarian and hedonic online shopping value on consumer preference and intentions. J. Bus. Res. 2006, 59, 1160–1166. [Google Scholar] [CrossRef]
- Peng, L.; Liang, S. The effects of consumer perceived value on purchase intention in e-commerce platform: A time-limited promotion perspective. In Proceedings of the Thirteen International Conference on Electronic Business, Xiamen, China, 5–8 December 2013. [Google Scholar]
- Deterding, S.; Dixon, D.; Khaled, R.; Nacke, L. From game design elements to gamefulness: Defining “gamification”. In Proceedings of the 15th International Academic MindTrek Conference: Envisioning Future Media Environments, Tampere, Finland, 28–30 September 2011. [Google Scholar]
- Koivisto, J.; Hamari, J. The rise of motivational information systems: A review of gamification research. Int. J. Inf. Manag. 2019, 45, 191–210. [Google Scholar] [CrossRef]
- Van Roy, R.; Zaman, B. Need-supporting gamification in education: An assessment of motivational effects over time. Comput. Educ. 2018, 127, 283–297. [Google Scholar] [CrossRef]
- Gupta, A.; Gomathi, S. A review on gamification and its potential to motivate and engage employees and customers: Employee engagement through gamification. Int. J. Sociotechnol. Knowl. Dev. (IJSKD) 2017, 9, 42–52. [Google Scholar] [CrossRef]
- Yang, Y.; Asaad, Y.; Dwivedi, Y. Examining the impact of gamification on intention of engagement and brand attitude in the marketing context. Comput. Hum. Behav. 2017, 73, 459–469. [Google Scholar] [CrossRef]
- Huseynov, F. Gamification in E-Commerce: Enhancing Digital Customer Engagement through Game Elements. In Digital Innovations for Customer Engagement, Management, and Organizational Improvement; IGI Global, Commonwealth of Pennsylvania: Hershey, PA, USA, 2020; pp. 144–161. [Google Scholar]
- Xi, N.; Hamari, J. Does gamification satisfy needs? A study on the relationship between gamification features and intrinsic need satisfaction. Int. J. Inf. Manag. 2019, 46, 210–221. [Google Scholar] [CrossRef]
- Suh, A.; Cheung, C.M.; Ahuja, M.; Wagner, C. Gamification in the Workplace: The Central Role of the Aesthetic Experience. J. Manag. Inf. Syst. 2017, 34, 268–305. [Google Scholar] [CrossRef]
- Sailer, M.; Hense, J.U.; Mayr, S.K.; Mandl, H. How gamification motivates: An experimental study of the effects of specific game design elements on psychological need satisfaction. Comput. Hum. Behav. 2017, 69, 371–380. [Google Scholar] [CrossRef]
- Rigby, S.; Ryan, R. Glued to Games: How Video Games Draw Us in and Hold Us Spellbound; Praeger: Westport, CT, USA, 2011. [Google Scholar]
- Singh, P.; Keswani, S.; Singh, S.; Sharma, S. A study of adoption behavior for online shopping: An extension of TAM model. IJASSH 2018, 4, 11–22. [Google Scholar]
- Scott, S.; McGuire, J. Using Diffusion of Innovation Theory to Promote Universally Designed College Instruction. Int. J. Teach. Learn. High. Educ. 2017, 29, 119–128. [Google Scholar]
- Yarimoglu, E.; Gunay, T. The extended theory of planned behavior in Turkish customers’ intentions to visit green hotels. Bus. Strategy Environ. 2020, 29, 1097–1108. [Google Scholar] [CrossRef]
- Rahi, S.; Ghani, M.; Alnaser, F.; Ngah, A. Investigating the role of unified theory of acceptance and use of technology (UTAUT) in internet banking adoption context. Manag. Sci. Lett. 2018, 8, 173–186. [Google Scholar] [CrossRef]
- Rahman, M.M.; Lesch, M.F.; Horrey, W.J.; Strawderman, L. Assessing the utility of TAM, TPB, and UTAUT for advanced driver assistance systems. Accid. Anal. Prev. 2017, 108, 361–373. [Google Scholar] [CrossRef] [PubMed]
- Al-Saedi, K.; Al-Emran, M.; Ramayah, T.; Abusham, E. Developing a general extended UTAUT model for M-payment adoption. Technol. Soc. 2020, 62, 101293. [Google Scholar] [CrossRef]
- Venkatesh, V.; Morris, M.G.; Davis, G.B.; Davis, F.D. User acceptance of information technology: Toward a unified view. MIS Q. 2003, 27, 425–478. [Google Scholar] [CrossRef]
- Herrero, Á.; San Martín, H. Explaining the adoption of social networks sites for sharing user-generated content: A revision of the UTAUT2. Comput. Hum. Behav. 2017, 71, 209–217. [Google Scholar] [CrossRef]
- Haynes, S.N.; Richard, D.; Kubany, E.S. Content validity in psychological assessment: A functional approach to concepts and methods. Psychol. Assess. 1995, 7, 238–247. [Google Scholar] [CrossRef]
- Kaiser, H.F. A revised measure of sampling adequacy for factor-analytic data matrices. Educ. Psychol. Meas. 1981, 41, 379–381. [Google Scholar] [CrossRef]
- Gliem, J.A.; Gliem, R.R. Calculating, interpreting, and reporting Cronbach’s alpha reliability coefficient for Likert-type scales. In Proceedings of the 2003 Midwest Research to Practice Conference, Columbus, OH, USA, 8–10 October 2003. [Google Scholar]
- George, D.; Mallery, P. SPSS for Windows step by step: A simple guide and reference. Contemp. Psychol. 1999, 44, 100. [Google Scholar]
- Huang, R.; Luo, G.; Duan, Q.; Zhang, L.; Zhang, Q.; Tang, W.; Zou, H. Using Baidu search index to monitor and predict newly diagnosed cases of HIV/AIDS, syphilis and gonorrhea in China: Estimates from a vector autoregressive (VAR) model. BMJ Open 2020, 10, e036098. [Google Scholar] [CrossRef]
- Qu, G.B.; Zhao, T.Y.; Zhu, B.W.; Tzeng, G.H.; Huang, S.L. Use of a modified DANP-mV model to improve quality of life in rural residents: The empirical case of Xingshisi village, China. Int. J. Environ. Res. Public Health 2019, 16, 153. [Google Scholar] [CrossRef] [PubMed]
- Global Mobile Payments Market to Reach $4573.8 Billion by 2023. Available online: https://www.globenewswire.com/news-release/2019/09/11/1914228/0/en/Global-mobile-payments-market-to-reach-4-573-8-billion-by-2023-AMR.html (accessed on 10 April 2021).
- Proximity Mobile Payment Users Worldwide. 2019. Available online: https://www.emarketer.com/chart/230856/proximity-mobile-payment-users-worldwide-2019-of-smartphone-users (accessed on 10 April 2021).
- Sair, S.A.; Danish, R.Q. Effect of performance expectancy and effort expectancy on the mobile commerce adoption intention through personal innovativeness among Pakistani consumers. Pakistan J. Commer. Soc. Sci. 2018, 12, 501–520. [Google Scholar]
- Van den Broeck, A.; Vansteenkiste, M.; De Witte, H.; Soenens, B.; Lens, W. Capturing autonomy, competence, and relatedness at work: Construction and initial validation of the Work-related Basic Need Satisfaction scale. J. Occup. Organ. Psychol. 2010, 83, 981–1002. [Google Scholar] [CrossRef]
- Hall, R.J.; Snell, A.F.; Foust, M.S. Item parceling strategies in SEM: Investigating the subtle effects of unmodeled secondary constructs. Organ. Res. Methods 1999, 2, 233–256. [Google Scholar] [CrossRef]
- Field, A. Exploratory Factor Analysis; Discovering Statistics Using SPSS; Oxford University Press: Oxford, UK, 2005; pp. 619–680. [Google Scholar]
- Landers, R.N.; Armstrong, M.B.; Collmus, A.B. How to use game elements to enhance learning: Applications of the theory of gamified learning. In Serious Games and Edutainment Applications; Springer: Cham, Switzerland, 2017; Volume 2, pp. 457–483. [Google Scholar]
- Cronin, J.J., Jr.; Brady, M.K.; Hult, G.T.M. Assessing the effects of quality, value, and customer satisfaction on consumer behavioral intentions in service environments. J. Retail. 2000, 76, 193–218. [Google Scholar] [CrossRef]
- Huotari, K.; Hamari, J. Defining gamification: A service marketing perspective. In Proceedings of the 16th International Academic MindTrek Conference, Tampere, Finland, 3–5 October 2012. [Google Scholar]
Publisher’s Note: MDPI stays neutral with regard to jurisdictional claims in published maps and institutional affiliations. |
© 2021 by the authors. Licensee MDPI, Basel, Switzerland. This article is an open access article distributed under the terms and conditions of the Creative Commons Attribution (CC BY) license (https://creativecommons.org/licenses/by/4.0/).