Review

The FMM Approach to Analyze Biomedical Signals: Theory, Software, Applications and Future

by
Cristina Rueda
*,
Itziar Fernández
,
Yolanda Larriba
and
Alejandro Rodríguez-Collado
Department of Statistics and Operations Research, Universidad de Valladolid, 47011 Valladolid, Spain
*
Author to whom correspondence should be addressed.
Mathematics 2021, 9(10), 1145; https://doi.org/10.3390/math9101145
Submission received: 16 April 2021 / Revised: 12 May 2021 / Accepted: 18 May 2021 / Published: 19 May 2021
(This article belongs to the Special Issue Models and Methods in Bioinformatics: Theory and Applications)

Abstract

:
Oscillatory systems arise in the different biological and medical fields. Mathematical and statistical approaches are fundamental to deal with these processes. The Frequency Modulated Mobiüs approach (FMM), reviewed in this paper, is one of these approaches. Little known as it has been recently developed, it solves a variety of exciting questions with real data; some of them, such as the decomposition of the signal into components and their multiple uses, are of general application, others are specific. Among the exciting specific applications is the automatic interpretation of the electrocardiogram signal. In this paper, a summary of the theoretical, statistical and computational properties of the FMM approach are revised. Additionally, as a novelty, the FMM approach’s usefulness for the analysis of blood pressure signals is shown. For the latter, a new robust estimation algorithm is proposed using FMM models with restrictions. The paper ends with a view about challenges for the future.

1. Introduction

The biological variables following the circadian rhythm or the electrocardiogram (ECG) are examples of oscillatory signals. Questions such as which genes are activated by the circadian rhythms or how to detect heart rhythm failures by automatically interpreting the ECG are only two examples of relevant advances in biomedical signal analysis, a field that is in continuous advance, mainly due to the basic statistics and mathematics research.
Oscillations are encountered in all areas of science, physics, and biology, and also in human society as the business cycle indicators. Therefore, their processing and analysis is carried out from many different perspectives. On the one hand, the focus of the signal analyst emphasizes the time-frequency approach. A recommended reference is the book Boashash (2016) [1]. On the other hand, a dynamic system is described primarily by a set of differential equations for a physicist or mathematician. See Wigren (2015) [2], Ashwin et al. (2016) [3] and Pikovsky and Rosenblum (2015) [4] for details of mathematical tools to address the dynamics of oscillatory systems. Finally, there is the statistical approach, which is suitable when real signals are observed and is the focus of this paper.
Moreover, depending on the application, the purpose of the analysis differs. Some of the popular purposes are: the detection of periodicity, the extraction of features, locating fiducial marks, generating synthetic data, or denoising signals. Among those, extracting features from an observed signal is perhaps the most widely studied data analysis problem. Consequently, to define a reduced set of interpretable features and an efficient algorithm to accurately extract these features from the recorded signal are the top requirements of an efficient signal analysis method. The number of oscillatory components and the amplitude and peak time of each oscillation are among the main features to be extracted, which in the case of physiological signals, contain interesting information about a person’s health condition.
Although different and specific approaches have been developed in each area of science, there are also universal approaches. Fourier Decomposition (FD) is a traditional approach to analyze such signals. However, there are many situations where the signal is not suitable. For example, a sinusoidal function does not accurately describe respiratory signals, as inspiration is usually shorter than expiration. Additionally, neuronal oscillations are commonly non-sinusoidal, and the features measuring deviations from a sinusoidal shape may contain crucial physiological information about the neuronal systems and dynamics that generate them [5]. Several other decomposition approaches have been considered in the literature. Kowalski et al. (2018) [6] gives a useful review of methods and revises several requirements a time series analysis method for an oscillatory signal should satisfy.
The Frequency Modulated Möbius (FMM) approach is a universal procedure that combines a physically meaningful formulation with good statistical and computational properties. It has recently been presented in a series of papers, listed in Table 1, where, besides the theory and computational properties, diverse applications in different fields have been shown.
In brief, the FMM is a multi-purpose approach with reliable mathematical and statistical support. The underlying statistical model is a signal plus error model where the signal is described parametrically and is decomposed into several additive components. The parametric formulation facilitates the interpretability and the derivation of essential elements. Each component is a single FMM oscillator [7]. Two distinguishing features of the single FMM component are that it is formulated in terms of the phase, which is the angular variable representing the periodic oscillation movement, and that it is the solution of a simple Ordinary Differential Equation (ODE).
The main virtues that make the FMM approach preferable to other approaches, such as FD, can be summarized below. First, the components describe specific physiological processes, and the parameters can characterize, reproduce, and identify the variety of morphologies observed in each wave that compose the signal. In addition, other interesting features, such as the peak wave location or the distances between peak waves, are easily derived from these main parameters. Second, the fitting algorithm provides accurate and robust model parameter estimates, discarding overfitting problems. Furthermore, by assuming simple restrictions, the parameters are identifiable.
In this paper, a review of the main theoretical and computational properties is given, the most significant advances that the method has yielded in the various disciplines are reviewed, and new applications are shown. Moreover, the paper ends with a discussion about the challenges for the future. For the theoretical properties alone, the proposal is interesting and advantageous when compared to alternatives. Combining it with the solutions given to the real problems, makes it a very promising methodology.

2. The FMM Approach

2.1. Model Description

Let assume that the time points are in [ 0 , 2 π ) . In any other case, transform the time points t [ t 0 , T + t 0 ] by t = ( t t 0 ) 2 π T . In the following, oscillations are also referred to as waves.
Let, υ = ( A , α , β , ω ) be the four-dimensional parameters describing a single FMM signal, defined as the following wave: W ( t , υ ) = A cos ( ϕ ( t , α , β , ω ) ) , where A is the wave amplitude and,
ϕ ( t , α , β , ω ) = β + 2 arctan ( ω tan ( t α 2 ) )
is the wave phase. The additive FMMm model is defined as a parametric additive m-component signal plus error model as follows.
Definition 1.
FMMm model.
For the observations t 1 < < t n ,
X ( t i ) = μ ( t i , θ ) + e ( t i ) ;
where μ ( t i , θ ) = M + J = 1 m W ( t i , υ J ) , and,
  • θ = ( M , υ 1 , , υ m ) verifying:
    M ;   υ J Θ J = + × [ 0 , 2 π ) × [ 0 , 2 π ) × [ 0 , 1 ] ;   J = 1 , , m ,
    α 1 α 2 α m α 1
    A 1 = max 1 J m A J
  • ( e ( t 1 ) , , e ( t n ) ) N n ( 0 , σ 2 I ) .
Other important parameters of practical use are peak and trough times, denoted by t U and t L , respectively, which are defined as follows:
t U = α + 2 arctan ( 1 ω tan ( β 2 ) )
t L = α + 2 arctan ( 1 ω tan ( π β 2 ) )
W ( t i , υ ) is suitable for describing oscillatory patterns, as is well justified in Rueda et al. (2019) [7]. The parameters characterize various aspects of a rhythmic pattern. A is measuring the signal’s amplitude, α is a phase location parameter, while ω and β are parameters describing the shape. ω measures the sharpness, and β measures skewness and indicates upward and/or downward peak direction. Specifically, a sinusoidal curve corresponds to ω = 1 .
FMM models where restrictions on the parameters are imposed are also useful to model signals with similar repetitive spikes as the action potential (AP) neuronal series (see [10]). In this paper, a specific FMM restricted model is designed for the analysis of blood pressure (BP) signals.

2.2. Mathematical and Statistical Properties

2.2.1. Maximum Likelihood (ML) Inferences

The ML estimates of the FMMm model parameter are the solutions to the optimization problem:
θ ^ = arg min θ Θ i = 1 n ( X ( t i ) μ ( t i , θ ) ) 2 ,
where Θ refers to the parameter space for θ , a subset of × Θ 1 × × Θ m defined by the restrictions. The consistency and asymptotic normality of the ML estimators are guaranteed by recognized results in non-linear regression analysis, when α J [ 0 , 2 π ) , β J [ 0 , 2 π ) , w J > 0 ; J = 1 , , m , as the FMMm verifies the standard regularity conditions. The identifiability of the model parameters is guaranteed by including the restrictions on the αs and As above. The papers by Rueda et al. (2019) [7] and Rueda et al. (2021a) [8] present different signals that the model describes accurately, and provide interesting properties.
Occasionally, different parameter configurations of an FMMm model can represent a given signal equally well. The inclusion of additional restrictions on the parameters is advisable to guarantee the solution with more biological interpretation (see [10]).
Interesting hypothesis testing problems can be defined depending on the problem at hand. For example, assuming the FMM1 model, hypothesis tests on arrhythmicity and on sinusoidal shape are described in Rueda et al. (2019) [7]. In addition, likelihood ratio test and confidence intervals can be derived using such standard methods as bootstrap.

2.2.2. The Complex Signal Associated with the FMMm Signal

Researchers often assume that there exists an underlying complex signal associated with an oscillatory process. The analytic signal (AS) is defined as such a complex signal, S ( t ) = μ ( t ) + i ν ( t ) , underlying the real signal μ ( t ) , where ν ( t ) is derived from μ ( t ) using the Hilbert transform. See Picinbono (1997) [14], Sandoval and De Leon (2015) [15] for details and the properties of the AS. Furthermore, the AS can be expressed as: S ( t ) = A ( t ) e i ϕ ( t ) where
ϕ ( t ) = arctan ν ( t ) μ ( t ) ; A ( t ) = μ ( t ) 2 + ν ( t ) 2 .
A ( t ) and ϕ ( t ) are called the signal’s Instantaneous Amplitude and Instantaneous Phase, respectively. The derivative of ϕ ( t ) is known as the Instantaneous Frequency (IF), which is expected to be positive in applications. Hence, the AS is not always interpretable as a meaningful physical phenomenon.
In general, given a real signal μ ( t ) , the associated AS does not have a closed expression. However, for FMMm signals, ν ( t ) can easily be derived analytically from μ ( t ) as follows,
ν ( t ) = J = 1 m A J sin ( ϕ J ( t ) ) ,
as well as the IF,
ϕ ˙ ( t ) = 1 μ 2 ( t ) + υ 2 ( t ) ( υ ˙ ( t ) μ ( t ) υ ( t ) μ ˙ ( t ) ) ,
where μ ˙ ( t ) = J = 1 m ϕ ˙ J ( t ) A J sin ( ϕ J ( t ) ) , υ ˙ ( t ) = J = 1 m ϕ ˙ J ( t ) A J cos ( ϕ J ( t ) ) and ϕ ˙ J ( t ) = ω J 1 + ( ω J 2 1 ) s i n 2 ( t α J 2 ) .
Using the expression above, it is not difficult to characterize a situation with positive IF. Alternatively, using the same expression for individual components, specific and positive IFs can be derived. In particular, it is interesting in the case of signals where there exists a dominant component. For more details see Rueda et al. (2021a) [8].

2.2.3. The FMM Signal as the Solution of a System of ODEs

Many dynamic processes, with biological, physical, or chemical foundation, have been described by ODEs in the literature (see Teeter et al. (2018) [16] and references therein). In many cases, the differential equations representing the system are known a priori. The opposite happens in other cases, where the ODEs governing the system are entirely unknown and must be reconstructed from the data, as is the case of the FMM signal.
The ODE representation of the FMM signal, obtained in Rueda et al. (2021a) [8] and reproduced here in Theorem 1 below, describes how the underlying system evolves dynamically over time, and is related to the phase space where a signal is a trajectory or an orbit.
Theorem 1.
Let μ ( t ) be an F M M 1 signal with ω 1 > 0 and z ( t ) = tan ( Φ ( t ) 2 ) , then
1.
μ ( t ) is the solution to the following equation:
x ¨ ( t ) = x ( t ) ϕ ˙ 1 ( t ) + x ˙ ( t ) ϕ 1 ¨ ( t ) ϕ ˙ 1 ( t )
2.
z ( t ) is the solution to the following equation:
x ˙ ( t ) = ω 1 2 + 1 2 ω 1 x 2 ( t )
The representation of a system using ODEs is interesting to discover physiological relationships and to generate or validate hypotheses and to represent noisy signals.

2.3. Estimation Algorithm and Software

A backfitting algorithm solves the optimizing problem (3) fitting an FMM 1 model to the residue at each step. This is repeated until a stop criterion is attained (see Rueda et al. (2021a) [8] for details).
Success, in terms of convergence to the ML estimate, is not initially guaranteed, although the solution converges in probability to a local minimum. Our experience fitting FMMm to real and simulated data indicates that converging failure is not likely.
An R package called FMM [17], has recently been included in the Comprehensive R Archive Network (CRAN) repository (https://cran.r-project.org/web/packages/FMM (accessed on 8 March 2021)). The package incorporates real-world datasets and reproduces signal processing analysis for the three crucial areas where oscillatory processes commonly appear: chronobiology, neuroscience and ECGs, as is seen Section 3.1, and implements all the required functions for fitting FMM models. The option of imposing restrictions on the omega and beta parameters is also considered. The paper Fernández et al. (2021) [13] gives an overview of the package.

3. Applications

In this section, several analyses presented in previous papers are revised which evidence the wide range of FMM applications. Moreover, the analysis of BP signals with the FMM approach is presented as a novelty.

3.1. A Review of Known Applications

3.1.1. Chronobiology

Many biological variables, such as gene expression, body temperature or hormonal levels, exhibit periodic patterns following the circadian time. The chronobiology analyses the effects of time and rhythmic phenomena on life processes.
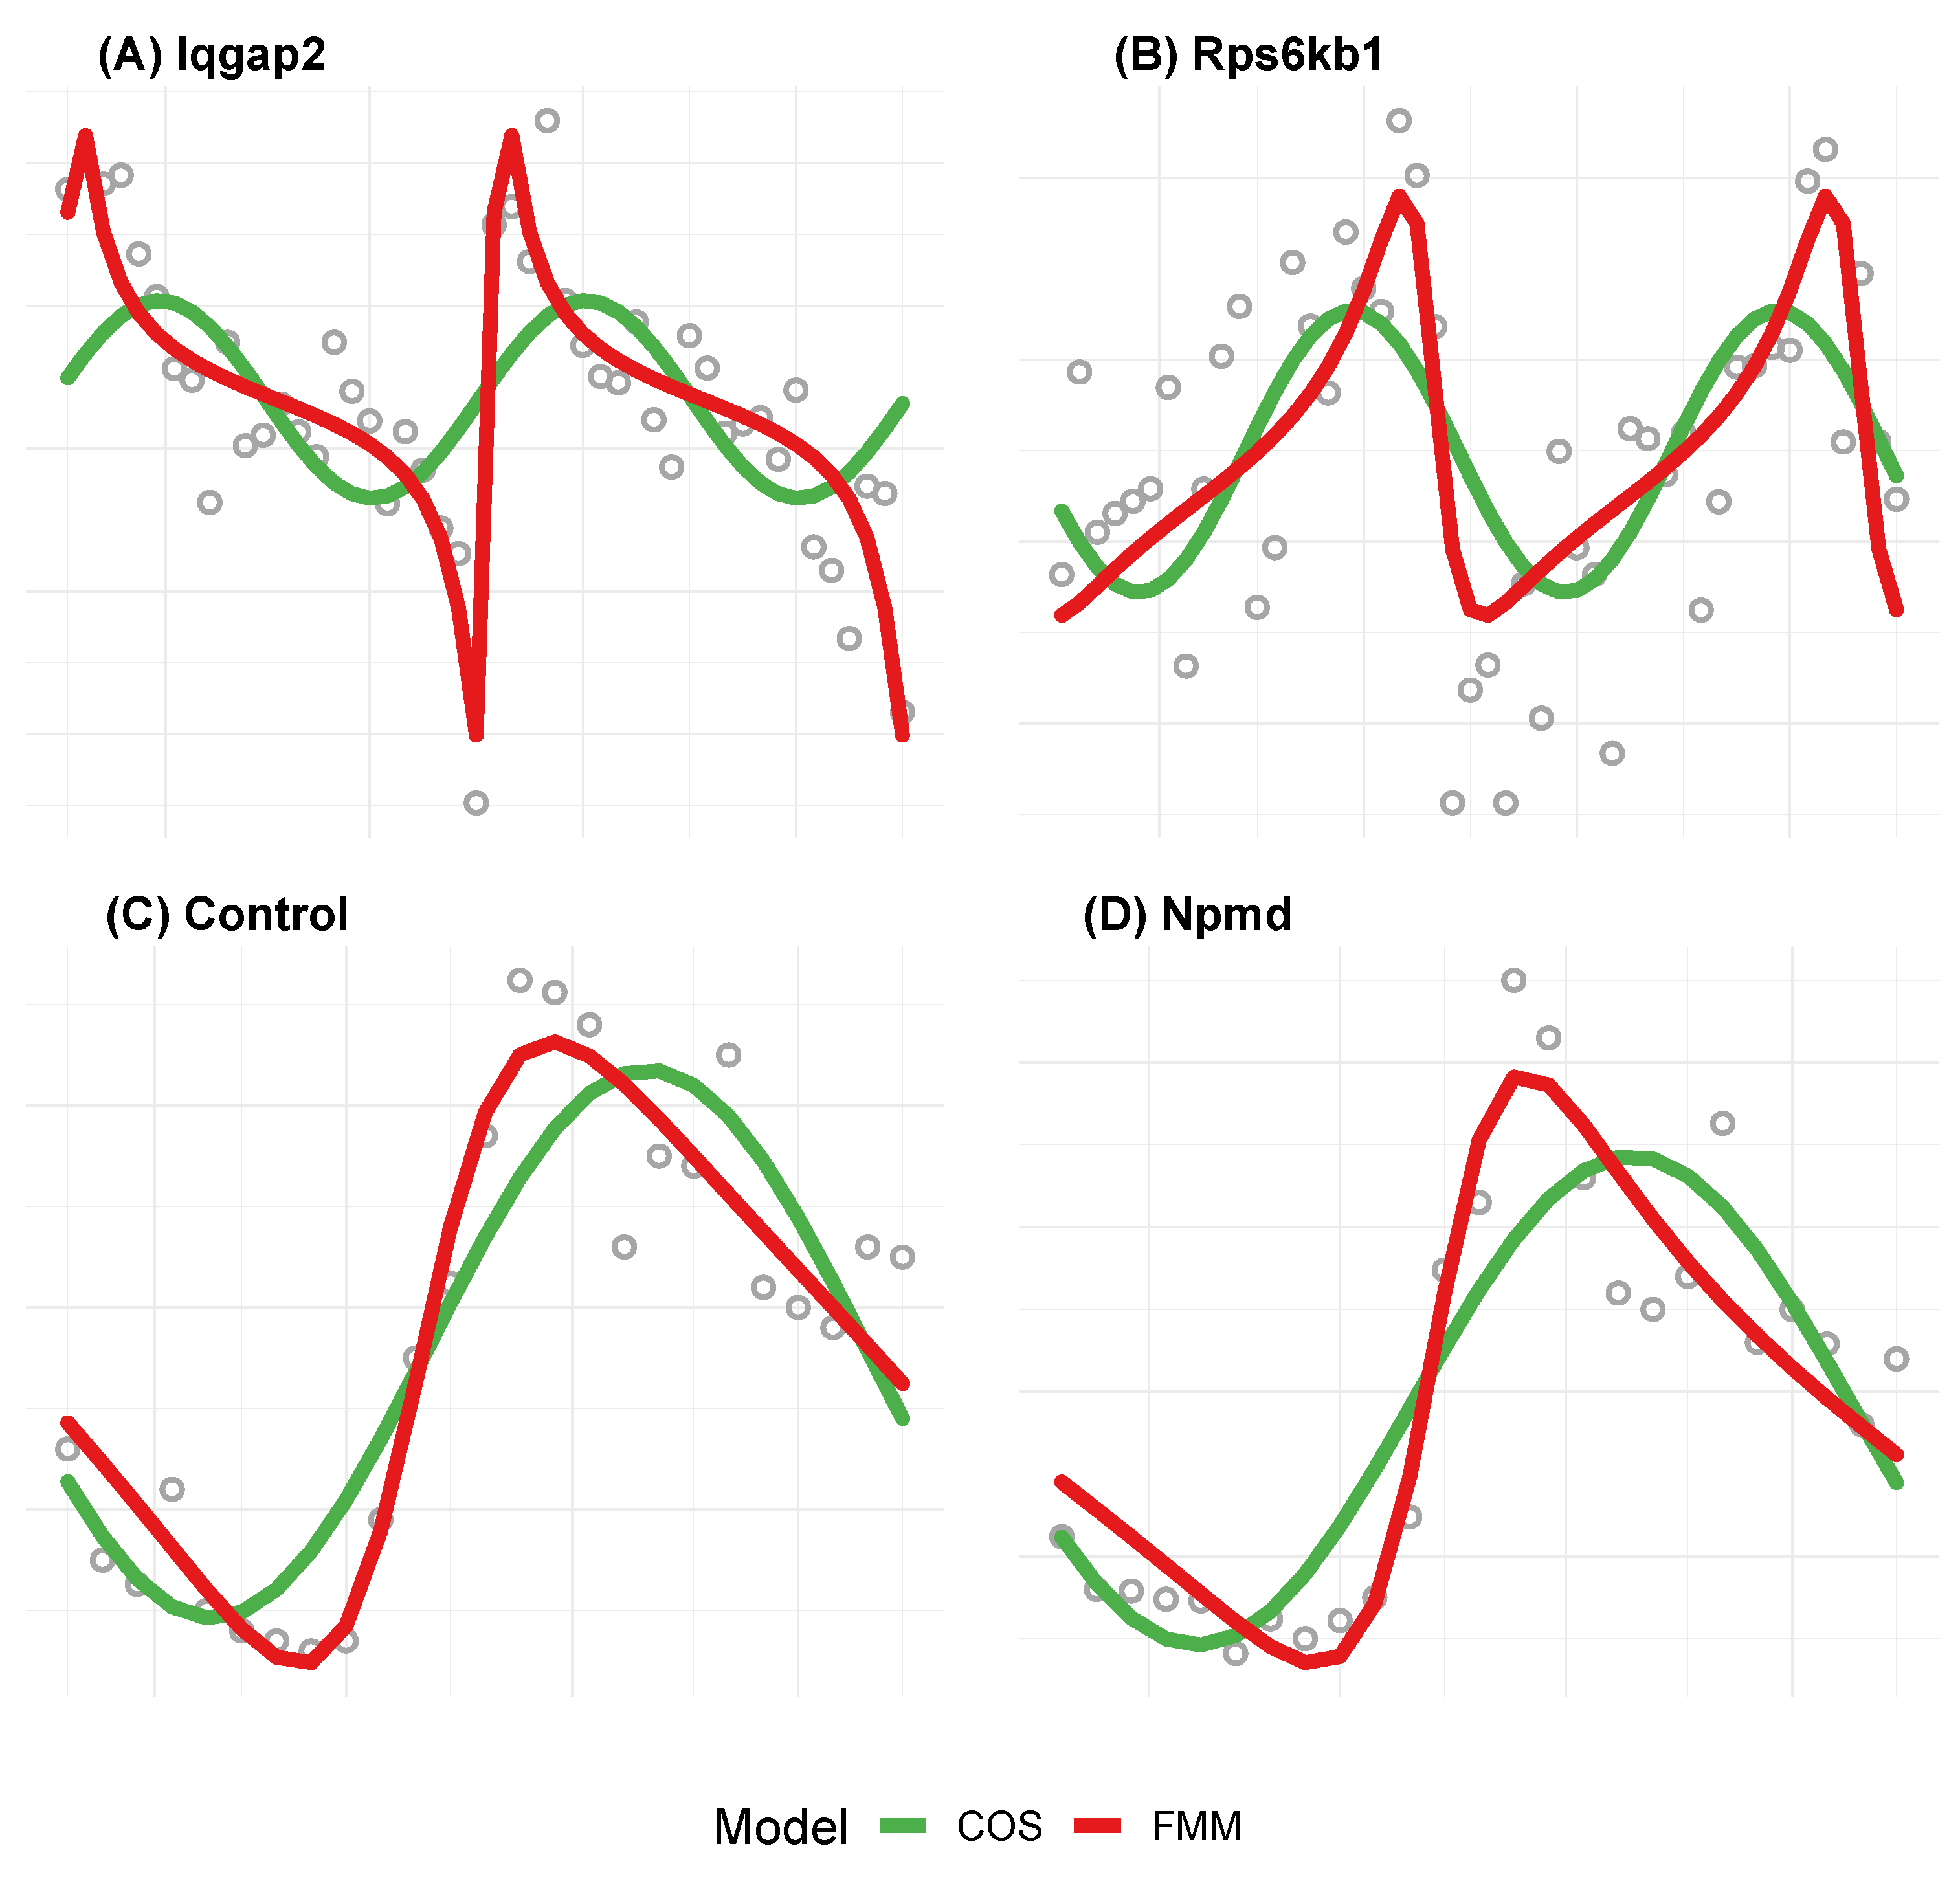
In the analysis of these biological rhythms, it would seem physically plausible that the underlying signals display up-down-up, non-necessary sinusoidal patterns in these cases. Moreover, the data are generally noisy, the number of observation periods is generally low, and the sampling density is rarely higher than 1 observation per hour. These features make the FMM model more adequate than standard time series approaches, such as the FD or the simple Cosinor model (COS) [18], which are widely adopted to analyze these phenomena. See Figure 1, where the patterns of observed gene expressions and hormonal levels are represented, together with the fitted values from the COS model, the FD with two harmonics and the FMM model. These two datasets are freely available in the Gene Expression Omnibus (GEO) repository, accession number GSE11923 (http://www.ncbi.nlm.nih.gov/geo/ (accessed on 20 October 2020)), and in the paper [19], respectively.
The FMM approach has been proved to be useful for data analysis in chronobiology, including from an accurate and simple representation of the signal, to the detection of rhythmicity or important marks, such as minimum or maximum, and to the extraction of useful features for classification goals. The papers Rueda et al. (2019) [7], and Larriba et al. (2021) [12] give more details of the contributions of the FMM analysis in this field.

3.1.2. ECG Signal

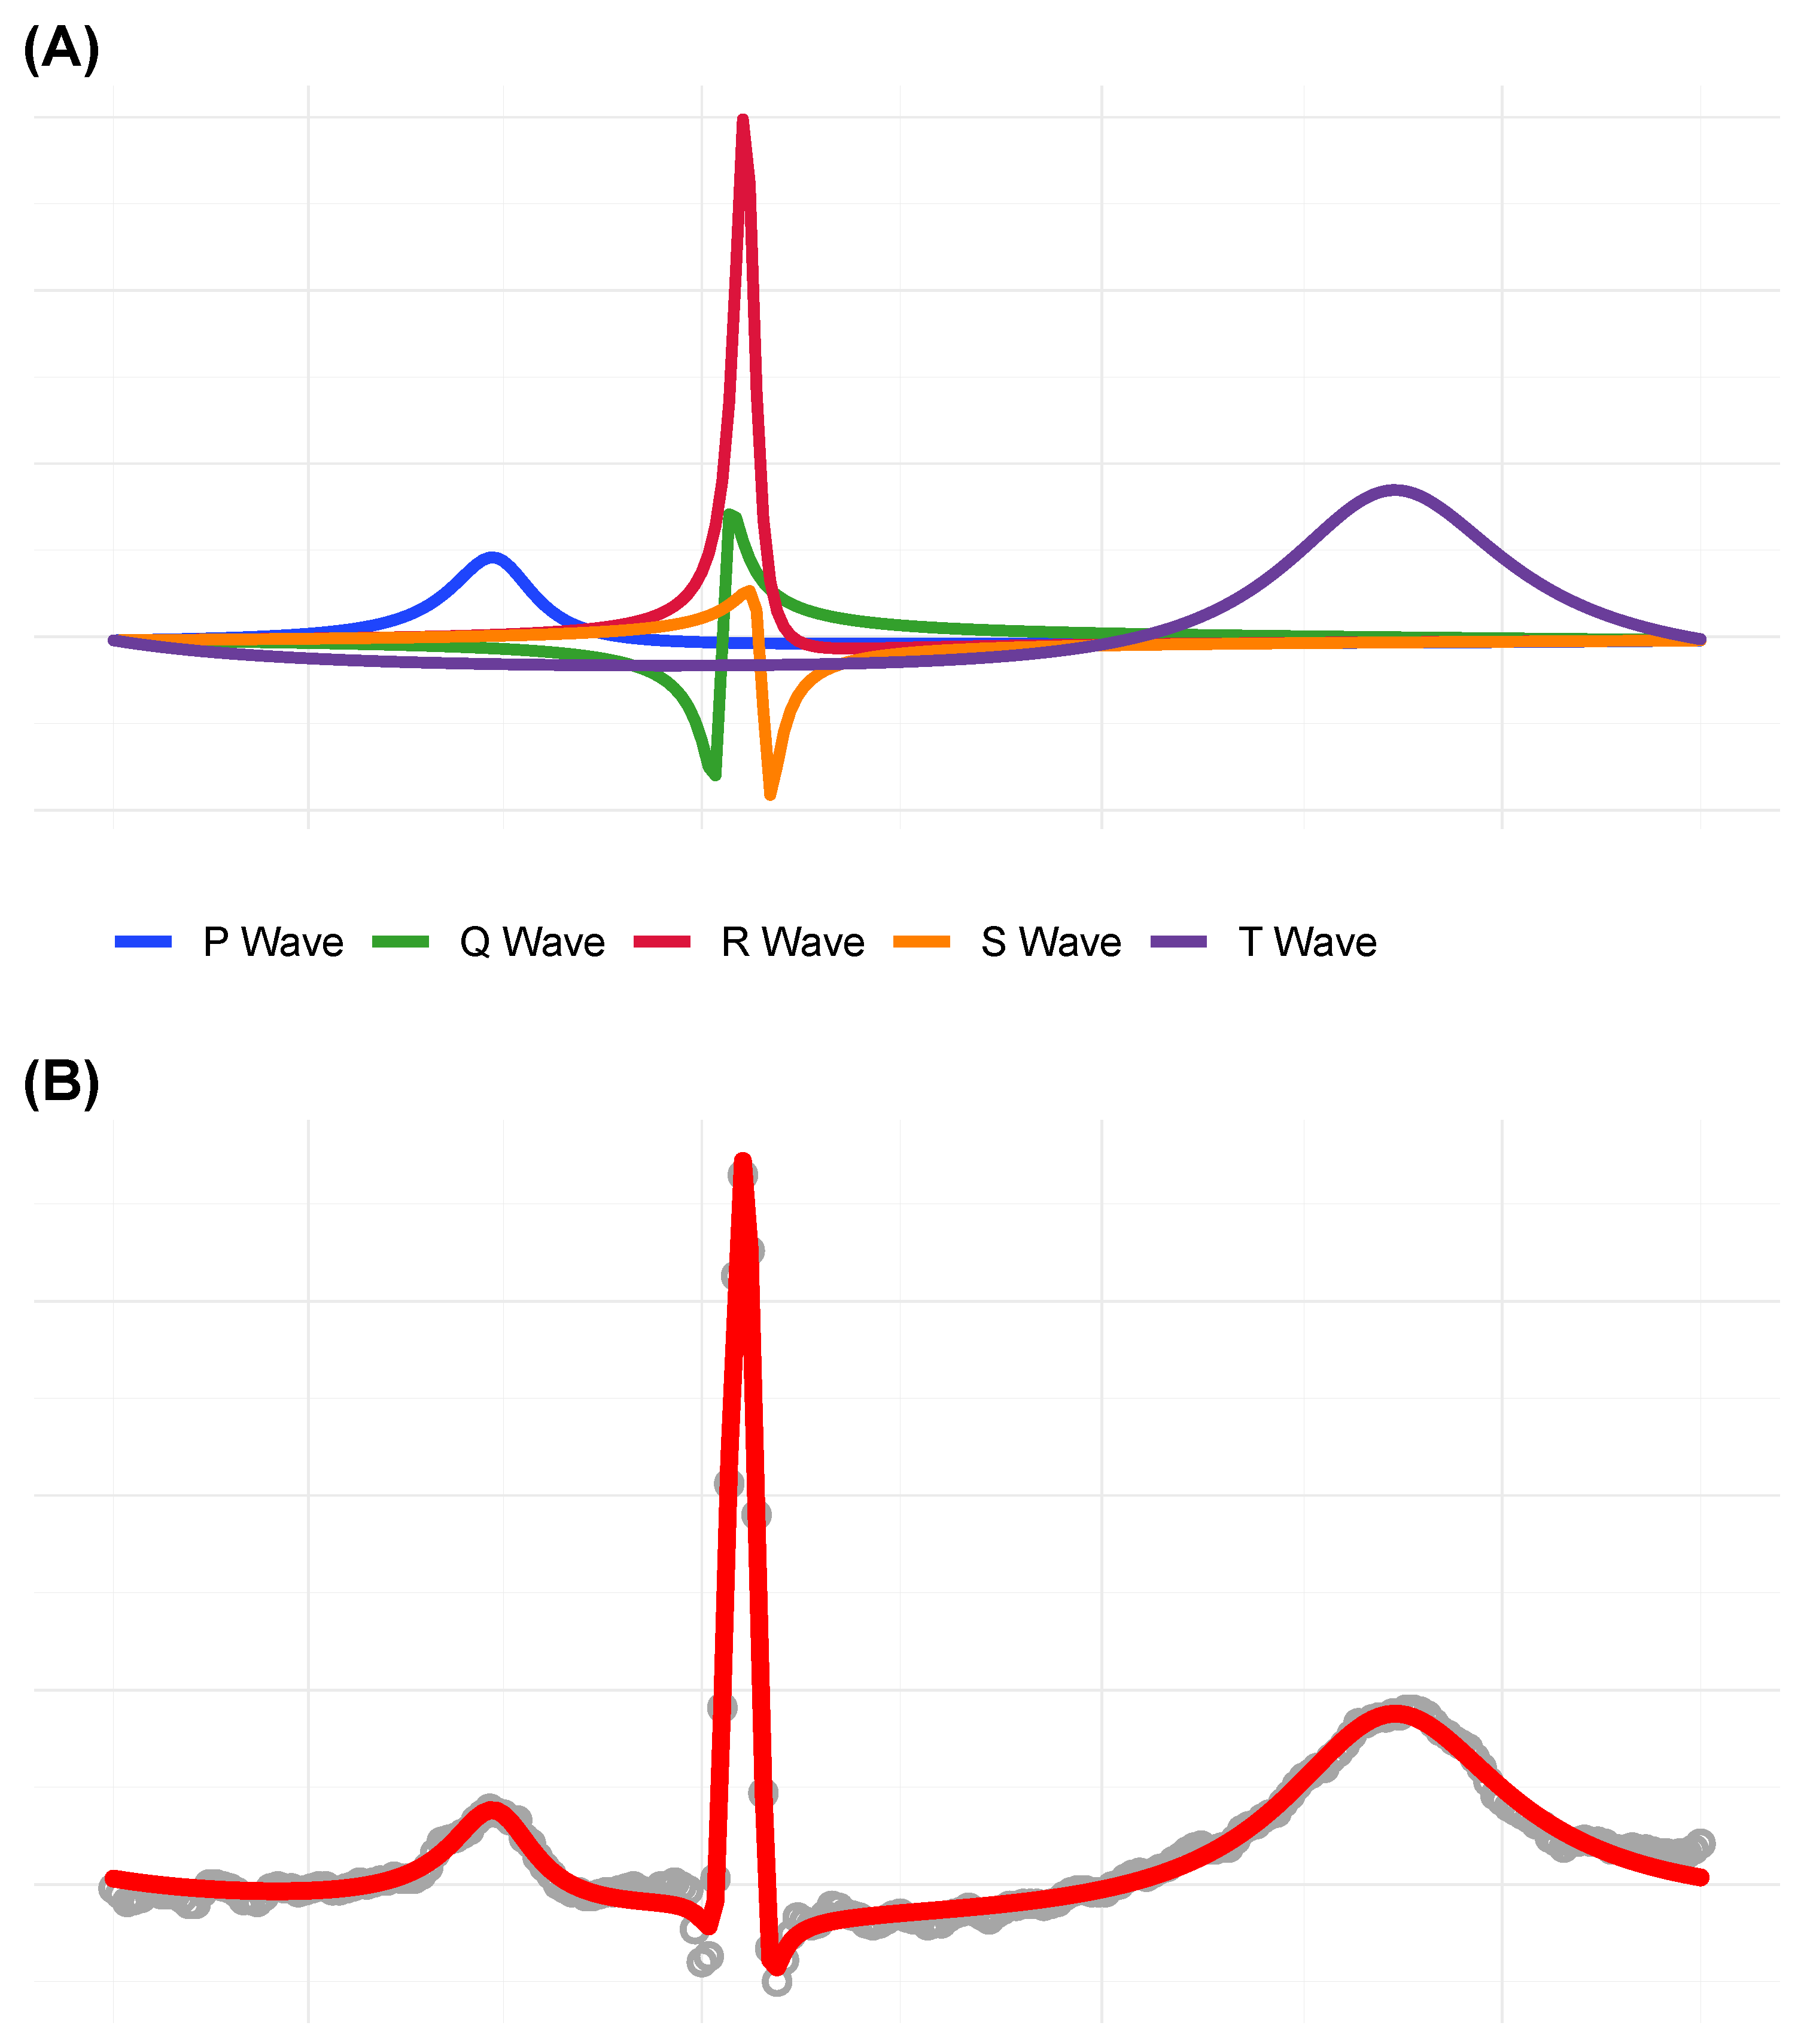
The importance of the ECG signal in the diagnosis and prediction of cardiovascular diseases is worth noting. The process recorded in the ECG is the periodic electrical activity of the heart. This activity represents the contraction and relaxation of the atria and ventricle, processes related to the crests and troughs of the ECG waveforms, labelled as P, Q, R, S and T (see Figure 2A). The main features used in medical practice are related to the location and amplitudes of these waves. A standard ECG signal is registered using 12 leads calculated from different electrode locations, lead II being the reference one.
Although made by a consolidated expert, the mere visual observation of the ECG signals is not enough to discover the diversity of abnormalities and the specific characteristics of the morphology of each ECG. Moreover, it requires an enormous amount of human expertise resources. Therefore, a rigorous automatic analysis of digitalized ECG signals can be of great help. However, although it has been a question that has received much attention in the literature over the last few decades, there is still no suitable mathematical model or computational approach that accurately describes the spectrum of morphologies in ECG signals.
The literature addressing the problem of the automatic interpretation of the ECG is quite extensive. Researchers have recently focused on using machine learning approaches, some of the relevant references are cited in Rueda et al. (2021b) [9]. In general, the success of machine learning approaches is very dependent on the training set, the selection of diagnostic groups, the preprocessing, and the database. Furthermore, they are rigid and black-box procedures that are not so useful in real practice to analyze any given, or at least singular ECG signals, and neither are they useful for solving the variety of clinical questions where the ECG automatic analysis could help. The FMM approach does the opposite.
Specifically, the FMM e c g model, presented in Rueda et al. 2021b [9], is defined as the combination of precisely five oscillatory components, which correspond to the fundamental waves in a heartbeat, plus an error term that accounts for artifacts in the data. Figure 2 illustrates the accuracy of the FMM e c g model to predict the ECG signal for a regular heartbeat.
Four clinically interpretable parameters are used to describe the morphology of each of the five primary waves in the ECG, as well as inter-wave features. A maximization-Identification (MI) algorithm is designed to estimate them. This algorithm alternates, iteratively, between a maximization, M-step, and a wave-identification, I-step. Although the model proposed is valid for signals registered elsewhere, the I-step is lead-specific. Nevertheless, the I-step can be easily adapted to signals registered in other regions. As a result, we can identify which part of the system is working in a correct or incorrect way, so the proposal goes beyond the other ECG analysis methods.
A quick look at the figures in the paper Rueda et al. (2021b) [9] reveals the methodology’s potential to describe a variety of noisy and pathological patterns.

3.1.3. Neuroscience

Neuroscience is a multidisciplinary field whose purpose is the study of the nervous system. It combines molecular biology, mathematical modelling, anatomy and physiology. Mathematical modelling has been one of the central problems in computational neuroscience, its roots being in the theory of ODEs. For a survey, we refer the reader to the book by Ermentrout and Terman (2010) [20].
We deal here with AP signals that are generated by measuring the electrical potential in the cell. The analysis of AP curves allows the extraction of features that describe the spike generation of individual neurons and the determination of the cell type and their functions, see Mensi et al. (2012) [21] or Trainito et al. (2019) [22], among others.
The analysis of APs for in vitro data has been traditionally done using ODE models. In particular, the well-known Hodgking and Huxley model [23]. However, for experimental or in vivo data, these models are not so useful (the exposition in Naundorf et al. (2006) [24] clarifies this point).
AP signals have been analyzed using the FMM approach in a series of papers [8,10,11], and we have proved that the FMM model represents Hodgking-Huxley signals accurately and achieves a quasi-perfect fit for different real AP patterns.
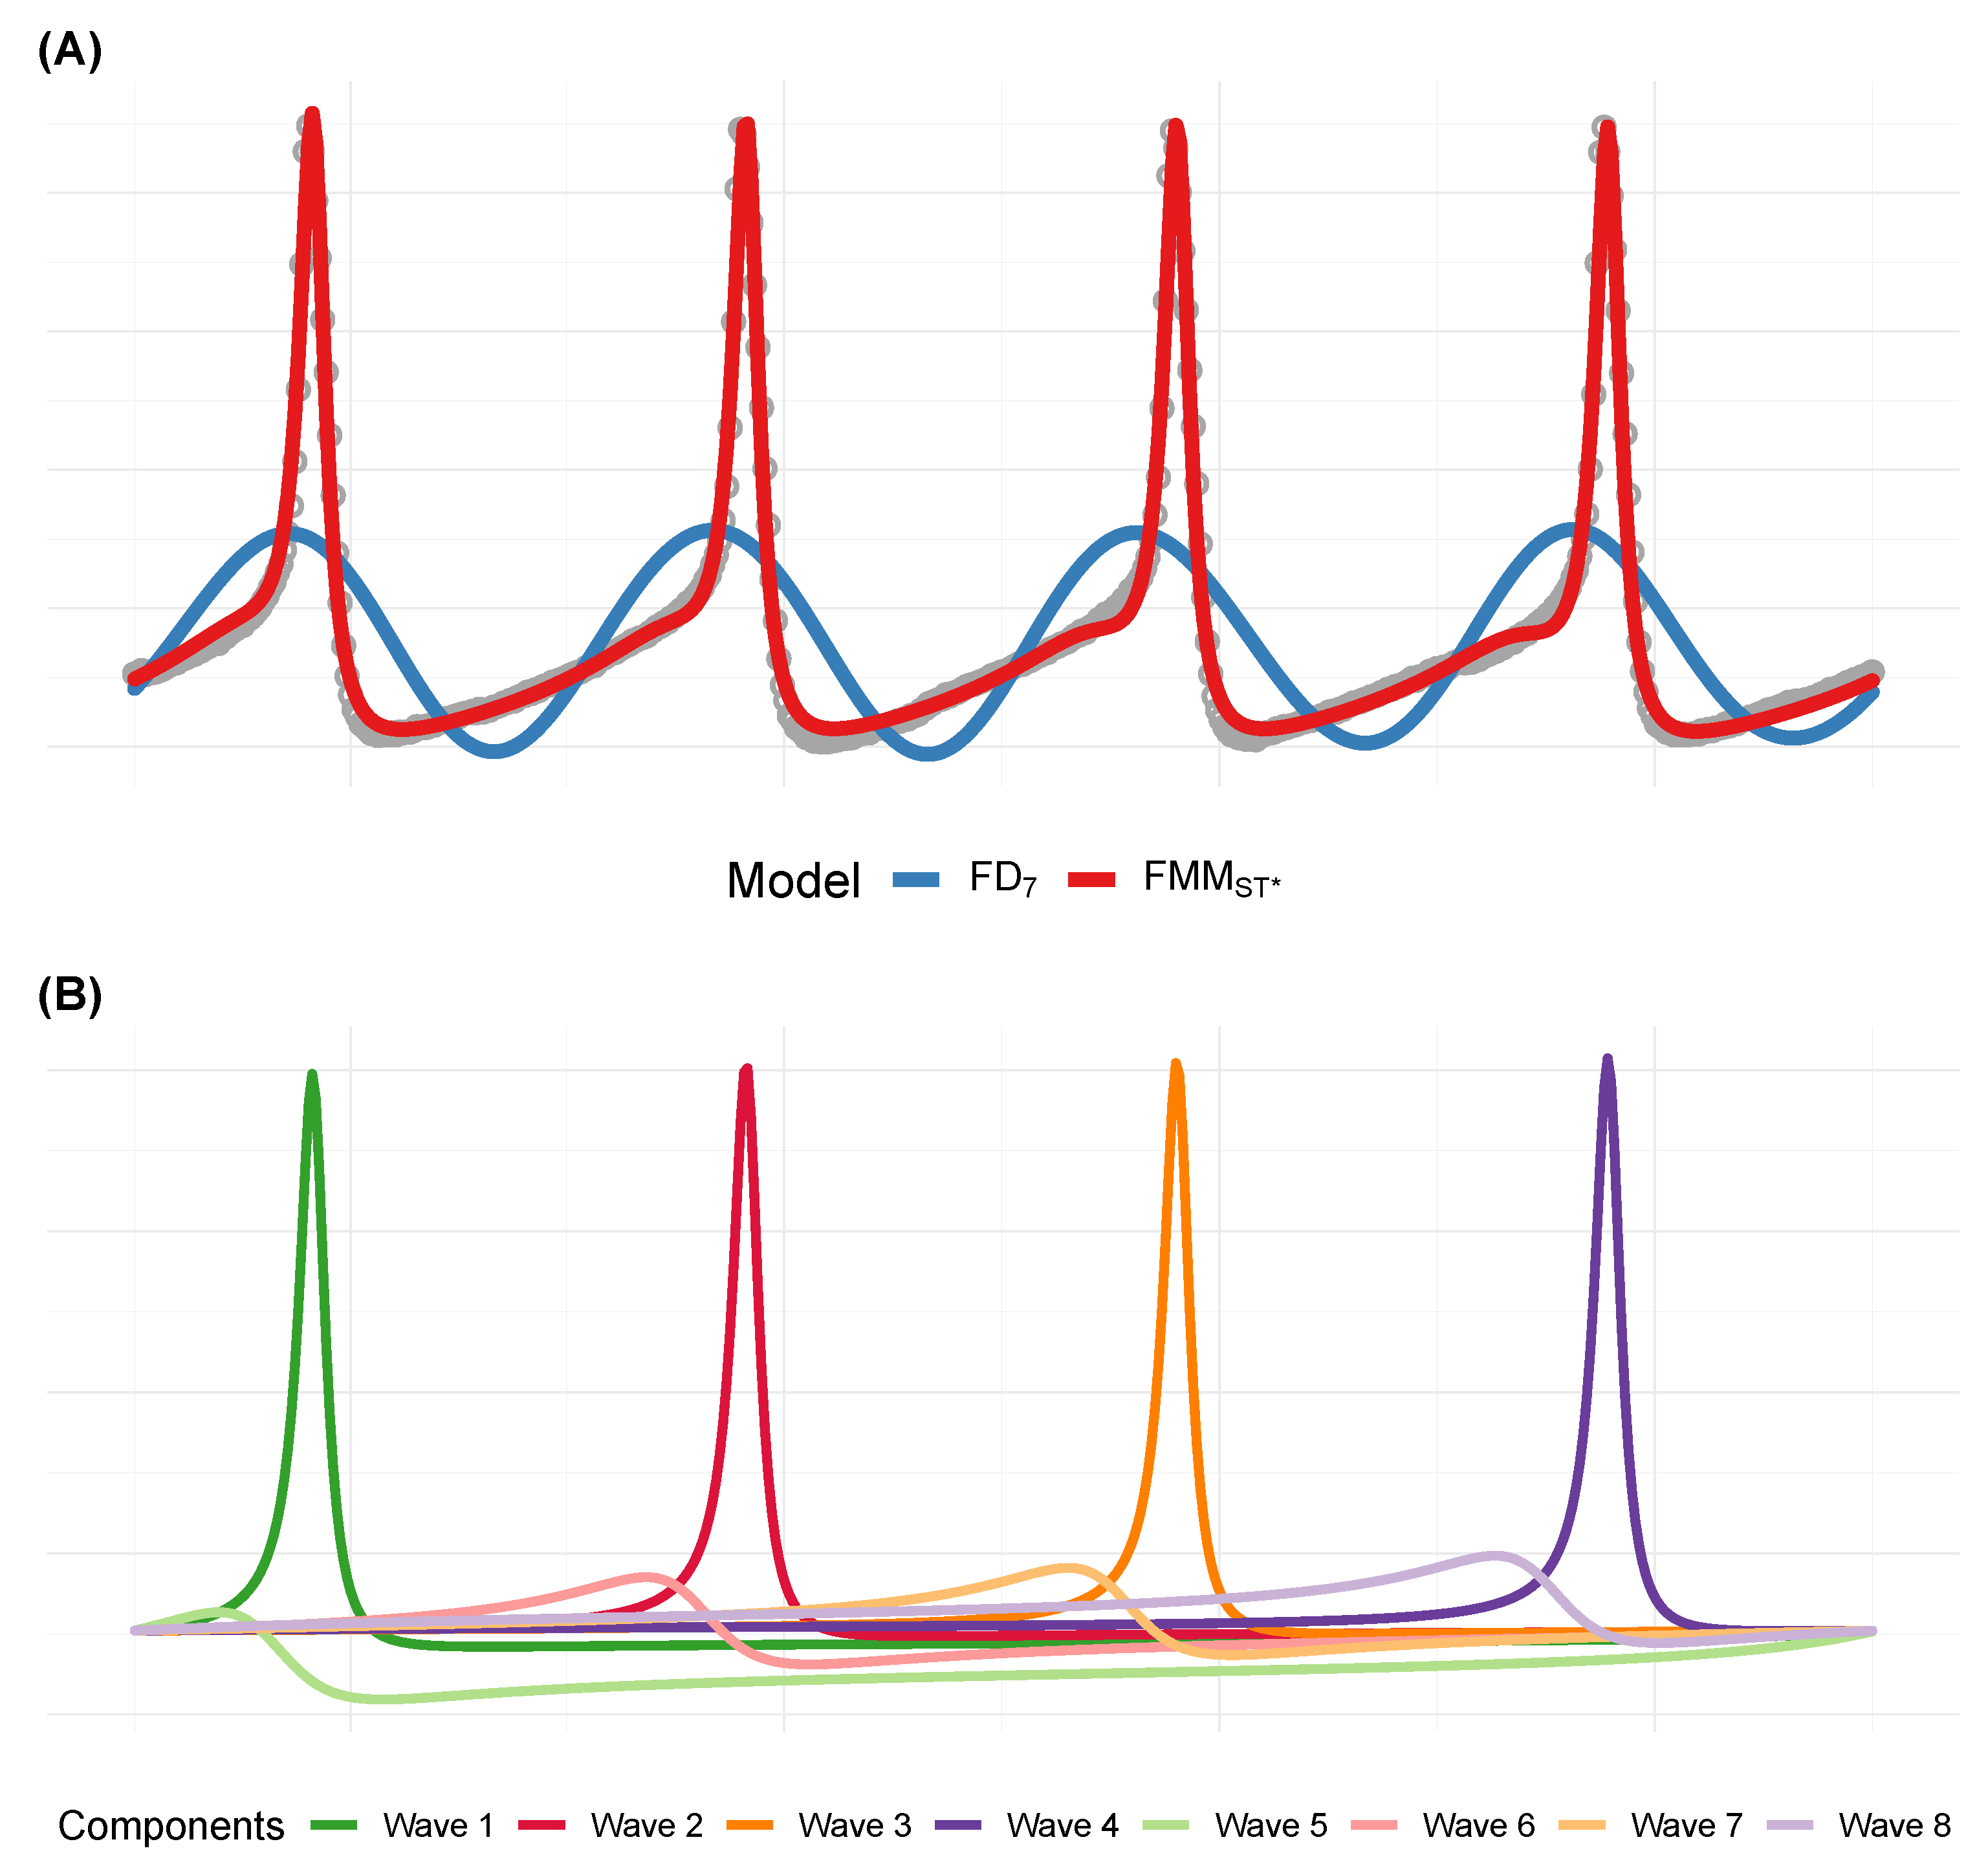
Figure 3A shows a train of AP obtained from the Squid Giant axon membrane potential and the FMM prediction. Data are freely downloadable at https://physionet.org (accessed on 23 March 2021) from the Physionet database [25]. In this case, it is assumed that the shape of the four observed spikes is equal. The FMM model takes into account these assumptions by adding restrictions in the ω , β , and A parameters. The final model is described with an intercept plus 14 parameters, eight of them corresponding to the wave location parameters, and six parameters describing the spike shape. The accuracy of the prediction is very high. Similar accurate predictions are also obtained when other signals of the data set are analyzed. The wave decomposition of the signal is illustrated in Figure 3B.

3.2. The Arterial BP Signal

BP is one of the physical variables most frequently measured for medical diagnostics purposes. High BP is a factor that increases the risk of cardiovascular diseases, and its detection is crucial for appropriate treatments. The BP cycle is the cardiac cycle that includes two phases. The first is the systolic BP phase, representing the pressure during the contraction of the heart. The second one is the diastolic BP phase, representing the pressure while the heart rests.
The systolic and diastolic BPs are, respectively, associated with the higher and lower BP values reached during any given cardiac cycle. These values and the waveform shape can change substantially depending on the activity, internal processes, and several other factors. Thus, the interest in extracting feature measurements from the observed signal to characterize the different conditions is on the increase.
Many researchers have analyzed BP and related signals, for a recent review see Aguirre et al. (2021) [26]. In particular, feature extraction and signal estimation are interesting and challenging problems that have not been satisfactorily resolved yet.
The FMM approach can be useful in this task as parameters have a clear morphological and mathematical meaning and the signal is estimated accurately, as we illustrate below with the analysis of data from the Fantasia database included in Physionet (https://physionet.org/content/fantasia (accessed on 11 January 2021)). Fantasia provides data from BP, and other physiological signals, of 10 healthy young and 10 healthy old subjects while watching the Disney movie Fantasia. Half of them are female, and the other half are males. The signal length was 120 min. The proposal here is to analyze three-cycle segments using the multi-component model with the restrictions proposed here. The model is defined as follows:
Definition 2.
FMMBP signal
μ ( t i , θ ) = M + J = 1 3 W ( t i , υ A J ) + J = 1 3 W ( t i , υ B J ) ,
where
  • A A 1 < A B 1 ; A A 2 < A B 2 ; A A 3 < A B 3
  • α A 1 α B 1 α A 2 α B 2 α A 3 α B 3 α A 1
  • ω A 1 = ω A 2 = ω A 3 ; ω B 1 = ω B 2 = ω B 3
  • β A 1 = β A 2 = β A 3 ; β B 1 = β B 2 = β B 3
The restrictions represent the assumption that the shapes of the consecutive waves are the same. It is expected that the estimators of the shape parameters are more efficient than those obtained from individual waves. The distance between components A and B is defined using d ( α A J , α B J ) = ( 1 c o s ( α A J α B J ) ) ; J = 1 , 2 , 3 . Additionally, c o s ( β B ) and s i n ( β B ) are considered instead of β B , which is more suitable. Let us also define, A ¯ A = A A 1 + A A 2 + A A 3 3 and A ¯ B = A B 1 + A B 2 + A B 3 3 .
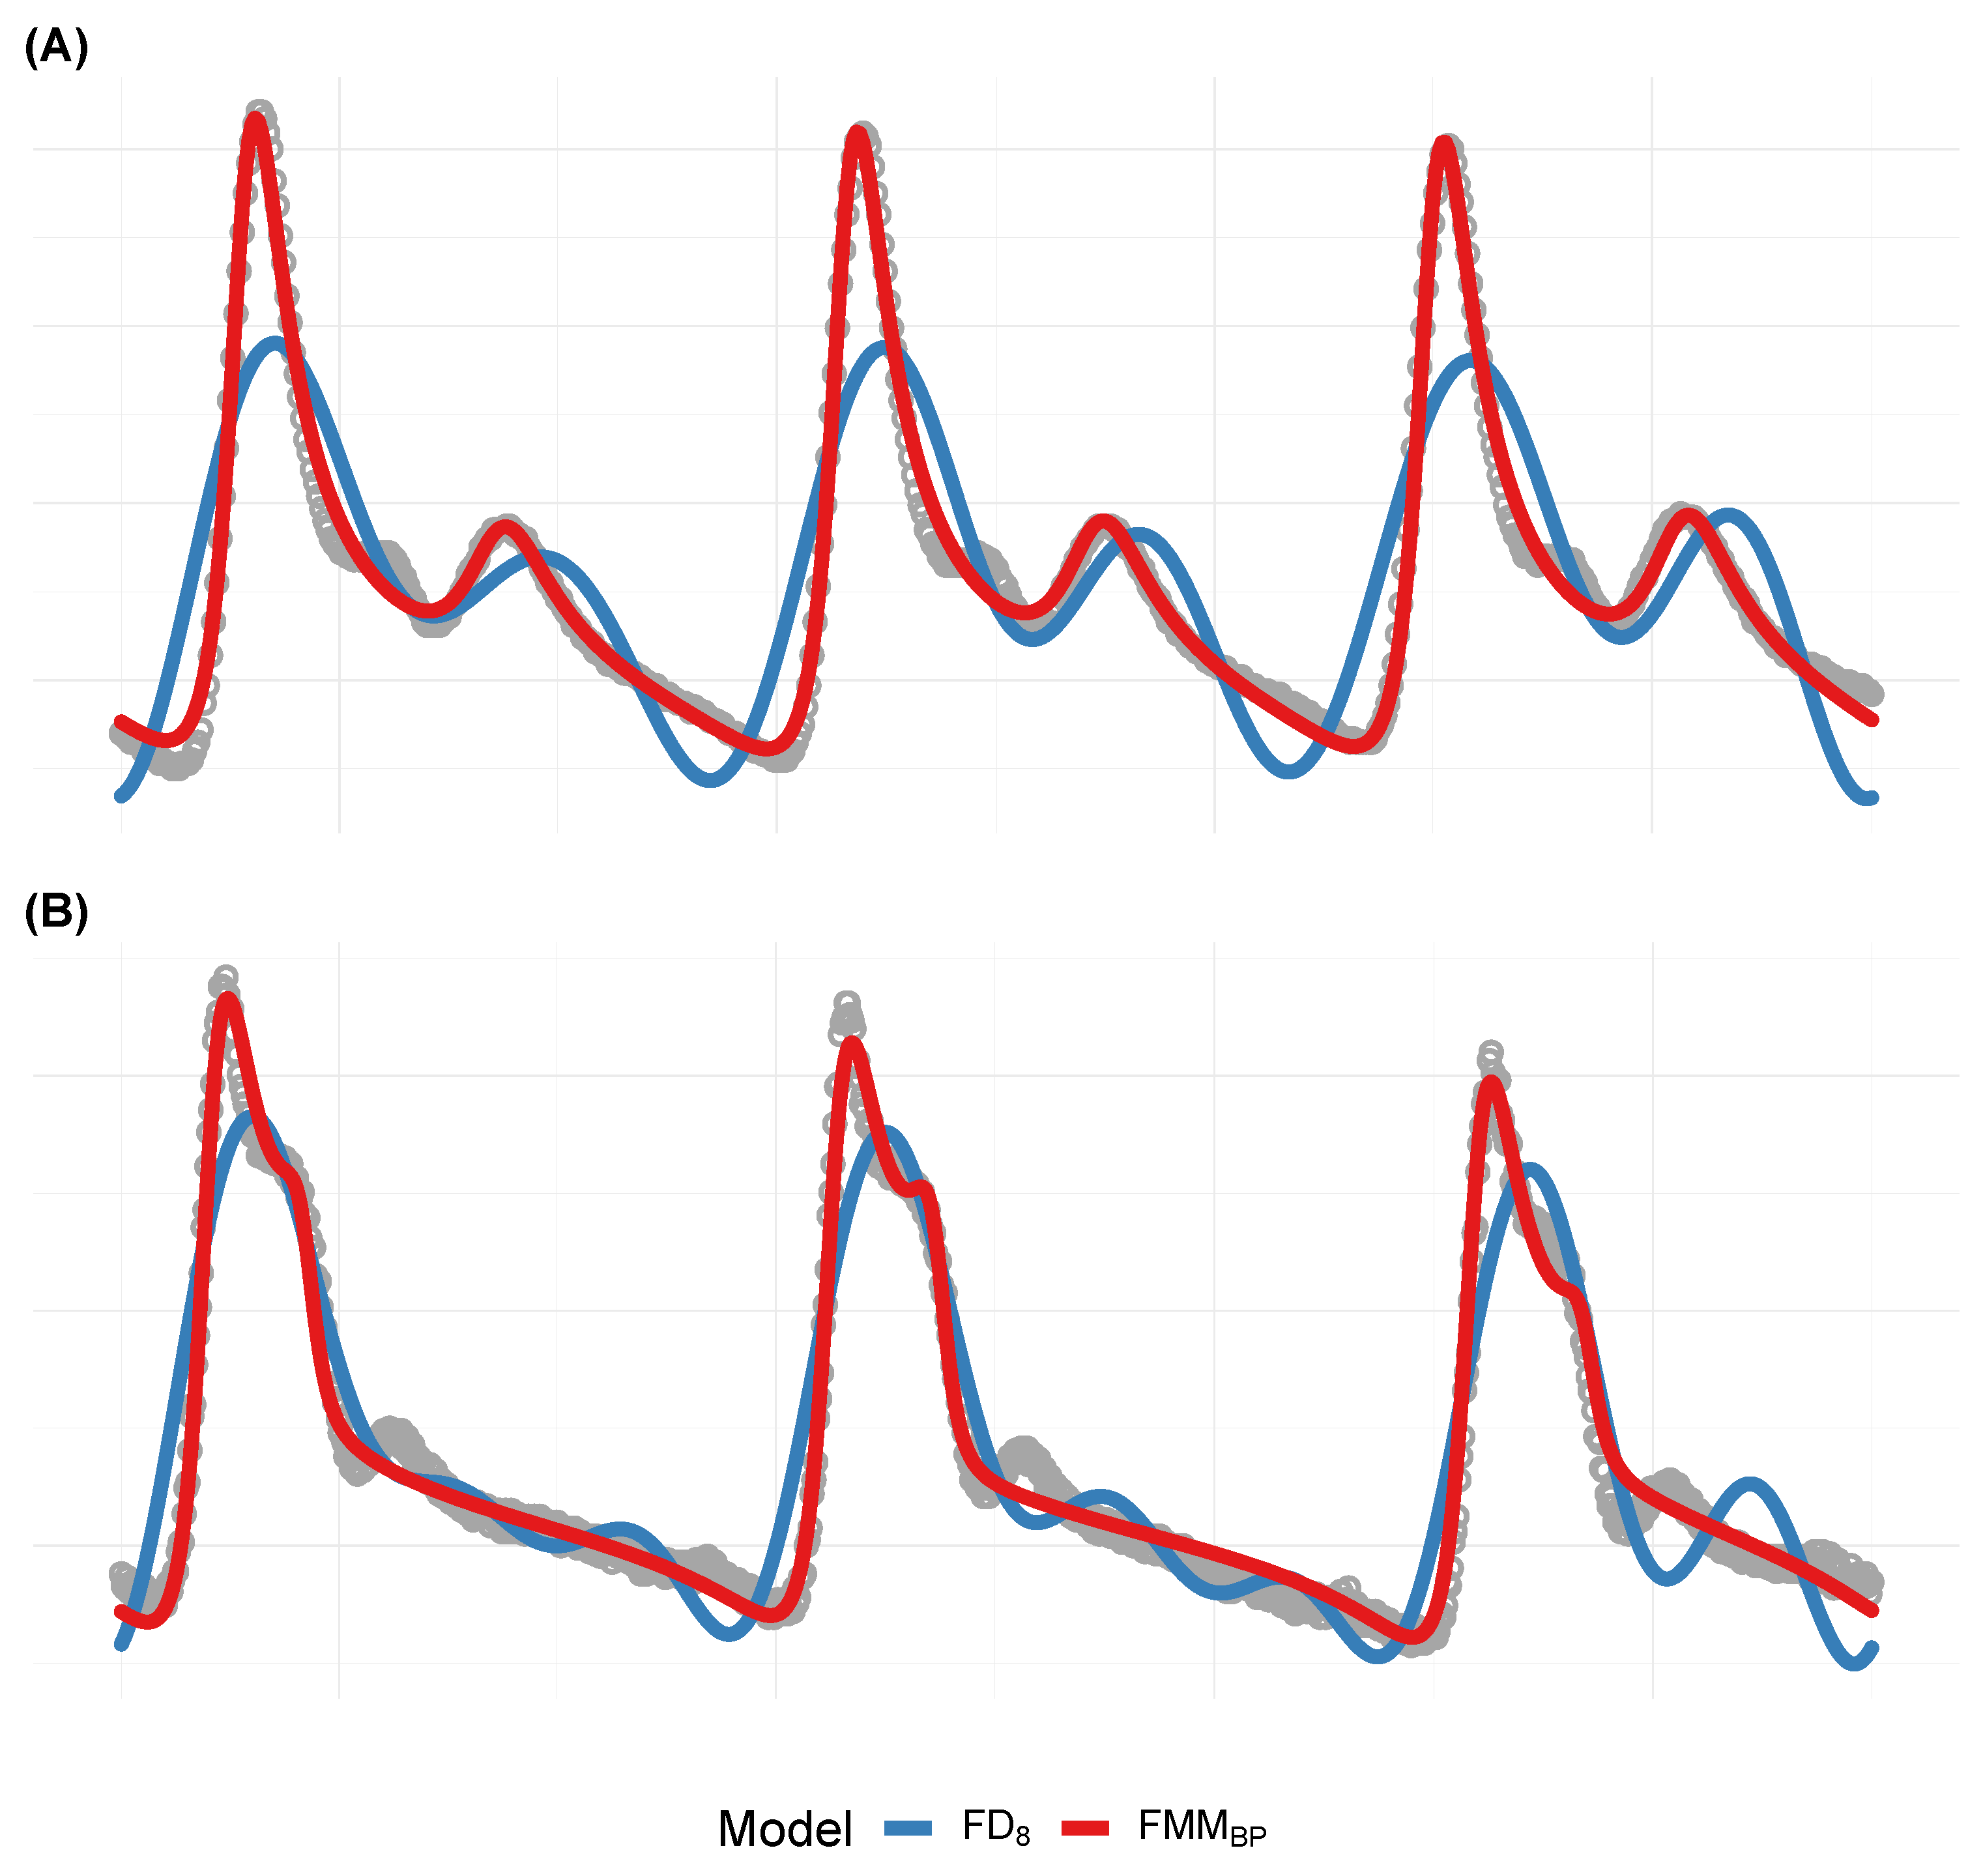
Twenty signal segments have been analyzed as being representative of each subject. Table 2 shows the mean and the standard deviation of selecting features for young and old subjects. It is interesting to note that these two groups are fully discriminated by d ( α A 1 , α B 1 ) . Furthermore, differences in other parameters are also significant between age groups, particularly in ω A . On the contrary, no significant differences between male and female parameters have been found. Figure 4 illustrates the FMM B P and FD 8 models performance on two of the 20 signal segments analyzed.

4. Challenges for the Future

4.1. Signals

Almost all life on Earth is affected by the circadian clock that manifests itself at biochemical, physiological, psychological levels. Beyond those analyzed in the paper, other biological signals follow 24-h periodic patterns, such as many locomotor activity, body temperature, or the feed intake in animals. Besides biological signals, the FMM approach would be useful to analyze periodic signals from different disciplines. It is not the first time that bio-inspired predictive algorithms have been applied to data analysis in other fields. Refractive and luminance indexes in optics, spectrophotometry curves in experimental chemistry, traffic in a website, or atmospheric pressure are more examples, to mention a few from different disciplines. Furthermore, even in less scientific fields, we can find examples of 24-h oscillatory signals such as electricity demand profiles or the diurnal pattern of water consumption. In particular, in the latter case, a bi-component FMM model is suitable as the curve contains two spikes in the flow, one in the morning and one in the evening, reflecting the higher levels of activity and water use as people start their day and end. The complete list of signal analysis problems that could benefit from the novel FMM approach would be much longer.

4.2. Theoretical, Computational and Methodological Advances

There are different lines of work for the future. On the one hand, theoretical models to describe multiple correlated signals should be developed. These results will be applied, in particular, to the analysis of multiple leads in the ECG or to the simultaneous analysis of different physiologically related signals such as the ECG and BP. Additionally, the development of synchronization and correlation measures would be interesting, mostly in neuroscience. Another interesting theoretical question to research in the future is the relationship between the parameter values attained from the analysis of single vs. multiple cycles.
From the computational point of view, several questions remain to be addressed, such as implementing other parameter restrictions, the inclusion of weights, or the reduction of the execution time by reformulating the fitting algorithm.
Finally, the topics of the supervised and unsupervised classification of waveforms are of great interest in many disciplines. Specifically in neuroscience, where the cluster of cells by their waveforms, called Spike Sorting, is one of the problems to which more attention is devoted. A catalogue of parameter configurations which derives from typical waveforms can be elaborated. The question of how to deal with the circular parameters in the classification algorithms should also be investigated.

4.3. Contributions to Medical Advances

The most interesting, by far, that the future of research in this field holds is contributing to solving relevant medical problems. Among the most important ones are the detection of hypertension and other cardiology pathologies, and the determination of factors that influence the course of neurological disease such as Parkinson. Many exciting questions in chronobiology remain open, such as the relation of rhythmicity patterns with such diseases as cancer, how the hormonal level fluctuations affect such physiological processes as sleep, or the lack of a well-established core clock gene activation time across human organs, which is critical to enhance treatment efficiency in circadian medicine.

Author Contributions

Conceptualization and writing—original draft preparation, C.R.; preparation and writing—review and editing, C.R., I.F., Y.L. and A.R.-C. All authors have read and agreed to the published version of the manuscript.

Funding

This research was partially funded by the Spanish Ministerio de Economía y Competitividad, grant number PID2019-106363RB-I00.

Institutional Review Board Statement

Not applicable.

Informed Consent Statement

Not applicable.

Data Availability Statement

Publicly available datasets were analyzed in this study. The datasets used for chronobiology examples can be found in the GEO repository (accession number GSE11923) and in the reference [19]. For the other applications, datasets are openly available in the Physionet database [25].

Conflicts of Interest

The authors declare no conflict of interest.

Abbreviations

The following abbreviations are used in this manuscript:
APAction Potential
ASAnalytic Signal
BPBlood Pressure
COSCosinor model
CRANComprehensive R Archive Network
ECGElectrocardiogram
FDFourier Decomposition
FMMFrequency Modulated Mobiüs
GEOGene Expression Omnibus
IFInstantaneous Frequency
MIMaximization-Identification
MLMaximum Likelihood
NpmdNonpsychotic major depression
ODEOrdinary Differential Equation

References

  1. Boashash, B. Time-Frequency Signal Analysis and Processing: A Comprehensive Reference; Elsevier Science: Amsterdam, The Netherlands, 2016. [Google Scholar]
  2. Wigren, T. Model Order and Identifiability of Non-Linear Biological Systems in Stable Oscillation. IEEE-ACM Trans. Comput. Biol. Bioinform. 2015, 12, 1479–1484. [Google Scholar] [CrossRef] [PubMed]
  3. Ashwin, P.; Coombes, S.; Nicks, R. Mathematical Frameworks for Oscillatory Network Dynamics in Neuroscience. J. Math. Neurosci. 2016, 6, 2. [Google Scholar] [CrossRef] [PubMed]
  4. Pikovsky, A.; Rosenblum, M. Dynamics of Globally Coupled Oscillators: Progress and Perspectives. Chaos 2015, 25, 097616. [Google Scholar] [CrossRef] [PubMed]
  5. Cole, S.; Voytek, B. Brain Oscillations and the Importance of Waveform Shape. Trends Cogn. Sci. 2017, 21, 137–149. [Google Scholar] [CrossRef] [PubMed]
  6. Kowalski, M.; Meynard, A.; Wu, H. Convex Optimization Approach to Signals with Fast Varying Instantaneous Frequency. Appl. Comput. Harmon. Anal. 2018, 44, 89–122. [Google Scholar] [CrossRef] [Green Version]
  7. Rueda, C.; Larriba, Y.; Peddada, S. Frequency Modulated Möbius Model Accurately Predicts Rhythmic Signals in Biological and Physical Sciences. Sci. Rep. 2019, 9, 18701. [Google Scholar] [CrossRef] [PubMed]
  8. Rueda, C.; Rodríguez-Collado, A.; Larriba, Y. A Novel Wave Decomposition for Oscillatory Signals. IEEE Trans. Signal Process. 2021, 69, 960–972. [Google Scholar] [CrossRef]
  9. Rueda, C.; Larriba, Y.; Lamela, A. The Hidden Wave in the ECG Uncovered Revealing a Sound Automated Interpretation Method. Sci. Rep. 2021, 11, 3724. [Google Scholar] [CrossRef] [PubMed]
  10. Rodríguez-Collado, A.; Rueda, C. A Simple Parametric Representation of the Hodgkin-Huxley Model. Unpublished. Available online: https://www.biorxiv.org/content/10.1101/2021.01.11.426189v1 (accessed on 11 January 2021).
  11. Rodríguez-Collado, A.; Rueda, C. Electrophysiological and Transcriptomic Features Reveal a Circular Taxonomy of Cortical Neurons. Unpublished. Available online: https://www.biorxiv.org/content/10.1101/2021.03.24.436849v1 (accessed on 25 March 2021).
  12. Larriba, Y.; Rueda, C. A Circadian Gene Expression Atlas in Humans. Unpublished.
  13. Fernández, I.; Rodríguez-Collado, A.; Larriba, Y.; Lamela, A.; Canedo, C.; Rueda, C. FMM: An R Package for Modeling Rhythmic Patterns in Oscillatory Systems. Unpublished.
  14. Picinbono, B. On Instantaneous Amplitude and Phase of Signals. IEEE Trans. Signal Process. 1997, 45, 552–560. [Google Scholar] [CrossRef] [Green Version]
  15. Sandoval, S.; De Leon, P. Theory of the Hilbert Spectrum. arXiv 2015, arXiv:1504.07554. [Google Scholar]
  16. Teeter, C.; Iyer, R.; Menon, V.; Gouwens, N.; Feng, D.; Berg, J.; Szafer, A.; Cain, N.; Zeng, H.; Hawrylycz, M.; et al. Generalized Leaky Integrate-and-Fire Models Classify Multiple Neuron Types. Nat. Commun. 2018, 9, 709. [Google Scholar] [CrossRef] [PubMed] [Green Version]
  17. Fernández, I.; Rodríguez-Collado, A.; Larriba, Y.; Lamela, A.; Canedo, C.; Rueda, C. FMM: Rhythmic Patterns Modeling by FMM Models. R Package. Available online: https://cran.r-project.org/web/packages/FMM/index.html (accessed on 8 March 2021).
  18. Cornelissen, G. Cosinor-Based Rhythmometry. Theor. Biol. Med. Model. 2014, 11, 16. [Google Scholar] [CrossRef] [PubMed] [Green Version]
  19. Posener, J.A.; DeBattista, C.; Williams, G.H.; Kraemer, H.C.; Kalehzan, B.M.; Schatzberg, A.F. 24-Hour Monitoring of Cortisol and Corticotropin Secretion in Psychotic and Nonpsychotic Major Depression. Arch. Gen. Psychiatry. 2000, 57, 755–760. [Google Scholar] [CrossRef] [PubMed]
  20. Ermentrout, G.; Terman, D. Mathematical Foundations of Neuroscience; Springer: New York, NY, USA, 2010. [Google Scholar]
  21. Mensi, S.; Naud, R.; Pozzorini, C.; Avermann, M.; Petersen, C.; Gerstner, W. Parameter Extraction and Classification of Three Cortical Neuron Types Reveals Two Distinct Adaptation Mechanisms. J. Neurophysiol. 2012, 107, 1756–1775. [Google Scholar] [CrossRef] [PubMed]
  22. Trainito, C.; von Nicolai, C.; Miller, E.; Siegel, M. Extracellular Spike Waveform Dissociates Four Functionally Distinct Cell Classes in Primate Cortex. Curr. Biol. 2019, 29, 2973–2982. [Google Scholar] [CrossRef] [PubMed]
  23. Hodgkin, A.; Huxley, A. A Quantitative Description of Membrane Current and Its Application to Conduction and Excitation in Nerve. J. Physiol. 1952, 117, 500–544. [Google Scholar] [CrossRef] [PubMed]
  24. Naundorf, B.; Wolf, F.; Volgushev, M. Unique Features of Action Potential Initiation in Cortical Neurons. Nature 2006, 440, 1060–1063. [Google Scholar] [CrossRef] [PubMed]
  25. Goldberger, A.; Amaral, L.; Glass, L.; Hausdorff, J.; Ivanov, P.; Mark, R.; Mietus, J.; Moody, G.; Peng, C.; Stanley, H. PhysioBank, PhysioToolkit, and PhysioNet: Components of a New Research Resource for Complex Physiologic Signals. Circulation 2000, 101, e215–e220. [Google Scholar] [CrossRef] [PubMed] [Green Version]
  26. Aguirre, N.; Grall-Maës, E.; Cymberknop, L.; Armentano, R. Blood Pressure Morphology Assessment from Photoplethysmogram and Demographic Information Using Deep Learning with Attention Mechanism. Sensors 2021, 21, 2167. [Google Scholar] [CrossRef] [PubMed]
Figure 1. Top: (A) Iqgap2 and (B) Rps6kb1 circadian gene expressions from mouse liver along two periods of 24 h. Bottom: Mean Corticoptropin levels in (C) control and in (D) nonpsychotic major depression (Npmd) along 24 h. Observed data (grey open circles) and fitted values from COS model (green line) and FMM model (red line).
Mathematics 09 01145 g001
Figure 2. A typical heartbeat of the patient sel 230 from QT database in Physionet ATM Bank. (A): the five individual waves. (B): the predicted FMM e c g signal.
Mathematics 09 01145 g002
Figure 3. AP train from Squid Giant with experiment number a 1 t 18 2 . (A): Observed data (grey open circles), FD (blue lines) and FMM (red lines) model prediction. (B): FMM wave decomposition.
Mathematics 09 01145 g003
Figure 4. Fantasia BP signals and fittings. (A): BP signal (grey open circles), FMM B P (blue line) and FD 8 (red line) predictions, for a female of 27 years old. (B): BP signal (grey open circles), FMM B P (blue line) and FD 8 (red line) predictions, for a male of 70 years old.
Mathematics 09 01145 g004
Table 1. Brief description of FMM related papers.
ReferenceDescription
Rueda et al. (2019) [7]The single-component FMM model
Rueda et al. (2021a) [8]The multi-component FMM model
Rueda et al. (2021b) [9]The FMM approach for describing ECG signals
Rodríguez-Collado & Rueda (2021a) [10]The FMM representation of the Hodgkin-Huxley model
Rodríguez-Collado & Rueda (2021b) [11]The potential of FMM features to classify neurons
Larriba & Rueda (2021) [12]The potential of FMM to solve problems in chronobiology
Fernández et al. (2021) [13]The R package that allows implementing the model
Table 2. Mean (SD) for a selection of FMM parameters for old and young subjects.
A ¯ A A ¯ B ω A ω B
Old101.979 (19.944)21.125 (9.951)0.067 (0.011)0.075 (0.027)
Young99.961 (27.294)20.756 (8.842)0.098 (0.018)0.057 (0.022)
β A c o s ( β B ) s i n ( β B ) d ( α A 1 , α B 1 )
Old2.222 (0.881)−0.728 (0.490)0.88 (0.436)0.371 (0.090)
Young1.945 (0.212)−0.385 (0.396)−0.200 (0.863)0.097 (0.057)
Publisher’s Note: MDPI stays neutral with regard to jurisdictional claims in published maps and institutional affiliations.

