
Ordering of Omics Features Using Beta Distributions on Montecarlo p-Values


Abstract
1. Introduction
2. Materials and Methods
2.1. Modelling Montecarlo p-Values
2.2. Our Approach
2.3. Applications to Omics Data
- Methylation data: The Infinium DNA MethylationEPIC assay GSE149282 dataset ([16]) was included as example of differential methylation analysis. The MethylationEPIC array includes 850,000 methylation sites (CpGs) across the genome at single-nucleotide resolution. The dataset is made with 24 colorectal cancer (CRC) and normal adjacent colon from 12 patients. See Table 1 (experiment 24).
- Microarray data: The expression array datasets were downloaded from GEO [18], by searching the terms “expression profiling by array”, “Homo sapiens”, “tissue”, “colorectal cancer NOT cell line”. This query returned 218 results (to date 15 May 2019). Of these, 195 datasets were excluded because of xenografts, organoid culture, Superseries, NanoString platform and others. Finally 21 datasets corresponding to case/control samples obtained directly from patients were included; from these datasets, 9 were paired, i.e., healthy and cancerous samples from the same patient, and the other 12 were non-paired studies, i.e., those with independent samples (see Table 1, experiments 1 to 23. Datasets 20 and 22 were discarded afterwards and therefore were not included in the table).
3. Results
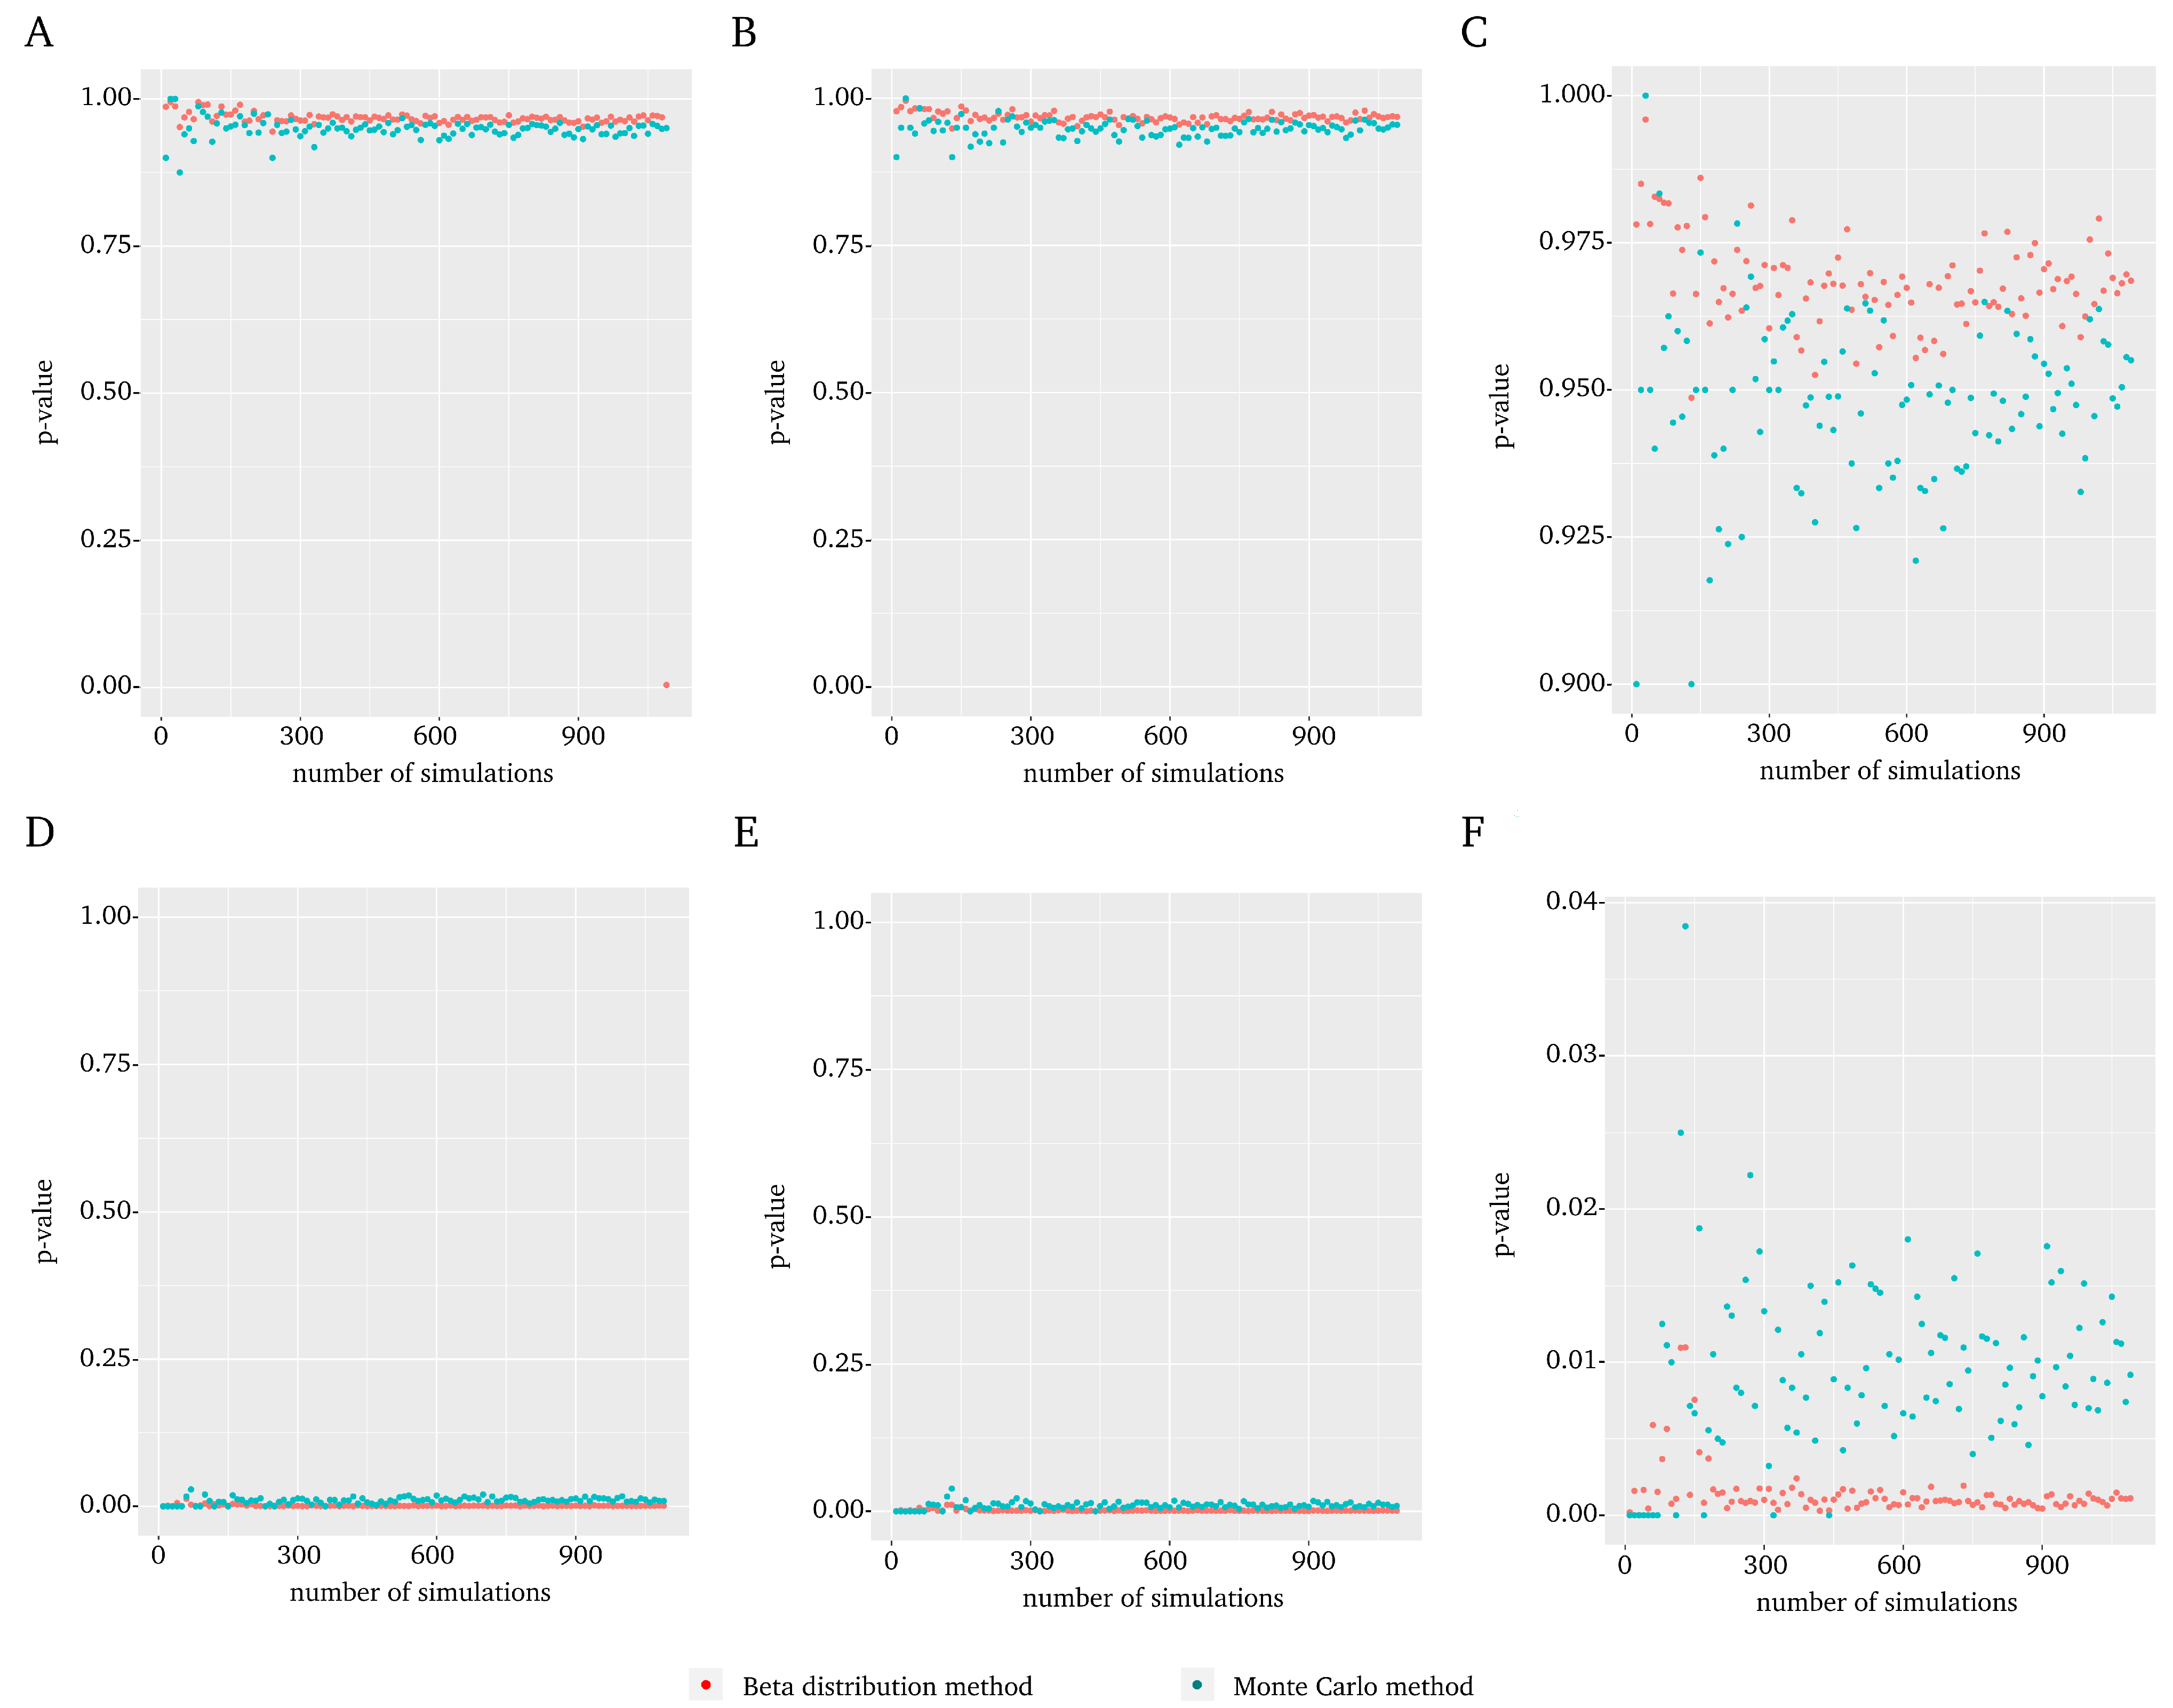
3.1. Comparison between Conventional Montecarlo p-Value and the Score
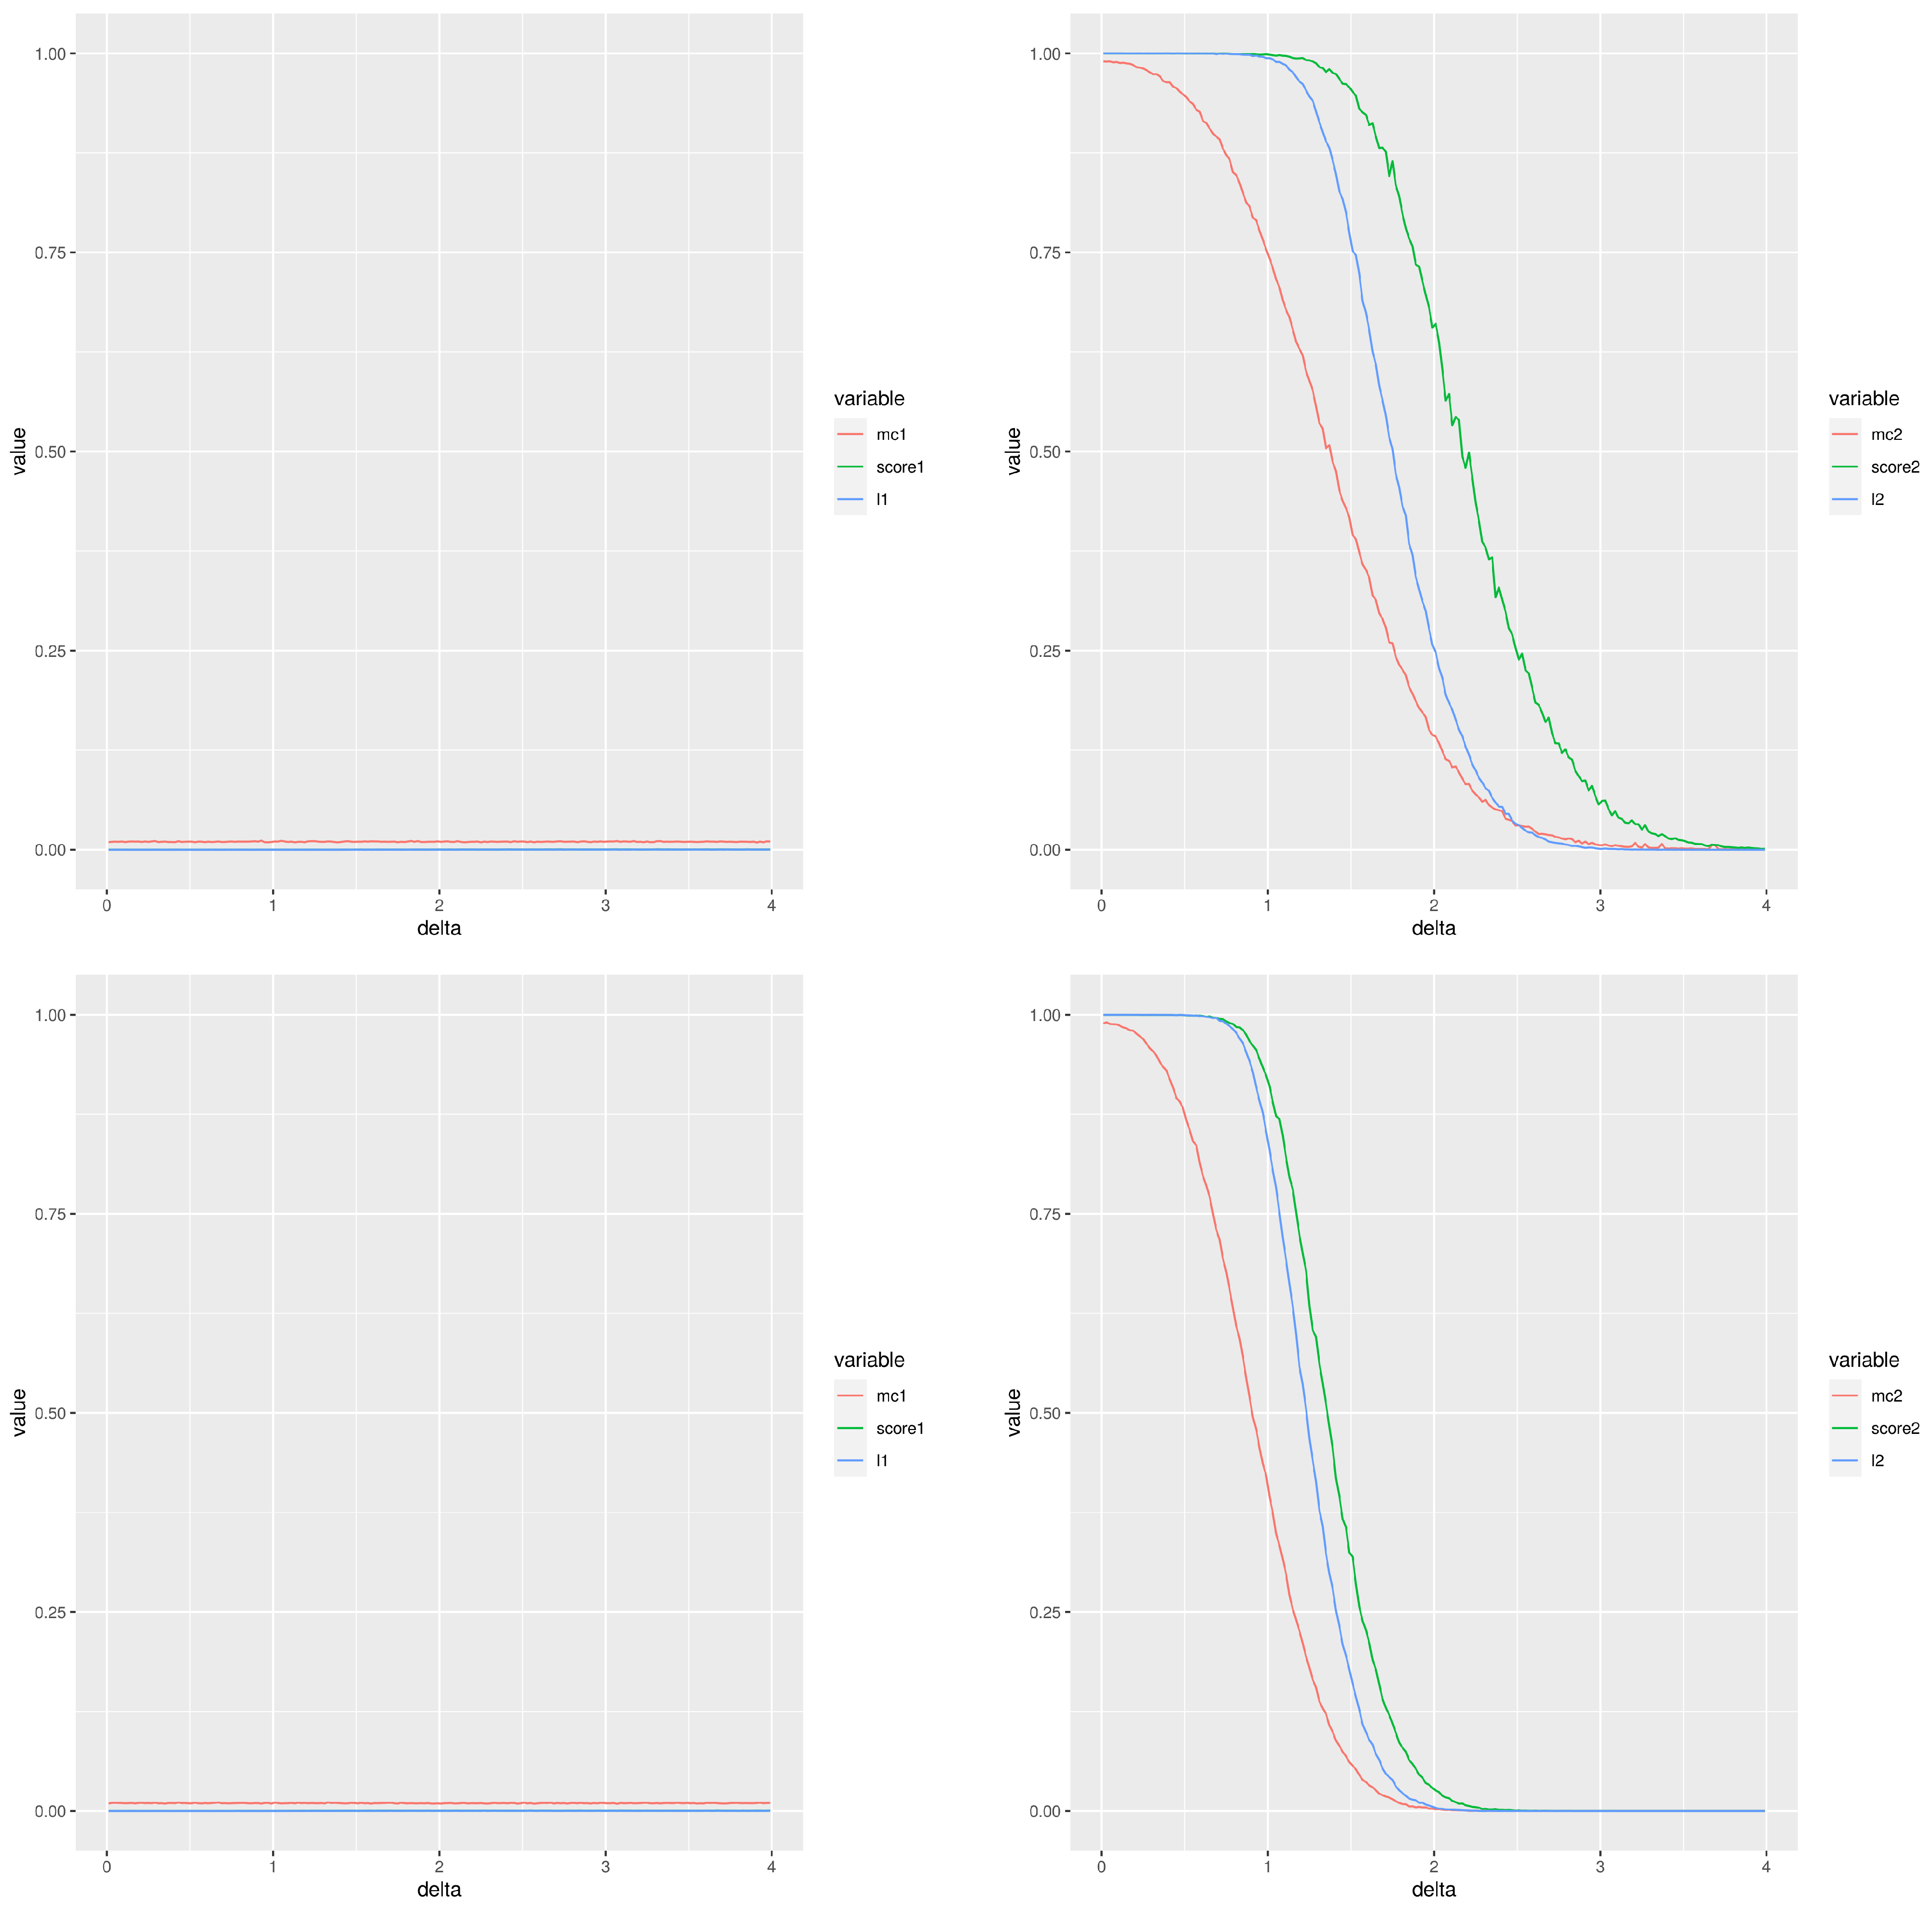
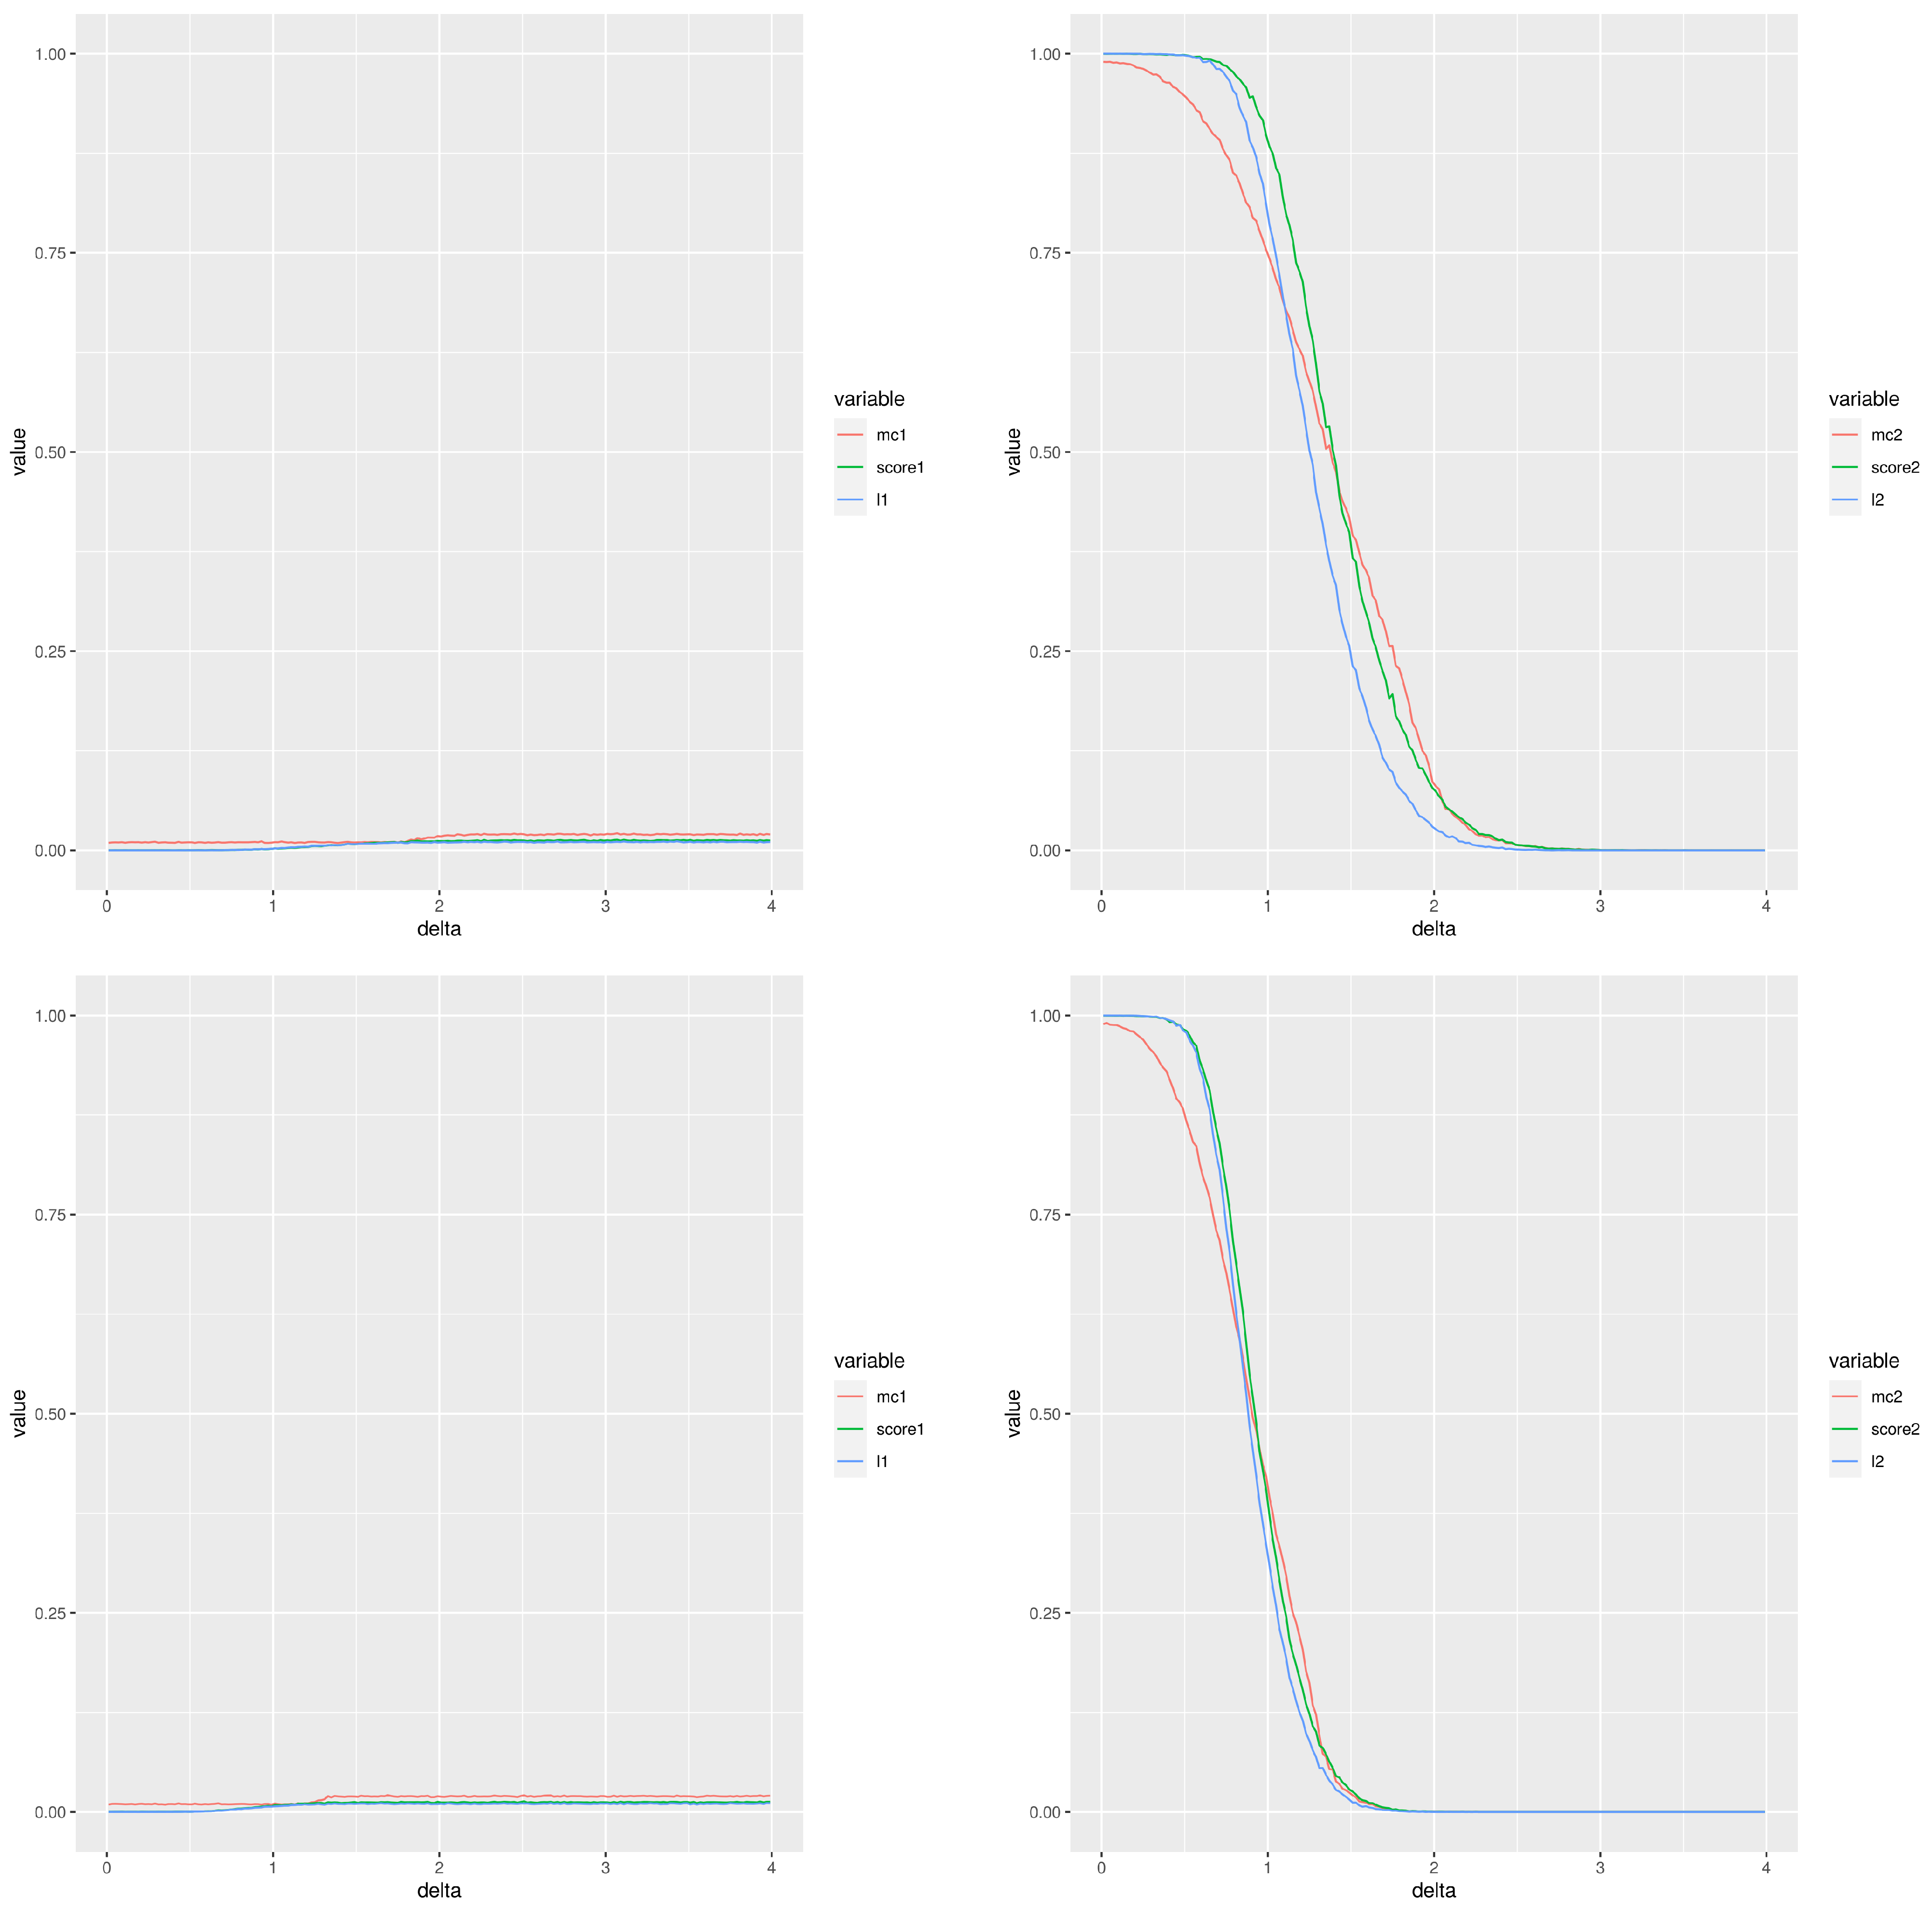
3.2. Simulation Study
- A value for the false discovery rate (FDR) is given.
- For a given model, a realisation is generated.
- The Montecarlo p-value, our proposed score and the p-value of the moderated t-test are calculated. A number of simulations (from 100 to 1000) is used for the evaluation of the Montecarlo p-value and of the proposed score.
- The Benjamini–Hochberg correction will be applied to the three quantities evaluated in step 3.
- The features (genes) declared as significant will be compared with the (real) significant features.
- Steps 2 to 5 are repeated.
3.3. Using the Score with Real Datasets
3.3.1. Using the Score for Multi-Cohort Analysis
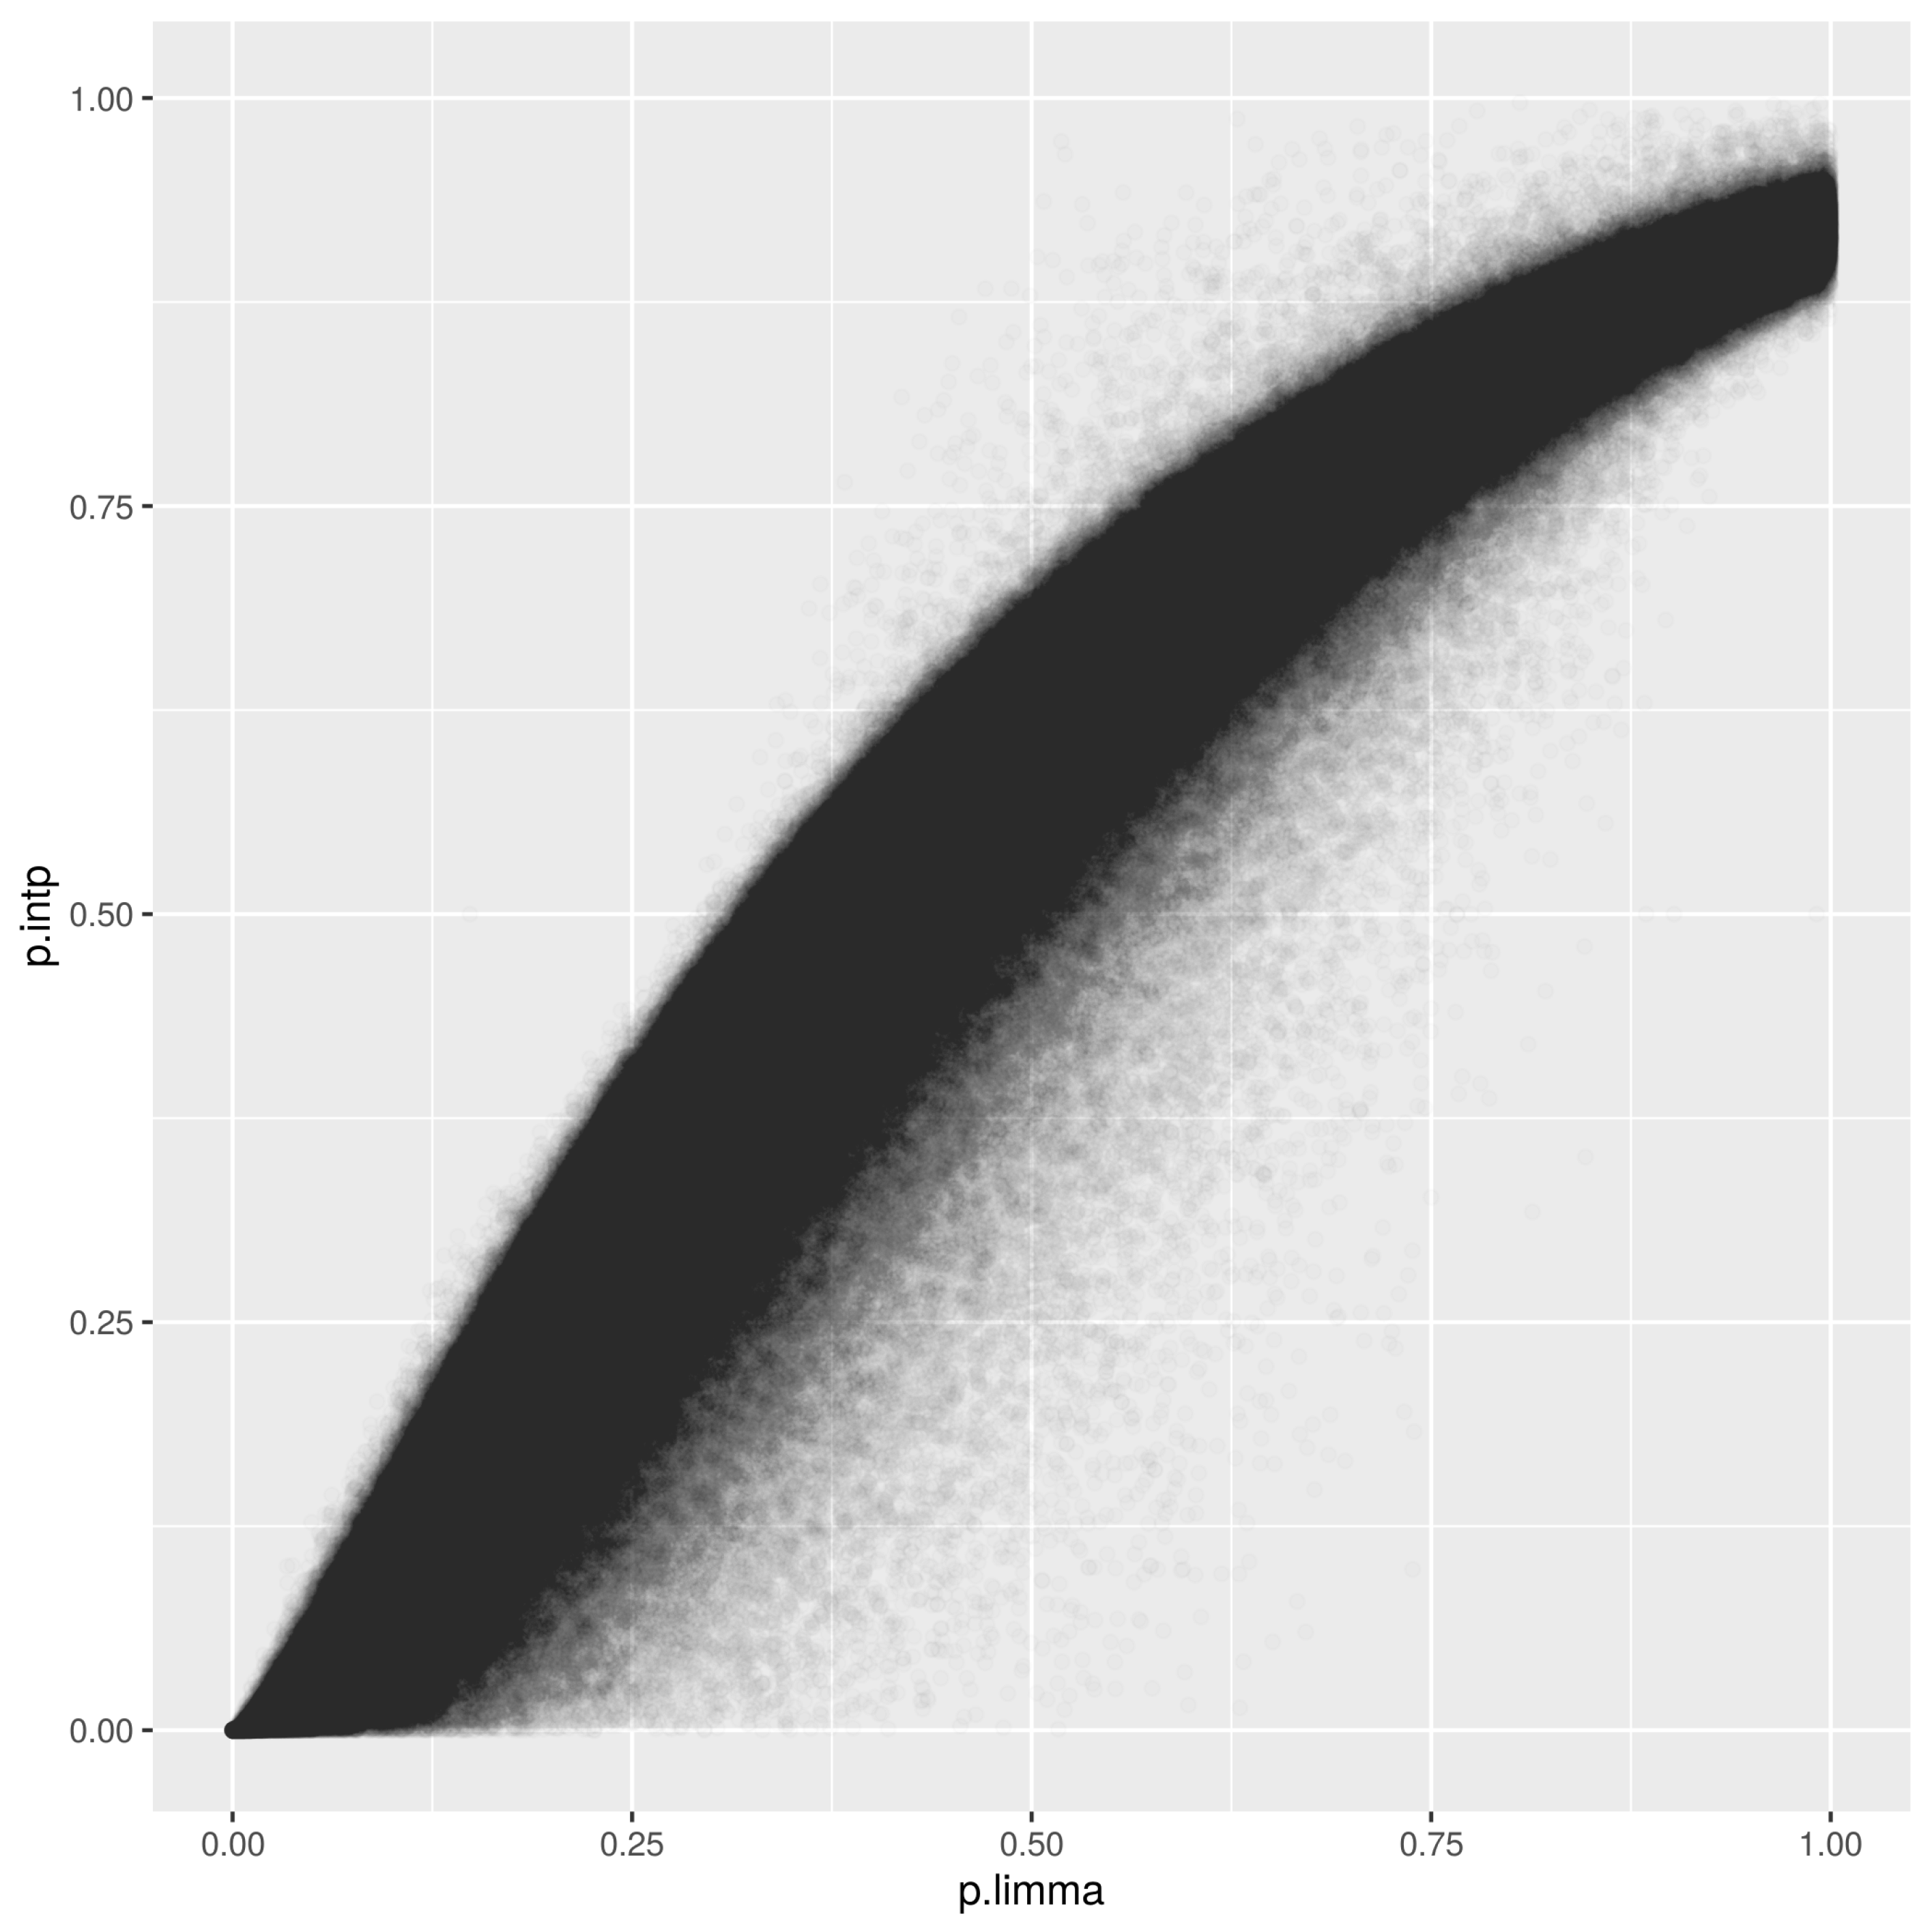
3.3.2. Score vs. Moderated p-Value
3.3.3. Using the Score on Different Platforms
4. Discussion
5. Conclusions
Supplementary Materials
Author Contributions
Funding
Institutional Review Board Statement
Informed Consent Statement
Conflicts of Interest
Appendix A
References
- Boulesteix, A.L.; Slawski, M. Stability and aggregation of ranked gene lists. Briefings Bioinform. 2009, 10, 556–568. [Google Scholar] [CrossRef] [PubMed]
- Chen, Q.; Zhou, X.J.; Sun, F. Finding Genetic Overlaps Among Diseases Based on Ranked Gene Lists. J. Comput. Biol. 2015, 22, 111–123. [Google Scholar] [CrossRef]
- Smyth, G.K.; Phipson, B. Permutation p-values Should Never Be Zero: Calculating Exact P-values When Permutations Are Randomly Drawn. Stat. Appl. Genet. Mol. Biol. 2010, 9, 39. [Google Scholar]
- Robert, C.; Casella, G. Introducing Monte Carlo Methods with R; Springer: New York, NY, USA, 2010. [Google Scholar] [CrossRef]
- Manly, B.F.J. Randomization, Bootstrap and Monte Carlo Methods in Biology, 3rd ed.; Texts in Statistical Science; Chapman & Hall/CRC: Boca Raton, FL, USA, 2007. [Google Scholar]
- Barnard, G. Contribution to the discussion of Professor Bartlett’s paper. J. R. Stat. Soc. B 1963, 25, 294. [Google Scholar]
- Bair, E. Identification of significant features in DNA microarray data. Wiley Interdiscip. Rev. Comput. Stat. 2013, 5, 309–325. [Google Scholar] [CrossRef]
- Hung, J.H.; Weng, Z. Analysis of Microarray and RNA-seq Expression Profiling Data. Cold Spring Harb. Protoc. 2017, 2017. [Google Scholar] [CrossRef] [PubMed]
- Halsey, L.G.; Curran-Everett, D.; Vowler, S.L.; Drummond, G.B. The fickle P value generates irreproducible results. Nat. Methods 2015, 12, 179–185. [Google Scholar] [CrossRef]
- Benjamin, D.J.; Berger, J.O.; Johannesson, M.; Nosek, B.A.; Wagenmakers, E.J.; Berk, R.; Bollen, K.A.; Brembs, B.; Brown, L.; Camerer, C.; et al. Redefine statistical significance. Nat. Hum. Behav. 2018, 2, 6–10. [Google Scholar] [CrossRef]
- Owen, C.E.B. Parameter Estimation for the Beta Distribution. Master’s Thesis, Department of Statistics, Brigham Young University, Provo, UT, USA, 2008. [Google Scholar]
- Agresti, A. Categorical Data Analysis, 3rd ed.; Wiley Series in Probability and Statistics; Wiley-Interscience: Hoboken, NJ, USA, 2013. [Google Scholar]
- Smyth, G.K. Linear Models and Empirical Bayes Methods for Assessing Differential Expression in Microarray Experiments. Stat. Appl. Genet. Mol. Biol. 2004, 3, 1–25. [Google Scholar] [CrossRef]
- Li, M.; Zhao, L.M.; Li, S.L.; Li, J.; Gao, B.; Wang, F.F.; Wang, S.P.; Hu, X.H.; Cao, J.; Wang, G.Y. Differentially expressed lncRNAs and mRNAs identified by NGS analysis in colorectal cancer patients. Cancer Med. 2018, 7, 4650–4664. [Google Scholar] [CrossRef]
- Kim, S.K.; Kim, S.Y.; Kim, J.H.; Roh, S.A.; Cho, D.H.; Kim, Y.S.; Kim, J.C. A nineteen gene-based risk score classifier predicts prognosis of colorectal cancer patients. Mol. Oncol. 2014, 8, 1653–1666. [Google Scholar] [CrossRef]
- Ishak, M.; Baharudin, R.; Mohamed Rose, I.; Sagap, I.; Mazlan, L.; Mohd Azman, Z.A.; Abu, N.; Jamal, R.; Lee, L.H.; Ab Mutalib, N.S. Genome-Wide Open Chromatin Methylome Profiles in Colorectal Cancer. Biomolecules 2020, 10, 719. [Google Scholar] [CrossRef]
- Smyth, G.; Ritchie, M.; Silver, J.; Wettenhall, J.; Thorne, N.; McCarthy, D.; Wu, D.; Hu, Y.; Shi, W.; Phipson, B.; et al. Limma: Linear Models for Microarray Data. R Package Version 3.22.7. 2015. Available online: https://rdrr.io/bioc/limma/ (accessed on 5 June 2021).
- Barrett, T.; Wilhite, S.E.; Ledoux, P.; Evangelista, C.; Kim, I.F.; Tomashevsky, M.; Marshall, K.A.; Phillippy, K.H.; Sherman, P.M.; Holko, M.; et al. NCBI GEO: Archive for functional genomics datasets—update. Nucleic Acids Res. 2012, 41, D991–D995. [Google Scholar] [CrossRef]
- Vlachavas, E.I.; Pilalis, E.; Papadodima, O.; Koczan, D.; Willis, S.; Klippel, S.; Cheng, C.; Pan, L.; Sachpekidis, C.; Pintzas, A.; et al. Radiogenomic Analysis of F-18-Fluorodeoxyglucose Positron Emission Tomography and Gene Expression Data Elucidates the Epidemiological Complexity of Colorectal Cancer Landscape. Comput. Struct. Biotechnol. J. 2019, 17, 177–185. [Google Scholar] [CrossRef]
- Galamb, O.; Spisák, S.; Sipos, F.; Tóth, K.; Solymosi, N.; Wichmann, B.; Krenács, T.; Valcz, G.; Tulassay, Z.; Molnár, B. Reversal of gene expression changes in the colorectal normal-adenoma pathway by NS398 selective COX2 inhibitor. Br. J. Cancer 2010, 102, 765–773. [Google Scholar] [CrossRef]
- Skrzypczak, M.; Goryca, K.; Rubel, T.; Paziewska, A.; Mikula, M.; Jarosz, D.; Pachlewski, J.; Oledzki, J.; Ostrowsk, J. Modeling oncogenic signaling in colon tumors by multidirectional analyses of microarray data directed for maximization of analytical reliability. PLoS ONE 2010, 5, e13091. [Google Scholar] [CrossRef]
- Tsukamoto, S.; Ishikawa, T.; Iida, S.; Ishiguro, M.; Mogushi, K.; Mizushima, H.; Uetake, H.; Tanaka, H.; Sugihara, K. Clinical significance of osteoprotegerin expression in human colorectal cancer. Clin. Cancer Res. 2011, 17, 2444–2450. [Google Scholar] [CrossRef] [PubMed]
- Uddin, S.; Ahmed, M.; Hussain, A.; Abubaker, J.; Al-Sanea, N.; AbdulJabbar, A.; Ashari, L.H.; Alhomoud, S.; Al-Dayel, F.; Jehan, Z.; et al. Genome-wide expression analysis of Middle Eastern colorectal cancer reveals FOXM1 as a novel target for cancer therapy. Am. J. Pathol. 2011, 178, 537–547. [Google Scholar] [CrossRef]
- Alhopuro, P.; Sammalkorpi, H.; Niittymäki, I.; Biström, M.; Raitila, A.; Saharinen, J.; Nousiainen, K.; Lehtonen, H.J.; Heliövaara, E.; Puhakka, J.; et al. Candidate driver genes in microsatellite-unstable colorectal cancer. Int. J. Cancer 2012, 130, 1558–1566. [Google Scholar] [CrossRef]
- Khamas, A.; Ishikawa, T.; Shimokawa, K.; Mogushi, K.; Iida, S.; Ishiguro, M.; Mizushima, H.; Tanaka, H.; Uetake, H.; Sugihara, K. Screening for epigenetically masked genes in colorectal cancer using 5-aza-2-deoxycytidine, microarray and gene expression profile. Cancer Genom. Proteom. 2012, 9, 67–75. [Google Scholar]
- Kemper, K.; Versloot, M.; Cameron, K.; Colak, S.; De Sousa, E.; Melo, F.; De Jong, J.H.; Bleackley, J.; Vermeulen, L.; Versteeg, R.; et al. Mutations in the Ras-Raf axis underlie the prognostic value of CD133 in colorectal cancer. Clin. Cancer Res. 2012, 18, 3132–3141. [Google Scholar] [CrossRef]
- Galamb, O.; Wichmann, B.; Sipos, F.; Spisák, S.; Krenács, T.; Tóth, K.; Leiszter, K.; Kalmár, A.; Tulassay, Z.; Molnár, B. Dysplasia-Carcinoma Transition Specific Transcripts in Colonic Biopsy Samples. PLoS ONE 2012, 7, e48547. [Google Scholar] [CrossRef] [PubMed]
- Martin, M.L.; Zeng, Z.; Adileh, M.; Jacobo, A.; Li, C.; Vakiani, E.; Hua, G.; Zhang, L.; Haimovitz-Friedman, A.; Fuks, Z.; et al. Logarithmic expansion of LGR5 + cells in human colorectal cancer. Cell. Signal. 2018, 42, 97–105. [Google Scholar] [CrossRef]
- Moreno, V.; Alonso, M.H.; Closa, A.; Vallés, X.; Diez-Villanueva, A.; Valle, L.; Castellví-Bel, S.; Sanz-Pamplona, R.; Lopez-Doriga, A.; Cordero, D.; et al. Colon-specific eQTL analysis to inform on functional SNPs. Br. J. Cancer 2018, 119, 971–977. [Google Scholar] [CrossRef]
- Ryan, B.M.; Zanetti, K.A.; Robles, A.I.; Schetter, A.J.; Goodman, J.; Hayes, R.B.; Huang, W.Y.; Gunter, M.J.; Yeager, M.; Burdette, L.; et al. Germline variation in NCF4, an innate immunity gene, is associated with an increased risk of colorectal cancer. Int. J. Cancer 2014, 134, 1399–1407. [Google Scholar] [CrossRef]
- Del Rio, M.; Mollevi, C.; Vezzio-Vie, N.; Bibeau, F.; Ychou, M.; Martineau, P. Specific Extracellular Matrix Remodeling Signature of Colon Hepatic Metastases. PLoS ONE 2013, 8, e74599. [Google Scholar] [CrossRef] [PubMed]
- Qu, X.; Sandmann, T.; Frierson, H.; Fu, L.; Fuentes, E.; Walter, K.; Okrah, K.; Rumpel, C.; Moskaluk, C.; Lu, S.; et al. Integrated genomic analysis of colorectal cancer progression reveals activation of EGFR through demethylation of the EREG promoter. Oncogene 2016, 35, 6403–6415. [Google Scholar] [CrossRef]
- Sabates-Bellver, J.; Van Der Flier, L.G.; De Palo, M.; Cattaneo, E.; Maake, C.; Rehrauer, H.; Laczko, E.; Kurowski, M.A.; Bujnicki, J.M.; Menigatti, M.; et al. Transcriptome profile of human colorectal adenomas. Mol. Cancer Res. 2007, 5, 1263–1275. [Google Scholar] [CrossRef] [PubMed]
- Hong, Y.; Downey, T.; Eu, K.W.; Koh, P.K.; Cheah, P.Y. A ’metastasis-prone’ signature for early-stage mismatch-repair proficient sporadic colorectal cancer patients and its implications for possible therapeutics. Clin. Exp. Metastasis 2010, 27, 83–90. [Google Scholar] [CrossRef]
- Abdueva, D.; Wing, M.; Schaub, B.; Triche, T.; Davicioni, E. Quantitative expression profiling in formalin-fixed paraffin-embedded samples by Affymetrix microarrays. J. Mol. Diagn. 2010, 12, 409–417. [Google Scholar] [CrossRef]
- Lin, G.; He, X.; Ji, H.; Shi, L.; Davis, R.W.; Zhong, S. Reproducibility Probability Score—Incorporating measurement variability across laboratories for gene selection. Nat. Biotechnol. 2006, 24, 1476–1477. [Google Scholar] [CrossRef] [PubMed]
- Matsuyama, T.; Ishikawa, T.; Mogushi, K.; Yoshida, T.; Iida, S.; Uetake, H.; Mizushima, H.; Tanaka, H.; Sugihara, K. MUC12 mRNA expression is an independent marker of prognosis in stage II and stage III colorectal cancer. Int. J. Cancer 2010, 127, 2292–2299. [Google Scholar] [CrossRef]
- Sha, J.; Han, Q.; Chi, C.; Zhu, Y.; Pan, J.; Dong, B.; Huang, Y.; Xia, W.; Xue, W. PRKAR2B promotes prostate cancer metastasis by activating Wnt/Beta-catenin and inducing epithelial-mesenchymal transition. J. Cell. Biochem. 2018, 119, 7319–7327. [Google Scholar] [CrossRef] [PubMed]
- Zhang, T.; Wang, F.; Wu, J.Y.; Qiu, Z.C.; Wang, Y.; Liu, F.; Ge, X.S.; Qi, X.W.; Mao, Y.; Hua, D. Clinical correlation of B7-H3 and B3GALT4 with the prognosis of colorectal cancer. World J. Gastroenterol. 2018, 24, 3538–3546. [Google Scholar] [CrossRef]
- Chiavarina, B.; Costanza, B.; Ronca, R.; Blomme, A.; Rezzola, S.; Chiodelli, P.; Giguelay, A.; Belthier, G.; Doumont, G.; Simaeys, G.V.; et al. Metastatic colorectal cancer cells maintain the TGFBeta program and use TGFBI to fuel angiogenesis. Theranostics 2021, 11, 1626–1640. [Google Scholar] [CrossRef]
- Zhuo, C.; Wu, X.; Li, J.; Hu, D.; Jian, J.; Chen, C.; Zheng, X.; Yang, C. Chemokine (C-X-C motif) ligand 1 is associated with tumor progression and poor prognosis in patients with colorectal cancer. Biosci. Rep. 2018, 38. [Google Scholar] [CrossRef]


| Experiment | ID | Type | Platform | Samples |
|---|---|---|---|---|
| 1 | GSE110223 [19] | paired | hgu133a | 26 |
| 2 | GSE110224 [19] | paired | hgu133plus2 | 34 |
| 3 | GSE15960 [20] | paired | hgu133plus2 | 12 |
| 4 | GSE20916 [21] | non-paired | hgu133plus2 | 145 |
| 5 | GSE21510 [22] | non-paired | hgu133plus2 | 148 |
| 6 | GSE23878 [23] | non-paired | hgu133plus2 | 59 |
| 7 | GSE24514 [24] | non-paired | hgu133a | 49 |
| 8 | GSE32323 [25] | paired | hgu133plus2 | 34 |
| 9 | GSE33113 [26] | non-paired | hgu133plus2 | 96 |
| 10 | GSE37364 [27] | non-paired | hgu133plus2 | 52 |
| 11 | GSE41258 [28] | non-paired | hgu133a | 240 |
| 12 | GSE4183 [20] | non-paired | hgu133plus2 | 38 |
| 13 | GSE44076 [29] | paired | hgu219 | 196 |
| 14 | GSE44861 [30] | paired | hgu133a | 94 |
| 15 | GSE49355 [31] | non-paired | hgu133a | 38 |
| 16 | GSE77953 [32] | non-paired | hgu133a | 30 |
| 17 | GSE8671 [33] | paired | hgu133plus2 | 64 |
| 18 | GSE9348 [34] | non-paired | hgu133plus2 | 82 |
| 19 | GSE19249 [35] | non-paired | hgu133a2 | 23 |
| 21 | GSE41328 [36] | paired | hgu133plus2 | 10 |
| 23 | GSE18105 [37] | paired | hgu133plus2 | 34 |
| 24 | GSE149282 [16] | paired | Infinium MethylationEPIC | 24 |
| 25 | PRJNA413956 [14] | paired | Illumina HiSeq 3000 | 14 |
| 26 | PRJNA218851 [15] | paired | Illumina HiSeq 2000 | 36 |
| 27 | TCGA COAD | paired | RNA-Seq (not provided) | 100 |
| Symbol | Entrez ID | Min | Median | Max |
|---|---|---|---|---|
| TGFBI | 7045 | 0 | 0 | 0.0436 |
| BTNL3 | 10,917 | 0 | 4.74 | 0.0169 |
| RDH5 | 5959 | 0 | 9.99 | 0.0418 |
| XPOT | 11,260 | 0 | 2.66 | 0.0284 |
| ACADS | 35 | 0 | 3.62 | 0.0025 |
| GCG | 2641 | 0 | 1.40 | 0.0495 |
| CXCL1 | 2919 | 0 | 2.70 | 0.0492 |
| B3GALT4 | 8705 | 0 | 2.07 | 0.0333 |
| LRRFIP2 | 9209 | 0 | 3.47 | 0.0407 |
| CDHR5 | 53,841 | 0 | 4.28 | 0.0166 |
| HHLA2 | 11,148 | 0 | 2.28 | 0.0202 |
| PRKAR2B | 5577 | 0 | 3.10 | 0.0335 |
| HMGCL | 3155 | 0 | 2.09 | 0.0475 |
| FABP2 | 2169 | 0 | 6.20 | 0.0137 |
| STAP2 | 55,620 | 0 | 9.48 | 0.0419 |
| FXYD3 | 5349 | 0 | 9.48 | 0.0497 |
| ANO10 | 55,129 | 0 | 4.99 | 0.0199 |
| CKB | 1152 | 0 | 0.00024 | 0.0401 |
Publisher’s Note: MDPI stays neutral with regard to jurisdictional claims in published maps and institutional affiliations. |
© 2021 by the authors. Licensee MDPI, Basel, Switzerland. This article is an open access article distributed under the terms and conditions of the Creative Commons Attribution (CC BY) license (https://creativecommons.org/licenses/by/4.0/).
Share and Cite
Riffo-Campos, A.L.; Ayala, G.; Domingo, J. Ordering of Omics Features Using Beta Distributions on Montecarlo p-Values. Mathematics 2021, 9, 1307. https://doi.org/10.3390/math9111307
Riffo-Campos AL, Ayala G, Domingo J. Ordering of Omics Features Using Beta Distributions on Montecarlo p-Values. Mathematics. 2021; 9(11):1307. https://doi.org/10.3390/math9111307
Chicago/Turabian StyleRiffo-Campos, Angela L., Guillermo Ayala, and Juan Domingo. 2021. "Ordering of Omics Features Using Beta Distributions on Montecarlo p-Values" Mathematics 9, no. 11: 1307. https://doi.org/10.3390/math9111307
APA StyleRiffo-Campos, A. L., Ayala, G., & Domingo, J. (2021). Ordering of Omics Features Using Beta Distributions on Montecarlo p-Values. Mathematics, 9(11), 1307. https://doi.org/10.3390/math9111307