1. Introduction
The Financial Crisis of 2008 occupies a significant place in the field of financial and economic investigation, particularly considering the effect it has on the level and direction of interdependencies between financial markets. Thus, this paper aims to explore non-linear interdependencies between some relevant international stock markets, focusing on the Spanish and Polish markets, and using the nonlinear autoregressive distributed lag (NARDL) approach. Moreover, for robustness, this paper investigates whether these interdependencies are stronger during periods of economic turmoil, taking into account that Spain and Poland are countries highly dependent on developments in international reference markets such as the German, the British, the American and the Chinese stock markets.
There are plenty of studies that cover this topic. Forbes and Rigobon Ref- [
1] firstly discusses how to define the contagion of international stock market, which according to [
2] seems to grow in an event of a crisis. Mink Ref. [
3] also pointed out that the level of correlation between financial markets increases and decreases respectively in the period of turmoil or calm. The image was thereafter broadened by analysis of the impact of the crisis between developed and emerging markets [
4,
5]. More about this subject of study can be found in the publications of [
6,
7,
8], among others.
This work continues the efforts to analyze potential interdependencies between relevant and international financial markets. However, it differentiates from the previous publications with its period of investigation, which situates the 2008 Crisis in the center of this study, framing 10 years before and 10 years after. This approach is aimed to compare the situation between and after the Financial Crisis as well as to examine the level and direction of correlation caused by that. No less accidental is the statistical sample used in this study. Based on the results of earlier research, this study tries to weld several factors that intensify the level of correlation between financial markets and on this basis choose indexes representing each of the cases. Therefore, the sample contains the following countries: Germany, Great Britain, Spain, USA, China, and Poland. According to the above-mentioned factors Germany represents a high developed EU country, with strong and stable economy, that was impacted during the 2008 crisis but did not suffer long-term economic problems. Great Britain is quite a similar case, only the independent currency differs. Spain represents a developed country, a member of the Monetary Union that suffers a significant drop down in its economy after the crisis. On the other hand, China represents an international potential, which suffers the recession caused by the crisis only as a brief echo. Poland represents an emerging market that shows no stronger economic relations with the rest of the sample, additionally a recent (at this time) EU member with its own currency. USA is considered as the start and end point of the financial markets of the Financial Crisis 2008, that has an enormous impact of the global economy due to its significant position.
What is more, the paper carries out a specific approach of the empirical analysis. First, in the preliminary analysis, the correlation level of the six financial markets from the sample was calculated over the whole target period. It is to study the general level of interdependencies between those financial markets. Secondly, this period was divided into three sub-compartments (according to the bear and bull market), and the correlation level was calculated once again for each of the markets in order to notice the differences in the interrelations in the event of recession. Finally, the analysis of the level of long- and short-run interdependencies between international stock markets, focusing on the Polish and the Spanish stock markets, was conducted by applying a non-linear autoregressive distributed lag (NARDL) approach.
The Financial Crisis 2008 had an enormous impact on the recorded declines on the stock exchanges worldwide. The core data used for the analysis is the monthly change of closing price on the stock exchange from January 1998 to December 2018. The sample used in this paper—as well as the approach for the analysis—was chosen in order to observe the situation on the financial markets for two decades and point out significant changes during the crisis. With a deeper approach the level of correlation and direction of the contagion effect were also defined. It was expected to obtain different perspectives, taking into the consideration different factors that represent the markets. By extension, the study shows how the epicenter of the crisis that risen in the US flop over the rest of the financial markets, responding with reinforcement of the correlation level in different extent. The study leads to a surprising result, when it comes to interdependencies and direction of the contagion especially on the Polish and Chinese markets in relation to the German, British, Spanish and American markets.
Thus, this research contributes to the standing empirical literature in several ways. First, this study explores in depth potential interdependencies between international stock markets, focusing on the Polish and the Spanish stock markets. This is a crucial issue in this paper, because, unlike the studies conducted so far, this study focuses on analyzing two countries, a priori, not overly decisive in the international context, but intimately linked in political issues, with a well-stablished bilateral institutional relationship, and with a strong commercial partnership and cooperation. The strong and enriching cooperation is embodied by the increasing investments of Spain in several large infrastructure projects developed in Poland and also in the financial sector [
9]. On the one hand, this research studies one of the European countries most affected by the global financial crisis, that is, the Spanish stock market. On the other hand, this study analyzes an emerging market and a new EU member with its own currency, that is, the Polish stock market. This decision aims to reach relevant conclusions and implications potentially extrapolated to countries with similar profiles to them. In addition, the rest of the countries included in our analysis are international reference stock markets of different economic areas, that is, Germany, the UK, the US, and China. The fact that this research focuses on two countries such as Spain and Poland could lead to very interesting conclusions, showing a different situation of a country with an emerging economy and not belonging to the Eurozone (Poland), from a country that belongs to this zone (Spain).
Second, unlike previous studies that use alternative methodologies to explore the interdependencies between international stock markets, this paper proposes to apply a NARDL methodology. In concrete, unlike most of the previous literature that analyzes the direction of the contagion effect between financial markets by using a GARCH framework, such as [
10,
11], to the best of our knowledge, our research is the first study that applies the NARDL approach to estimate both long-run and short-run asymmetries [
12,
13,
14] between the Polish and the Spanish stock market returns and some other relevant and international stock market returns. Finally, for robustness, this study compares estimates in different stages of the economy. Therefore, this paper studies whether the connectedness between these international stock markets varies under bullish, normal, and bearish markets, splitting the whole sample period into three different sub-periods.
Therefore, the advantage of the study is the extension of the research methods by NARDL, which is probably the first application in this kind of research. Thanks to that the nature of asymmetry of financial markets may be more accurately diagnosed. In addition, the subject of the research should also be considered interesting—two countries belonging to the European Union, but with the different financial and economic situation. As the results of the research obtained here show, the economies of these countries reacted differently to the crisis of 2008.
The remainder of this paper is organized as follows:
Section 2 presents a brief overview of the literature about integration and interdependencies between financial markets, financial crises, the contagion effect, and the methodologies used in similar studies.
Section 3 is divided into two sub-sections, where the
Section 3.1. outlines the data description and the sub-
Section 3.2. explains the methodology and analysis carried out in this paper. In the
Section 4 some preliminary results of the study are presented and the NARDL analysis is described. Finally,
Section 5 contains with conclusions and remarks based on the whole study performed.
2. Literature Review
The phenomenon of integration and its effects on global stock markets has been observed and documented for over three decades now, among others in the papers [
15,
16,
17,
18]. Since the seminal work [
19], there is a growing literature that studies the existence and the way in which shocks are transmitted across financial markets.
Regarding this topic, Reference [
1] started a fierce discussion about how contagion on the international stock market should be defined. One of the definitions says that contagion occurs when one market transmits its shock to another market. Moreover, it is closely related with a prominent increase in cross-market correlation, whereas volatility notes the increase, which in turn is related to the occurrence of turmoil in the economy.
Attention was also drawn to the fact that, in any case, during the crisis, there is a domino effect, and that no country is completely independent of macroeconomic developments in other countries (see, among others, [
2]). Consequently, the problems of a given country or group of countries in each region increasing their links with international markets in times of crisis, leading to a fall in share prices on all stock exchange markets. The stronger these links, the lower the risk diversification capability, which means that in times of market uncertainty, the principle of risk reduction through investing in different markets does not apply. The research carried out by Mink [
3] shows that in a period of calm (i.e., moments in which there are no extraordinary events, such as problems of states with public debt or bankruptcies) correlations between financial markets are weak. At the time when prices suddenly drop significantly, the correlation increases. The result is a gradual contagion of successive markets.
Another fact is that, during the bear market, the relationship between markets is stronger. However, in the stabilization period, as well as increases in correlations between individual markets, these connections are lower. The financial crisis of 2008 particularly infected highly developed countries such as Germany and Great Britain. Equity markets in these countries recorded price drops almost at the same time, indicating only a strong connection between them (see, e.g., [
3,
15]).
In this context, the financial crisis of 2007 to 2009 represents the major episode of a global crisis since the Great Depression of 1929–1939. It has focused the attention of academics, researchers, and policymakers in the more recent literature, and has provided an ideal setting in which to analyze the ways and sources of contagion from one market to another. The evidence found shows that the global financial crisis spread rapidly to almost all the markets over the world with large drops in the stocks traded. There is a vast literature that studies the effect of the global financial crisis on developed markets. Claessens et al. Ref. [
20] studied the factors that help to explain the spread of the crisis to a group of 58 advanced and emerging economies. They found strategical factors that should be monitored in order to reduce or mitigate cross-border spillovers. Samarakoon Ref. [
16] examined frontier and also emerging stock markets and found evidence of contagion for the former. Focusing on the banking sector, Eichengreen et al. Ref. [
21] analyzed the effects of the crisis on main European advanced countries, concluding that common factor in CDS spreads, that where present even in normal times, increases rapidly during the first stages of the crisis, causing the subsequent deterioration on the interconnected international banks and hence their economies. Bekaert et al. Ref. [
17] analyzed how the financial crisis transmitted to 415 country-industry equity portfolios. They find evidence of contagion although the impact found is small.
On the other hand, in the context of emerging countries, one of the first publications was Dooley and Hutchison [
22], who analyzed the transmission of the global financial crisis to a set of fourteen emerging markets (Argentina, Brazil, Chile, Colombia, Mexico, China, South Korea, Malaysia, Czech Republic, Poland, Hungary, Russia, South Africa, and Turkey) between 1 January 2007 and 19 February 2009. They find a large and statistically significant impact of the global financial crisis on the markets analyzed. Other authors such as [
23] examined in their article the effects on stock markets caused by the 2008 crisis. They based their research on the US and seven emerging markets of Central and Eastern Europe and find evidence of contagion. A similar article is Dimitriou et al. [
24], who investigated the contagion effects of the global crisis on the five BRICS emerging equity markets (Brazil, Russia, India, China, and South Africa), and the US during the period 1997–2012. In this case, the authors find the existence of a contagion effect in most of the markets included in the analysis only after the Lehman Brothers collapse, not during the first stages of the crisis. Reference [
25] examined spillover effects of the global crisis on five emerging markets and found evidence of contagion around the Lehman Brothers’ collapse in September 2008. More recently, Reference [
26] analyzed the degree of financial cointegration and the impact of the global crisis on the US and six Asian markets (India, China, Pakistan, Malaysia, Russia, and Korea). They found that there was long-term cointegration between the markets analyzed, and that the degree of cointegration among markets increased after the crisis.
Although most of the studies on contagion are mainly focused on developed and emerging markets rather than in developing markets, we can find in the standing literature other studies based on Eastern European countries. The first publications focusing on the degree of financial integration between Central and Eastern European countries were based on countries such as the Czech Republic, Poland, Russia, and Slovakia. References [
27,
28], among others, examined the long-term relations between the above-mentioned countries and the shares’ markets of economically developed countries (such as Germany, Great Britain, Switzerland, and Italy). Their research showed that among the least-developed countries from the Central and Eastern Europe block, only Poland showed a trend for orders for the global portfolio. Other authors such as Dajčman et al. Ref. [
29] examined co-movements between four developed European (Austria, France, Germany, and the UK) and three developing CEE (Slovenia, Czech Republic, and Hungary) stock markets. They found that the developed markets are more independent in the analyzed period than the developing markets. In addition, they explored the impact of different episodes of crises and found that the global financial crisis had the greatest and the most durable impact.
Moore Ref. [
4] examined the influence that the accession to the European Union had on the relationship between the stock indices of the Eastern European countries of Czech Republic, Poland, Hungary, and Slovakia. His research shows that the returns between these countries correlate during the post-accession period, and outside Slovakia, the opportunities for diversification in Central and Eastern Europe have decreased after the accession of the European area. Reference [
5] presents a study of the degree of integration of market shares outside the monetary union with burdens on the eurozone supported this study.
One of the first works that specifically included data from the Polish stock exchange market was an article by Brzeszczyński and Welfe Ref. [
30]. Their empirical results indicated that there was a linkage between the return rates of the WIG index and the rates of return of other global stock exchange indices.
Regarding the methodology, correlation coefficients have long been used as a measure of contagion in the academic literature, therefore many researchers use the correlation breakdown approach to measure financial contagion. Studies based on this methodology lead to the conclusion that a statistically significant increase in the correlation between markets is an indicator of contagion (see, e.g., [
1,
10,
31,
32]). The GARCH model approach [
33,
34], the DCC-GARCH model [
35,
36], the DCC-MGARCH model [
11], the spillover index approach proposed by [
37,
38,
39], the TVP-VAR approach [
18], and the quantile cross-spectral analysis proposed by [
40,
41] have also been applied to study the transmission of contagion from one market to another.
In this context, to capture both long- and short-run asymmetries between the Polish and Spanish stock market returns and some relevant international stock market returns, an asymmetric nonlinear cointegration approach (NARDL) is applied. This methodology has been used in some previous studies. References [
12,
13,
14] analyze the sensitivity of the Spanish stock market returns to variations in nominal interest rates and their main components (level, slope, and curvature), as well as study the connectedness between Bitcoin and gold price returns using the NARDL approach. Other authors such as References [
42,
43,
44] focus on renewable and environmental sustainability issues to quantify the asymmetric relationship between sustainability-related variables and other macroeconomic variables through the using of the NARDL methodology. In our research, we find a positive and statistically significant connectedness between the Polish and Spanish stock markets and the rest of international stock market returns regardless the period analyzed and data frequency used.
Thus, to the best of our knowledge, our paper contributes to the previous literature by studying in depth the expected non-linear interdependencies between relevant international stock markets, focusing on the Polish and the Spanish stock market. To that end, this research applies a NARDL approach to estimate both long- and short-run asymmetries ([
12,
13,
14,
45]), not only for the whole sample period, but also for different sub-periods. This methodology allows us to simultaneously check long- and short-run nonlinearities by estimating positive and negative partial sum decompositions of the regressors. Moreover, by applying this method, we can estimate the responses to positive and negative shocks of the regressors from the asymmetric dynamic multipliers.
3. Data and Methodology
3.1. Data
The database used in the research conducted in this paper includes monthly closing prices of the stock indexes from the markets in US, China, Great Britain, Germany, Spain, and Poland. The data has been retrieved from the stooq.pl website. We set the closing price of the last day of the month as the monthly price, based on which the monthly rates of return were determined. In concrete, we obtain monthly log returns using consecutive monthly closing prices of each stock market.
The test in which the parameters of the models have been carried out contain data from January 1998 to December 2018, i.e., 252 monthly prices from which we obtain 251 monthly returns. The main period was divided into three sub-periods to calculate the correlation between global markets during the bear market and the bull market. The split was determined based on the shocks in the financial markets over this period, which frame the first of the three periods from January 1998 to December 2001 and presents the bull markets of the nineties that ended with the dotcom bubble boom. The second period includes data from December 2001 to December 2009 and shows the bear market trends mostly during the global financial crisis. The third period covers data from December 2009 to December 2018—the bull market. A similar way of division of the periods was used in [
46] where sub-periods of the analysis were divided according to the shocks occurring in certain moment of time on the financial market. In this way, the test was framed by the Asian financial crisis that took place from 20 October 1997 to 30 January 1998, the Russian bond default and LTCM crisis, first dated between 17 August 1998 to 31 December 1998, the second: 23 September 1998 to 15 October 1998, followed by the Brazilian crisis (7 January 1999 to 25 February 1999), the dot-com crisis (28 February 2000 to 7 June 2000) and the Argentinian crisis (11 October 2001 to 30 June 2002). The research included also the sub-prime crisis (26 July 2007 to 14 September 2008), the great recession (from 15 September 2008 to 31 December 2009), and as the last one the European debt crisis that was dated from 1 January 2010 to 31 January 2013. In order to date all the crisis periods Reference [
46] applied a regime switching model.
The research hold in this paper involves a database of six stock exchange indices from six world markets: China, Germany, Spain, United Kingdom, US and Poland. The following indices have been used: the DAX-30 from the German market, the American S&P 500, the IBEX-35 from the Spanish stock exchange, the polish WIG20, the FTSE from the Great Britain market and the SSE Composite from China.
The IBEX-35 is a Spanish exchange index grouping 35 of the largest and most liquid public companies listed on the Madrid Stock Exchange. The polish stock exchange index WIG20 consists of 20 largest joint-stock companies listed on the Warsaw Stock Exchange. There cannot be more than five companies listed in one sector under WIG20. Investment funds are not listed in it.
The DAX-30 Index (Deutscher Aktienindex) is the most important German stock index. It consists of 30 companies and is called a Performance index, which means that it considers not only the increase in stock prices, but also the increase in capital through the payment of dividends. The Standard and Poor’s 500 Index (S&P 500) is one of the most important American stock exchange indices. It includes 500 companies with the largest capitalization, listed on the New York Stock Exchange and NASDAQ. The Financial Times Stock Exchange (FTSE 100) Index is a British stock index of companies listed on the London Stock Exchange. The index includes the 100 largest companies that meet liquidities, and capitalization requirements, among others. The FTSE index is considered as the barometer of the British economy. In addition to the DAX-30 index, it is one of the largest stock exchange indices in Europe. The SSE Composite Index is a Chinese whole market index that covers all listed stocks from all companies in the Shanghai Stock Exchange.
3.2. Methodology
This research focuses on the analysis of the connectedness between the Polish and the Spanish stock market returns with some relevant international stock market returns using an asymmetric nonlinear cointegration approach (NARDL) in order to capture both long-run and short-run asymmetries [
12,
13,
14,
47,
48].
According to [
12,
13,
14], among many others, previous financial literature usually uses techniques such as OLS, SUR, QR, cointegration and Granger causality, among others. Some of them estimate long- and short-run interactions, but they assume symmetric relations. So, these previous approaches cannot show potential asymmetries. Nevertheless, there are some methodologies, such as the nonlinear ARDL cointegration approach (NARDL) [
49], which is an asymmetric extension to the well-known ARDL model of [
47,
48], and it enables us to estimate both long-run and short-run asymmetries.
Jareño et al., González et al. and Arize et al. References [
12,
13,
14,
50] explain some advantages of the NARDL approach. First, this methodology shows good small sample properties, so it is suitable regardless of the stationarity of the variables. In addition, this approach provides not only short- but also long-run estimates of the connectedness between variables. Furthermore, the NARDL model is not likely to produce omitted lag bias.
The NARDL technique is an asymmetric extension to the well-known linear autoregressive distributed lag (ARDL) bounds testing technique of [
48]. According to [
12,
13,
14], this approach does simultaneously estimate long- and short-run nonlinearities, including positive and negative partial sum decompositions of the regressors. Thus, the NARDL methodology may measure isolated responses to positive and negative shocks of the regressors from the asymmetric dynamic multipliers.
The asymmetric long-run equation of international stock market returns [
12,
13,
14,
49] on the Polish and the Spanish stock market returns is as follows:
where
Rjt is the Polish and Spanish stock market returns corresponding to period
t,
SMRt+ and
SMRt− are partial sums of positive and negative changes in some relevant international (American, German, British, Chinese –and Spanish-) stock market returns,
εjt is a random disturbance and
α = (
α0,
α1,
α2) is a vector of long-run parameters to be estimated.
Later, the long-run relation between the Polish and Spanish stock market returns and increases in some relevant international stock market returns is α1, and α2 explores the long-run relation between the Polish and Spanish stock market returns and decreases in some relevant international stock market returns. Finally, we study whether the long-run relation would reflect asymmetric long-run international stock market returns passthrough to the Polish and Spanish stock market returns.
According to [
12,
13,
14,
47,
48,
49], connectedness between the Polish and Spanish stock market returns with some relevant international stock market returns can be exposed in an NARDL framework as follows:
where
β0 is the independent parameter,
ϕi is the autoregressive parameter,
p and
q are lag orders and
α1 = −
β2/
β1,
α2 = −
β3/
β1, the aforementioned long-run impacts of respectively international stock market returns’ increase and decrease on the Polish and Spanish stock market returns.
and measures the short-run influences of increases and decreases (respectively) of international stock market returns on the Polish and Spanish stock market returns. Hence, not only the asymmetric long-run relation is captured, but the asymmetric short-run influences of them also considered.
Finally, empirical implementation of the nonlinear ARDL approach involves [
12,
13,
14,
51], first, to conduct classical unit root tests (ADF, PP and KPSS) in order to confirm that the variables are I(0) or I(1), because the presence of an I(2) variable renders the computed F-statistics for testing cointegration invalid. Second, we create positive and negative series of our relevant explanatory variable (international stock market returns) to study potential asymmetric and nonlinear relationships. Third, we run/estimate the NARDL model using stepwise regression under ECM (Error Correction Model). Fourth, based on the estimated NARDL, we test for the presence of cointegration among the variables using a bound testing approach of [
48,
49]. Finally, with the presence of cointegration, we analyze long-run and short-run asymmetries in the relations between international stock market returns and the Polish and Spanish stock market returns.
4. Results and Discussion
4.1. Preliminary Results
This section presents the results of the empirical examinations conducted in this paper according to the above-mentioned steps of calculations.
Based on the conducted research of the monthly change in the direction of the indices, it is observed that each of the financial markets corresponds to a greater or lesser extent to the shocks occurring on the financial market. The main descriptive statistics values for monthly change in a closing price are presented in
Table 1 and the results are also shown graphically in
Figure 1.
According to the study the highest mean value for changes in price closing is represented by WIG20 with 0.0055, on the other hand the lowest one appears by IBEX-35 at only 0.0003. The rest of the stock indices recorded the following outcomes: FTSE-100 0.0051, S&P 500 0.0037, DAX-30 0.0034 and SSE Composite 0.0028.
As regards the standard deviation, SSE Composite and WIG20 show higher values than FTSE-100 and S&P 500. All variables included in our study show negative skewness and excess kurtosis. Finally, the standard unit root (Augmented Dickey–Fuller (ADF) and Phillips–Perron (PP)) and stationarity (Kwiatkowski–Phillips–Schmidt–Shin (KPSS)) tests confirm that all variables are stationary.
The results of the Pearson coefficients of correlation between markets over the entire period (1998–2018), with values varying from 24% to 78%, proves to be statistically significant for all analyzed indices (
Table 2). A brief deviation is visible only in the case of the interdependence between the Chinese SSE Composite index and the Spanish IBEX-35.
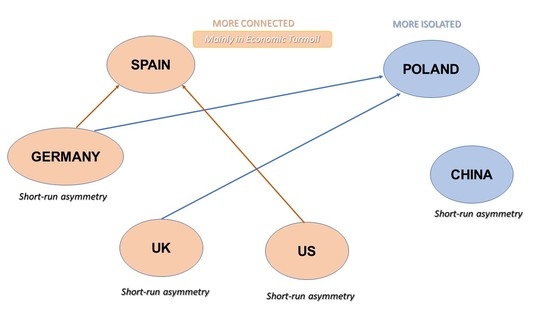
Based on the research, the level of correlation in this period is significantly high for most of the examined indices, except for the Chinese SSE Composite index, which did not show strong links with the rest of the stock markets although its correlation coefficient is statistically significant. The highest level of correlation in the entire analyzed period occurs between the German DAX-30 index and the American S&P 500 index, with the outcome of 0.784306. The German financial market is therefore the most correlated with the USA market among the rest of the European stock indices. This finding indicates that for a given sample, shocks across the ocean affect European financial markets through the German market. Inside the European continent, on the analyzed sample in the given period, the largest interdependencies occur between the German DAX-30 index, and the Spanish IBEX-35 (0.769595), and between the SAX-30 and the British FTSE-100 (0.757086). The Chinese financial market shows the strongest link to the Polish WIG20 index, giving a correlation outcome of 0.302023. This result indicates that the Polish market is the most closely related market from the sample to the Chinese market. However, the level of interrelations between them is still weak.
Due to the vulnerability of financial markets to episodes of crises, that was demonstrated earlier in the study of monthly changes in direction of indices prices, the general period was divided into three sub-periods in order to obtain a more detailed analysis. The results for each sub-period are displayed on
Table 3.
The first sub-period covers the period of bear market caused by the dotcom crisis, dated back to 1998–2001. During this period on the stock exchanges around the world appeared euphoria related to Information Technology (IT) companies and related sectors.
A characteristic feature of this crisis was the overestimation of companies that were active on the Internet or were going to start it, which significantly influenced stock markets.
In this sub-period, the Chinese financial market did not show statistical significance.
The Polish Stock Exchange at that time was very volatile, bearing in mind that it was opened in 1991, summing the local political situation and the current economic problems of the country. During this period, significant drops in share prices were recorded, however, they do not seem to have been directly related to the dotcom crisis. The strongest correlation with the Polish WIG20 in this period was the American S&P 500 (0.594465).
Strong interdependencies occurred between the German DAX-30 and the Spanish IBEX-35 (0.777752), the American S&P 500 and the British FTSE-100 (0.717304). Equally strong correlation showed IBEX-35 and FTSE-100 (0.708156).
The second sub-period frames from December 2001 to December 2009 and covers another bear market period mainly caused by the 2008 crisis. The outcomes for the Chinese financial stock market continued to show no statistical significance, although its level of correlation increased minimally compared to the first sub-period.
The level of correlation between the markets has increased significantly due to the turmoil on the financial market. The crash that took place on September 2008 on the American stock market when Lehman Brothers collapsed echoed in all financial markets. The highest level of correlation was recorded between the American S&P 500 and the German DAX30 (0.873219) and between the Spanish IBEX-35 and the German stock exchange (0.872291). A significant increase in interdependencies between financial markets has boosted on the Polish financial market. Here, the level of correlation was observed in relation to S&P 500 by 0.728254 and to FTSE-100 by 0.723840. This change was influenced by several factors, including Poland’s accession to the European Union in 2004, which increased the level of integration with other financial markets, consequently, also the response of the Polish stock exchange to the turmoil occurring on international markets.
The third sub-period covers the period of bull market, ranging from December 2009 to December 2018. All indices examined showed statistical significance, except for the Chinese and Spanish markets interdependencies.
The results presented that the high level of correlations persisted after the financial crisis. The relationships between stock exchanges strengthened due to the sharp fall in prices during the 2008 crisis, the domino effect that this entailed, and the general weakening caused by this event. The highest correlation was recorded between the German DAX30 and the British FTSE-100 (0.740567). The Polish market has also maintained a high level of interdependence. The situation on the Chinese stock exchange is noteworthy. The level of correlation increased significantly compared to the two previous sub-periods. Interdependence increased especially in relation to the American S&P 500 (0.422570) and the German DAX30 (0.400808).
4.2. Main Results
This section shows results of the non-linear ARDL estimation and collects long- and short-run relations between the Polish and Spanish stock market returns and some relevant and international stock market returns for the whole sample period and later for three different sub-periods. Furthermore, it shows the cointegration and asymmetry tests. Moreover, in the NARDL estimation, the maximum lag order considered is 4.
First,
Table 4 shows the Pearson’s correlation coefficients between the Polish and Spanish stock market returns and the most relevant international stock market returns. This measure would be considered as a first approach to study the connectedness between them. Thus, a positive and statistically significant relation is observed in all cases. The American and British stock market returns would be the most relevant markets for the Polish stock market. In the case of the Spanish stock market, the German market is the most important stock market.
For in-depth analysis,
Table 4 shows long-run relations between the Polish and Spanish stock market returns and some relevant and international stock market returns for the whole sample period. The bounds F-statistics show long-run relations, that is cointegration, between the Polish and Spanish stock market returns and changes in the most relevant international stock markets. Thus, we only find cointegration, that is long-run connectedness, between the Polish stock market returns and the German and British stock market returns. These long-run coefficients of changes in the German and British stock market returns are positive and statistically significant at 5% significance level.
Regarding the long-run elasticities for SMRt−i+ (the cumulative sum of positive changes in the most relevant international stock market returns) and SMRt−i− (the cumulative sum of negative changes in the selected international stock market returns), the Polish stock market returns would respond in the same way to positive and negative changes in the stock market returns for the US, Germany, Great Britain, China, and Spain. However, these long-run elasticities are negative and statistically significant for the German and Spanish stock markets. For the Spanish stock market, long-run elasticities are also virtually the same to positive and negative changes in the American, German, and Chinese stock markets. Nevertheless, estimates for long-run elasticities to changes in the British stock market returns are substantially different. Thus, a 10% increase in the British stock market returns is related to the decrease in the Spanish stock market returns by about 12.3%. However, a 10% decrease in the British stock market returns leads to a 17.7% increase in the Spanish stock market returns. Clearly, the Spanish stock market returns response more to negative than positive changes in the British stock market returns.
On the other hand, the long-run symmetry can be tested by means of a Wald test. Thus, in the long-run, our results indicate a similar intensity of positive and negative effects in all cases for the Polish and Spanish stock market returns. So, the null hypothesis of long-run symmetry is not rejected. As regards the short-run dynamics, it is also interesting to test for symmetry. In concrete, the strong form would imply that γi+ = γi−. Our estimates confirm that the null hypothesis of short-run symmetry is rejected for the Polish and the Spanish stock market returns to changes in all the relevant international stock market returns. Therefore, there is strong evidence of asymmetric short-run responses in both stock markets. Thus, nonlinear asymmetries are relevant to study the relationship between the Polish and Spanish stock market returns and the selected international stock market returns.
In line with references [
12,
13,
14], among others, there would be a statistically significant effect of the cumulative sum of positive and negative changes in the most relevant international stock market returns and the short-run impacts of increases and decreases of these returns in some scenarios. In addition, the sign of these effects is always positive for the Polish stock market to increases of the international stock market returns. Specifically, this positive and statistically significant effect of the cumulative sum of positive changes in the most relevant international stock market returns is found in the German (for 1-, 2- and 4-lags) and British (for 1- and 3-lags) case. Furthermore, for the Spanish market, the effect of the cumulative sum of positive changes in the international stock markets is statistically significant, in concrete, with negative sign for the German stock market (for 3-lags) and positive sign for the American (for 1-lag) and German stock markets (for 4-lags). In addition, we find a negative and statistically significant effect of the cumulative sum of negative changes in the British stock market returns for 1- lag. Thus, we observe a higher persistence in the effect of changes in the German stock market returns on the Polish and Spanish stock market returns. Finally, the explanatory power of the NARDL model measured by the adjusted R
2 varies from 12.07% and 10.14% to changes in the Chinese stock market returns (in the Polish and Spanish stock market returns, respectively) to more than 42% and 61% to changes in the German stock market returns (for the Polish and Spanish stock market returns, respectively).
4.3. Robustness Checks
For robustness, this sub-section splits the whole sample period into three different sub-periods: the first sub-period, between January 1998 and December 2001 (
Table 5), the second sub-period, between January 2002 and December 2009 (
Table 6), and, finally, the third sub-period, between January 2010 and December 2018 (
Table 7). As previously commented,
Table 5,
Table 6 and
Table 7 shows the Pearson’s correlation coefficients, and short- and long-run relations between the Polish and Spanish stock market returns and some relevant and international stock market returns.
First, positive and statistically significant relation is observed in all cases, except for the connectedness between the Spanish and the Chinese stock markets during the first sub-period (1998–2001). The most relevant market for the Polish stock market may be the American market in the first and second sub-period. However, the British and the Spanish stock markets would show a similar relevance as the American market in the second sub-period. Finally, during the third sub-period, the most relevant stock market would be the British market. For the Spanish stock market, the German market is the most important stock market in the three sub-periods, but the American stock market returns would show similar relevance as the German market during the second sub-period. In all cases, the least relevant market is the Chinese stock market. As in the whole sample period, the bounds F-statistics show long-run relations, that is cointegration, between the Polish and Spanish stock market returns and changes in the most relevant international stock markets. Thus, we mainly find long-run connectedness (cointegration) between the Polish stock market returns and the rest of international stock market returns during the second sub-period (2002–2009) which includes the early years of the recent global financial crisis. Thus, all these long-run connections are positive and statistically significant in the following cases: for the Polish stock market, the American, German and British markets, and for the Spanish stock market, the American and Chinese markets. During the rest of sub-periods, we only find positive and statistically significant long-run relations between the Polish and the Chinese stock markets during the first sub-period and the Spanish and the German Stock markets during the third sub-period.
Regarding the long-run elasticities for SMRt−i+ (the cumulative sum of positive changes in the most relevant international stock market returns) and SMRt−i− (the cumulative sum of negative changes in the selected international stock market returns), the Polish stock market returns would respond in the same way to positive and negative changes in the stock market returns for the Germany and Spain in all sub-periods. In concrete, for the rest of international stock markets and sub-periods, during the first sub-period, these long-run elasticities are negative and statistically significant for the British and Chinese stock markets, and during the second sub-period, for the US. For the Spanish stock market, long-run elasticities are also virtually the same to positive and negative changes to fluctuations in the American, British, and Chinese stock markets for all the sub-periods. Nevertheless, estimates for long-run elasticities to changes in the German stock market returns are substantially different for the second and third sub-periods. Thus, during the second sub-period, a 10% increase in the German stock market returns is related to the increase in the Spanish stock market returns by about 11.5%. However, a 10% decrease in the German stock market returns leads to a 13.4% decrease in the Spanish stock market returns. The Spanish stock market returns would slightly response more to negative than positive changes in the German stock market returns. A similar difference is found during the third sub-period.
Furthermore, the long-run symmetry of positive and negative effects—tested by a Wald test—is confirmed in all cases for the Polish and Spanish stock market returns. So, the null hypothesis of long-run symmetry is not rejected, with the only exception of the connectedness between the Polish and the Chinese stock markets during the first sub-period. As regards the short-run dynamics, our estimates confirm that the null hypothesis of short-run symmetry can be rejected for the Polish and the Spanish stock market returns to changes in all the relevant international stock market returns and for all sub-periods. Therefore, there is strong evidence of nonlinear asymmetries when studying the connectedness between the Polish and Spanish stock market returns and the rest of relevant international stock market returns.
As previously found in the whole sample period, there would be a statistically significant effect of the cumulative sum of positive and negative changes in the most relevant international stock market returns and the short-run impacts of increases and decreases of these returns in some circumstances. In addition, the sign of these effects is commonly positive for the Polish stock market to increases of the international stock market returns with some exceptions for the German market in the first sub-period (for 3-lags) and for the Chinese market in the third sub-period (for 1-lag). Specifically, this statistically significant effect of the cumulative sum of positive changes in the international stock market returns for 1-, 2-, 3- and/or 4-lags is found in all scenarios, except for the British stock market in the first sub-period, the Chinese stock market in the second sub-period and, finally, the American and British stock markets in the third sub-period. Furthermore, we find statistically significant effects of decreases of the relevant international stock market returns on the Polish stock market returns in all scenarios, except for the British market in the first and second sub-periods and the Chinese market in the third sub-period. In addition, the sign of these connections is mainly positive in the second and third sub-periods and inconclusive in the first sub-period.
Regarding the Spanish market, the effect of the cumulative sum of positive changes in the international stock markets is statistically significant for 1-, 2-, 3- and/or 4- lags with inconclusive sign for the American and German stock markets in most periods, with negative sign for the Chinese stock market during the second sub-period, and, finally, with positive sign for the British stock market in the third sub-period. In addition, we find a negative and statistically significant effect of the cumulative sum of negative changes in the American, German, and Chinese stock markets during the first sub-period, the German market in the second sub-period and the British and Chinese stock markets for the third sub-period. During the second sub-period, we find a positive and statistically significant effect of decreases in the British and Chinese stock market returns and negative effect of negative changes in the German stock market returns. Thus, we observe a higher persistence in the effect of changes in all the international stock market returns on the Polish and Spanish stock market returns. Finally, the explanatory power of the NARDL model measured by the adjusted R2 varies from 17.99% and 13.96% to changes in the Chinese stock market returns (in the Polish and Spanish stock market returns, respectively) to about 57% to changes in the American stock market returns for the Polish market, and 77.56% to variations in the German stock market for the Spanish market, both during the second sub-period. This result reinforces the idea of the importance of analysing the entire sample period by sub-periods, highlighting the relevance that the recent global financial crisis has had on the interdependencies identified between the international financial markets analyzed in this research.
5. Concluding Remarks
The empirical analysis conducted in this paper studies the level of non-linear interdependencies in a NARDL framework between the polish WIG20 and the IBEX-35 from the Spanish stock exchange, and some relevant international stock markets, such as the DAX-30 from the German market, the American S&P 500, the FTSE from the Great Britain market and the SSE Composite from China. Our sample covers the period between 1998 and 2018, with an emphasis on the 2008 Financial Crisis.
The analysis is performed in several steps and beyond the methodological contribution of the empirical analysis, all of them are noteworthy. To the best of our knowledge, this is the first time that a study explores the co-movement between the Polish and the Spanish stock market returns with some relevant international stock market returns, by using the NARDL approach to evaluate simultaneously both long- and short-run asymmetries.
Firstly, the analysis of the general situation for all the financial markets is conducted by calculation of correlation level between them, firstly as a general view and later applying the sub-periods of bull and bear market. From a general point of view, the German, British, Spanish, and American markets are highly correlated. Moreover, the Chinese and Polish financial markets show a protrusive level of correlation.
Secondly, taking into consideration the sub-periodical view on the situation, it is clearly to see that in the event of a crisis the correlation level between the stock markets tend to increase. Most of all the study indicates a significant boost in the correlation level of SSE Composite and WIG20, which suggest that in an event of turmoil on the financial markets there is a tendency of narrowing the interrelations between them. What is more, after the financial crisis (December 2009 to December 2018) the situation between the markets remains stable, showing the moderate correlation level.
Thirdly, a more precise approach is conducted, applying in the study a NARDL model. This analysis studies the long- and short-run connectedness between the financial markets, paying special attention to the Polish and Spanish markets. It is crucial to point out that the Financial Crisis from 2008 makes a turn in the situation on the stock exchange. Thus, for robustness, the whole sample period is broken into three different sub-periods, in order to explore significant differences depending on the stage of the economy.
At the epicenter of the global financial crisis, there appear heroic attempts to “rescue” the financial situation that seems to be rather out of control. Furthermore, this try turned out to introduce any good, but only to multiply already existing problems, what confirms that increased uncertainty, bank panic and the behaviors of stock investors have a significant impact on the direction, nature, strength and pace of changes on the financial markets. Therefore, because of those events, interesting co-movements between international stock market returns may appear.
Thus, on the one hand, the Wald F-test for the presence of cointegration confirms the existence of positive and statistically significant long-run coefficients of changes in the German and British stock market returns on the Polish stock market returns at 5% significance level, mainly in the whole sample and in the second sub-period, which includes the early years of the recent global financial crisis. For the Spanish stock market, the German DAX-30 is the most relevant market for the whole sample period and the third sub-period. However, during the second sub-period, positive and statistically significant long-run connections are observed between the Spanish and the American stock market returns. Furthermore, the cointegration equation shows the long-run elasticities between the Polish and the Spanish stock markets with the rest of international stock markets analyzed in this research. These results confirm that the Polish and the Spanish stock market returns may respond in the same way to positive and negative changes in the relevant international stock market returns, with some exceptions for the Spanish stock market.
On the other hand, the Wald test confirms the null hypothesis of the long-run symmetry but there would be strong evidence of asymmetry in the short-run impact of changes in the American, British, German, and Chinese stock market returns on the Polish and the Spanish stock markets in all periods. In general, there is a positive as well as a negative and statistically significant effect of the cumulative sum of positive and negative changes in the international stock market returns on the Polish and the Spanish stock markets, mainly in the second sub-period that includes the recent global financial crisis. Therefore, we observe a high persistence in the effect of changes in all the international stock market returns on the Polish and Spanish stock market returns. Finally, the explanatory power of the NARLD models proposed in this research would be low to changes in the Chinese stock market returns, but they may explain more than 50%, mainly to variations in the American and German stock market returns.
Overall, from our results, we found several important managerial and economic implications. First, our results are of interest for market participants (portfolio managers, financial intermediaries, portfolio holders and investors), because relevant interdependencies between the Polish and the Spanish markets with other international markets may influence in their investment decisions to implement efficient portfolio strategies and effective risk management. Second, our results are also important for policymakers who aim to implement the more appropriate policy measures that tend to avoid potential adverse effects derived from the reduction of diversification benefits derived from the increasing interdependencies among markets. Moreover, the results obtained, and the conclusions reached, would be potentially extrapolated to countries with similar profiles to the Polish (partially isolated economy with its own currency) and the Spanish (economy quite affected by global financial crises) stock markets. Finally, our future research could consist of analyzing co-movements in terms of volatility between international financial markets, because of its relevance on applying profitable investment strategies. Moreover, it would be interesting to deep the interpretation of the reasons for obtaining such and no other results. Thus, such extended conclusions and interpretation of their determinants may be a recommendation for further research lines.


