Article

Fuzzy Set Models for Economic Resilience Estimation

1
International Academy of Ecology Human Security and Nature Sciences (IAELPS) and LLC «C-FINANCE», 198207 St. Petersburg, Russia
2
Graduate School of Economics and Technologies, Peter the Great St. Petersburg Polytechnic University, 195251 St. Petersburg, Russia
*
Author to whom correspondence should be addressed.
Mathematics 2020, 8(9), 1516; https://doi.org/10.3390/math8091516
Submission received: 15 August 2020 / Revised: 29 August 2020 / Accepted: 1 September 2020 / Published: 4 September 2020
(This article belongs to the Special Issue Mathematical and Instrumental Methods in the Digital Economy)

Abstract

:
(1) Presented models are proposed for analyzing the resilience of an economic system in a framework of a 4 × 6 matrix, the core of which is a balanced scorecard (BSC). Matrix rows present strategic perspectives, matrix columns present strategic maps. (2) Resilience assessment models are based on fuzzy logic and soft computing, combined with systemic-cybernetic approaches to building presented models. The simplest models are Zadeh linguistic variables that describe key performance indicators (KPIs). The BSC model is an acyclic graph with fuzzy links that are calibrated based on special rules. The information obtained during the simulation is aggregated through a matrix aggregate calculator (MAC). (3) The BSC model was used to assess the economic resilience of a small electrical enterprise in Russia, numbering 2000 people with revenue of approximately 100 million euros per year. The BSC model included about 70 KPIs and 200 fuzzy links. Also, the presented MAC model was applied to obtain linguistic classifiers in five basic industries, using the example of a comparative analysis of 82 international industrial companies. (4) The proposed models allow not only to describe the economic system and its external environment, but also solutions aimed at increasing resilience, within the unified framework.

1. Introduction

The modern conditions for the functioning of enterprises are extremely challenging. As the experience of companies’ survival in the conditions of COVID-19 has shown, special efforts must be made to maintain a stable level of the company in the face of breaking economic ties, temporarily excluding carriers of key competencies from business, and the impossibility of doing business in traditional formats. All decisions of the top management of business, on the one hand, are surrounded by uncertainty, and, on the other hand, require a quick and adequate response to changing circumstances. Therefore, management should be able to receive timely and high-quality advice regarding the operational decisions it makes. In this part, a manager can be greatly helped by adequate mathematical business models and knowledge that can be extracted in the course of intelligent processing of large data sets. The models and methods of sustainability proposed in this work can be successfully integrated into corporate information systems operating in companies and into expert intelligent systems that support decisions in conditions of uncertainty.
The existing approaches to the analysis of economic sustainability operate mainly with probabilistic models for assessing the risk of bankruptcy of a company, as an integral characteristic of its sustainability. In this regard, the methods of the school of E. Altman and his followers are well known [1]. At the same time, the analysis is based mainly on the data of traditional accounting reports, which vary greatly from year to year and from country to country. Our point of view is that: (a) sustainability should be considered from the standpoint of not only risks, but also chances, as well as the efficiency of the business as a whole; (b) the volume of data involved in the analysis should be substantially supplemented by data from internal management accounting; (c) the probabilistic paradigm in the stability analysis should be adjusted in connection with the introduction of fuzzy-logical descriptions into the model, which will ensure adequate processing of limited samples with heterogeneous data.
Using the methods of linguistic classification of parameters, we are able to make qualitative judgments about the level of these parameters, in terms of the relevance of the factors under consideration to the company’s sustainability. At the same time, we take into account all the uncertainty prevailing at the time of the analysis, including the difficulties of experts in distinguishing the qualitative levels of factors. This approach makes the analysis of sustainability meaningful and flexible, allowing you to quickly identify weaknesses in the activities of companies. Management’s natural response to the problems discovered is to take adequate measures, which are often clothed in a project format. Mathematical modeling makes it possible to assess the contribution of decisions made to ensure the sustainability of companies and to determine the rational level of investment in decisions made (material, financial, human). We do not refute the value of the probabilistic approach to the analysis of sustainability, however, we draw attention to significant limitations in its application and to the low value of the results obtained in this case.
The stability of an organization, as its integral property, corresponds well with the stability of living organisms and living systems, therefore, economic systems can borrow from living systems a variety of approaches to survival, including, first of all, the ability of systems to establish homeostasis with the external environment, which, in turn, implies a wide range of adaptation tools. The task of analysis in this regard is solved by assessing the levels of strength or weakness of the adaptive mechanisms presented in the system, i.e., the level of the organization’s immunity to negative external manifestations and the level of its susceptibility to positive external challenges.
At the moment, in the modern scientific community there is no common understanding of the concept of “resilience”, which in turn determines a significant differentiation of both its interpretations and approaches to its measurement [2]. “Resilience” is a property of heterogeneous systems, both ecological and technical, and socio-economic. Primarily, this property was considered in relation to technical systems that are able to independently (without any additional external influence) achieve a state of equilibrium [3]. Consequently, the external influence promotes the activation of the internal mechanisms of the system, returning it to the state of equilibrium, and the stability itself can be considered as the speed with which the system returns to the previous state after certain external influences [4]. Under the condition of a uniform impact from the external environment, the system is able to fully and in the shortest period of time return to a state of equilibrium, which is the most stable [5]. “Resilience” as a property of ecological systems, complements the previously mentioned theses, and is considered as the ability of the system to respond to the impact from the external environment without changing its own structure, properties and functions, and the most significant research category within the ecological approach is the measurability of the force of impact from the external environment [6,7]. The scientific community also declares that the ecological system is characterized by development. Consequently, according to the results of the implementation of mechanisms for restoring equilibrium as a consequence of the impact from the external environment, the system can not only restore its structures, properties and functions, but also form new ones aimed at the subsequent more effective absorption of the impact and restoration of balance [4]. Thus, supplementing the above, environmental resilience can be understood as the ability of a system to absorb the impact from the external environment, reorganize and transform in order to preserve the original structure, properties and functions [8]. The development of the ecological approach to the definition of the concept under study is adaptive sustainability. Adaptive stability is understood as the ability of the system to respond to the impact of the external environment while maintaining the ability to effectively allocate resources [9]. Thus, adaptive stability is the ability of a system not only to restore equilibrium, but also to restore growth dynamics [10]. The considered concepts are quite universal, and do not contain descriptions of categories inherent exclusively to socio-economic systems. Based on this theoretical and methodological basis, a universal model of quantitative interpretation of the state of stability of the system can be formed, a particular case of which is the economic system [11].
Economic sustainability (economic survivability) in this work is the ability of the economic system to achieve its strategic goals in the face of challenges, both negative and positive.
This definition of resilience is highly consistent with the definition from Muller [12], where it is emphasized that the sustainability of complex systems is achieved through the synergy of efforts to ensure it in the economic, technical and organizational subsystems. In the most general case, global sustainability should be considered as a property of the technical, economic and organizational system. The detailed review of economic resilience scientific results up to now is presented in Buheji [13] and Hosseini [14].
Thus, the proposed article presents a number of mathematical methods for analyzing the economic sustainability of a company using the main results of the theory of fuzzy sets and soft computing. Depending on where the analyst is located (inside or outside the company), the methods of analysis differ significantly. Also, the methods used are significantly influenced by the level of information uncertainty that accompanies the functioning of an economic entity. This uncertainty is also subject to mathematical modeling, the approach to which is presented in this work.
Traditionally, economic resilience is considered in terms of the impact on the system of negative challenges, i.e., from the point of view of risks. At the same time, positive challenges to the same extent lead the system to a temporary loss of stability, for example, when an organization, seeking to intensify its activities, conducts a series of internal organizational changes. If these changes are large-scale, then the quantitatively assessed possibility of losing resilience by the organization is very high.
Resilience is a property that the system must provide in dynamics. Meanwhile, there are static models for resilience analysis, when the assumption is made that resilience is provided (should be provided) at the level of target indicators within a fixed period of time, considered as a whole. In this case, the moments of challenges, moments of reactions of the system to challenges and moments of decisions, localized within the same time interval, are considered as if simultaneously. Such a starting assumption is also inherent in the model presented in this issue.
When analyzing the resilience of an economic system, it is appropriate to apply system-cybernetic approaches to analysis, considering the information-signal basis for the interaction of the system with its external environment and the controlling over-system. The cybernetic model of the system contains exogenous “inputs” and system “outputs”, the information from which, entering the control over-system, generates a stream of decisions on ensuring resilience. The signals from these decisions fall on the “inputs” of the system model, thereby closing the loop of negative feedback, and it serves as the main tool for ensuring the resilience of the economic system.
For a model description of a system, its environment and an over-system, it is most appropriate to use fuzzy-logical systems, since they are the ones that best reproduce the significant informational uncertainty within which the system operates.
The rest of the paper is organized as follows: Section 2 provides models and methods we use in our research. Section 3 presents the main results obtained during the mass assessment of the sustainability of enterprises in five basic industries. Section 4 offers the main directions for the development of the approaches stated in the work. General conclusions on the work are presented in Section 5.

2. Author’s Models and Methods

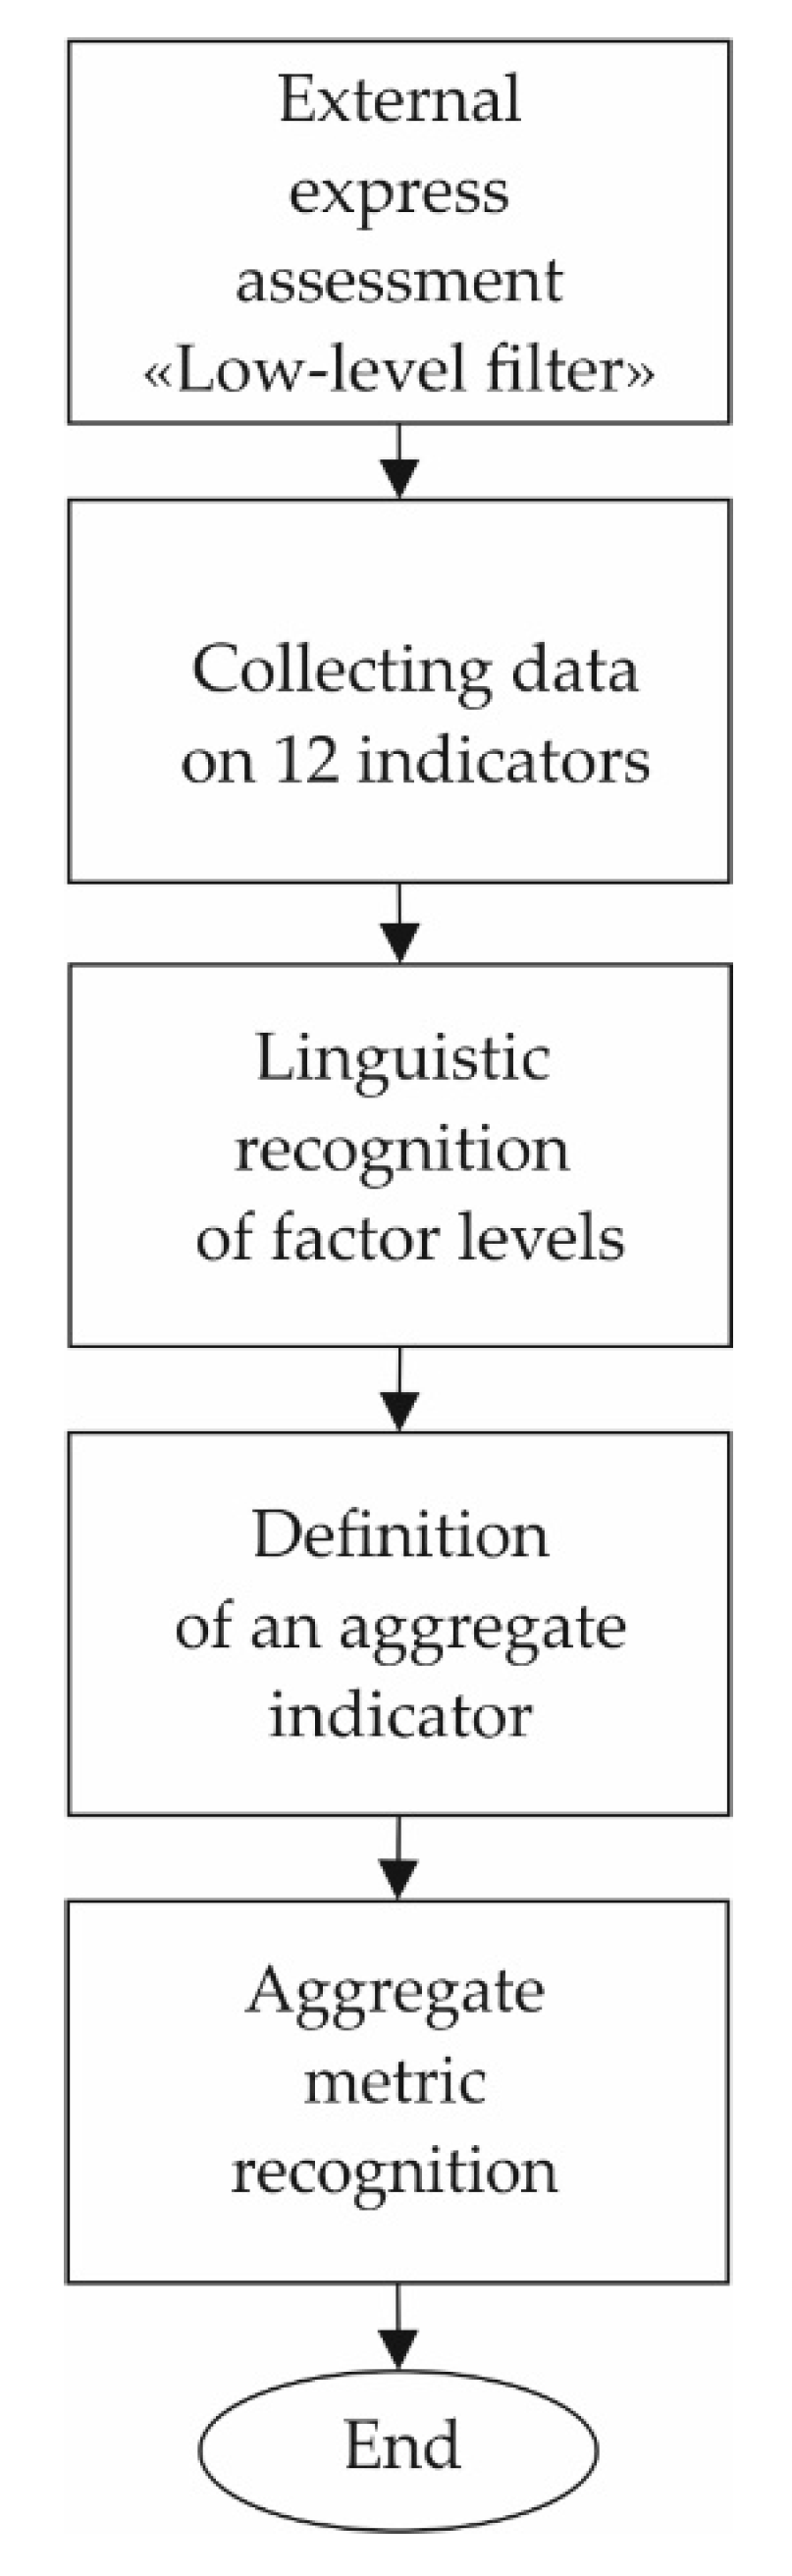
2.1. Enterprise Resilience Assessment Scheme

The sequence of assessment and ensuring the resilience of the enterprise one can see in Figure 1, Figure 2 and Figure 3. It follows from the presented schemes that the choice of the resilience assessment methodology is determined by the position of the analyst in relation to the company, whether he is outside or inside it. Depending on this, the amount of available initial data for analysis varies significantly. Each block of the scheme is based on the use of models containing elements of fuzzy sets and soft computations (Source: Own authors research).
Figure 2 and Figure 3 reveal the contents of Figure 1 in more detail. Figure 1 is a generalized scheme for choosing a method for resilience analysis, depending on the amount of data to be analyzed (Source: Own authors research).
Figure 2 illustrates an express method for analyzing resilience according to the official reporting of an enterprise, which can be obtained freely on the Internet. Based on the data of this reporting, 12 factors are identified that are most closely related to ensuring the resilience of the enterprise. We compare these factors with previously obtained standards in the course of linguistic classification.
Figure 3 shows the sequence of stages of modeling the internal environment of the enterprise and its external environment based on the complex model of the 4x6 matrix, which is described below (Source: Own authors research).

2.2. The Economic Resilience Fuzzy Model

There is shows a cybernetic model of the economic system, which is a 4 × 6 matrix in Figure 4 (Source: Vinogradov, Nedosekin, Abdoulaeva [15]).
In this 4 × 6 matrix, these are four strategic perspectives (A—Assets, P—Processes, R—Relationships, E—Effects), and the columns are six strategic maps (Threats, Opportunities, BSC, Risks, Chances, Decisions).
At the intersection of rows and columns in the matrix are indicators related to each other in oriented graphs and subgraphs. The content of these links is described in detail below. The indicators localized within the BSC map are well-known key performance indicators (KPIs) of the organization.
The systemic “outputs” of the model are indicators of the effectiveness of the economic system, localized in the Effects—BSC box. These include revenue, profit, return on capital (ROE, ROI), and business value. In the model, these indicators are presented as fuzzy numbers of any kind. On this information basis, the risks and chances of the system are evaluated, and then three data streams {efficiency, risk, chance} are directed to the input of the supersystem for making decisions on ensuring sustainability.
Modeling the economic system, in order to analyze its resilience, is carried out in nine stages. Let us consider how such modeling is carried out on the example of a small Russian electrical company ABC with a staff of 2000 people and revenue of 100 million euros per year.
Stage 1. The economic system of the ABC enterprise is identified with the necessary detail. Data is collected on the organizational structure of the enterprise, its process architecture and its strategic management rules. Forms of management reporting are consolidated and analyzed (it is rational to use four traditional accounting reports and two analytical forms).
Stage 2. During the strategic session, a tree of strategic objectives for the next planning year (for example, 2020) is formed, based on the analysis of the prospective desired state of the enterprise at the end of 2020. All objectives meet the SMART criteria, i.e., are quantifiable, demonstrably achievable and tied to the time axis in terms of their achievement. The objectives tree is an acyclic graph positioned in four strategic perspectives {Effects, Market, Processes, Resources}. This set of strategic prospects differs significantly from the same from Norton [16], where {Finance, Clients, Processes, Development} were selected as perspectives. This choice is meaningful and based on many years of experience in researching strategic models of similar content. It is advisable to build a tree of no more than 20–25 objectives and sub-objectives, in the name of maintaining the visibility of the view.
Stage 3. KPI indicators of the consolidated strategic model are identified. ABC identified 150 key indicators; in the KPI system, there were 400 participants (in order to motivate employees based on KPI). However, for the purposes of strategic planning, no more than 60–70 KPIs should be selected from a wide variety of indicators, 25–30 of which will be presented explicitly as part of the BSC, and the rest will go to the “basement”—they will participate in the calculations, but not be visualized within the BSC. By default, all KPIs pass linguistic classification and are extended to the form of linguistic variables in the sense of Zadeh [17]. Note: for the purposes of motivating employees, all KPIs are reduced to specialized matrices, on the basis of which the employee’s combined score in the reporting month is estimated, and this score directly affects his motivation.
Stage 4. The BSC graph is built on the basis of selected KPIs. If the BSC is modeled in a static representation, then the BSC graph must be acyclic. If a dynamic representation is chosen, then the graph must contain loops that model positive feedbacks in the enterprise system. Since the simulation step is one month, the model time is discrete, and modeling can be carried out using the technology of difference equations that relate the parameter levels and their discrete increments (an analog of linear differential equation systems). At this stage, it is necessary to emphasize the very existence of causal relationships between KPIs, which, on the one hand, express the continuity of objections in the objections tree, and, on the other hand, describe the logic of the enterprise’s business. This logic is simple: we mobilize strategic resources, then these resources are picked up by processes, as a result of which a high-quality business environment is created, built on the relationship of the enterprise with its key stakeholders.
Step 5. All communications in the BSC are calibrated. The main types of relationships used: traditional functional-algorithmic relationships such as fuzzy knowledge of the format IF-THEN, as well as communications built on the principle of a matrix aggregate calculator (MAC). MAC technology is based on fuzzy logic and is described in detail in Abdoulaeva [18]. The 4 × 6 model contains about 200 fuzzy links.
Stage 6. The external environment of the enterprise is modeled, generating challenges of positive and negative content. These challenges can be described using a wide range of fuzzy formalisms, such as fuzzy numbers and functions, as well as fuzzy random variables of the form at Puri [19].
Stage 7. The risks and chances of the enterprise are identified, with the construction of appropriate strategic maps. Models and methods of analysis are being implemented.
Stage 8. The simulation of the strategy itself is carried out in such a way that signals from the external environment arrive at the exogenous inputs of the BSC model, then they are processed by the model and converted into “outputs”; the corresponding output signals are fed to the inputs to the risk and chance models, where the corresponding levels are quantified.
Stage 9. Based on the obtained values of efficiency, risks and chances, strategic decisions are designed that ensure achievement of the set strategic goals, taking into account the spectrum of external disturbances. Thus, the BSC model grows to a 4 × 6 matrix model. If strategic goals at the level of model representation are achieved, the strategic modeling process is completed.

2.3. MAC-Based RI Resilience Index Score

The MAC model (N, M) is a matrix containing N rows and M columns, where N is the number of input indicators of the model, M is the number of qualitative gradations by which linguistic recognition of input factors is carried out. For example, a system of M = 5 gradations contains levels: {L1—very low, L2—low, L3—medium, L4—high, L5—very high}.
At the intersection of the i-th row and the j-th column, ij is located—the value of the membership function obtained when the i-th factor is recognized within Lj level, see Table 1 (Source: Abdoulaeva [19]).
The MAC model has two weight systems. The first system P reflects the significance of factors for the integral assessment, the sum of the weights pi is 1. The second system of weights—the system of nodal points Y—corresponds to the selected system of qualitative gradations and is constructed in such a way that the integral result of the MAC assessment is in the range from 0.1 to 0.9. For example, with M = 5 Y = {0.1, 0.3, 0.5, 0.7, 0.9}. The sum μij for each row of the matrix must be equal to 1, otherwise linguistic recognition becomes contradictory.
Then the resulting resilience index (RI) is determined by the formula:
R I =   i = 1 N p i j = 1 M y j μ i j ,
Qualitative recognition of the RI level gives: L1 at RI ∈ [0.1, 0.26); L2 at RI ∈ [0.26, 0.42); L3 at RI ∈ [0.42, 0.58); L4 at RI ∈ [0.58, 0.74) and L5 at RI ∈ [0.74, 0.9].

3. Results

3.1. Modeling Results Obtained: Case 1

The analysis of the ABC enterprise on real data on the RI factor showed that the level of resilience is average (approximately 0.52), with a tendency to a low level. The main reasons for the decline in resilience are: low labor efficiency (due to small-scale pilot production), a shrinking trend in the Russian market for electrical products and strong competition with Chinese suppliers (expressed in low sales margins), and low borrowed capital utilization. In the latter case, there is a “negative stability” in the sense of Ashby [20]; in the economic system there is excess equity, which does not bring the proper level of return. For example, in 2019 ROE = 10% per annum with a target level of 25% per annum.
Decisions that are called to change the situation are framed as projects of the following content:
  • Z1. Launching new models of equipment to the market, working with problem customers.
  • Z2. Development of export markets (25 countries).
  • Z6. Creation of a new system of motivation for engineering services employees.
  • Z8. Development of a new system of production planning and management of the ERP-class.
  • Z9. Implementation of the lean manufacturing system at the enterprise.
In the 4x6 model, solutions are modeled in exactly the same way as external challenges on the Threats and Opportunities maps.

3.2. Modeling Results Obtained: Case 2

One can judge the preservation of resilience after the fact, if the key economic factors characterizing resilience retain their value within the normatively permissible limits for a long period of time. Accordingly, it is necessary to carry out a linguistic classification (rationing) of key factors, considering factors as linguistic variables in the sense of Zadeh [17]. There are two standardization options: crisp granulation and fuzzy granulation [21]. In both cases, classification is possible only by the results of processing an array of data with the properties of mass character and statistical homogeneity. Ensuring uniformity is possible if enterprises of the same industry group are jointly evaluated, and the assessment is carried out on a time interval that does not contain “paradigm gaps”. For example, companies in the hi-tech sector can be evaluated at two time intervals: 1995–2000 and 2001–2005. Within each of the intervals, uniformity is maintained; however, there is a “paradigm gap” between the intervals caused by the “dot com crisis” of 2001. As a result of the crisis, a significant shift in all structural proportions of the business occurred; therefore, the forced “bonding” of the two indicated time intervals in order to increase the amount of data for analysis leads to a loss of uniformity, and, therefore, is incorrect. Similarly, it is incorrect to mix data from different industries. For the purposes of reliable classification, the array must contain at least 50–100 points for processing.
The study undertaken by our group, aimed at obtaining patterns in the course of normalizing summary data for a number of industrial sectors, for the subsequent assessment of the economic resilience of companies within these sectors. The total was allocated 82 largest industrial enterprises that were observed in the period 2015–2018. We examined enterprises from five basic industrial sectors: oil and gas (C11), metallurgy (DJ27), general engineering (DK29), electric engineering (DL31) and electric power (E40). All codes presented comply with the European Commission Standard NACE 1.1 [22] (2020). The results of the study are presented in detail in Abdoulaeva [23] (2019); this issue contains a brief description of the results.
For each enterprise under study, 12 main factors were observed quarterly:
  • X1—marginal profitability,%;
  • X2—operating profitability,%;
  • X3—net profitability,%;
  • X4—turnover of liabilities, once a year;
  • X5—current assets turnover, once a year;
  • X6—general liquidity, dimensionless;
  • X7—financial leverage, dimensionless;
  • X8—credit burden—percentage of interest payments in the structure of operating profit,%;
  • X9—weighted average cost of equity,% per annum;
  • X10—weighted average cost of borrowed capital,% per annum;
  • X11—labor efficiency, measured by the level of revenue, thousand US dollars per employee per year;
  • X12—labor efficiency, measured by the level of net profit, thousand US dollars per employee per year.
The quarterly and annual reporting of companies, regularly published on the Yahoo Finance portal [24], acted as a data source.
In this study, we used a “crisp” approach to linguistic rationing, with the following main rationing steps:
  • Select the range of initial values of the factor. For example, if 15 enterprises of the same industry are observed for a selected factor of 16 quarters, then we have 15 * 16 = 240 measurement points in an array with the properties of mass and uniformity. The left border of the range is the minimum value of the factor in the sample, the right border of the range is the maximum value in the sample;
  • We recognize all factors as direct or inverse. For a direct factor, the condition is satisfied: the higher the level of the factor, the higher the resilience of the enterprise, understood in a general sense. For the inverse factor, the opposite is true: the higher the level of the factor, the lower the resilience. For example, the indicator X1 is direct, and the indicator X10 is inverse. In the logic of research, the qualitative gradations of the term set are synchronized with the logic of direct factors;
  • We carry out preliminary filtering of the obtained measurements, taking from the sample extremely low and extremely high values that fall out of the dense group in the sample (trimming of the histograms is performed). Thus, we narrow the range for analysis and carry out a more accurate calibration of the linguistic variable;
  • We select seven key points on the measuring interval, and A1 is the minimum value for the interval, A4 is the weighted average value for the interval, A7 is the maximum value for the interval, and the coordinates of three other significant points A2, A3, A5, A6 are determined by the formulas:
    A2 = A1 + (A4 − A1)/3; A3 = A1 + 2 ∗ (A4 − A1)/3;
    A5 = A4 + (A7 − A4)/3; A6 = A4 + 2 ∗ (A7 − A4)/3,
As a result, we have the following definitions for qualitative gradations:
  • For factor X with direct logic:
    gradation 1: X ∈ (−∞, A2];
    gradation 2: X ∈ A2, A3];
    gradation 3: X ∈ (A3, A5];
    gradation 4: X ∈ (A5, A6];
    gradation 5: X ∈ (A6, ∞),
  • For factor X with inverse logic:
    gradation 1: X ∈ (A6, ∞);
    gradation 2: X ∈ [A5, A6);
    gradation 3: X ∈ [A3, A5);
    gradation 4: X ∈ [A2, A3);
    gradation 5: X ∈ (−∞, A2)
Thus, the linguistic variables X1–X12 in the resilience model are fully described, and any input value of the factor automatically receives a qualitative gradation. This is the principle of data mining. For all the sectors presented in the report, their own linguistic classifiers were obtained, within each of the 12 factors considered.
We pack the indicators X1–X12 in a two-level hierarchical tree, as shown in Figure 2, consisting of four blocks: profitability, turnover and liquidity, cost of capital and leverage, labor efficiency. Such packaging is necessary in order for the framework for resilience analysis to be balanced and tailored with the necessary level of detail.
Figure 5 shows the weights of the factors in the blocks, and the blocks themselves in the summary assessment. Data processing is carried out using the technology of a two-level matrix aggregate calculator (MAC), which is described in detail in Abdoulaeva [23] (2019). MAC technology can be applied in single-level and two-level execution. A single-level MAC model (N, M) is a matrix containing N rows and M columns, where N is the number of input indicators of the model, M is the number of qualitative gradations by which linguistic recognition of input factors is carried out. For example, a system of M = 5 gradations corresponds to gradations in (3) and (4). At the intersection of the i-th row and the j-th column μ ij is located—the value of the membership function obtained when the i-th factor is recognized in j-th gradation within the linguistic variable (Source: Abdoulaeva [23]).
The MAC model has two weight systems. The first system P reflects the significance of factors for the integral assessment, the sum of the weights pi is 1. The second system of weights—the system of nodal points Y—corresponds to the selected system of qualitative gradations and is constructed in such a way that the integral result of the MAC assessment is in the range from 0.1 to 0.9.
For example, with M = 5 Y = {0.1, 0.3, 0.5, 0.7, 0.9}. The sum ij for each row of the matrix must be equal to 1, otherwise linguistic recognition becomes contradictory.
RI   =   i = 1 N p i j = 1 M y j μ i j
Qualitative recognition of the RI level gives:
gradation 1: RI ∈ [0.1, 0.26);
gradation 2: RI ∈ [0.26, 0.42);
gradation 3: RI ∈ [0.42, 0.58);
gradation 4: RI ∈ [0.58, 0.74);
gradation 5: RI ∈ [0.74, 0.9].
In the two-level MAC technology, at the lower level, a single-level MAC is used for data on factors, and at the upper level, a single-level MAC is used for data on blocks that have passed preliminary linguistic classification in accordance with (6).
The simplest MAC example may be considered. The ABS enterprise has statistics in 2018 as shown in Table 2 (Source: Own authors research).
The ABC is included into the DL31 industry, which has the following crisp-norms as shown in Table 3. In the scope of 12 factors, X1–X6 and X10–X11 are direct, the rest have inverse logic: when they rise RI falls. The feature is encapsulated into linguistic classification: the higher the factor level, the lower the gradation that is assigned. A comparison of Table 2 and Table 3 causes μ -matrix view (in template of Table 1), see Table 4.
Application of Formula (1) to Table 3 gives the value of the integral resilience indicator RI = 0.461. This level can be recognized as low, closer to medium. The main problem of the enterprise is low labor productivity in terms of revenue and net profit, compared with the same in Western countries. Low productivity leads to personnel degradation: the company cannot afford to hire expensive specialists, replacing them with a multitude of low-paid and equally low-professional employees. Degradation of personnel leads to the degradation of the corporate culture as a whole, plunges the enterprise into a zone of unstable stagnant state, and leads to a loss in the competition for market niches (Source: Own authors research).
As for industries resilience, the weighted average RI values by industry are presented in Table 5 (Source: Abdoulaeva [23]).
Tickers of individual companies in Table 1 are presented as they are pointed out on international exchanges and on the Yahoo. Finance portal. Next to the tickers are the RI values for companies for 2018.
It is seen that the resilience of industrial sectors is growing from year to year, in the period between two crises—accomplished and expected. Worst of all, the last economic crisis suffered metallurgy, due to a significant reduction in prices for all industrial metals; meanwhile, this factor had a positive, stimulating effect on general engineering.
It may seem that high resilience is the prerogative of industry localized in developed countries, and a lack of resilience is characteristic of industry in developing countries. However, this thesis is false; two companies from Germany and one from the USA got into the industry outsiders by the resilience criterion, and one company from China and one from Spain were in the favorites.

4. Discussion. Presented Fuzzy Model Development

The methodology presented here was originally developed for industrial enterprises, specified for five industries. However, this development can be replicated for any enterprise with any industry focus. Here, for a rapid assessment, 12 factors are used, which can be changed as well as their weights in the assessment, however, this does not negate the general techniques used here for constructing resilience models. A limitation of the proposed research methods is that the data on the selected indicators must be open and reliable. We have no ideas on how to conduct external analysis of closed companies, other than based on data mining of news.
The data obtained in the framework of public reporting represent the first approximation in the assessment of resilience. Estimation of resilience on public quarterly data is late, and this undoubtedly reduces its usefulness for making managerial decisions. If we conduct the analysis in more detail and often, based on internal accounting data with a frequency of one time per month, then the estimate can be seriously refined, both in plus and minus. Internal analysts of companies should base their conclusions, among other things, on the basis of data regarding the external environment of companies and management parameters (the nature of decisions made to ensure resilience). A significant part of this data does not fall into public reporting, therefore the resilience assessment within the framework of the approach stated here may undergo distortions and should be continuously updated, including based on the results of processing insider information. A typical example here is the situation at General Electric [25] (2019), described in detail in the cited report of independent analysts for 2019.
The proposed methodology for analyzing economic sustainability will make it possible to regularly monitor the state of companies based on comparative analysis [26,27]. Moreover, the norms themselves, developed for individual industries on the basis of four years of observation, are subject to timely correction as new facts about the state of enterprises accumulate. The linguistic classification procedure, carried out on the basis of the results of the theory of fuzzy sets and soft calculations, allows to take into account the uncertainty of expert judgments, as well as the unavoidable uncertainty in terms of both external circumstances of the company’s activities and internal conditions.
The proposed method of analysis is of an express preliminary nature. To clarify the assessment, it is necessary to conduct it from within the enterprise on the basis of the entire completeness of information (which the company’s top management possesses) collected within the framework of a detailed and reliable management accounting.
In particular, most companies do not provide public information about the payroll. However, from the inside, these data are visible and can be used to construct additional indicators related to assessing the level of labor productivity.
Also, the presented methodology, based on the MAB, can be significantly developed if we trace the logical connection between the indicators of enterprises with each other within the framework of the BSC already mentioned here. In this case, the methods used in the analysis will receive a significant complication, and the links between the indicators may receive a fuzzy-logical and/or probabilistic interpretation. Within the framework of this approach, it is possible and necessary to model the state of the enterprise’s external environment based on fuzzy-probabilistic scenarios, where most of the uncertainty will be described and taken into account [28,29,30].
Thus, the owners and top management of the enterprise receive an effective strategic management tool that allows them to make timely decisions and assess the consequences of such decisions within the framework of a fuzzy-logical model.

5. Conclusions

The approach to resilience analysis alone is not so important as the completeness and timeliness of information obtained from different sources and the mechanisms of its preliminary processing (filtering) for the purposes of its subsequent analysis are important. Complex automation of the models and methods demonstrated here allows you to obtain data on the resilience of companies in real time, according to financial results of organizations of the information pipeline as a part of the automatic delivery of data.
The proposed method for assessing resilience allows for regular monitoring of enterprises, both in express mode and in the course of a comprehensive study using a scenario approach to modeling. The proposed approach allows us to consider the model of the adverse impact of the external environment on the enterprise system as a kind of test with the help of which the strengths and weaknesses of the company’s economic activities can be assessed, and optimal solutions for increasing the level of stability can be constructed.
A promising direction in assessing sustainability is the formation of phase spaces in a multidimensional field of factors, where most enterprises from the industry group under consideration maintain a state of resilience equilibrium with the external environment. In our works, we called such phase spaces R-Lense. It is appropriate to represent such lenses in the form of smooth fuzzy functions. Further research is aimed at automating the above models, and the formation of accelerated industry-specific solutions.

Author Contributions

Conceptualization, A.N.; Formal analysis, Z.A.; Methodology, A.N.; Resources, E.K. and A.Z.; Software, Z.A. All authors have read and agreed to the published version of the manuscript.

Funding

This research received no external funding.

Conflicts of Interest

The authors declare no conflict of interest.

References

  1. Altman, E. A Complete Guide for Predicting, Avoiding and Dealing with Bankruptcy; Wiley: New York, NY, USA, 1983. [Google Scholar]
  2. Martin, R.; Sunley, P. On the notion of regional economic resilience: Conceptualization and explanation. J. Econ. Geogr. 2015, 15, 1–42. [Google Scholar] [CrossRef] [Green Version]
  3. Reggiani, A.; De Graaff, T.; Nijkamp, P. Resilience: An evolutionary approach to spatial economic systems. Netw. Netw. Spat. Econ. 2002, 2, 211–229. [Google Scholar] [CrossRef]
  4. Holling, C.S. Resilience and stability of ecological systems. Annu. Rev. Ecol. Syst. 1973, 4, 1–23. [Google Scholar] [CrossRef] [Green Version]
  5. Martin, R. Regional economic resilience, hysteresis and recessionary shocks. J. Econ. Geogr. 2012, 12, 1–32. [Google Scholar] [CrossRef]
  6. Holling, C.S. Engineering resilience versus ecological resilience. Eng. Ecol. Constraints 1996, 31, 32. [Google Scholar]
  7. Gunderson, L.H.; Pritchard, L. Resilience and the Behavior of Large-Scale Systems. Manag. Environ. Qual. Int. J. 2003. [Google Scholar] [CrossRef]
  8. Walker, B.; Gunderson, L.; Kinzig, A.; Folke, C.; Carpenter, S.; Schultz, L. A handful of heuristics and some propositions for understanding resilience in social-ecological systems. Ecol. Soc. 2006. Available online: https://www.ecologyandsociety.org/vol11/iss1/art13/ (accessed on 5 May 2020).
  9. Perrings, C. Resilience and sustainable development. Environ. Dev. Econ. 2006, 11, 417–427. [Google Scholar] [CrossRef] [Green Version]
  10. Hill, E.; Wial, H.; Wolman, H. Exploring regional economic resilience. Work. Pap. 2008. Available online: https://www.econstor.eu/bitstream/10419/59420/1/592859940.pdf (accessed on 5 May 2020).
  11. Sabatino, M. Economic resilience and social capital of the Italian region. Int. Rev. Econ. Financ. 2019, 61, 355–367. [Google Scholar] [CrossRef]
  12. Müller, G.; Koslowski, T.G.; Accorsi, R. Resilience-a new research field in business information systems? In International Conference on Business Information Systems; Springer: Berlin/Heidelberg, Germany, 2013. [Google Scholar] [CrossRef]
  13. Buheji, M. Understanding the Power of Resilience Economy: An Inter-Disciplinary Perspective to Change the World Attitude to Socio-Economic Crisis; Author House: Bloomington, IN, USA, 2018. [Google Scholar]
  14. Hosseini, S.; Barker, K.; Ramirez-Marquez, J.E. A review of definitions and measures of system resilience. Reliab. Eng. Syst. Saf. 2016, 145, 47–61. [Google Scholar] [CrossRef]
  15. Vinogradov, V.V.; Abdoulaeva, Z.I. Fuzzy-set economic stability analysis model of mineral complex of the Russian Federation. In Proceedings of the 2016 XIX IEEE International Conference on Soft Computing and Measurements (SCM), St. Petersburg, Russia, 25–27 May 2016. [Google Scholar] [CrossRef]
  16. Kaplan, R.S.; Norton, D.P. Alignment: Using the Balanced Scorecard to Create Corporate Synergies; Harvard Business Press: Brighton, MA, USA, 2006; Volume 31, pp. 367–369. [Google Scholar] [CrossRef]
  17. Zadeh, L.A.; Kacpyrzyk, J. Fuzzy Logic for the Management of Uncertainty; Wiley: New York, NY, USA, 1992. [Google Scholar]
  18. Abdoulaeva, Z.I.; Kurbanbaeva, D.F.; Topuzov, M.E. Application of the matrix aggregate calculator (MAC) for forecasting disease recommendations. In Proceedings of the 2017 XX IEEE International Conference on Soft Computing and Measurements (SCM), St. Petersburg, Russia, 24–26 May 2017; pp. 684–685. [Google Scholar]
  19. Khan, S.; Khalid, M.M. A Fuzzy Chance Constraint Programming Approach for Optimal Allocation in Multivariate Stratified Surveys: A Compromise Solution. Int. J. Oper. Res. 2014, 11, 100–111. [Google Scholar]
  20. Ashby, W.R. An Introduction to Cybernetics; 1956; Available online: http://dspace.utalca.cl/bitstream/1950/6344/2/IntroCyb.pdf (accessed on 5 May 2020).
  21. Zadeh, L.A. Toward a theory of fuzzy information granulation and its centrality in human reasoning and fuzzy logic. Fuzzy Sets Syst. 1997, 90, 111–127. [Google Scholar] [CrossRef]
  22. Statistical Classification of Economic Activities in the European Community. Available online: https://ec.europa.eu/eurostat/ramon/nomenclatures/index.cfm?TargetUrl=LST_CLS_DLD&StrNom=NACE_1_1# (accessed on 5 May 2020).
  23. Abdoulaeva, Z.; Voronov, D.; Kozlovskiy, A.; Nedosekin, A.; Pelymskaya, I. Comparison of the properties of competitiveness and economic sustainability of metallurgical enterprises (on the example of MMK). Audit Financ. Anal. 2019, 6, 62–70. [Google Scholar]
  24. Yahoo Finance Portal. Available online: https://finance.yahoo.com (accessed on 5 May 2020).
  25. General Electric, a Bigger Fraud Than Enron. Available online: http://fm.cnbc.com/applications/cnbc.com/resources/editorialfiles/2019/8/15/2019_08_15_GE_Whistleblower_Report.pdf (accessed on 5 May 2020).
  26. Abosuliman, S.; Abdullah, S.; Qiyas, M. Three-Way Decisions Making Using Covering Based Fractional Orthotriple Fuzzy Rough Set Model. Mathematics 2020, 8, 1121. [Google Scholar] [CrossRef]
  27. Biswas, P.; Pal, B.B. A fuzzy goal programming method to solve congestion management problem using genetic algorithm. Decis. Mak. Appl. Manag. Eng. 2019, 2, 36–53. [Google Scholar] [CrossRef]
  28. Habib, A.; Akram, M.; Farooq, A. q-Rung Orthopair Fuzzy Competition Graphs with Application in the Soil Ecosystem. Mathematics 2019, 7, 91. [Google Scholar] [CrossRef] [Green Version]
  29. Lee, T.; Wang, C.; Yu, C. Fuzzy Evaluation Model for Enhancing E-Learning Systems. Mathematics 2019, 7, 918. [Google Scholar] [CrossRef] [Green Version]
  30. Si, A.; Das, S.; Kar, S. An approach to rank picture fuzzy numbers for decision making problems. Decis. Mak. Appl. Manag. Eng. 2019, 22, 54–64. [Google Scholar] [CrossRef]
Figure 1. Generalized stability assessment scheme.
Mathematics 08 01516 g001
Figure 2. Resilience express assessment method.
Mathematics 08 01516 g002
Figure 3. A comprehensive method for assessing resilience based on a 4x6 matrix model.
Mathematics 08 01516 g003
Figure 4. Schemes 4 × 6 matrix.
Mathematics 08 01516 g004
Figure 5. Two-level hierarchy of factors for assessing resilience.
Mathematics 08 01516 g005
Table 1. An example of the MAC for the assessment of RI (for N = 5 and M = 5).
IndicatorThe Weight P of the Indicator in MACPresent ValueMembership Functions Values for Terms of X:
L1L2L3L4L5
X1p1x1μ11μ12μ13μ14μ15
X2p2x2μ21μ22μ23μ24μ25
X3p3x3μ31μ32μ33μ34μ35
X4p4x4μ41μ42μ43μ44μ45
X5p5x5μ51μ52μ53μ54μ55
Nodal points Yy1y2y3y4y5
Table 2. ABS statistics of 2018.
FactorNameDimensionValue
X1Gross profitability%29%
X2Operative profitability%18%
X3Net profitability%13%
X4All assets turnoveronce a year1.1
X5Current assets turnoveronce a year1.737
X6Liquidityno dimension12.667
X7Financial leverageno dimension0.087
X8Credit%4%
X9WACC1% a year9%
X10WACC2% a year10%
X11Labor efficiency 1USD1000 per 1 emp. a year44
X12Labor efficiency 1USD1000 per 1 emp. a year5.6
Table 3. DL31 norms.
FactorNorms for Gradations:
12345
X1X1 < 23%23.1 % < X1 < 26%26.1% < X1 < 36%36.1% < X1 < 43%X1 > 43%
X2X2 < 2%2.1% < X2 < 5%5.1% < X2 < 13%13.1% < X2 <19%X2 > 19%
X3X3 < 1%1.1% < X3 < 3%3.1% < X3 < 8%8.1% < X3 < 13%X3> 13%
X4X4 < 0.360.36 < X4 < 0.480.49 < X4 < 0.780.79 < X4 < 0.95X4 > 0.95
X5X5 < 1.11.11 < X5 < 1.51.51 < X5 < 2.42.41 < X5 < 2.6X5 > 2.6
X6X6 < 0.750.75 < X6 < 1.11.1 < X6 < 2.02.01 < X6 < 2.5X6 > 2.5
X7X7 > 4.14 > X7 > 3.33.2 > X7 > 1.811.8 > X7 > 1.31X7 < 1.3
X8X8 > 36%36% > X8 > 22.1%22% > X8 > 5.1%5% > X8 > 2.5%X8 < 2.5%
X9X9 > 13%13% > X9 > 9.1%9% > X9 > 4.1%4% > X9 > 2.1%X9 < 2%
X10X10 > 2%2% > X10 > 1.61%1.6% > X10 > 0.71%0.7% > X10 > 0.31%X10 < 0.3%
X11X11 < 233233 < X11 < 366367 < X11 < 667667 < X11 < 832X11 > 833
X12X12 < 88 < X12 < 1617 < X12 < 3233 < X12 < 42X12 > 42
Table 4. μ -matrix for ABC in 2018.
Factor μ
12345
X1 1
X2 1
X3 1
X4 1
X5 1
X6 1
X7 1
X8 1
X9 1
X101
X111
X121
Table 5. Levels of sectoral economic resilience.
Industry Code (NACE)Tickers of Flagship Companies (RI_2018)Outsiders Tickers (RI_2018)Industry RI Values by Years:
2015201620172018
C11PSX (0.557)ROSN.ME (0.356)0.4040.3800.4420.474
DJ27PKX (0.596)SAIL.NS (0.314)0.3530.3690.4270.465
DK29MMM (0.657)DAI.DE (0.431)0.4980.4700.4870.513
DL31900925.SS (0.616)GE (0.317)0.4470.4410.4510.461
E40ELE.MC (0.603)RWE.DE (0.304)0.4720.4730.4880.487

