Article

A New Stability Criterion for IoT Systems in Smart Buildings: Temperature Case Study

by
Roberto Casado-Vara
1,*,
Angel Martín del Rey
2,
Ricardo S. Alonso
1,
Saber Trabelsi
3 and
Juan M. Corchado
1
1
BISITE Research Group, University of Salamanca, 37008 Salamanca, Spain
2
Department of Applied Mathematics, Institute of Fundamental Physics and Mathematics, University of Salamanca, 37008 Salamanca, Spain
3
Science Program, Texas A&M University at Qatar, Education City, Doha 23874, Qatar
*
Author to whom correspondence should be addressed.
Mathematics 2020, 8(9), 1412; https://doi.org/10.3390/math8091412
Submission received: 27 July 2020 / Revised: 20 August 2020 / Accepted: 21 August 2020 / Published: 24 August 2020
(This article belongs to the Section Mathematics and Computer Science)

Abstract

:
The concept of smart cities emerged in the 1990s. Since then, smart buildings have become a closely interconnected element of smart cities. This type of building implements Internet of Things technology and control algorithms to monitor and control their indoor environment. The aim of this paper is to develop a new stability criterion method for smart building Internet of Things (IoT) systems, subject to external disturbances. The new stability criterion is going to optimize the operation of control algorithms since this criterion does not depend on the transmission function of the control algorithm but on the data collected by the IoT system. We present a new matrix called “Laplacian IoT matrix”, containing IoT network information associated with the graph of a smart building. The proposal is supported by the results of a numerical case study.

1. Introduction

Over recent years, the Internet of Things (IoT) paradigm has attracted the interest of the research community [1,2], especially because of its ability to make monitoring, control, and communication more effective. The Internet of Things involves a system of interrelated objects, such as sensors, vehicles, houses, and appliances, which are connected to the Internet and can, therefore, share information, data, and resources. The IoT has become a key element of smart cities and smart building applications designed to monitor and save energy [3,4,5]. The monitoring and control of environmental parameters, such as temperature and humidity, are important in many smart buildings [6]. For example, biological labs need to have close control over temperature and humidity, to ensure that biological samples do not get spoiled. State-of-the-art research focuses primarily on improving the accuracy of sensors and optimizing the operation of control algorithms [7,8]. The state of the art lacks a system that would measure the stability of the IoT network with precision, enhancing the operation of control algorithms and reducing energy consumption.
Efficiency in the use of resources is an important aspect of smart buildings, researchers are continually striving to improve through IoT networks [9,10]. An IoT network is usually shared by multiple sensors, as well as controller and actuator nodes. These IoT nodes collect data from a range of smart buildings. Data are then sent to a control algorithm that controls the environmental conditions within smart buildings. The main purpose of monitoring and controlling is to improve the energy efficiency of smart buildings [11,12]. This research proposes a novelty in the field of automatic control; a new stability criterion and not a control algorithm is used to determine whether a system is stable or not [13]. In this way, control algorithms are executed only when it is truly necessary, i.e., when the stability criterion detects disturbances in the system. Moreover, the proposed IoT stability criterion has a margin of comfort, this means that small disturbances in environmental conditions are not considered to be such and a control algorithm is not executed. The ability to limit the execution of control algorithms to a minimum contributes to energy conservation since actuators do not have to continually use energy in the process of adjusting the values of environmental variables.
Control algorithms are used to monitor and control IoT networks in smart buildings. These control algorithms have different methods of detecting the instability of the IoT network, i.e., when the values collected by the IoT network are not the same as the established values. However, these methods of detecting deviations usually do not take into account the topology of the smart building’s IoT network and they do not evaluate the degree of the disturbances in the smart building. In this paper, we define an IoT system as the smart building and its IoT network. Therefore, we present a new stability criterion for IoT systems. We say that an IoT system is stable, if the disturbances made to the system are within an established confidence margin for that smart building (i.e., a medical laboratory has a stable temperature of 16 ° C, if the disturbances of the IoT system are less than 1 ° C the biological samples will not be affected and it is not necessary to execute a control algorithm). In our proposal, we use IoT graphs and the Laplacian IoT matrix, which we have defined in the previous sections. Thus, the results of the Spectral graph theory and the Bauer–Fike theorem were used to support our proposal. The motivation behind this research is to find a solution to the problem of instability in IoT networks implemented in smart buildings. Spectral graph theory has a long history. In the early days, matrix theory and linear algebra were used to analyze the adjacency matrices of graphs. Algebraic methods are especially effective in treating graphs that are regular and symmetric. There is extensive literature on algebraic aspects of spectral graph theory, well documented in several surveys and books, such as Biggs [14] and Cvetkovic [15]. Graph theory has been used to give optimal solutions to many problems (see, for example [16,17,18]). These new approaches offer new solutions that could not be achieved otherwise.
This article describes how IoT systems can be represented on a graph and how it is possible to determine the state of an IoT system (stable or unstable) through Spectral Graph Theory. An undirected graph G is a pair ( V , E ) where V is the set of vertices and E is the set of edges. With the IoT network of a smart building, we create a graph G where the vertices are the IoT devices of the smart building. Once we have defined the concept of Laplacian IoT matrix L I o T associated with graph G and based on the eigenvalues of L I o T , we defined a new IoT stability criterion capable of optimizing the operation of control algorithms in smart buildings. Hereafter we assume that:
  • A C n × n is a diagonalizable matrix.
  • V C n × n is the non-singular eigenvector matrix such that A = V Λ V 1 , where Λ is a diagonal matrix.
  • If X C n × n is invertible, its condition number in p-norm is denoted by K p ( X ) and defined by:
    κ p ( X ) = X p X 1 p .
This research presents a novel approach to automatic control because the stability of the IoT network is determined before the data enters the control algorithm. The stability of IoT systems can be determined by studying the stability of control systems. Therefore, the stability criterion that we propose in this paper optimizes the operation of control algorithms by executing them only if the IoT stability criterion detects disturbances in the system. The techniques for the study of the stability of control systems generally consist of examining the roots of the transfer function. The most commonly used criteria for studying the stability of control systems are the Routh-Hurwitz criterion [19,20], the Jury stability criterion [21,22], the root site method [23], and the Bode diagram method [24,25]. Before these criteria can be applied, they need to discretize or linearize the transfer function. In comparison, the IoT stability criterion proposed in this paper applies Spectral Graph Theory and the data collected by the IoT network. In this way, the monitoring and control of IoT systems are improved as this stability criterion is executed in the monitoring part without the need for the control algorithms to be executed unnecessarily. The main contribution of this paper can be summarized as follows:
  • To the best of our knowledge, the proposed novel approach allows obtaining a mathematical model of the IoT system based on graph theory.
  • A new Laplacian IoT matrix has been created from the network associated with the IoT system. This new matrix has allowed the authors to apply the Spectral Graph Theory to obtain useful information from the IoT system and thus improve its operation.
  • A new IoT stability criterion for IoT systems based on the Spectral Graph Theory that increases the efficiency of IoT control systems since the IoT stability criterion does not involve the transfer function of the control algorithm.
Although in this paper, without loss of generality, we are going to use the temperature of the smart buildings to make the analysis, this research is consistent with other measures that can be taken in smart buildings.
The remainder of this paper is organized as follows: In this paper, a new stability criterion has been proposed which has led to a new algorithm to be used in conjunction with smart building monitoring and control algorithms. In Section 2, the Laplacian IoT matrix is presented as a new mathematical tool that we will consider in this paper, we will give the basic definitions and the notation that will be used throughout the paper. Also, in this section, we have explained how to build an IoT graph from the IoT sensors in the smart building. The details of the Laplacian IoT matrix spectrum are shown in Section 3. Moreover, we present the Gershgorin theorem which gives us a very accurate view of where the eigenvalues are. Section 4 presents the new stability criterion in perturbed IoT systems. En esta sección se muestran varios teoremas que hemos usado como base matematica para poder diseñar el nuevo algoritmo para detectar la estabilidad en los sistemas IoT.
In Section 5 a numerical case study of how our new IoT stability criterion works are presented. Finally, Section 6 concludes the conducted research and describes future lines of research.

2. Basic Definition and Notation of Laplacian IoT Matrix

Researchers’ attention has recently been focused on optimizing energy consumption in smart buildings [26,27,28,29]. Several kinds of research focused on improving the control systems of the IoT network [30,31]. Our approach optimizes the operation of control algorithms by introducing a new stability criterion into IoT networks. To introduce this criterion, we have designed a graph and a new Laplacian IoT matrix associated with an IoT network. In this section, we present the definition of an IoT graph and a new Laplacian IoT matrix associated with an IoT network in a smart building.
Then, the next step is to describe the structure of the network. G I o T consists of the topology of the IoT nodes in the smart building. In this way, a graph is formed where the vertices of the graph are the IoT nodes and the edges of the graph are the physical connections between the rooms where the IoT nodes are located (i.e., no obstacles are placed between the nodes), i.e., if two rooms are separated by a door or a corridor, then there is an edge in the graph. The graph represents the heat transfer between the physically connected rooms. An illustrative example can be found in Figure 1.
Let us define the graph of an IoT network in a smart building. Given an undirected graph G = ( V , E ) , where V = { v 1 , v 2 , , v n } is a set of vertices and E = { e 1 , e 2 , , e m } is a set of edges. This graph is constructed according to the topology of the building, which allows us to use graph theory to study the IoT network. The IoT graph is defined as follows:
Definition 1.
Given an IoT network in a smart building, the IoT graph, G I o T , is defined as the graph of the IoT network.
Once we have the graph of the IoT network, it is convenient to define a new Laplacian matrix associated with this IoT network, the Laplacian IoT matrix. In this way, Spectral graph theory can be used to study the properties of the IoT network based on its Laplacian matrix.
Definition 2.
Given an IoT graph G I o T with n vertices, its Laplacian IoT matrix L I o T is defined as:
L I o T = D I o T A
where D I o T is the IoT measurement matrix (i.e., the measurements collected by the IoT network are placed on the diagonal of this matrix) and A is the adjacency matrix of the graph.
The elements of L I o T are given by
L i , j I o T = 1 if ( i , j ) E t i if j   =   i ( t i = temperature   of   the   i - th   node ) 0 otherwise
Example 1.
For the example proposed in the Figure 1, the Laplacian IoT matrix is:
L I o T = m 1 0 1 1 0 0 0 0 0 0 0 m 2 1 0 0 0 0 0 0 0 1 1 m 3 1 1 1 0 0 0 0 1 0 1 m 4 0 0 0 0 0 0 0 0 1 0 m 5 0 0 0 0 0 0 0 1 0 0 m 6 1 1 0 0 0 0 0 0 0 1 m 7 0 0 0 0 0 0 0 0 1 0 m 8 1 1 0 0 0 0 0 0 0 1 m 9 0 0 0 0 0 0 0 0 1 0 m 10
where m i are the measurements collected by the IoT network.

3. The IoT Matrix Spectrum

An essential part of graph theory and Spectral graph theory are eigenvalues and eigenvectors. In this section, we are going to present the mathematical background that has allowed us to obtain new results on the eigenvalues of the Laplacian IoT matrix. First, we discuss the properties of the eigenvalues that allow us to enunciate and prove the Theorem 1. Next, we study the location of the eigenvalues, which enable us to present the Remark 1.

3.1. Eigenvalue Properties

The following are well-known results [32,33]:
Lemma 1.
If P C n × n is unitary and x 2 = 1 with x C n , then A x 2 = 1 .
Lemma 2.
Let λ C be an eigenvalue of the unitary matrix P, then | λ | = 1 .
The above lemmas allow us to enunciate and demonstrate Theorem 1. This theorem proves that all the values of matrix P are complex. The theorem proves that it is possible to construct the stability criterion that we propose in this work.
As L n × n I o T C n × n is diagonalizable (it is a symmetric real-valued matrix), and let λ 1 I o T λ 2 I o T λ n I o T be the eigenvalues of L I o T and let { v 1 I o T , v 2 I o T , , v n I o T } the orthogonal eigenvectors associated with those eigenvalues. Then, there exists an unitary matrix P C n × n with the { v i I o T } 1 i n vectors as columns, such that P 1 L I o T P is a diagonal matrix.
Theorem 1.
In a matrix P of eigenvectors of a Laplacian IoT matrix, all the eigenvalues are complex.
Proof. 
Let us suppose that all one’s eigenvalues are real. This means that because of the spectral theorem for symmetric matrices, the matrix should be symmetric and have real coefficients; however, this is not so, leading to a contradiction and complexity of the values in the matrix. □

3.2. Eigenvalue Location

Let A be a complex n × n matrix with inputs a i j . For i { 1 , , n } let ρ i = j i a i j be the sum of the absolute values of the non-diagonal entries in the i t h row. Let D ( a i i , ρ i ) C be a closed disc centered at a i i with radius ρ i . Such a disc is called a Gershgorin disc. The Gershgorin theorem can be found in [34,35].
Theorem 2
(Gershgorin). Every eigenvalue of A lies within at least one of the discs D ( a i i , ρ i ) . Therefore, all the eigenvalues of A are located at the union of the n discs:
i = 1 n { z C : | z a i i | ρ i } .
Also, if the union of k discs is disjoint from the union of the other n k discs then the former union contains exactly k and the latter n k eigenvalues of L I o T .
Proof. 
The proof can be found in [36]. □
Remark 1.
All the eigenvalues of the matrix P of eigenvectors of the Laplacian IoT matrix are in the boundary of the disk D (0,1).

4. Stability Criterion in a Perturbed IoT System

In this section, we are going to discuss what happens with the eigenvalues of a matrix when a disturbance occurs (the disturbed matrix). The main result of this analysis is the IoT stability criterion that we propose in this work. The first step is finding an absolute boundary for the eigenvalues of the original Laplacian IoT matrix and then for the disturbed one. In this way, we show that if the matrix is well conditioned, the disturbance is small and the eigenvalues of a L I o T matrix and the L I o T + δ L I o T perturbed matrix are limited. Finally, in this section we formally describe the IoT stability criterion based on the Laplacian IoT matrix.

IoT Stability Criterion

Temperature control in smart buildings is an important field in research to increase sustainability. If the temperature in the smart building is kept at a low level, the heating, ventilation and air conditioning systems (HVAC) will not have to make any extra effort to bring the temperature of the building back to the comfort temperature selected by the smart building manager.
Definition 3
(Stability). A system is stable if the response to a signal, whether the change of the reference point or a disturbance, reaches and maintains a useful value over a reasonable period.
An unstable control system will, for example, produce persistent or large amplitude oscillations in the signal, or may cause the signal to take on values corresponding to extreme limits. An unstable response is undesirable from a control point of view. It is also necessary to know the amount or degree of stability that a system has, because it can happen that a system that is stable, is close to the limits of going from being stable to unstable by the use that is given to the system in the course of time, or by the replacement of some component when carrying out any type of maintenance. Instability is latent in every system, so it is important to be able to measure the level of stability.
Definition 4
(Disturbance). A disturbance is a signal that can affect the value of a system’s output. If the disturbance is generated within the system it is called internal, while an external disturbance is generated outside the system and is an input [37].
For example, if you consider the temperature control system of a room, the temperature outside could be considered an external disturbance, while the activity of people inside could be considered an internal disturbance.
An important theorem on the absolute error of the eigenvalues of disturbed matrix is presented below.
Theorem 3
(Bauer–Fike). Let A C n × n be diagonalizable with A = X Λ X 1 and Λ = ( λ 1 , , λ n ) . Set K ( X ) = X X 1 and let σ ( A ) be the spectrum of A. Let δ > 0 be a perturbation in A and assume that δ A C n × n . If μ σ ( A + δ A ) then
m i n | λ i μ | K p ( X ) δ A , 1 i n .
Proof. 
See [38,39]. □
Remark 2.
If A + δ A is small, Theorem 3 states that every eigenvalue of A + δ A is close to some eigenvalue of A, and the distance between eigenvalues of A + δ A and eigenvalues of A varies linearly with the perturbation δ A .
For every δ A matrix one has:
σ ( A + δ A ) i = 1 n D i
where
D i = { z C : | z λ i | K p ( X ) δ A } 1 i n .
Remark 3.
Since P ¯ is a unitary complex matrix, all of its eigenvalues hold the following:
σ ( P ¯ ) D ( 0 , 1 ) .
Remark 4.
As every normal matrix A is diagonalizable through an unitary matrix (Schur’s Theorem), considering the matrix standard norm · 2 we have that K p ( A ) = 1 .
In this paper, we will study the connection of the spectrum of the unitary matrices P and P ¯ to define the stability criterion. The matrix P is defined by the eigenvectors of the matrix L I o T , and the matrix P ¯ is defined by the eigenvectors of the disturbed matrix L ¯ I o T . Since Theorem 3 is only valid for diagonalizable matrices, we claim a more powerful result for any arbitrary matrix. This result also relates the eigenvalues of the A matrix and A + δ A as follows:
Theorem 4.
Let A C n × n an arbitrary matrix, and let μ an eigenvalue of A + δ A . Then, either μ is also an eigenvalue of A or
1 ( μ I A ) 1 · δ A ( μ I A ) 1 δ A .
Proof. 
The left inequality follows immediately from a simple matrix manipulation using the norm properties and the properties of the eigenvalues. Since μ is an eigenvalue of A + δ A , then μ holds:
( A + ( δ A ) ) x = μ x , ( δ A ) x = ( μ I A ) x , ( μ I A ) 1 ( δ A ) x = x ,
taking norms, one has
( μ I A ) 1 ( δ A ) x x ,
then
( μ I A ) 1 ( δ A ) 1 .
Then, the right inequality follows from the Holder inequality [40]:
( μ I A ) 1 ( δ A ) ( μ I A ) 1 δ A .
 □
Remark 5.
If A = X Λ X 1 is diagonalizable, then
( μ I A ) 1 = V ( μ I A ) 1 V 1 V ( μ I Λ ) 1 V 1
leading immediately to Theorem 3 for any arbitrary matrix A C n × n .
Given an IoT system, we have its IoT Matrix and also its IoT Laplacian Matrix L I o T and let δ R n be a disturbance (i.e., measurements of an IoT system). Let Λ = { λ 1 I o T , , λ n I o T } ( Λ ¯ = { λ ¯ 1 I o T , , λ ¯ n I o T } ) be the eigenvalues of L I o T (resp. L ¯ I o T ) and let L I o T with L I o T = P Λ P 1 and L ¯ I o T with L ¯ I o T = P ¯ · Λ ¯ · P ¯ 1 ( L ¯ I o T = L I o T + δ I ) be the Laplacian IoT matrix (resp. the Laplacian IoT disturbed matrix) associated with the IoT graph G I o T . Let σ ( P ) = { μ 1 I o T , , μ n I o T } ( σ ( P ¯ ) = { μ ¯ 1 I o T , , μ ¯ n I o T } ) be the spectrum of P (Resp. the spectrum of P ¯ ).
Definition 5.
The IoT system is said to be IoT stable, if, for every disturbance δ R n > 0 , the following equation under the conditions of the Theorem 2 and Remark 1 holds
( μ i I o T μ ¯ I o T ) 1 D C ( 0 , 1 ) for every i = 1 , , n .
Based on the previous definition, we have designed the algorithm that will detect whether an IoT system is stable or is running into some disturbances. Algorithm 1 will be implemented in the monitoring and control systems of smart buildings to enhance the operation of the system.
Algorithm 1 IoT stability detection algorithm
1:
Input L I o T , L ¯ I o T
2:
P , P ¯ e i g e n v e n c t o r ( L I o T ) , e i g e n v e c t o r ( L ¯ I o T )
3:
Λ , Λ ¯ e i g e n v a l u e s ( P ) , e i g e n v a l u e s ( P ¯ )
4:
for i in length(P) do
5:
    r o o t s | ( λ i μ ¯ ) 1 |
6:
   if a b s ( r o o t s ) > 1 then
7:
    stable 0
8:
    Break ;
9:
   else
10:
     stable 1
11:
Output s t a b l e
This algorithm gets as input the IoT Laplacian matrix at the time t 1 and t, i.e., the current and previous temperature measurements. This way the algorithm will be able to check if there has been a disturbance big enough to make the IoT system lose stability and the HVAC control system needs to operate to recover stability. In the next step of the algorithm, the eigenvectors of the IoT Laplacian matrix are calculated to build the P matrices. Also, the eigenvalues of the P matrices are calculated. Then, the algorithm applies the Definition 5 to check if the IoT system is stable. Here you have two possibilities: stable = 0 and stable = 1. When the system has lost its stability the result of calculating ( μ i I o T μ ¯ I o T ) 1 is that these elements are out of disk D C ( 0 , 1 ) which implies that stable = 0.
One of the main advantages of this algorithm is that it operates as a switching controller (operating when the system is not stable). This allows the system to be more optimal since it will only operate when the system is not stable (stable =0). In terms of energy saving, this will be a big step forward, since presently smart building HVAC systems are controlling the temperature continuously without taking into account small disturbances. In the case of our algorithm, the temperature of the entire building is taken into account for this temperature control to avoid false positives. Suppose that in a smart building the entrance door is left open in the summer, the IoT devices will detect that it is hot in that area of the smart building and will turn on the air conditioning to stabilize the temperature. However, in the rest of the building you have the desired temperature, what you are going to achieve is that all the staff in the building is getting cold.

5. Numerical Case Study

In this section, we evaluate through an experimental case study the proposed method, which is about providing a novel method to compute the equilibrium of IoT systems. To demonstrate the efficiency of this technique, temperature data collected by the IoT devices in a smart building will be used.

5.1. General Description of the Case Study

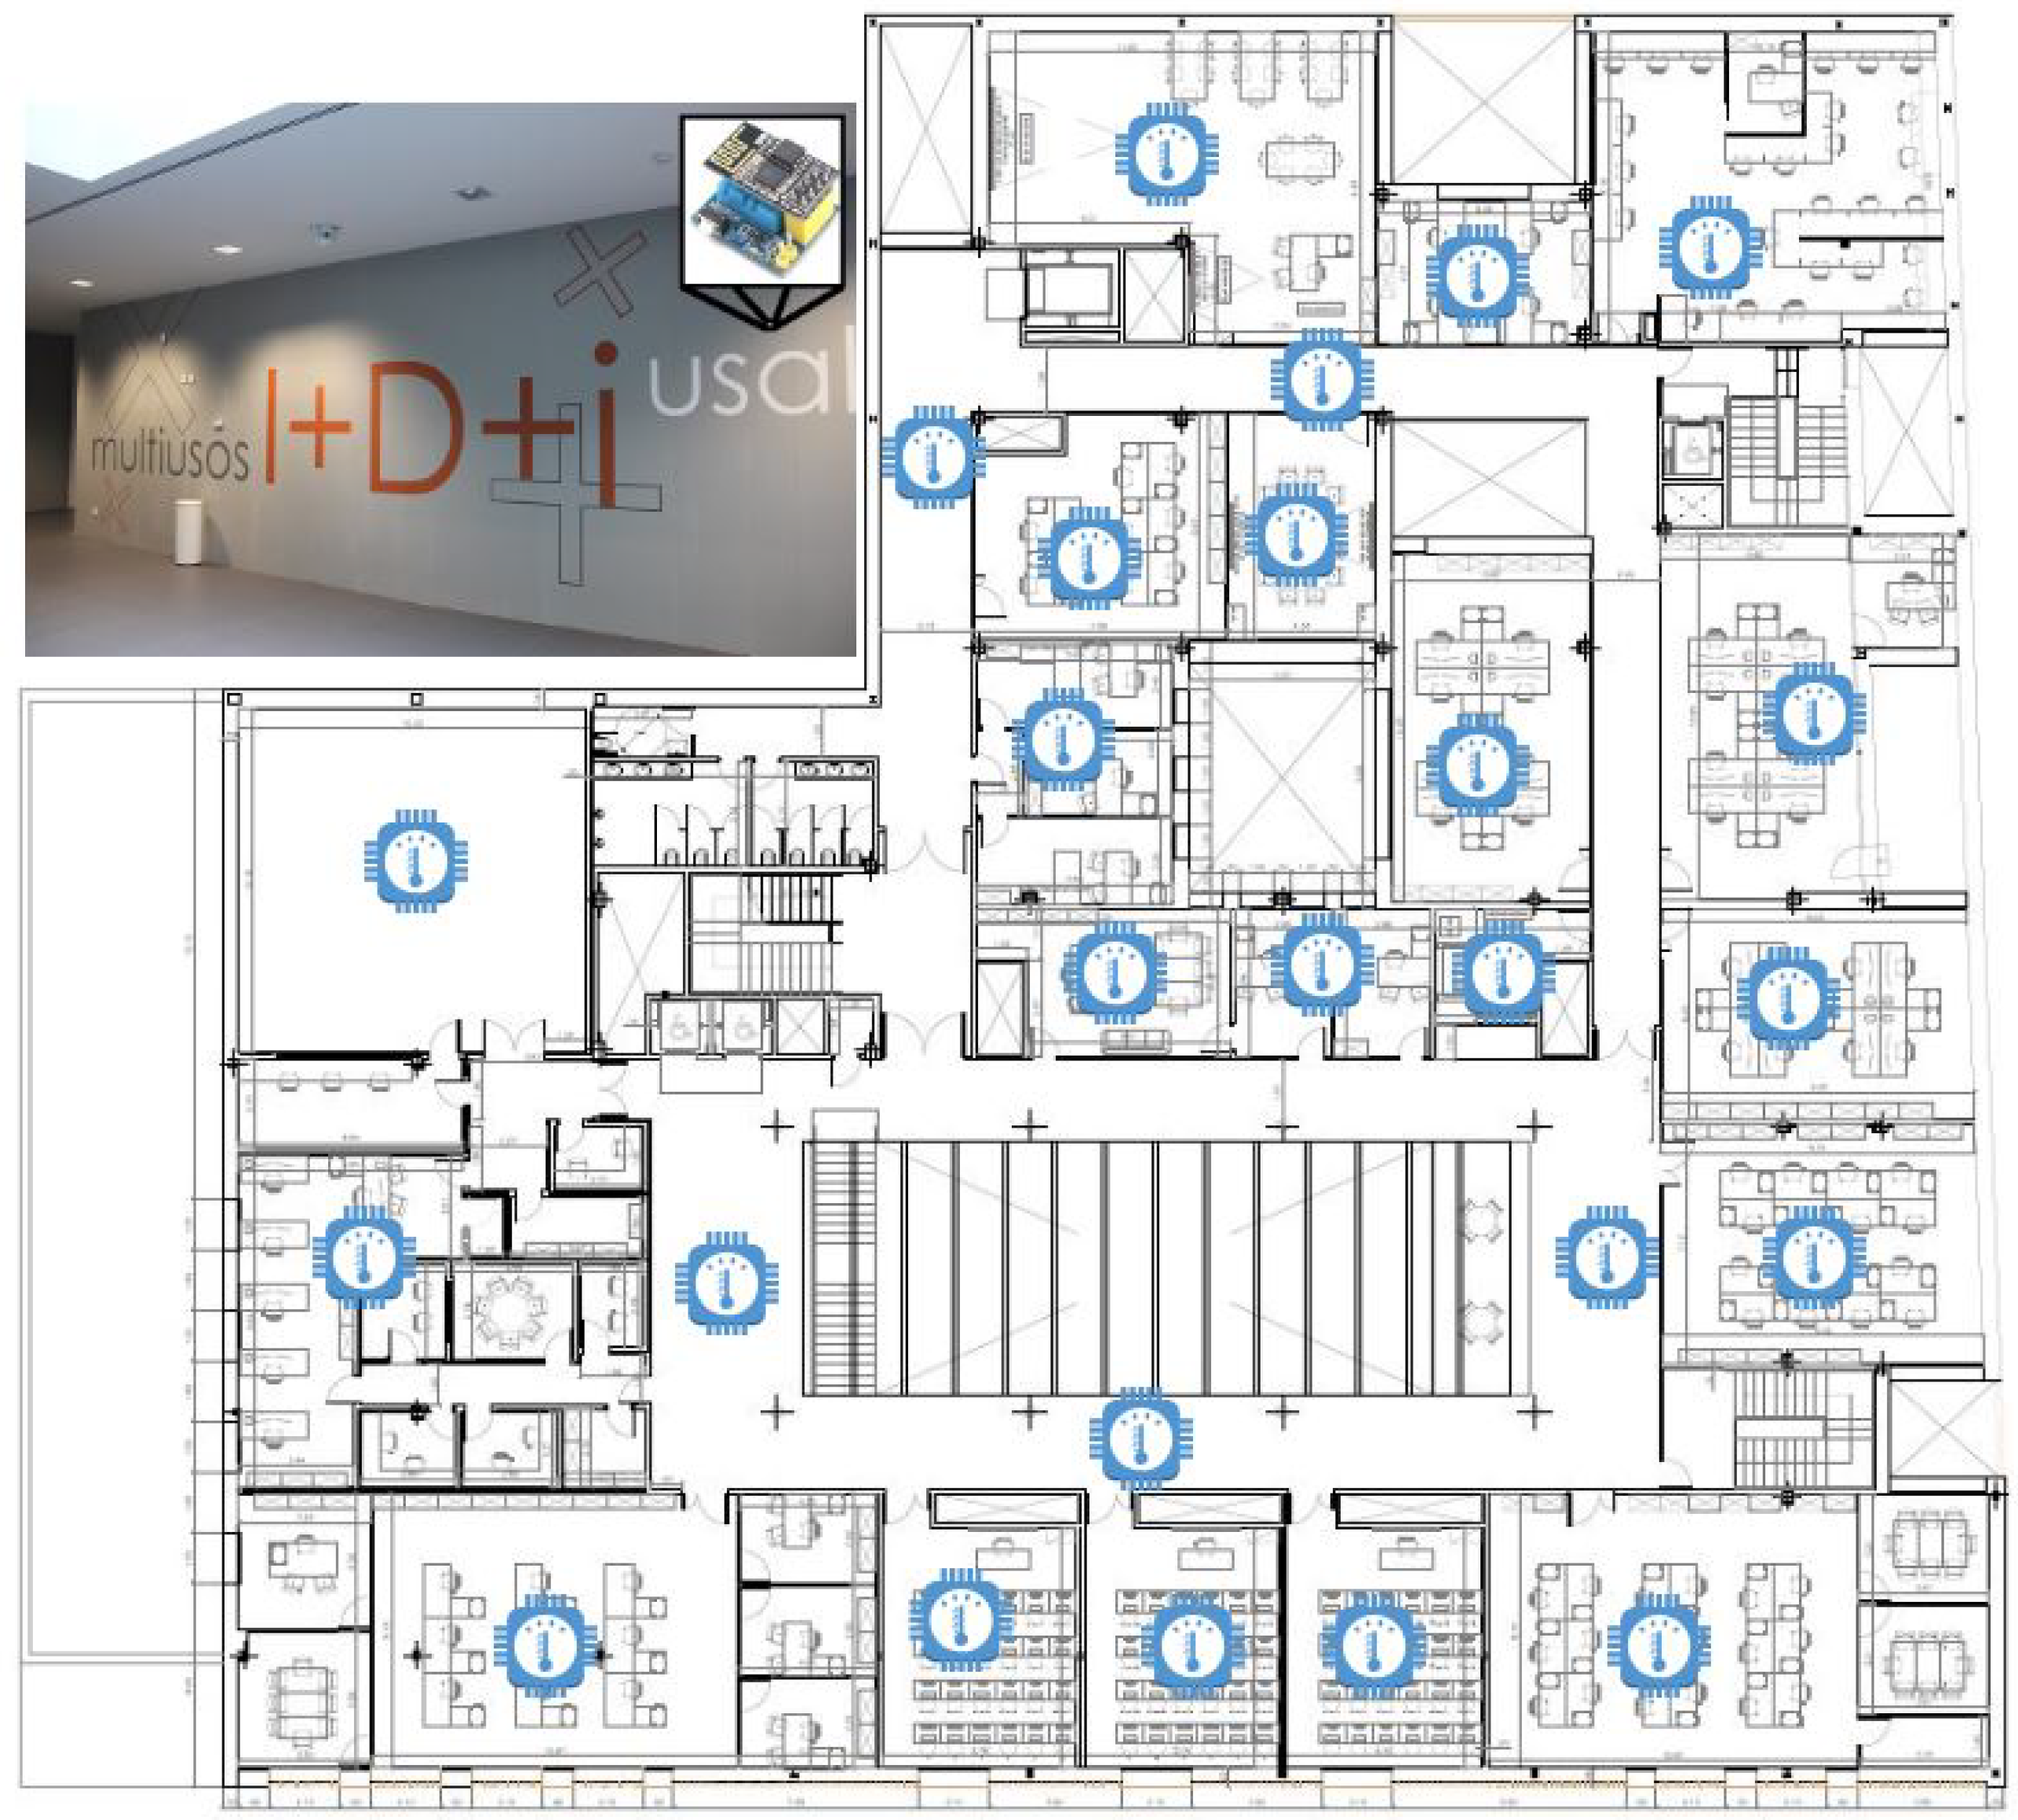
To test the proposed stability criterion, we have chosen a smart building. The chosen smart building is one of the buildings of the University of Salamanca; the R&D building, located on Espejo Street. This building is a center of reference for the region of Castilla y Leon, both nationally (Spain) and internationally. Built between 2010 and 2014, 25 million euros have been invested in its building and equipment. It implements the latest energy efficiency technologies and techniques. The building has more than 13,000 square meters distributed over six floors, three of which are lower ground. Due to the size of the building and the large number of people that work there (more than 250 people), it is difficult to monitor and control its indoor temperature throughout the year. For this reason, the building was an ideal place for conducting our case study. To monitor and control the temperature in the smart building a total of 25 IoT nodes were deployed. The IoT devices were placed over a mesh in the smart building. This was done with the help of laser levels, which made it possible to place the IoT devices vertically one in every section of the building. The smart building where the case study was deployed is shown in Figure 2.
The type of sensor deployed in the building was a combination of the ESP8266 microcontroller in its commercial version “ESP-01” and of a DHT22 temperature and humidity IoT node. This combination gives greater flexibility (e.g., in comparison to the previous version of this model, the DHT22 sensor measures temperature within this range: 0 ° to 50 ° Celsius. Moreover, it has an accuracy of +/−0.5 ° Celsius.) The temperature IoT device had been collecting data at 15 min intervals, for 6 h in the same day. For the analysis we selected the data collected by the sensors in the following time interval 2020-06-17T08:30:00Z–2020-06-17T14:30:00Z. To test the efficiency of the temperature algorithm, disturbances in the temperature of the building were introduced at 1 h intervals, simulating the random behavior of the employees’ thermostat use (i.e., a group of people could set the thermostats in their offices at different temperatures). Below, Table 1 presents a statistical summary of the measurements collected by the IoT devices.

5.2. Case Study Results and Discussions

The case study aims to test the efficiency of the new stability criterion proposed in this paper. This stability criterion is designed to determine whether the IoT system is stable or not. The case study has been conducted in a real environment, as described in this section, an IoT system has been deployed in a smart building. The IoT network collected temperature data which were then processed by the stability criterion to assess the stability of the IoT system in real time.
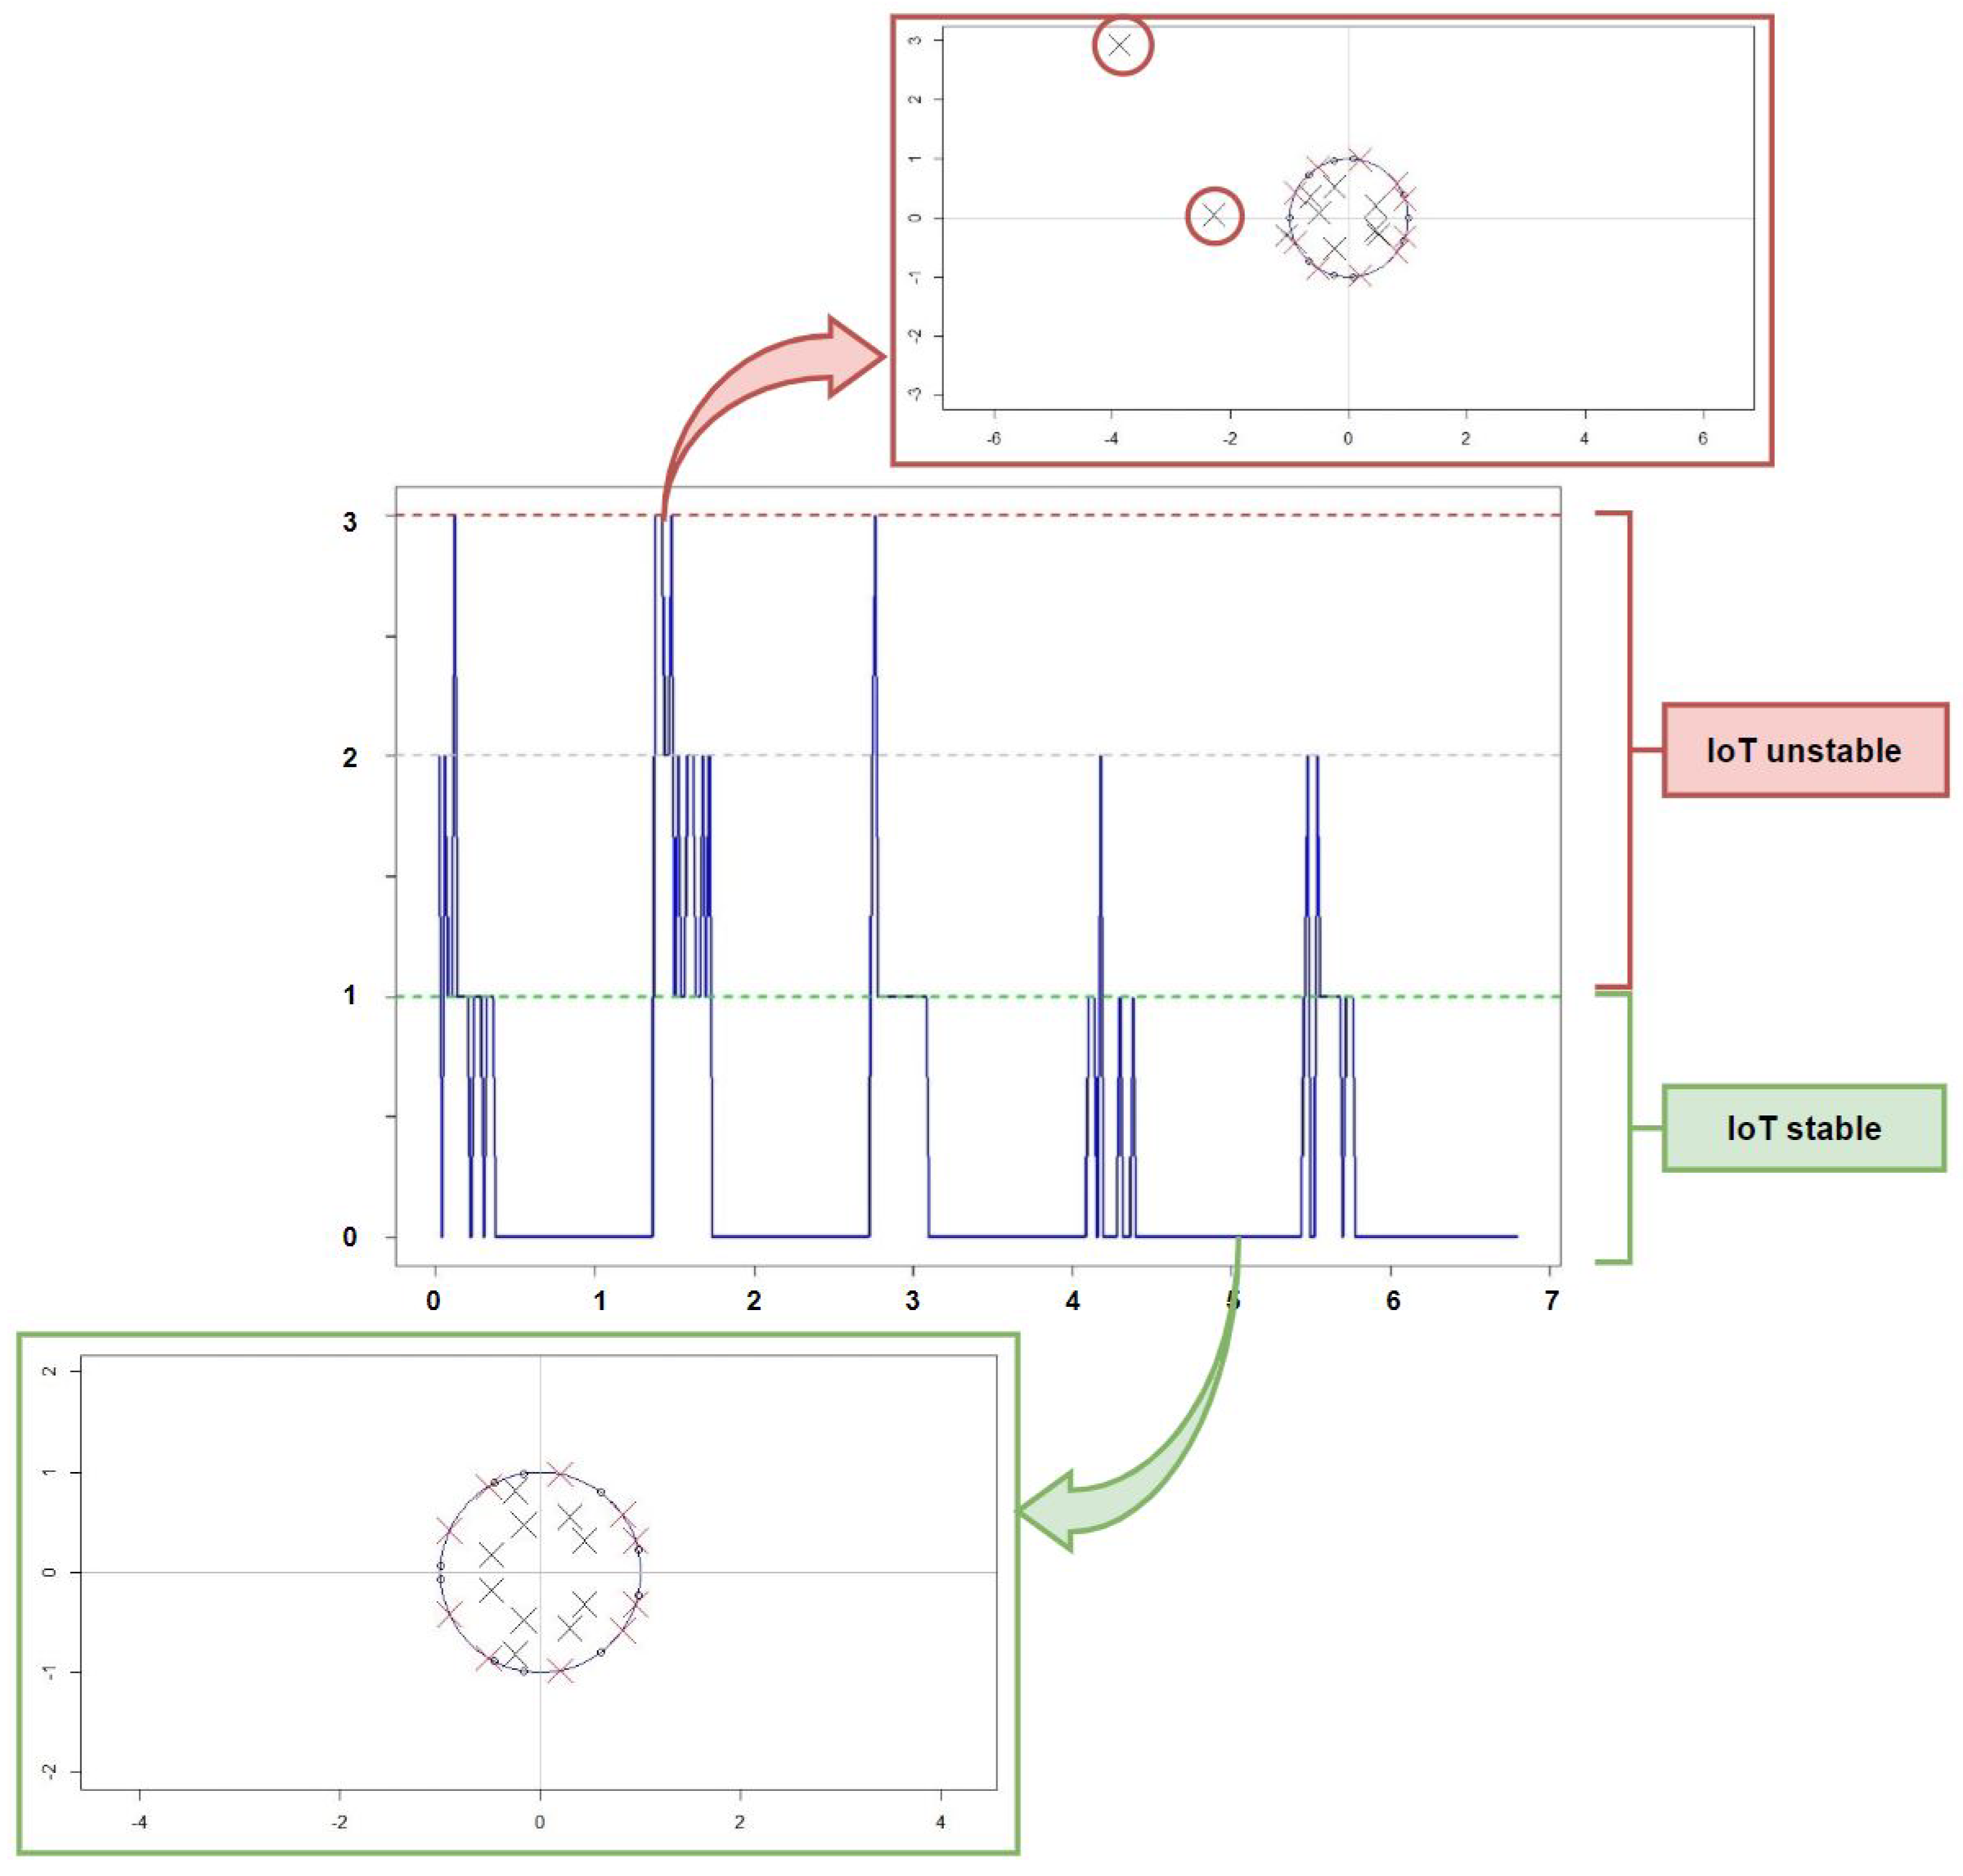
In Figure 3, one can see the results of the experiment. On the x-axis the time is measured, while on the y-axis the absolute value of the eigenvalues of the P matrix is evaluated. In this figure the disturbances that have been introduced during the experiment are detected; in fact, the stability criterion proposed in this paper classifies the system as unstable. We have zoomed in on 2 parts of the figure: (1) The IoT system is unstable. When zooming (network) one can see the internal functioning of the stability criterion by detecting how 2 of the eigenvalues of P are on the disk D ( 0 , 1 ) , these 2 eigenvalues are on the circles network. (2) The IoT system is stable. In this case, (green) one can see how all eigenvalues of P are inside disk D ( 0 , 1 ) which means that the IoT system is stable.
Control algorithms are designed to detect even the smallest disturbances in the IoT network and they are to reach equilibrium in the shortest possible time (i.e., they optimize the settling time); their continuous execution leads to high energy expenses. As a solution to this problem, a new stability criterion has been proposed in this research work. It made it possible to establish confidence margins, meaning that the control algorithm was executed only when significant disturbances occurred in the system. This, as demonstrated in the conducted case study, has improved the efficiency of monitoring and control in smart buildings.

6. Conclusions

In this paper, we proposed a novel stability criterion for IoT systems in smart buildings. This criterion is based on the associated IoT graph and its Laplacian IoT matrix. We study how the disturbances affect the stability of the IoT network implemented in a smart building to improve the detection of disturbances and enhance the operation of control algorithms. We performed a numerical study of the IoT stability criterion in three simulation examples. The main advantage of our stability criterion is that it is not necessary to execute a control algorithm to determine whether a system is stable or not. The numerical results demonstrate that the IoT stability criterion detects the disturbances that occur in the IoT system. Our paper has several limitations that offer opportunities for future research. We apply this stability criterion to a control algorithm in a smart building to prove that the control algorithm operates more efficiently. Also, the stability criterion is a means of pre-processing the data that is later used as the input of the IoT system control algorithm.

Author Contributions

Conceptualization, R.C.-V. and A.M.d.R.; methodology, R.S.A.; software, R.C.-V.; validation, R.C.-V., A.M.d.R. and S.T.; formal analysis, R.C.-V. and A.M.d.R.; investigation, R.C.-V. and A.M.d.R.; resources, J.M.C.; data curation, R.S.A.; writing—original draft preparation, R.C.-V., A.M.d.R., R.S.A., S.T. and J.M.C.; writing—review and editing, R.C.-V. and R.S.A.; supervision, J.M.C.; project administration, J.M.C.; funding acquisition, J.M.C. All authors have read and agreed to the published version of the manuscript.

Funding

This research received no external funding.

Acknowledgments

This work was developed as part of “Virtual-Ledgers-Tecnologías DLT/Blockchain y Cripto-IOT sobre organizaciones virtuales de agentes ligeros y su aplicación en la eficiencia en el transporte de última milla”, ID SA267P18, project cofinanced by Junta Castilla y León, Consejería de Educación, and FEDER funds.

Conflicts of Interest

The authors declare no conflict of interest.

References

  1. Lee, I.; Lee, K. The Internet of Things (IoT): Applications, investments, and challenges for enterprises. Bus. Horizons 2015, 58, 431–440. [Google Scholar] [CrossRef]
  2. Casado-Vara, R.; Chamoso, P.; De la Prieta, F.; Prieto, J.; Corchado, J.M. Non-linear adaptive closed-loop control system for improved efficiency in IoT-blockchain management. Inf. Fusion 2019, 49, 227–239. [Google Scholar] [CrossRef]
  3. Lim, C.; Maglio, P.P. Data-driven understanding of smart service systems through text mining. Serv. Sci. 2018, 10, 154–180. [Google Scholar] [CrossRef] [Green Version]
  4. Krejcar, O.; Maresova, P.; Selamat, A.; Melero, F.J.; Barakovic, S.; Husic, J.B.; Herrera-Viedma, E.; Frischer, R.; Kuca, K. Smart Furniture as a Component of a Smart City—Definition Based on Key Technologies Specification. IEEE Access 2019, 7, 94822–94839. [Google Scholar] [CrossRef]
  5. Parra, L.; Rocher, J.; Sendra, S.; Lloret, J. An Energy-Efficient IoT Group-Based Architecture for Smart Cities. In Energy Conservation for IoT Devices; Springer: Singapore, 2019; pp. 111–127. [Google Scholar]
  6. Liu, Y.; Yang, C.; Jiang, L.; Xie, S.; Zhang, Y. Intelligent edge computing for IoT-based energy management in smart cities. IEEE Netw. 2019, 33, 111–117. [Google Scholar] [CrossRef]
  7. Tu, Y. Distribution Network Operation Control Algorithm for Distributed Data Quality Management System. Int. J. Perform. Eng. 2020, 16, 766–774. [Google Scholar]
  8. Wang, J.; Chang, N.C.P.; Feng, X.; Monti, A. Design of a generalized control algorithm for parallel inverters for smooth microgrid transition operation. IEEE Trans. Ind. Electron. 2015, 62, 4900–4914. [Google Scholar] [CrossRef]
  9. Plageras, A.P.; Psannis, K.E.; Stergiou, C.; Wang, H.; Gupta, B.B. Efficient IoT-based sensor BIG Data collection—Processing and analysis in smart buildings. Future Gener. Comput. Syst. 2018, 82, 349–357. [Google Scholar] [CrossRef]
  10. Minoli, D.; Sohraby, K.; Occhiogrosso, B. IoT considerations, requirements, and architectures for smart buildings—Energy optimization and next-generation building management systems. IEEE Internet Things J. 2017, 4, 269–283. [Google Scholar] [CrossRef]
  11. Bianchini, G.; Casini, M.; Vicino, A.; Zarrilli, D. Demand-response in building heating systems: A Model Predictive Control approach. Appl. Energy 2016, 168, 159–170. [Google Scholar] [CrossRef]
  12. Javed, A.; Larijani, H.; Ahmadinia, A.; Emmanuel, R.; Mannion, M.; Gibson, D. Design and implementation of a cloud enabled random neural network-based decentralized smart controller with intelligent sensor nodes for HVAC. IEEE Internet Things J. 2016, 4, 393–403. [Google Scholar] [CrossRef] [Green Version]
  13. Grigsby, L.L. Power System Stability and Control; CRC Press: Boca Raton, FL, USA, 2016. [Google Scholar]
  14. Biggs, N.; Biggs, N.L.; Norman, B. Algebraic Graph Theory; Cambridge University Press: Cambridge, UK, 1993; Volume 67. [Google Scholar]
  15. Cvetkovic, D.M.; Doob, M.; Sachs, H. Spectra of Graphs; Academic Press: New York, NY, USA, 1980; Volume 10. [Google Scholar]
  16. Trinajstic, N. Chemical Graph Theory; Routledge: London, UK, 2018. [Google Scholar]
  17. Ortega, A.; Frossard, P.; Kovačević, J.; Moura, J.M.; Vandergheynst, P. Graph signal processing: Overview, challenges, and applications. Proc. IEEE 2018, 106, 808–828. [Google Scholar] [CrossRef] [Green Version]
  18. Gao, W.; Wu, H.; Siddiqui, M.K.; Baig, A.Q. Study of biological networks using graph theory. Saudi J. Biol. Sci. 2018, 25, 1212–1219. [Google Scholar] [CrossRef] [PubMed]
  19. Wang, J.L.; Adhikari, G.; Kobayashi, H.; Tsukiji, N.; Hirano, M.; Kurihara, K.; Nagahama, A.; Noda, I.; Yoshii, K. Analysis and Design of Operational Amplifier Stability Using Routh-Hurwitz Stability Criterion. In Applied Mechanics and Materials; Trans Tech Publications: Warwick, NY, USA, 2019; Volume 888, pp. 1–10. [Google Scholar]
  20. Ng, Y.X.; Phang, C. Computation of Stability Criterion for Fractional Shimizu–Morioka System Using Optimal Routh—Hurwitz Conditions. Computation 2019, 7, 23. [Google Scholar] [CrossRef] [Green Version]
  21. Zhang, Y.; Qi, Z.; Yang, M.; Guo, J.; Huang, H. Step-width theoretics and numerics of four-point general DTZN model for future minimization using Jury stability criterion. Neurocomputing 2019, 357, 231–239. [Google Scholar] [CrossRef]
  22. Proskurnikov, A.V.; Matveev, A.S. Tsypkin and Jury—Lee criteria for synchronization and stability of discrete-time multiagent systems. Autom. Remote Control 2018, 79, 1057–1073. [Google Scholar] [CrossRef]
  23. Nguyen, T.S.; Likitlersuang, S.; Jotisankasa, A. Influence of the spatial variability of the root cohesion on a slope-scale stability model: A case study of residual soil slope in Thailand. Bull. Eng. Geol. Environ. 2019, 78, 3337–3351. [Google Scholar] [CrossRef]
  24. Lumbreras, D.; Barrios, E.L.; Urtasun, A.; Ursua, A.; Marroyo, L.; Sanchis, P. On the Stability of Advanced Power Electronic Converters: The Generalized Bode Criterion. IEEE Trans. Power Electron. 2018, 34, 9247–9262. [Google Scholar] [CrossRef]
  25. Kao, C.Y.; Lincoln, B. Simple stability criteria for systems with time-varying delays. Automatica 2004, 40, 1429–1434. [Google Scholar] [CrossRef]
  26. Homod, R.Z. Analysis and optimization of HVAC control systems based on energy and performance considerations for smart buildings. Renew. Energy 2018, 126, 49–64. [Google Scholar] [CrossRef]
  27. Casado-Vara, R.; Martin-del, R.A.; Affes, S.; Prieto, J.; Corchado, J.M. IoT network slicing on virtual layers of homogeneous data for improved algorithm operation in smart buildings. Future Gener. Comput. Syst. 2020, 102, 965–977. [Google Scholar] [CrossRef]
  28. Casado-Vara, R.; Prieto-Castrillo, F.; Corchado, J.M. A game theory approach for cooperative control to improve data quality and false data detection in WSN. Int. J. Robust Nonlinear Control 2018, 28, 5087–5102. [Google Scholar] [CrossRef]
  29. Killian, M.; Zauner, M.; Kozek, M. Comprehensive smart home energy management system using mixed-integer quadratic-programming. Appl. Energy 2018, 222, 662–672. [Google Scholar] [CrossRef]
  30. Casado-Vara, R.; Vale, Z.; Prieto, J.; Corchado, J. Fault-tolerant temperature control algorithm for IoT networks in smart buildings. Energies 2018, 11, 3430. [Google Scholar] [CrossRef] [Green Version]
  31. Casado-Vara, R.; Novais, P.; Gil, A.B.; Prieto, J.; Corchado, J.M. Distributed continuous-time fault estimation control for multiple devices in IoT networks. IEEE Access 2019, 7, 11972–11984. [Google Scholar] [CrossRef]
  32. Franklin, J.N. Matrix Theory; Courier Corporation: North Chelmsford, MA, USA, 2012. [Google Scholar]
  33. Hau, N.H.; Tinh, T.T.; Tuong, H.A.; Wong, W.K. Review of Matrix Theory with Applications in Education and Decision Sciences. Adv. Decis. Sci. 2020, 24, 28–69. [Google Scholar]
  34. Bauer, F.L. Fields of values and Gershgorin disks. Numer. Math. 1968, 12, 91–95. [Google Scholar] [CrossRef]
  35. Curran, P.F. On a Variation of the Gershgorin Circle Theorem with Applications to Stability Theory; IET: Dublin, Ireland, 2009. [Google Scholar]
  36. Stewart, G.W. Gershgorin theory for the generalized eigenvalue problem Ax = λBx. Math. Comput. 1975, 29, 600–606. [Google Scholar] [CrossRef]
  37. Greenbaum, A.; Li, R.C.; Overton, M.L. First-order perturbation theory for eigenvalues and eigenvectors. SIAM Rev. 2020, 62, 463–482. [Google Scholar] [CrossRef]
  38. Bauer, F.L.; Fike, C.T. Norms and exclusion theorems. Numer. Math. 1960, 2, 137–141. [Google Scholar] [CrossRef]
  39. Deif, A.S. Realistic a priori and a posteriori error bounds for computed eigenvalues. IMA J. Numer. Anal. 1990, 10, 323–329. [Google Scholar] [CrossRef]
  40. Finner, H. A generalization of Holder’s inequality and some probability inequalities. Ann. Probab. 1992, 20, 1893–1901. [Google Scholar] [CrossRef]
Figure 1. Illustrative example of how the construction of a graph is based on the position of the IoT nodes on a map. On the top of the figure is a floor plan of the building with IoT devices placed to collect data. On the bottom there is the IoT Graph linked with the IoT system. The Spectral Graph Theory can be applied to support us to provide a solution to the problem of stability in IoT systems.
Mathematics 08 01412 g001
Figure 2. A map of the smart building used in the case study. The blue symbols in the figure are the positions in which the IoT devices are placed; they collect temperature values.
Mathematics 08 01412 g002
Figure 3. The stability of the IoT system in the case study. In the figure one can see the zones of stability (green) and instability (red). During the experiment, 4 disturbances have been introduced in the temperature of the IoT system. There has also been an additional period of instability when the IoT network was first implemented in the smart building and the control algorithm had to reach the equilibrium of the IoT system. The stability criterion (i.e., absolute value of the eigenvalues of P ¯ of this case study) provides its output in two different colors: in green when the system is stable; in red when the system is unstable.
Mathematics 08 01412 g003
Table 1. Statistical table of measurements of the IoT nodes.
Timestamp StartTotal TimestampMin TempMax TempMeanStandard Deviation
2020-06-17T09:0006:00:00Z20.4 ° C24.7 ° C22.8 ° C0.87 ° C