1. Introduction and Literature Review
Disaster management, understood as the planning, organization and management of all that is needed to deal with the humanitarian aspects of emergencies, disasters or catastrophes, in order to lessen their impact on population and infrastructures, has always been in the focus of the international community. In recent decades, this global concern has given birth to a growing literature on disaster management and in humanitarian logistics, defined in the Humanitarian Logistics Conference, 2004, as the process of planning, implementing and controlling the efficient, cost-effective flow and storage of goods and materials as well as related information, from the point of origin to the point of consumption for the purpose of meeting the end requirements of beneficiaries and alleviate the suffering of vulnerable people. See the survey of Özdamar and Ertem [
1], and the books of Tomasini and Van Wassenhove [
2] and Vitoriano et al. [
3], among others, for optimization problems addressed within the Operational Research community regarding disaster management and humanitarian logistics.
The disaster management cycle comprises four successive phases, see [
2]: mitigation, preparedness, response and recovery. Each one of them comprises important logistic operations that must be planned in the most effective and efficient way. Research on these phases may focus on specific types of disasters, such as hurricanes, typhoons and cyclones [
4], earthquakes [
5], floods [
6] or wildfires [
7]; or it can address specific problems along the cycle, such as location [
6], emergency mitigation [
5,
8], prepositioning of aid distribution centers [
9], transportation and last mile distribution [
10,
11,
12] or evacuation problems [
13,
14].
Evacuation is an activity long time considered in humanitarian logistics. According to UNDRR [
15], an evacuation consists in moving people and assets temporarily to safer places before, during or after the occurrence of a hazardous event, in order to protect them. Evacuation may be required in buildings, regions or transportation means, such as trains, ships or airplanes. Due to the increasing height of buildings and the expansion of transport travel in the last century, initially, a large collection of works related with buildings, trains, airplanes and ships evacuation arose. Some examples can be found in [
13,
16,
17,
18]. In 2001, a preliminary state of the art review appeared, mainly based on building evacuation, [
19]. Some years later, on the other hand, a systematic collection of network flow models applied to regional emergency evacuation and their applications came up, see [
14].
Different types of evacuation are stated by the London Resilience Partnership in [
20], comprising self-, assisted and supported evacuation. Self-evacuation is understood as individuals moving from an unsafe place to a safer one by their own means, without any kind of assistance. In assisted evacuation the individuals are capable of traveling by themselves but require certain support (for example, information) from agencies. Finally, supported evacuation is needed if individuals require greater and specific support (for example, an ambulance) to be transported from the unsafe areas to safer ones. Self-evacuation and assisted evacuation (both often referred as car-based evacuation) have been vastly studied in the literature, facing problems like traffic congestion, clogging, bottlenecks, density waves, oscillations, patterns and panic, usually solved by nonlinear techniques and queuing theory [
18,
21,
22,
23,
24,
25]. However, and according to Houston et al. [
26], sometimes self evacuation is not an option. An example can be found at Hurricane Katrina (New Orleans, 2005), where over 40% of victims did not evacuate, either due to physical disability or because they were caring for a person with one. Support can be needed for different reasons, from people with no access to an adequate vehicle to those that require special transport means (mainly ambulances). In addition, each type of disaster often requires a different evacuation process. For example, in Hamacher and Tjandra [
19] two evacuation scenarios are considered, precautionary and life-saving operations. Furthermore, Amideo et al. [
27] stablished that hurricanes and wildfires require preventive evacuation while earthquakes and floods demand immediate post-disaster evacuation. Pyakurel et al. [
28] established that an evacuation optimizer looks for a plan on an evacuation network for an efficient transfer of the maximum quantity of evacuees from the dangerous points (sources) to safer ones (sinks) as quickly as possible. Other analyses related with evacuation planning in order to save human lives and support humanitarian relief can be found in [
29,
30].
In terms of regional evacuation, and according to Amideo et al. [
27], the related literature prior to 2011 used to be focused on shelter location-allocation and self-evacuation. The first paper on regional supported (or bus-based) evacuation is [
31], where this type of evacuation is presented as a variant of the vehicle routing problem. After this paper, few works can be found until 2017, when Shahparvari and Abbasi [
32] proposed a stochastic model for a supported evacuation to determine the required vehicles, scheduling and routing under uncertainty, with time windows and bushfire propagation and considering road availability and disruptions. Besides that, Shahparvari et al. [
33] developed a capacitated vehicle routing solution to evacuate under short-notice. Finally, the identification of the required number of vehicles and the safest routes and schedules for late evacuees it approached in [
34].
In this work, a new model for supported evacuation of vulnerable people after a disaster is presented. The model seeks to evacuate people from pick-up points to shelters with limited capacity, and it is multimodal, considering different types of vehicles; dynamic, because people reach the pick up points at different periods along the time horizon; and multi-objective. It is based on the coordination of network flows of vehicles and people, as stated in [
35], where there is a collection of evacuation models based in networks flows with discretized time. We also consider shelters with limited capacity, as in the location-allocation model presented by Sherali et al. [
6], that selects a set of candidate shelters according to the available resources and minimizes the total congestion in a car based evacuation. Capacity constraints in arcs and nodes can also be found in [
36]. Regarding the optimization criteria, a wide variety of them have been employed in the humanitarian logistics literature, see [
37]. It is important to note that the use of multi-criteria optimization methods has experienced a significant growth in the last years, mainly because they are able to help the decision maker select the best option between several alternatives, evaluating criteria that may generate conflict. An interesting example that takes into consideration multiple criteria such as cost, time, equity, reliability, security or priority can be found in [
38]. In particular, for evacuation models, different criteria have been considered in the literature. Shahparvari et al. [
7] highlighted the fact that most existing studies have focused on minimizing just the total evacuation time, and they consider two additional objectives: maximize the amount of evacuated people and minimize the usage of resources. Mejia-Argueta et al. [
39] proposed to minimize the maximum evacuation and distribution time and the total cost of relief operations, while Alçada-Almeida et al. [
40] minimized the total distance required for all the population to reach a shelter, the fire risk faced while traveling, the risks associated with staying in the shelter and the total time from the shelters to the hospital. Our model considers the maximization of the number of evacuees of different types regarding health condition and the minimization of the evacuation time and operation costs.
The main contributions of our research are the following:
The introduction of dynamism into the supported evacuation model regarding the arrival of potential evacuees to the pick up points, since we consider their arrival may happen at different of points of time during the planning horizon.
The classification of affected people requiring evacuation according to their particular situation and/or medical condition, leading to several priority levels, so that each group can be treated accordingly.
The joint consideration of objectives such us number of evacuated people, operation time and cost within a lexicographic approach, in such a way that there is no trade off among them.
The validation of the proposed model on a realistic case study based on the earthquake and tsunami that hit Indonesia in September 2018.
The structure of the remainder of this paper is as follows.
Section 2 presents the detailed description of the supported evacuation problem considered, whose mathematical formulation is proposed in
Section 3 through a lexicographic goal programming model.
Section 4 introduces the case study used to evaluate the performance of the model and analyzes the computational results provided by its resolution. Finally,
Section 5 draws some conclusions from this work.
2. Problem Description
A detailed definition of the problem approached in this paper, focused on regional supported evacuation, will be given in what follows. As stated in the previous section, to mitigate the possible effects of some disasters, agencies may determine certain areas that are necessary to evacuate for security reasons and some other areas that are safe and available to host the evacuated population. It happens frequently that a certain amount of people, for a variety of reasons, cannot evacuate from the compromised areas to safe ones by their own means, requiring additional support from public agencies to be able to evacuate. The way these vulnerable people is evacuated is the main focus of our model.
The inhabitants that cannot self-evacuate by their own means go directly to previously designated pickup points, if they are able to, according to their own feeling regarding the disaster, or are taken there by police or search and rescue teams. According to Özdamar and Ertem [
1], many factors influence the feeling of the population regarding the catastrophic situation, including demographic characteristics such as age, health status or gender, and socioeconomic ones, such as homeownership, financial conditions, prior experiences and awareness. In addition, these factors may vary significantly along time. As a result, the arrival of potentially vulnerable evacuees to the designated pick up points is clearly dynamic, and this is a key aspect of the problem.
The analysis of real cases of disasters shows that classifying the population in need of supported evacuation is necessary to prioritize appropriately the attention from the involved agencies. Houston et al. [
26] indicate that people with disabilities, medical conditions, homeless or pregnant women should be considered as high priority population and be evacuated with a higher urgency, due to their special vulnerability. Other population groups are usually classified as normal priority evacuees. However, the particular classification considered for the design of the evacuation plans may vary significantly from one case to another, so that it represents the existing situation as faithfully as possible.
Safe areas contain hospitals, for population requiring medical care, and temporary shelters, for the rest of the population, that are associated to the nodes of the network. An additional distinction between different types of shelters, as suggested in [
26], into general population shelters and shelters for people with special needs or medical needs shelters, may also be performed. All hospital and shelters have a certain capacity to accommodate evacuees that cannot be exceeded.
Transportation to safe areas during emergencies is critical in order to evacuate people who either have specific mobility issues or do not have access to transportation. For this purpose, different types of vehicles with diverse characteristics will be available. Vehicles may traverse the arcs individually or forming convoys and they can visit one or more locations several times, even though not all of them must be visited mandatorily. Each vehicle type has a certain capacity for the transportation of people that cannot be exceeded. Other characteristics, different for each vehicle type, are the fixed cost by distance unit, the variable cost depending on the amount of people transported, the possibility to traverse certain arcs depending on their conditions and the travel time required to traverse these arcs.
The operational area is a dynamic network composed by a region to be evacuated and a safe region. The streets or roads connecting the nodes are represented by arcs/edges and may be classified, depending on the requisites of the particular case, as paths/unpaved roads, local roads or within towns, highways, freeways, etc., according to their type; and as blocked or shattered, seriously damaged, partially damaged, usable, etc., according to their state and the environmental or traffic conditions. These elements determine whether a certain vehicle can traverse a certain arc or not and its maximum speed when travelling. There may also be a certain flow capacity associated to each arc that represents the maximum number of evacuees or vehicles that can traverse it per time unit.
In short, a solution of the problem must comprise a set of itineraries for the available vehicles and the corresponding flow of people moving from the affected area to the safe one, in such a way that they are compatible with each other and verify all capacity constraints given by the network. The resulting evacuation plans can be evaluated according to different criteria and, as a result, several objectives will be considered. The number of people evacuated successfully, that is to be maximized, seems the most important one. However, the evacuation time, to be minimized, is also crucial. Additionally, the operational cost, even though may not be the main focus of the decision maker, should also be minimized. All these criteria will be considered jointly within a lexicographical goal programming model, as detailed in the next section.
3. The Proposed Evacuation Model
The network of the problem is represented by a graph , where is the set of nodes, which may represent areas, cities or locations within them, and is the set of arcs (if directed) or edges (if undirected), which correspond to roads or streets that communicate the nodes. Pick up nodes from where the compromised population will be transferred to the safe areas, , are located at known places at the unsafe area. Meanwhile, temporary shelters nodes, which usually correspond to schools, universities or government buildings, ; and hospitals or medical centers, , are located at the safe areas. Finally, some transit nodes, , may also exist in the network. As stated in the previous section, edges or arcs may be classified according to the requirements of the particular case study or disaster.
Evacuees are classified into different categories depending on the criticality of their health state and the space they require on vehicles or nodes at the secured area, since they may require different transport and assistance conditions. The population is to be transported by fleets of different types of vehicles with different characteristics. All evacuation operations must be carried out within a certain monetary budget and a given time span.
3.1. Parameters of the Model and Decision Variables
Sets and indices | Set of nodes or involved areas (: ). |
| Set of edges or arcs between nodes (). |
| Discretized time periods (). |
| Set of types of people to be evacuated (). |
| Set of types of vehicles available for the evacuation (). |
| Set of goals to be achieved (). |
Parameters | Distance from node to node (or length of arc/edge when traversed by a vehicle of type . |
| Average velocity of arc/edge for a vehicle of type . |
| Budget limitation. |
| Amount of people of type to be evacuated from node at the beginning of period . |
| Priority of people of type (high or normal). |
| Space that a person of type occupies in a vehicle to be transported or in a node of the secure area. |
| Capacity for people of type at node . |
| Capacity of a vehicle of type . |
| Number of vehicles of type that are available at node at the beginning of the operation. |
| Fixed cost to traverse the arc/edge with a vehicle of type , by unit of distance. |
| Variable cost to traverse the arc/edge with a vehicle of type , by unit of distance and cargo transported. |
| Maximum velocity that a vehicle of type may reach. |
| Time required to travel the arc/edge with a vehicle of type , calculated as follows: |
| Aspiration level of goal . |
Decision variables | 1 if population with high priority has been evacuated in period t and 0, otherwise. |
| 1 if population with normal priority has been evacuated in period t and 0, otherwise. |
| Total time required to evacuate population with high priority. |
| Total time required to evacuate the rest of the population. |
| Number of people of type located at node at the beginning of period . |
| Number of people of type who started to be transported from node to node in a vehicle of type at the beginning of period . |
| Number of vehicles of type located at node at the beginning of period . |
| Number of vehicles of type that started to move from node to node at the beginning of period . |
Attribute and deviation variables | Number of people with high priority that are evacuated depending on the characteristics of the particular instance. |
| Number of people with normal priority that are evacuated depending on the characteristics of the particular instance. |
| Total time required to evacuate all the population (max. of T and ). |
| Total cost of the operation. |
| Deviation variable with respect to the aspiration level of goal . |
| Slack variable with respect to the aspiration level of goal . |
The four attributes of the model (number of people with high priority evacuated, number of people with normal priority evacuated, total evacuation time and operation cost) are considered jointly within a lexicographical goal programming approach. Each attribute is associated with an aspiration level that represents a certain value that would be satisfying for the decision maker and we seek to achieve. The unwanted deviations from the aspiration levels are measured by the deviation variables , in such a way that a zero value in one of them means the associated aspiration level has been achieved. We use a lexicographical approach because some of the considered attributes are incomparably more important than others and thus no trade offs are possible among them. This way, the objective function consists in minimizing lexicographically the four deviation variables following the order of priority of the considered attributes: (first level of priority, critical population evacuated), ’ (second level of priority, non critical population evacuated), (third level of priority, total evacuation time), (fourth level of priority, operation cost).
3.2. Mathematical Model
The proposed model is given by Equations (
1)–(25): the deviation variables of the objective function (
1) are to be minimized lexicographically, subject to constraints (
2)–(25), that define feasible evacuation plans.
Equations (
2) take care of the conservation of the flow of people along the network: for each
i,
h and
t, the amount of people of type
h that have been transported to
i up to time period
t plus the amount of people of type
h that arrived on their own to node
i up to time period
t must equal the amount of people of type
h that leave node
i up to time
t plus the ones that stay there. Node and vehicle capacities are imposed by (3) and (4), respectively. As a result, the number of people of each type that can be evacuated is calculated by (5) and (6). Analogously, Equations (7) and (8) are the vehicle flow conservation constraints.
The time period at which every high (respectively normal) priority evacuee has been moved to a safe area is given by Equation (9) (respectively (
12)), while (10) and (11) (respectively (13) and (14)) ensure binary variables
(respectively
) are defined properly. The maximum evacuation time is represented by
, following (15) and (16), and constraints related to the available budget are (17)–(19), defining the total cost as the sum of the fixed cost of moving an empty vehicle and the variable cost for transporting people.
Since we are considering a multi-objective lexicographical goal programming model, the optimal value obtained at each level leads to new constraints that are added to the following levels to ensure that the goals from previous levels are achieved. Objectives with highest priority are those related to the amount of people that is possible to evacuate. Hence, the first and second levels consist in minimizing the deviations from the stated aspiration levels of the total number of people evacuated with high or normal priority, as given in (20) and (21). The third level considers the prompt evacuation of the population, minimizing the deviation with respect to the given aspiration level, as stated in Equation (22). Finally, the minimization of the deviation of the total cost with respect to its aspiration level (see (23)) is taken into account.
4. Case Study: Palu, Indonesia
This section describes the case study used to evaluate the performance of the proposed model. It is based on the earthquake and tsunami that hit the island of Sulawesi, Indonesia, in September 2018. The Indonesian archipelago is known for its catastrophic earthquakes as well as the occurrence of landslide induced tsunamis. The earthquake and tsunami we are considering were caused by a strike-slip faulting event at shallow depth that occurred within the interior of the Molucca Sea micro-plate, which is part of the Sunda tectonic plate, see [
41].
On 28 September 2018, 10:02:44 GMT/UTC hour (local hour, WIB, 18:02:44) a series of strong earthquakes struck mainly Palu, the capital of the Indonesian province of Central Sulawesi, and Donggala. The strongest was a 7.4 M earthquake only 10 km deep with its epicenter close to Palu. The earthquake, according to the Humanitarian Country Team [
42], triggered a tsunami, whose waves reached up to three metres, that hit the northern parts of Sulawesi island and resulted in liquefaction and landslides. Furthermore, a total of 170 aftershocks occurred after the main one. As a consequence of the liquefaction and aftershocks, some roads from/to Palu were not accessible for several hours and both the port and airport were servery damaged, highly complicating the Search & Rescue and evacuation management. In particular, the BNPB (National Disaster Management Agency) declared the urgent need for planes with the ability to take off and land in short runway (specifically, Hercules C130) due to the cracks at the airport runway.
Based on the updated information from WHO, see [
43], 832 persons died, 580 were injured, more than 16,000 were displaced to temporary shelters and dozens of houses were damaged in the first 24 h. The estimated exposed population was more than 310,00 in Donggala regency and more than 350,000, in Palu.
4.1. Data
The case study has been created by using information obtained from AHA Reports [
44,
45,
46,
47,
48,
49,
50,
51]. The satellite images and geospatial data of the affected area were obtained from the Copernicus Emergency Management Service website, see [
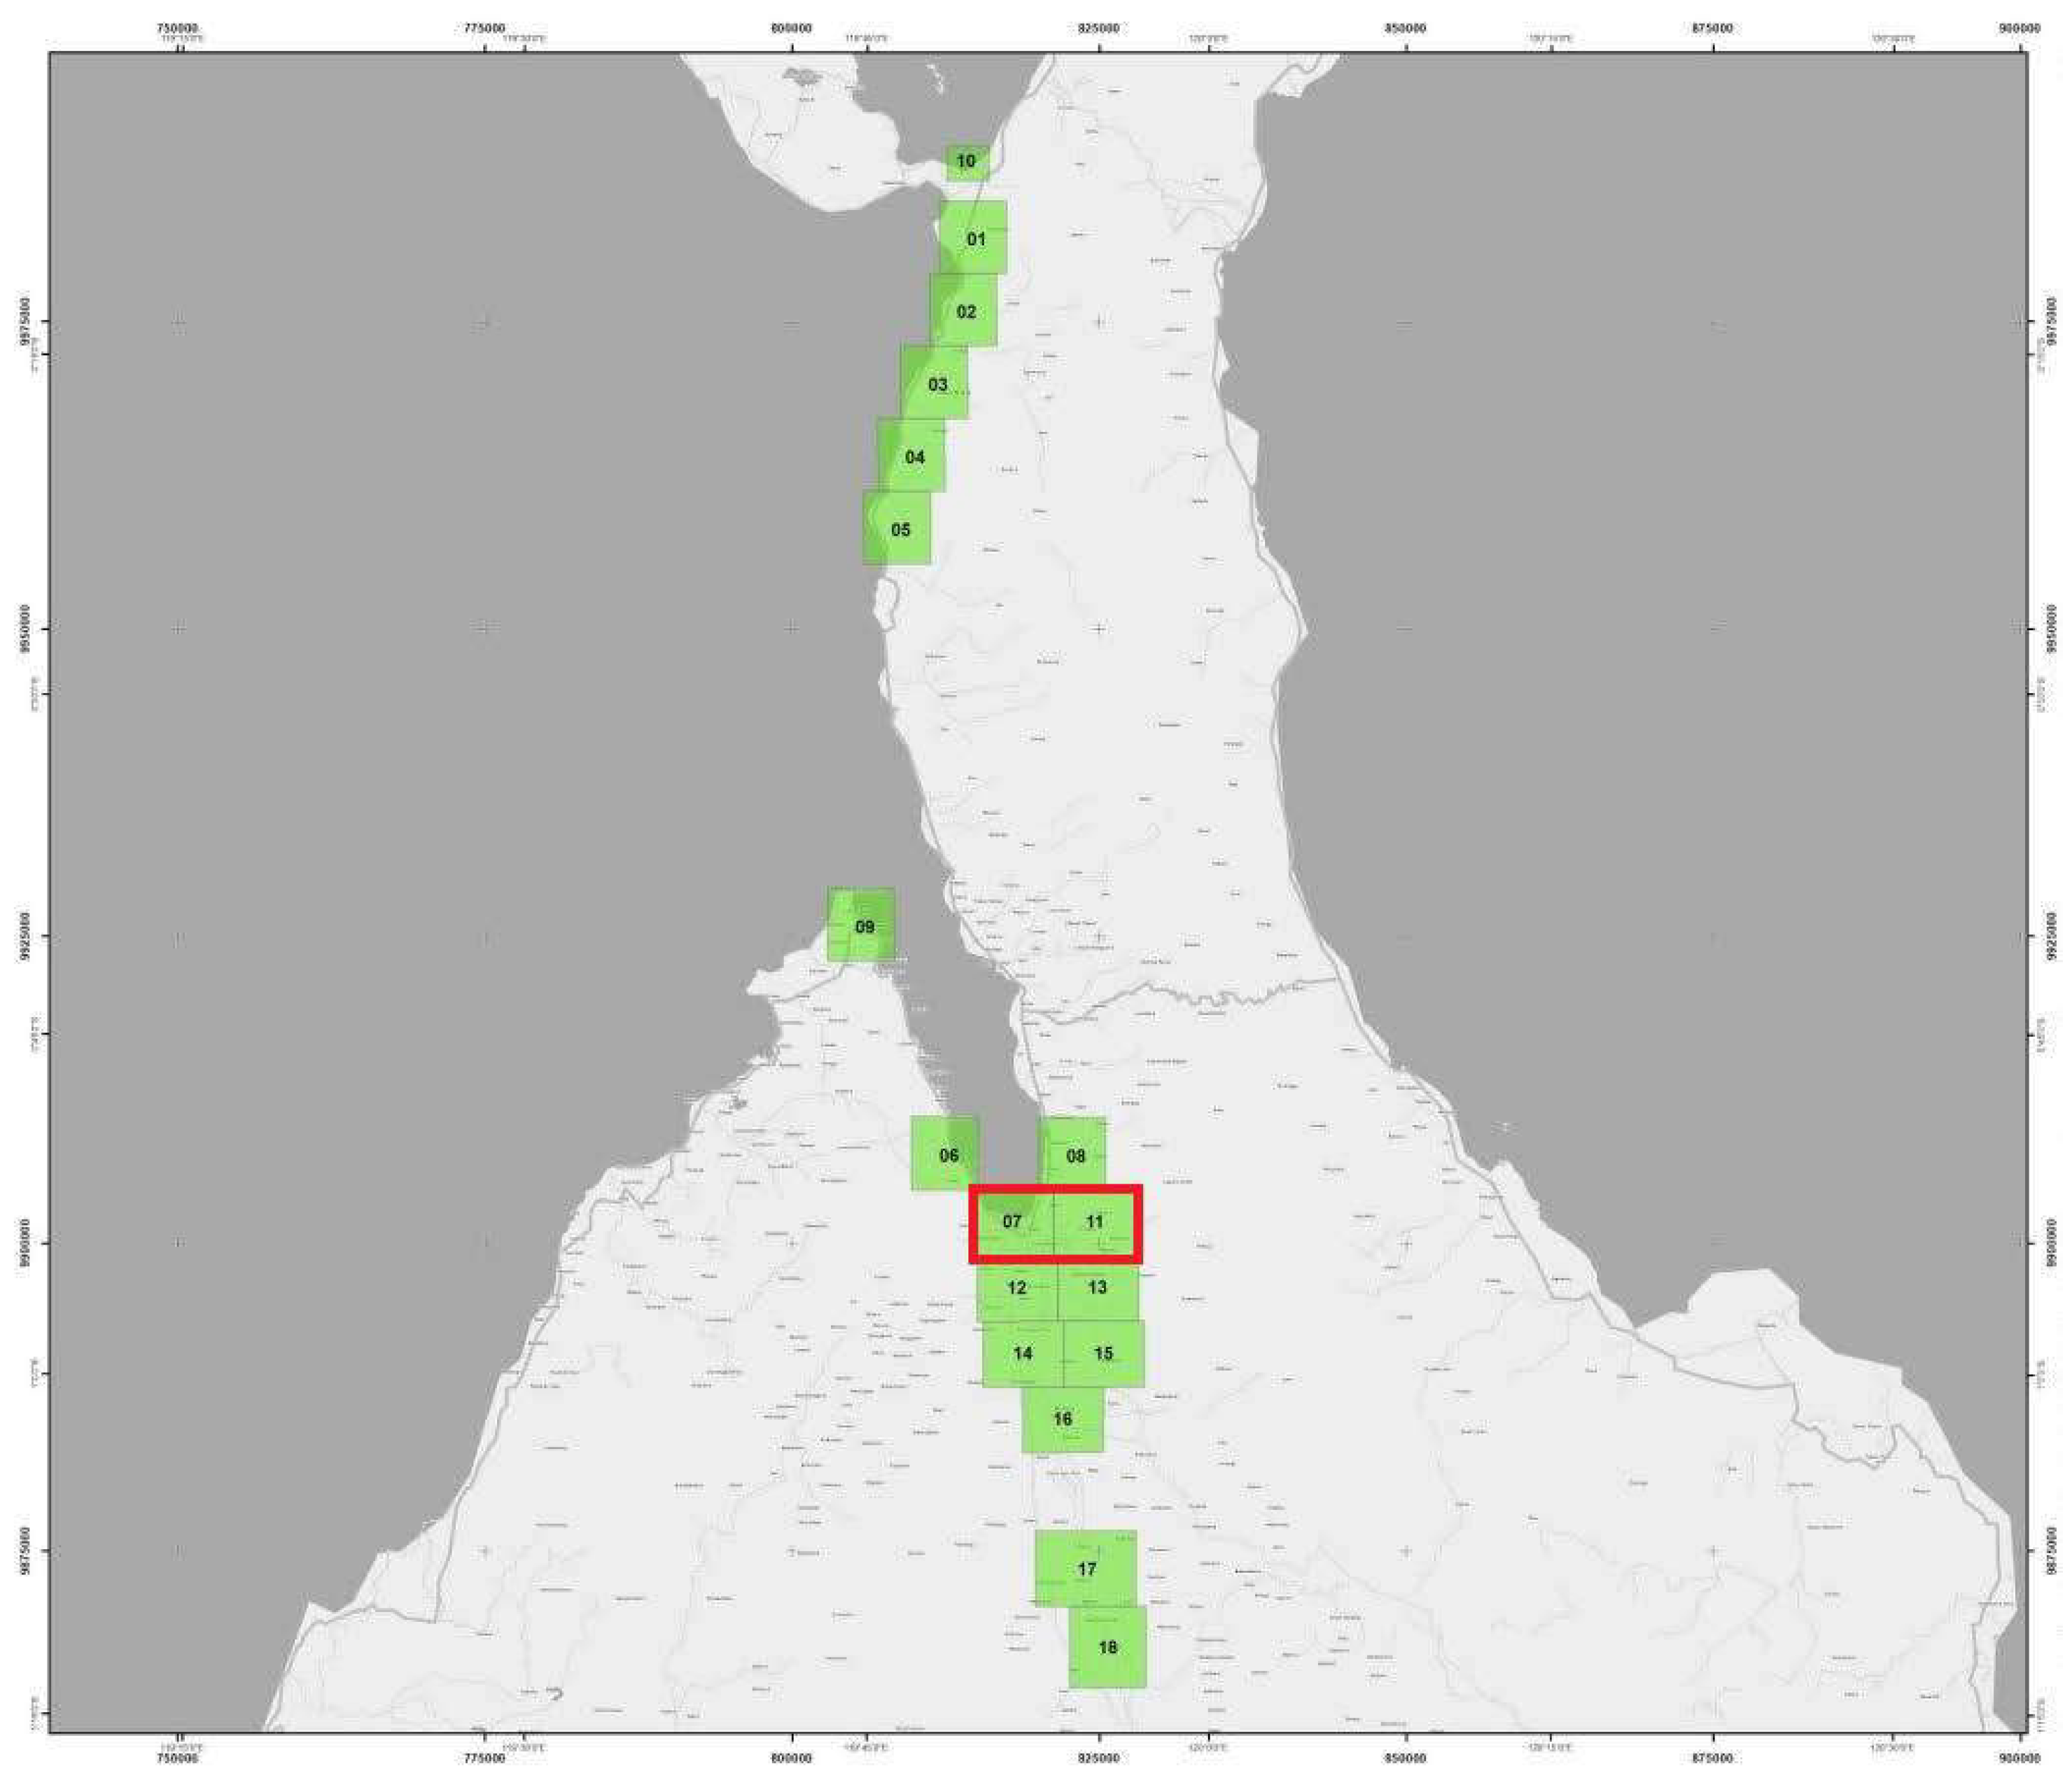
52]. The complete affected area, illustrated in
Figure 1, is located in the Sulawesi island and divided into 18 grading maps (named Areas of Interest), covering the cities and villages that suffered the shake of the earthquake and/or the impact along the coast. In particular, we have focused on the two most affected Areas of Interest (AoI), that host the most exposed population (the ones corresponding to the two squares inside the red rectangle of
Figure 1), namely AoI 7 (Palu) and AoI 11 (Palu East). Their grading maps are shown in
Figure 2, where AoI 7 corresponds to the left-hand-side figure and AoI 11 to the right-hand-side one.
The network of the case study contains 44 nodes representing locations of the city of Palu. According to their characteristics, they are classified as:
16 pickup nodes (R) located at the affected area, easily recognized by the local population and the Search & Rescue Teams, such as mosques, schools, cafes or shopping centers in relatively unaffected or lightly affected streets. The total number of affected nodes and their locations have been established according to the data of affected buildings and affected population obtained from Copernicus, [
52].
23 temporary shelter nodes (S) are real evacuation sites corresponding to real temporary shelters enabled by BASARNAS (the National Search and Rescue Agency of Indonesia), whose locations and capacities have been obtained from reports of the Government of Indonesia [
53,
54,
55]. Initially, there were only 24 evacuation sites, which amounted to 41 and, finally, to 141 on 4 October 2018. According to the time horizon and the total area of this case study, we have considered 5 large shelters, 6 medium ones and 12 small.
Hospitals and medical center nodes (H) correspond to real locations of hospitals and medical centers obtained from the same reports used to compile the data regarding temporary shelters. These nodes are the destination of severely injured people and pregnant women, especially.
Palu airport (A) is a node that corresponds to the real location of Mutiara SIS Al-Jufrie, the airport of the city. For the case study, this airport was a destination point for population to be evacuated by plane to other safer cities, especially for severely injured people that could not be treated at the available hospitals due to a lack of medical supplies or appropriate facilities.
The nodes are connected by 76 edges, whose lengths were determined by using GoogleMyMaps technology. According to the information obtained from the maps of Copernicus [
52], they represent bridges, level crossings, tunnels or roads which suffered different levels of damage, as blocked or shattered, seriously damaged, partially damaged or passable. Furthermore, they may be highways, single carriageways, local, within towns or unpaved roads. The complete graph is shown in
Figure 3.
The condition of streets and roads, due to the tsunami and the liquefaction of the ground at some areas, made necessary the participation of a diverse number of vehicles for the tasks of people search and evacuation, including helicopters, regular and inflatable boats, army trucks and ambulances. Terrestrial vehicles cannot travel by blocked or shattered arcs and it has been supposed that seriously and partially damaged connections suffer a penalization of 50% and 25% of their maximum velocity, respectively. At the beginning of the operation, ambulances are available at hospitals, while army trucks can be found at several nodes. Moreover, only blocked or shattered roads can be travelled by inflatable boat, because of the floods, water movement and the liquefaction of the terrain. At the beginning of the operation, all inflatable boats are at affected nodes, because they either belong to the neighborhood or the Search & Rescue teams leave them there. Finally, helicopters can travel following a straight line between any pair of points with heliport available and are located at hospitals and at the airport at the beginning of the operation.
Some characteristics of the vehicles such as capacity (number of not badly injured people that can be transported by each type of vehicle), mean velocity and costs are presented in
Table 1, together with the maximum amount of vehicles that can be used in the operation. The fixed cost is independent of the load of the vehicle and is paid only per unit of distance; however, the variable cost depends both on the traversed distance and on the cargo transported, being paid per unit of distance and unit of load (u.l.).
The data regarding affected people and their classification into the different categories considered before have been estimated from several public reports. For example, the data about the number of inhabitants and affected in each AoI have been obtained from the maps of Copernicus [
52], as displayed in
Table 2. The report of BNPB [
55], already mentioned, provides the number of evacuees by 1 October 2018: a total of 48,025 persons at hospitals and temporary shelters out of 60,424, the total affected population. Therefore, only around 20% of the total population evacuated to relative homes or hotels.
According to the Indonesia Humanitarian Country Team [
56], women, unaccompanied minors, adolescent mothers and other vulnerable groups such as people with disabilities, medically homebound, poor, people living with HIV or AIDS and sexual minorities, are at increased risk after the occurrence of a disaster. In fact, it has been estimated that there were around 350,000 cases of abuse, exploitation, forced or early marriage as a consequence of the particular disaster of this case study. In addition, there were cases of food shortages due to the closure of markets, roads and transports. For this reason, besides the classification according to their capacity, shelters have been classified into secure and non secure for vulnerable groups. These groups, together with severely injured people and pregnant women, have been assigned a high priority. In particular, we have considered the following population groups: severely injured adults (SIA), pregnant women (PW), unaccompanied minors (UM), women susceptible to gender violence (GBV) and the rest of the population (RP). According to Stepanov and Smith [
57], most of the remaining population who should be able to evacuate on their own usually move to homes of relatives, hotels or other shelters. The Indonesia Humanitarian Country Team [
56] established on 10.05.2018 that during the first periods of the response to this disaster, the risk of violence, exploitation or abuse is heightened and pre-existing gender inequalities may be exacerbated with an environment of impunity, where near 100,000 people were stated as under high risk. It has been assumed that at every pick-up node at the affected area, at the beginning of the operation, there was the same number of persons to be evacuated, following an uniform distribution. There are 14 nodes in AoI 7 and 2 in AoI 11. The details and number of people to be evacuated at the beginning of the operation at each AoI are given in
Table 3.
Additionally, people are assumed to be arriving to the pick up nodes dynamically, according to their feeling about the disaster and the Search & Rescue operations. The number of people arriving during each time period is estimated through Equation (
26). It is supposed that the feeling regarding the potential danger to the population decreases along time. For this reason, a decreasing exponential function is used. For the first time period, we consider the data of people to be evacuated at the beginning of the operation, displayed in
Table 3; in addition, after one sixth of the time span has gone by, we assume that no more people arrive at the pick-up points.
The capacities of the shelters for different types of people are shown in
Table 4. The data was obtained from several reports, such as [
53,
54,
55]. The authorities prioritized the evacuation of those who were injured or ill. There were flights between Mutiara Sis Al Jufri Airport, in Palu, and nearby airports, mainly at cities like Balikpapan (Sulaiman Seppinggan International Airport), Makassar (Sultan Hasanuddin International Airport), Manado (Sam Ratulangi International Airport) and Jakarta (Halim Perdanakusuma International Airport).
The time horizon considered corresponds to 72 h, discretized into 24 three-hour periods, from 28 September 2018 10 a.m. to 1 October 2018, 10 a.m. According to the Humanitarian Country Team [
42], on 9 October 2018, the HCT’s Central Sulawesi Earthquake Response Plan requested US
$ 50.5 million for the relief activities after the disaster for the assistance of 191,000 people over three months. As an estimation only for the operations and scope included in our case study, we have considered an available budget of 200,000
$.
4.2. Results
This section is devoted to present and analyze the results obtained by solving the proposed model for the base case study introduced in the previous section and several variations of it, carried out to allow for a deeper analysis of the performance of the model. The mathematical models are solved by GAMS 23.7 with a relative gap of 5% on an Intel(R) Core(TM) i5-6300HQ CPU 2.30 GH, 8G RAM running Windows 10.
The 4-level lexicographical goal programming model defined in (
1)–(25) will be solved as a way to deal with all criteria in a joint way. Each of the four goals considered requires an aspiration level, as detailed hereunder. The aspiration levels will be: evacuating all people that arrive to the pick-up points along the time horizon, both high (8790 people) and normal (7340 people) priority population (related to the first and second lexicographical levels, respectively), within 36 h, that is 50% of the time span (third lexicographical level), and using up to 50% of the total available budget (fourth lexicographical level), that is, 100,000
$. Each level leads to a mixed integer linear programming model whose size (number of constraints, variables, non-zero elements and discrete variables) is given in
Table 5, emphasizing the large dimensions of realistic case studies as the one considered here.
Solving the four levels lexicographically, ensuring that the deviation from the aspiration level of the previous goal is maintained in the following levels, a solution is obtained in which 98.36% of high priority and 92.89% of normal priority population are evacuated with an operation time of 72 h (twice as desired) and a cost significantly below the aspiration level (54,956.13
$). Nearly all the high priority population is evacuated, as well as most of the normal priority population, and the cost is quite restrained; however, the whole time span considered in the model is required to complete the evacuation.
Figure 4 illustrates the location of evacuees at the end of the operation in this solution and the detailed information regarding the amount of people of each category that stay at each node can be found in
Table 6. Both representations state that most of evacuees are located at safe nodes at the end of the operation. In particular, Mako Sabhara (S03), in the east of Palu river, and Makorem area (S02), in the west, sheltered a very high number of evacuees due to their location and capacity. Additionally, it must be pointed out that S02 is a normal shelter and S03 a safe one, which means that these shelters accommodate people with both high and normal priorities. The next location hosting the highest number of remaining evacuees is the airport, from where they could be transported to other nearby cities. On the other hand, it is important to highlight the fact that, in practice, the information regarding the people that could not be evacuated and remain at unsafe areas (number of people, location, health condition, etc.) is shared with other agencies, in order to coordinate the complete evacuation of all affected population.
To provide a more detailed example regarding a particular group of affected people,
Figure 5 illustrates how the evacuation of women susceptible to GBV was performed. In particular, it shows the time period (or periods) in which women susceptible to GBV start being transported from one node to another and the type of vehicle used for transportation. Square brackets represent different periods where the same path and type of vehicle are used. It can be seen how trucks is the most widely used type of vehicle, even though helicopters, ambulances and rafts are also used at certain points.
In order to further evaluate the performance of the model in different situations, several specific modifications were performed on the case study and the resulting lexicographical goal programming problems were resolved again. For example, as stated by the International Civil Aviation Organization of OCHA [
58], the Palu airport suffered a great amount of damage and it could not be used during the first hours of the evacuation operation. As a result, it could be interesting to analyze what may happen if the airport is assumed to be unavailable in the network of the case study. In this situation, 8601 people with high priority (97.85%) and 6824 with normal priority (92.94%) could be evacuated, which is quite similar to what could be achieved originally, and within the same operation time; however, without the airport being available, this can only be achieved at a significantly higher cost of 59,019.69
$. A similar situation could arise if the hospitals were unavailable as safe locations for the evacuees. In that case, less high priority population could be evacuated (7764 people, 88.33%), but this would allow the evacuation of more normal priority population (7035 people, 95.84%). The operation time would be unchanged and the cost would be slightly higher (56,204.31
$).
Another usual limitation that is often found during or after the occurrence of a disaster is the lack of certain types of vehicles. Since the number and types of vehicles available for the evacuation operation may influence significantly on the results, we have resolved the case study removing some of them. For example, without helicopters, less high priority population (8527, 97.01%), but slightly more normal priority population (6829, 93.01%), can be evacuated, with the same operation time (72 h) and a higher cost (57,792.54$). Meanwhile, the solution without rafts shows that only 8422 (95.81%) of the high priority population and 6827 (92.99%) of the normal priority population could be evacuated. This could be done three hours faster, but with a much higher cost of 70,142.55$. The case in which trucks are not available is especially extreme, because without them very few people could be evacuated: namely, only 40.52% and 2.06% of the high and normal priority population, respectively. Furthermore, 72 h are still necessary to complete the operation, which only costs 5292$. This happens because most of the available vehicles are actually trucks and, in addition, this type of vehicle has the highest capacity.
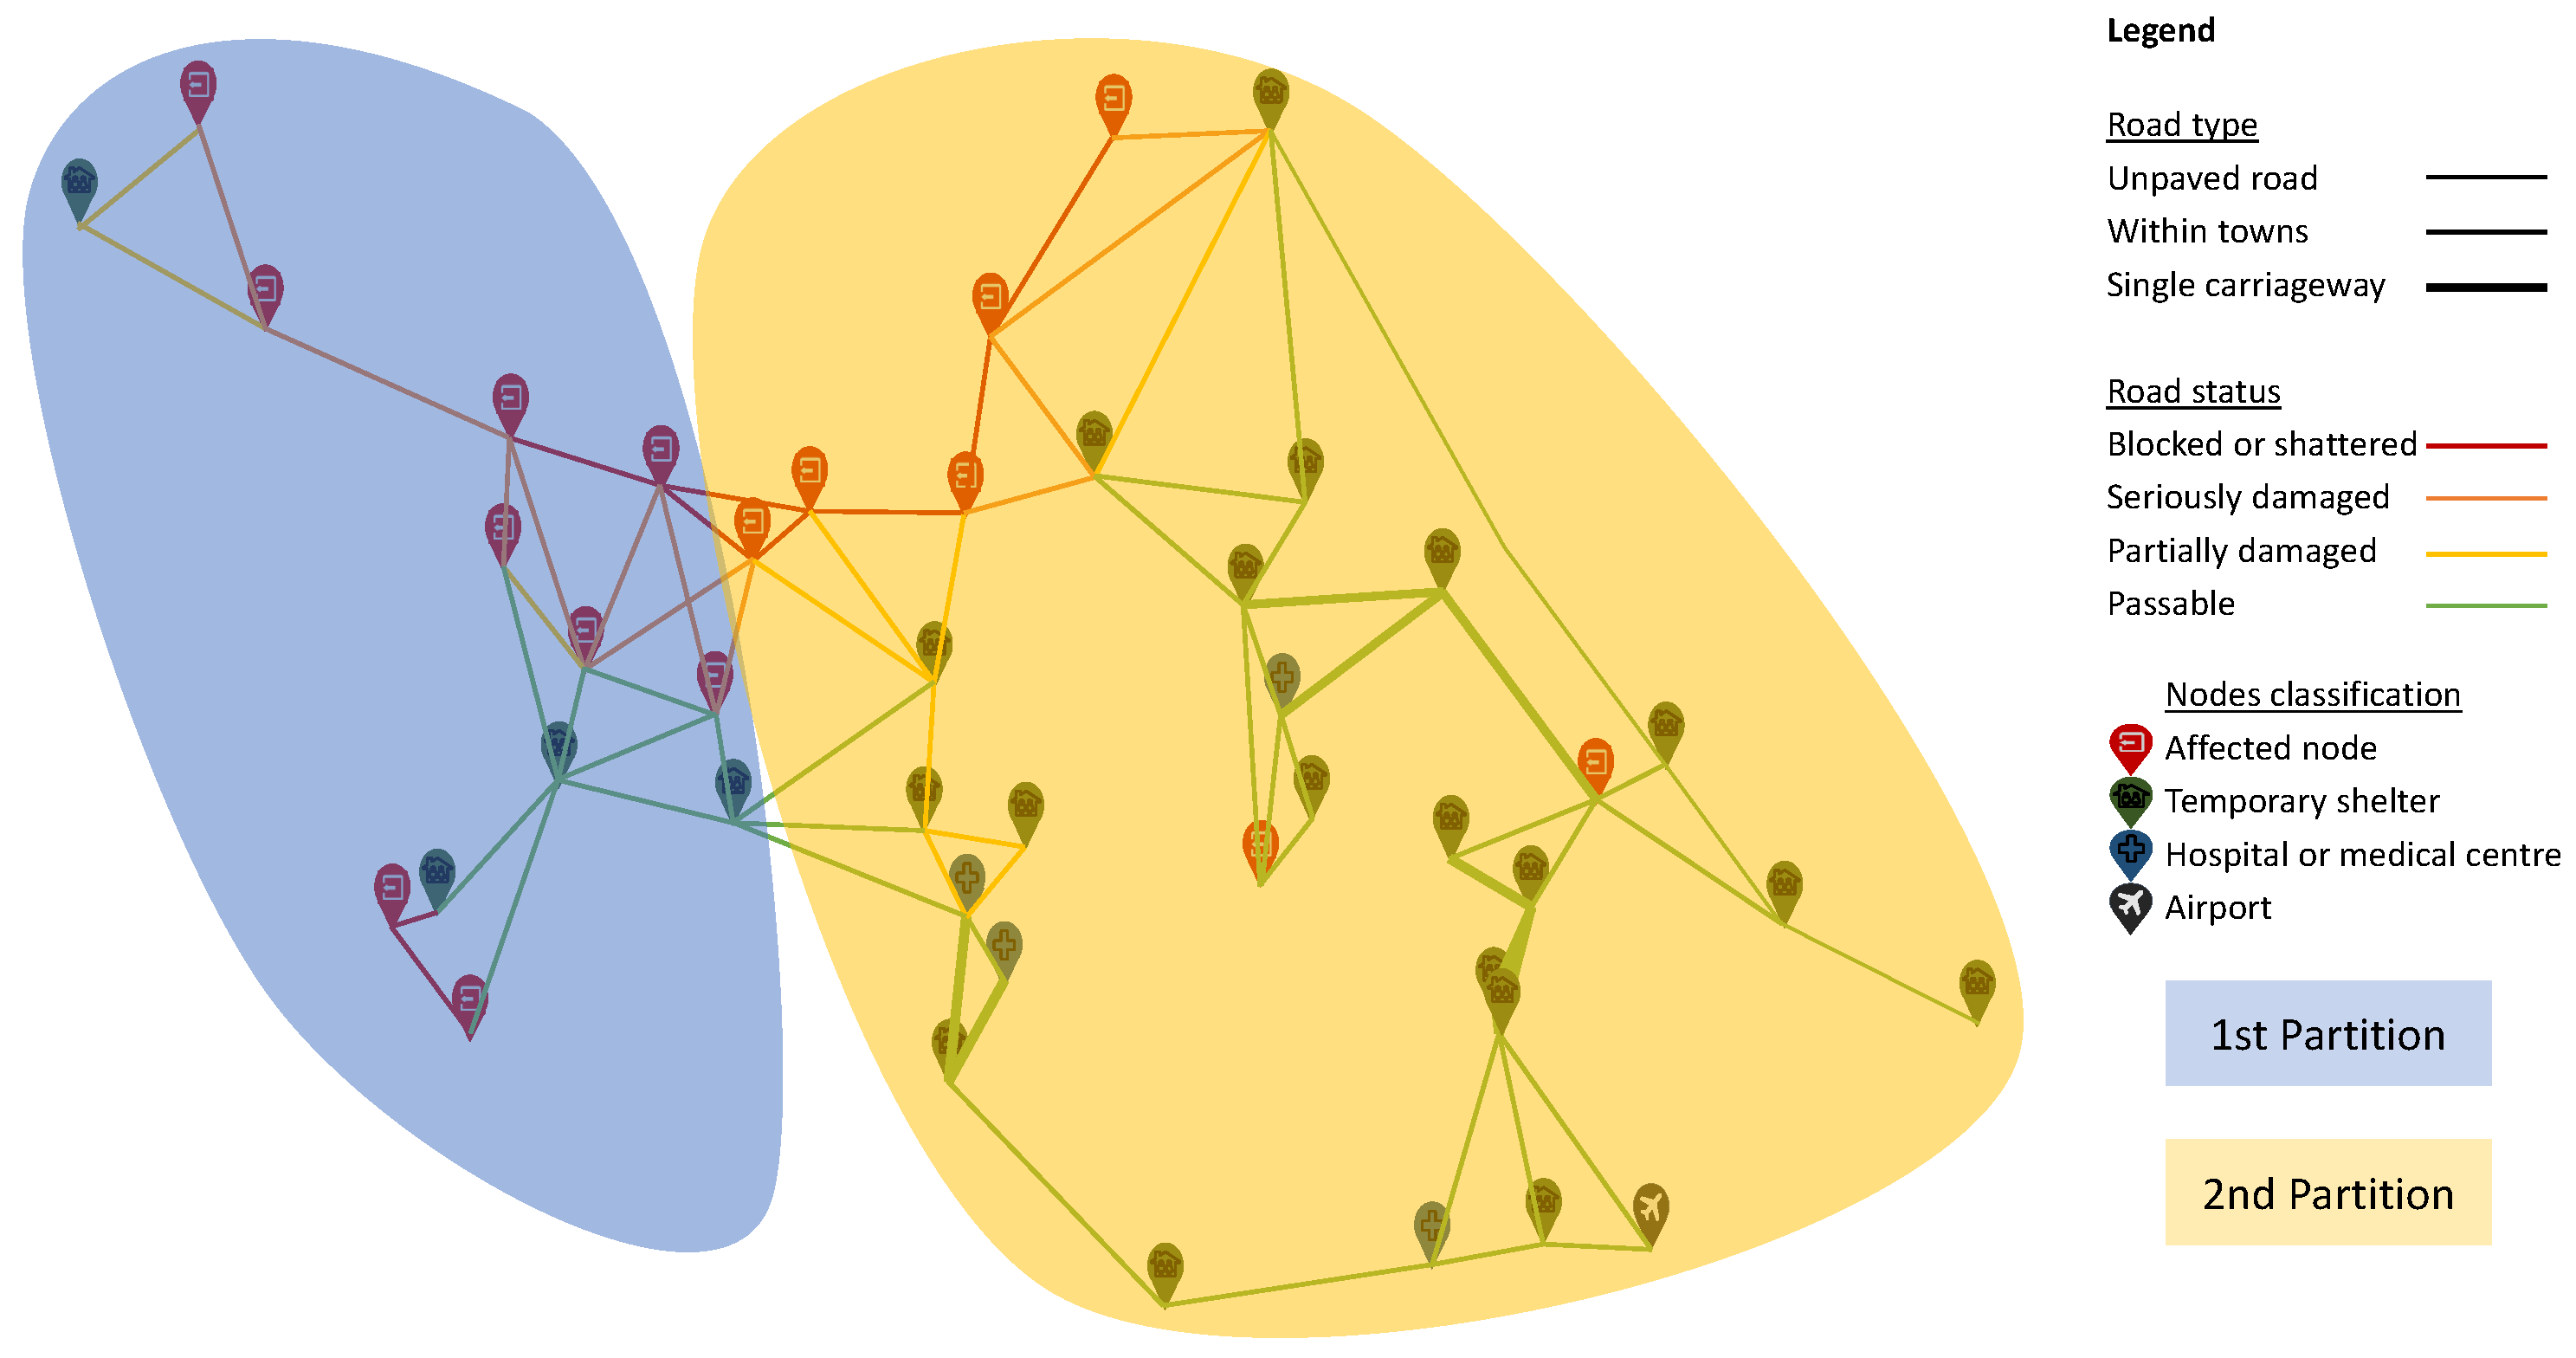
An additional interesting experiment regards splitting the network of the original problem into two or more subgraphs, in such a way that a solution to the original problem could be obtained from solutions of the subproblems associated to the subgraphs. The solution obtained by merging the solutions obtained independently from each subproblem may not be optimal, but this could simplify the resolution of the original problem by reducing it to simpler subproblems. One way to do this would be to use the partition illustrated in
Figure 6, which splits the area of interest into two parts, east and west of the Palu river. In each subproblem, potential evacuees are located only at the pick-up nodes of that particular partition. Similarly, only secure nodes and vehicles of the corresponding partition can be used to perform the evacuation operations. After solving these two subproblems and merging the solutions obtained, the resulting plan allows the evacuation of only 75.92% and 51.23% of the critical and non critical population, respectively, in comparison with 98.36% and 92.89%, that can be achieved with the plan provided by the original model. This shows a very big difference in the effectiveness of the two approaches. On the other hand, the lower number of evacuees that are to be moved allows the operation to be completed in only 39 h and with a significantly lower cost of 34,992.86
$ (in comparison with 72 h and 54,956.13
$). However, we use a lexicographical approach because we believe there should not be any trade off between the number of evacuated people and other attributes such as time or cost, and as a result, these two solutions are not comparable. This experiment highlights that the coordination of the operations is crucial to obtain effective global evacuation plans.
The previous experiments are all performed with very high aspiration levels for the amount of evacuated population, because this should be the main concern in this type of operations. However, they impose quite strong constraints on the third (operation time) and fourth (cost) lexicographical levels, which cannot vary much. In order to test if it would be possible to obtain significantly faster or cheaper operations at the expense of evacuating less people, we have resolved the model with lower aspiration levels of 75% and 50% for the evacuated people with high and normal priority, respectively (75–50). These aspiration levels are quite similar to the results that could be achieved by solving independently the two sub-problems defined by
Figure 6. The results we obtained with these alternative aspiration levels indicate that the stated amount of people could be evacuated much faster, in only 30 h, but with a much higher cost of 151,340.09
$. This shows how slight operation time reductions can be extremely costly, even with a reduced number of total evacuees. Additionally, we also solved the case with aspiration levels of 50% and 75% for high and normal priority population, respectively (50–75), obtaining an evacuation plan that could be implemented in only 36 h. However, as it happened earlier, the cost skyrockets to 171,516.01
$, stressing the high cost of reducing the operation times in this context.
As a summary of the results obtained in this section, the solutions obtained by solving the case study under the different assumptions considered is given in
Table 7.
5. Concluding Remarks
The main objective of the presented work has been palliating the effects of a disaster by focusing on the supported evacuation of the affected population, in order to protect them. The model provides a feasible evacuation planning to help the authorities facing the consequences of a disaster make decisions about how to proceed operationally. The main novelties introduced with respect to existing approaches have been the consideration of dynamism on the arrival of evacuees to the pick up points, the classification of the population according to their health condition and the joint consideration of conflicting objectives such us the number of people to evacuate, the operation time and the total cost. In order to include all these relevant elements, we have followed a lexicographic goal programming approach, in such a way that there is no possible trade off among the considered criteria: the most important ones are the amount of people evacuated (high priority, first level, and normal priority, second level), followed by the operation time (third level) and finally the cost (last level).
The computational results obtained by solving a realistic case study based on the earthquake and tsunami that hit Indonesia in September 2018 has shown how the proposed model is able to provide detailed feasible evacuation plans that could be implementable in real operations. In addition, the computational experience illustrated how the model could also be used to evaluate the consequences of possible changes in the available resources or infrastructures, as for example if the airport, certain shelters or a hospital were not available, or several vehicles could not be used. Another interesting insight that we have obtained from the results of the case study regards the high conflict among the different criteria considered: in order to be able to evacuate most of the affected population, long operation times are required, even using the whole time span, with reasonably low costs; the only way to obtain faster operations is by reducing the number of people evacuated, and even in that case, the cost increases a lot (up to three times) to achieve this time reduction. If the situation were that of a very high urgency, it could be possible to use the model to design several fast evacuation plans for reduced groups of affected people that could be carried out through the collaboration of several agencies.
One interesting line of future work could be the extension of the proposed evacuation model so that the planning could also take into account other important elements in the response to a disaster, as for example the location of temporal shelters or depots, the pre-positioning of stocks, the distribution of commodities required by the evacuated people, etc. In addition, the introduction of some stochastic variables into the model to represent the arrival of potential evacuees or changes in the status of the infrastructures could also be worth considering.


