Efficiency of China’s Listed Securities Companies: Estimation through a DEA-Based Method


Abstract
1. Introduction
2. Literature Review
3. Methodology
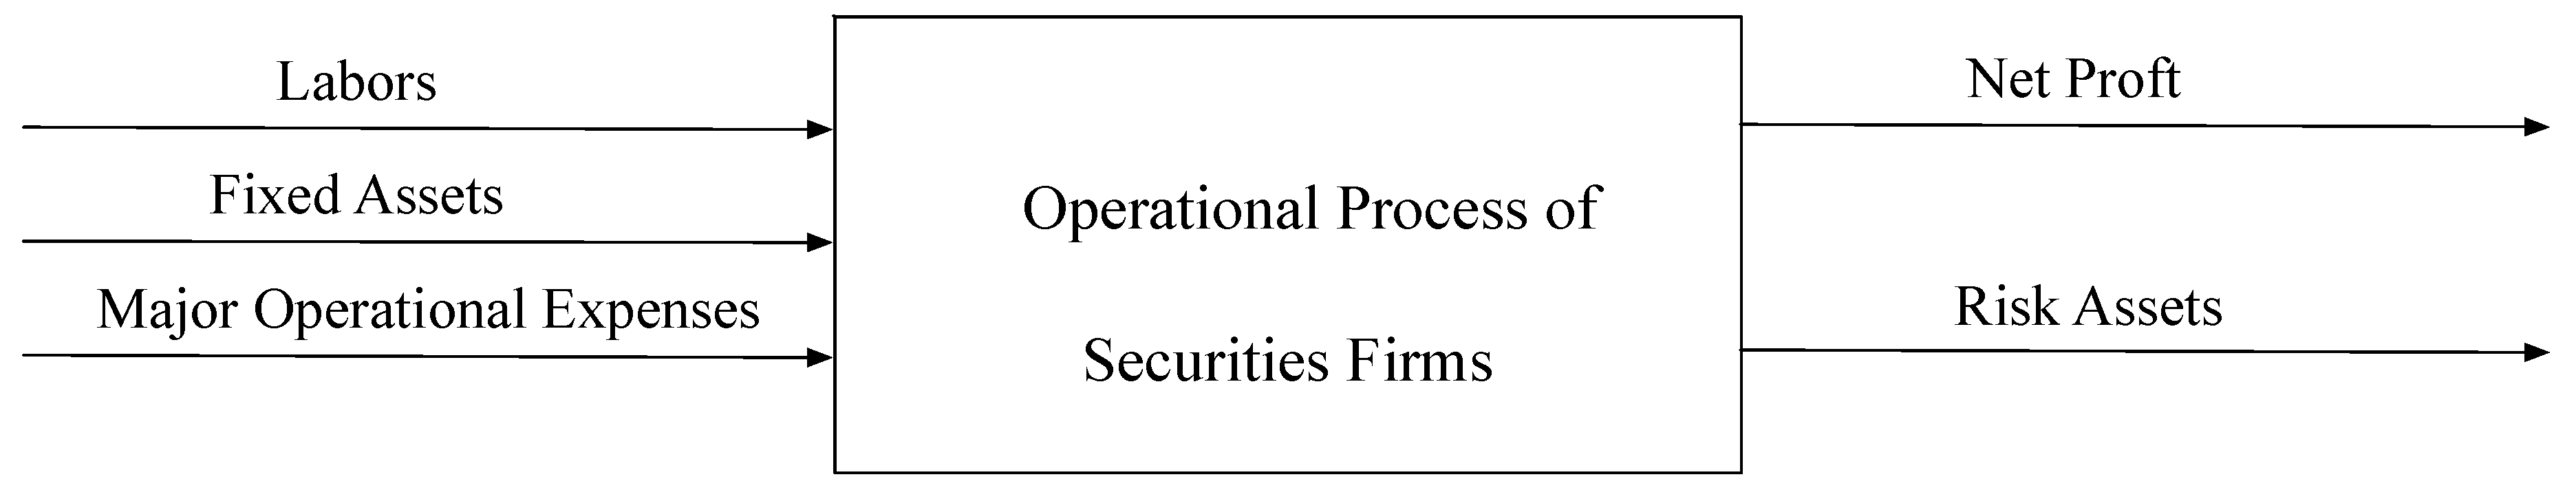
3.1. Input and Output Variables
3.2. Efficiency Evaluation Model
3.2.1. Efficiency Evaluation in SBM-DEA
3.2.2. Efficiency Evaluation in a Meta-Frontier SBM-DEA Model
3.2.3. Efficiency Decomposition Model Based on Meta-Frontier-Malmquist
4. Empirical Analysis
4.1. Sampling and Data
4.2. Securities Companies Efficiency Analysis
4.3. Efficiency Decomposition Analysis
4.4. Analysis of Technical Changes
4.5. Findings and Suggestions
5. Conclusions
Author Contributions
Funding
Conflicts of Interest
Abbreviations
| CNY | Chinese Yuan |
| DEA | Data envelopment analysis |
| DMU | Decision-making unit |
| GFE | Efficiency in group-frontier |
| MFE | Efficiency in meta-frontier |
| MOI | Overall inefficiency |
| TGR | Technical gap ratio |
| GMI | Managerial inefficiency |
| PTCU | Pure technology catch-up |
| PTCR | Potential technological relative change |
| SBM | Slack-based Model |
References
- Yeh, C.-P.; Wang, K.-M.; Chai, K.-C. Measuring the efficiency of securities companies by corporate governance in a financial holding and non-financial holding system. Expert Syst. Appl. 2010, 37, 4671–4679. [Google Scholar] [CrossRef]
- Serifsoy, B. Stock exchange business models and their operative performance. J. Bank. Financ. 2007, 31, 2978–3012. [Google Scholar] [CrossRef]
- Yu, A.Y.; Shao, Y.L.; You, J.X.; Wu, M.G.; Xu, T. Estimations of operational efficiencies and potential income gains considering the credit risk for China?s banks. J. Oper. Res. Soc. 2019, 70, 2153–2168. [Google Scholar] [CrossRef]
- Cooper, W.W.; Seiford, L.M.; Zhu, J. Handbook on Data Envelopment Analysis; Springer Science & Business Media: Berlin, Germany, 2011; Volume 164. [Google Scholar]
- Zhu, J. Data Envelopment Analysis: A Handbook of Models and Methods; Springer: Boston, MA, USA, 2015; Volume 221. [Google Scholar]
- Piansoongnern, O.; Anurit, P. A Global Competitiveness Study of Thai Securities Industry: A Case Study of Factors Influencing Investors’ Loyalty to Securities Companies in Bangkok. Glob. J. Flex. Syst. Manag. 2007, 8, 1–16. [Google Scholar] [CrossRef]
- Qian, L.; Lou, L.; Jing, W. Research on Competitiveness of Listed Security Companies in China; Springer: Singapore, 2017. [Google Scholar]
- Zhang, W.D.; Zhang, S.; Luo, X. Technological progress, inefficiency, and productivity growth in the US securities industry, 1980–2000. J. Bus. Res. 2006, 59, 589–594. [Google Scholar] [CrossRef]
- Lao, G.; Mo, B. Study on the Efficiency and Total Factor Productivity of China’s Securities Companies—Based on Hicks-Moorsteen TFP Index Method. Technol. Invest. 2018, 9, 52–67. [Google Scholar] [CrossRef][Green Version]
- Kao, M.-C.; Lin, C.-T.; Xu, L. Do Financial Reforms Improve the Performance of Financial Holding Companies? The Case of Taiwan. Int. Rev. Financ. 2012, 12, 491–509. [Google Scholar] [CrossRef]
- Li, C.; Han, L.; Zhang, X. DEA-based performance evaluation and sustainable research on securities firms’ CAMS. In Proceedings of the 2nd International Conference on Information Science and Engineering, Hangzhou, China, 4–6 December 2010; IEEE: Hangzhou, China, 2011. [Google Scholar]
- Chao, L.; Yuan-rui, L.; Chao, J.; Yujie, M.; Chenqi, L.; Qiwei, X. Research on Systematic Risk Measurement and Evolution Characteristics of Chinas Securities Companies—Empirical Data from 20 Listed Securities Companies. Chin. J. Manag. Sci. 2019, 27, 11–22. [Google Scholar]
- Liu, X.; Sun, J.; Yang, F.; Wu, J. How ownership structure affects bank deposits and loan efficiencies: An empirical analysis of Chinese commercial banks. Ann. Oper. Res. 2018. [Google Scholar] [CrossRef]
- Ding, T.; Chen, Y.; Wu, H.Q.; Wei, Y.Q. Centralized fixed cost and resource allocation considering technology heterogeneity: A DEA approach. Ann. Oper. Res. 2018, 268, 497–511. [Google Scholar] [CrossRef]
- Charnes, A.; Cooper, W.W.; Rhodes, E. Measuring the efficiency of decision making units. Eur. J. Oper. Res. 1978, 2, 429–444. [Google Scholar] [CrossRef]
- Li, F.; Emrouznejad, A.; Yang, G.L.; Li, Y.J. Carbon emission abatement quota allocation in Chinese manufacturing industries: An integrated cooperative game data envelopment analysis approach. J. Oper. Res. Soc. 2019. [Google Scholar] [CrossRef]
- Halkos, G.; Petrou, K.N. Treating undesirable outputs in DEA: A critical review. Econ. Anal. Policy 2019, 62, 97–104. [Google Scholar] [CrossRef]
- Fare, R.; Grosskopf, S.; Pasurka, C. Effects on Relative Efficiency in Electric-Power Generation Due to Environmental Controls. Resour. Energy 1986, 8, 167–184. [Google Scholar] [CrossRef]
- Tyteca, D. Linear programming models for the measurement of environmental performance of firms—Concepts and empirical results. J. Prod. Anal. 1997, 8, 183–197. [Google Scholar] [CrossRef]
- Macpherson, A.J.; Principe, P.P.; Shao, Y. Controlling for exogenous environmental variables when using data envelopment analysis for regional environmental assessments. J. Environ. Manag. 2013, 119, 220–229. [Google Scholar] [CrossRef]
- Scheel, H. Undesirable outputs in efficiency valuations. Eur. J. Oper. Res. 2001, 132, 400–410. [Google Scholar] [CrossRef]
- Seiford, L.M.; Zhu, J. Modeling undesirable factors in efficiency evaluation. Eur. J. Oper. Res. 2002, 142, 16–20. [Google Scholar] [CrossRef]
- Zhou, Z.X.; Xu, G.C.; Wang, C.; Wu, J. Modeling undesirable output with a DEA approach based on an exponential transformation: An application to measure the energy efficiency of Chinese industry. J. Clean. Prod. 2019, 236, 11. [Google Scholar] [CrossRef]
- Fare, R.; Grosskopf, S.; Hernandez-Sancho, F. Environmental performance: An index number approach. Resour. Energy Econ. 2004, 26, 343–352. [Google Scholar] [CrossRef]
- Yang, H.L.; Pollitt, M. The necessity of distinguishing weak and strong disposability among undesirable outputs in DEA: Environmental performance of Chinese coal-fired power plants. Energy Policy 2010, 38, 4440–4444. [Google Scholar] [CrossRef]
- Battese, G.E.; Prasada Rao, D.S.; O’Donnell, C.J. A metafrontier production function for estimation of technical efficiencies and technology gaps for firms operating under different technologies. J. Prod. Anal. 2004, 21, 91–103. [Google Scholar] [CrossRef]
- Chen, K.-H.; Yang, H.-Y. Extensions of the metafrontier Malmquist productivity index: An empirical study with cross-country macro-data. Taiwan Econ. Rev. 2008, 36, 551–588. [Google Scholar]
- Tone, K. A slacks-based measure of super-efficiency in data envelopment analysis. Eur. J. Oper. Res. 2002, 143, 32–41. [Google Scholar] [CrossRef]
- Wang, C.-N.; Luu, Q.-C.; Nguyen, T.-K.-L.; Day, J.-D. Assessing Bank Performance Using Dynamic SBM Model. Mathematics 2019, 7, 73. [Google Scholar] [CrossRef]
- Yu, A.Y.; You, J.X.; Zhang, H.; Ma, J.J. Estimation of industrial energy efficiency and corresponding spatial clustering in urban China by a meta-frontier model. Sustain. Cities Soc. 2018, 43, 290–304. [Google Scholar] [CrossRef]
- O’Donnell, C.J.; Rao, D.S.P.; Battese, G.E. Metafrontier frameworks for the study of firm-level efficiencies and technology ratios. Empir. Econ. 2008, 34, 231–255. [Google Scholar] [CrossRef]
- Chiu, C.R.; Liou, J.L.; Wu, P.I.; Fang, C.L. Decomposition of the environmental inefficiency of the meta-frontier with undesirable output. Energy Econ. 2012, 34, 1392–1399. [Google Scholar] [CrossRef]
- Färe, R.; Grosskopf, S.; Lindgren, B.; Roos, P. Productivity developments in Swedish hospitals: A Malmquist output index approach. In Data Envelopment Analysis: Theory, Methodology, and Applications; Springer: Berlin, Germany, 1994; pp. 253–272. [Google Scholar]
- Lv, W.D.; Hong, X.X.; Fang, K.N. Chinese regional energy efficiency change and its determinants analysis: Malmquist index and Tobit model. Ann. Oper. Res. 2015, 228, 9–22. [Google Scholar] [CrossRef]
- Perez, K.; Gonzalez-Araya, M.C.; Iriarte, A. Energy and GHG emission efficiency in the Chilean manufacturing industry: Sectoral and regional analysis by DEA and Malmquist indexes. Energy Econ. 2017, 66, 290–302. [Google Scholar] [CrossRef]
- Feng, C.; Wang, M. Analysis of energy efficiency and energy savings potential in China’s provincial industrial sectors. J. Clean. Prod. 2017, 164, 1531–1541. [Google Scholar] [CrossRef]
- Caves, D.W.; Christensen, L.R.; Diewert, W.E. The economic theory of index numbers and the measurement of input, output, and productivity. Econom. J. Econom. Soc. 1982, 50, 1393–1414. [Google Scholar] [CrossRef]
- China Securities Regulatory Commission Announced the Classification Results of Securities Companies in 2019. Available online: https://www.sac.net.cn/hyfw/hydt/201907/t20190729_139577.html (accessed on 26 July 2019).
- Wang, Y.R. Everbright Securities 2018 Net Profit of 103 Million Yuan, down 96.57%. Available online: http://news.cnstock.com/news,bwkx-201903-4355328.htm (accessed on 27 March 2019).


| Category | Firms |
|---|---|
| AA | Guotai Junan Securities, Guosen Securities, Haitong Securities, Huatai Securities, Tianfeng Securities, China Merchants Securities, CITIC Construction Investment Securities, CITIC Securities |
| A | Caitong Securities, Northeast Securities, Dongfang Securities, Soochow Securities, Dongxing Securities, Founder Securities, China Everbright Securities, Guojin Securities, Guoyuan Securities, Huaan Securities, Hualin Securities, Huaxi Securities, Shenwan Hongyuan Securities, Industrial Securities, Zheshang Securities, China Galaxy Securities |
| BBB | Great Wall Securities, GF Securities, Guohai Securities, Hongta Securities, Shanxi Securities, Zhongyuan Securities |
| Year | Parameter | Labors | Fixed Assets | Operational Expenses | Profits | Risk Assets |
|---|---|---|---|---|---|---|
| Unit | 103 | 109 CNY | 109 CNY | 109 CNY | 109 CNY | |
| 2014 | Minimum | 0.822 | 0.054 | 0.387 | 0.188 | 0.274 |
| Maximum | 13.209 | 2.854 | 16.017 | 11.861 | 7.144 | |
| Average | 4.513 | 0.598 | 3.580 | 2.555 | 2.206 | |
| Standard Deviation | 3.190 | 0.568 | 3.290 | 2.722 | 1.728 | |
| 2015 | Minimum | 0.920 | 0.057 | 0.654 | 0.816 | 0.499 |
| Maximum | 16.853 | 3.320 | 28.359 | 20.360 | 13.476 | |
| Average | 5.657 | 0.790 | 7.007 | 6.320 | 3.655 | |
| Standard Deviation | 4.272 | 0.831 | 6.420 | 5.705 | 3.102 | |
| 2016 | Minimum | 0.936 | 0.055 | 0.562 | 0.339 | 1.188 |
| Maximum | 16.964 | 3.659 | 23.800 | 11.353 | 54.748 | |
| Average | 6.062 | 0.846 | 5.118 | 3.335 | 12.155 | |
| Standard Deviation | 4.374 | 0.944 | 5.187 | 3.184 | 11.415 | |
| 2017 | Minimum | 0.975 | 0.058 | 0.587 | 0.368 | 1.148 |
| Maximum | 16.161 | 7.903 | 27.043 | 11.977 | 52.137 | |
| Average | 6.286 | 1.028 | 5.408 | 3.267 | 13.113 | |
| Standard Deviation | 4.376 | 1.561 | 5.386 | 3.503 | 11.593 | |
| 2018 | Minimum | 1.115 | 0.056 | 0.640 | 0.096 | 1.268 |
| Maximum | 15.842 | 7.730 | 25.185 | 9.876 | 50.020 | |
| Average | 6.328 | 1.222 | 5.842 | 2.062 | 12.415 | |
| Standard Deviation | 4.319 | 1.774 | 5.339 | 2.474 | 10.825 |
| Category | Year | 2014 | 2015 | 2016 | 2017 | 2018 | Average | 2014 | 2015 | 2016 | 2017 | 2018 | Average |
|---|---|---|---|---|---|---|---|---|---|---|---|---|---|
| Firms | GFE | MFE | |||||||||||
| AA | Guotai Junan S. | 1.000 | 1.000 | 1.000 | 1.000 | 1.000 | 1.000 | 1.000 | 1.000 | 1.000 | 1.000 | 1.000 | 1.000 |
| AA | Guosen S. | 0.708 | 1.000 | 0.592 | 0.679 | 0.782 | 0.752 | 0.671 | 1.000 | 0.551 | 0.552 | 0.717 | 0.698 |
| AA | Haitong S. | 1.000 | 1.000 | 1.000 | 1.000 | 0.743 | 0.949 | 1.000 | 1.000 | 1.000 | 1.000 | 0.743 | 0.949 |
| AA | Huatai S. | 0.554 | 0.677 | 1.000 | 1.000 | 1.000 | 0.846 | 0.520 | 0.566 | 1.000 | 1.000 | 1.000 | 0.817 |
| AA | Tianfeng S. | 1.000 | 1.000 | 1.000 | 1.000 | 1.000 | 1.000 | 0.447 | 0.330 | 0.431 | 0.355 | 0.306 | 0.374 |
| AA | Merchants S. | 1.000 | 1.000 | 1.000 | 1.000 | 1.000 | 1.000 | 0.731 | 1.000 | 1.000 | 1.000 | 1.000 | 0.946 |
| AA | CITIC IS S. | 1.000 | 1.000 | 1.000 | 0.780 | 1.000 | 0.956 | 0.711 | 0.658 | 0.976 | 0.627 | 1.000 | 0.795 |
| AA | CITIC S. | 1.000 | 1.000 | 0.539 | 1.000 | 1.000 | 0.908 | 1.000 | 1.000 | 0.535 | 1.000 | 1.000 | 0.907 |
| AA | Average | 0.908 | 0.960 | 0.891 | 0.932 | 0.941 | 0.926 | 0.760 | 0.819 | 0.812 | 0.817 | 0.846 | 0.811 |
| A | Caitong S. | 0.536 | 1.000 | 1.000 | 1.000 | 0.729 | 0.853 | 0.405 | 1.000 | 1.000 | 1.000 | 0.729 | 0.827 |
| A | Northeast S. | 0.467 | 0.419 | 0.364 | 0.230 | 0.169 | 0.330 | 0.371 | 0.380 | 0.364 | 0.199 | 0.126 | 0.288 |
| A | Orient S. | 1.000 | 1.000 | 1.000 | 1.000 | 0.302 | 0.860 | 0.730 | 1.000 | 0.514 | 1.000 | 0.250 | 0.699 |
| A | Soochow S. | 0.466 | 0.464 | 0.465 | 0.314 | 0.229 | 0.387 | 0.378 | 0.419 | 0.465 | 0.266 | 0.169 | 0.339 |
| A | Dongxing S. | 1.000 | 0.500 | 0.506 | 0.622 | 1.000 | 0.725 | 0.659 | 0.459 | 0.506 | 0.615 | 0.776 | 0.603 |
| A | Founder S. | 1.000 | 0.425 | 0.442 | 0.267 | 0.179 | 0.463 | 0.643 | 0.415 | 0.442 | 0.265 | 0.173 | 0.388 |
| A | Everbright S. | 0.370 | 1.000 | 0.500 | 1.000 | 0.079 | 0.590 | 0.299 | 0.683 | 0.485 | 0.456 | 0.067 | 0.398 |
| A | Sinolink S. | 1.000 | 0.713 | 0.669 | 1.000 | 1.000 | 0.877 | 1.000 | 0.701 | 0.669 | 0.781 | 1.000 | 0.830 |
| A | Guoyuan S. | 0.588 | 1.000 | 0.417 | 0.586 | 0.436 | 0.605 | 0.455 | 0.544 | 0.417 | 0.449 | 0.335 | 0.440 |
| A | HuaAn S. | 1.000 | 1.000 | 0.408 | 0.522 | 0.685 | 0.723 | 0.522 | 0.537 | 0.408 | 0.458 | 0.543 | 0.494 |
| A | ChinaLin S. | 1.000 | 1.000 | 1.000 | 1.000 | 1.000 | 1.000 | 1.000 | 1.000 | 1.000 | 1.000 | 1.000 | 1.000 |
| A | Huaxi S. | 0.399 | 1.000 | 1.000 | 1.000 | 1.000 | 0.880 | 0.304 | 1.000 | 1.000 | 0.621 | 0.721 | 0.729 |
| A | Shenwan Hongyuan S. | 1.000 | 1.000 | 1.000 | 1.000 | 1.000 | 1.000 | 0.609 | 0.589 | 0.542 | 0.428 | 0.705 | 0.575 |
| A | Industrial S. | 1.000 | 0.493 | 0.430 | 0.579 | 0.159 | 0.532 | 0.487 | 0.474 | 0.420 | 0.477 | 0.145 | 0.401 |
| A | Zheshang S. | 0.456 | 0.318 | 0.345 | 1.000 | 0.431 | 0.510 | 0.347 | 0.265 | 0.345 | 0.365 | 0.365 | 0.337 |
| A | China Galaxy S. | 1.000 | 1.000 | 1.000 | 1.000 | 1.000 | 1.000 | 1.000 | 1.000 | 1.000 | 1.000 | 1.000 | 1.000 |
| A | Average | 0.768 | 0.771 | 0.659 | 0.757 | 0.587 | 0.708 | 0.576 | 0.654 | 0.599 | 0.586 | 0.507 | 0.584 |
| BBB | China Great Wall S. | 0.482 | 0.476 | 0.573 | 0.527 | 0.493 | 0.510 | 0.420 | 0.408 | 0.398 | 0.500 | 0.435 | 0.432 |
| BBB | GF S. | 1.000 | 1.000 | 1.000 | 1.000 | 1.000 | 1.000 | 0.593 | 0.728 | 1.000 | 1.000 | 1.000 | 0.864 |
| BBB | Sealand S. | 0.543 | 0.621 | 0.646 | 0.334 | 0.177 | 0.464 | 0.468 | 0.519 | 0.463 | 0.323 | 0.177 | 0.390 |
| BBB | Hongta S. | 1.000 | 1.000 | 1.000 | 1.000 | 1.000 | 1.000 | 1.000 | 1.000 | 1.000 | 1.000 | 1.000 | 1.000 |
| BBB | Shanxi S. | 0.369 | 0.494 | 0.359 | 0.229 | 0.165 | 0.323 | 0.340 | 0.428 | 0.302 | 0.229 | 0.165 | 0.293 |
| BBB | Central China S. | 0.420 | 0.436 | 1.000 | 0.426 | 0.156 | 0.488 | 0.398 | 0.391 | 0.520 | 0.426 | 0.156 | 0.378 |
| BBB | Average | 0.636 | 0.671 | 0.763 | 0.586 | 0.499 | 0.631 | 0.536 | 0.579 | 0.614 | 0.580 | 0.489 | 0.560 |
| Category | Firms | MOI | Category | Firms | MOI |
|---|---|---|---|---|---|
| A | Caitong S. | 0.196 | AA | Guotai Junan S. | 0.000 |
| Northeast S. | 0.807 | Guosen S. | 0.326 | ||
| Orient S. | 0.325 | Haitong S. | 0.051 | ||
| Soochow S. | 0.752 | Huatai S. | 0.199 | ||
| Dongxing S. | 0.406 | Tianfeng S. | 0.263 | ||
| Founder S. | 0.622 | Merchants S. | 0.054 | ||
| Everbright S. | 0.657 | CITIC IS S. | 0.214 | ||
| Sinolink S. | 0.171 | CITIC S. | 0.094 | ||
| Guoyuan S. | 0.624 | Average | 0.150 | ||
| HuaAn S. | 0.531 | BBB | China Great Wall S. | 0.639 | |
| ChinaLin S. | 0.000 | GF S. | 0.136 | ||
| Huaxi S. | 0.300 | Sealand S. | 0.659 | ||
| Shenwan Hongyuan S. | 0.228 | Hongta S. | 0.000 | ||
| Industrial S. | 0.635 | Shanxi S. | 0.750 | ||
| Zheshang S. | 0.729 | Central China S. | 0.640 | ||
| China Galaxy S. | 0.000 | Average | 0.471 | ||
| Average | 0.436 | Average | 0.352 | ||
| Category | DMU | PTCU | PTRC | Category | DMU | PTCU | PTRC |
|---|---|---|---|---|---|---|---|
| A | Caitong S. | 1.324 | 0.933 | AA | Guotai Junan S. | 1.000 | 1.597 |
| Northeast S. | 0.942 | 0.871 | Guosen S. | 0.968 | 1.444 | ||
| Orient S. | 1.132 | 0.801 | Haitong S. | 1.000 | 1.265 | ||
| Soochow S. | 0.907 | 1.449 | Huatai S. | 1.065 | 1.554 | ||
| Dongxing S. | 1.178 | 1.128 | Tianfeng S. | 0.685 | 1.019 | ||
| Founder S. | 1.500 | 0.787 | Merchants S. | 1.367 | 1.215 | ||
| Everbright S. | 1.046 | 1.408 | China S. | 1.407 | 1.116 | ||
| Sinolink S. | 1.000 | 1.027 | CITIC S. | 1.000 | 1.020 | ||
| Guoyuan S. | 0.993 | 1.478 | Average | 1.061 | 1.279 | ||
| HuaAn S. | 1.522 | 1.437 | BBB | China Great Wall S. | 1.687 | 0.725 | |
| ChinaLin S. | 1.000 | 0.307 | GF S. | 1.161 | 0.734 | ||
| Huaxi S. | 0.948 | 1.232 | Sealand S. | 1.000 | 1.135 | ||
| Shenwan Hongyuan S. | 1.158 | 0.920 | Hongta S. | 1.083 | 0.882 | ||
| Industrial S. | 1.880 | 0.802 | Shanxi S. | 1.012 | 0.903 | ||
| Zheshang S. | 1.113 | 0.654 | Central China S. | 1.057 | 0.969 | ||
| China Galaxy S. | 1.000 | 0.931 | Average | 1.167 | 0.891 | ||
| Average | 1.165 | 1.010 | Average | 1.131 | 1.060 |
© 2020 by the authors. Licensee MDPI, Basel, Switzerland. This article is an open access article distributed under the terms and conditions of the Creative Commons Attribution (CC BY) license (http://creativecommons.org/licenses/by/4.0/).
Share and Cite
Xu, T.; You, J.; Shao, Y. Efficiency of China’s Listed Securities Companies: Estimation through a DEA-Based Method. Mathematics 2020, 8, 589. https://doi.org/10.3390/math8040589
Xu T, You J, Shao Y. Efficiency of China’s Listed Securities Companies: Estimation through a DEA-Based Method. Mathematics. 2020; 8(4):589. https://doi.org/10.3390/math8040589
Chicago/Turabian StyleXu, Tao, Jianxin You, and Yilei Shao. 2020. "Efficiency of China’s Listed Securities Companies: Estimation through a DEA-Based Method" Mathematics 8, no. 4: 589. https://doi.org/10.3390/math8040589
APA StyleXu, T., You, J., & Shao, Y. (2020). Efficiency of China’s Listed Securities Companies: Estimation through a DEA-Based Method. Mathematics, 8(4), 589. https://doi.org/10.3390/math8040589