Article

A Bradley-Terry Model-Based Approach to Prioritize the Balance Scorecard Driving Factors: The Case Study of a Financial Software Factory

by
Vicente Rodríguez Montequín
*,
Joaquín Manuel Villanueva Balsera
,
Marina Díaz Piloñeta
and
César Álvarez Pérez
Department of Project Engineering, University of Oviedo, C/Independencia 3, 33004 Oviedo, Spain
*
Author to whom correspondence should be addressed.
Mathematics 2020, 8(2), 276; https://doi.org/10.3390/math8020276
Submission received: 16 January 2020 / Revised: 17 February 2020 / Accepted: 19 February 2020 / Published: 19 February 2020

Abstract

:
The prioritization of factors has been widely studied applying different methods from the domain of the multiple-criteria decision-making, such as for example the Analytic Hierarchy Process method (AHP) based on decision-makers’ pairwise comparisons. Most of these methods are subjected to a complex analysis. The Bradley-Terry model is a probability model for paired evaluations. Although this model is usually known for its application to calculating probabilities, it can be also extended for ranking factors based on pairwise comparison. This application is much less used; however, this work shows that it can provide advantages, such as greater simplicity than traditional multiple-criteria decision methods in some contexts. This work presents a method for ranking the perspectives and indicators of a balance scorecard when the opinion of several decision-makers needs to be combined. The data come from an elicitation process, accounting for the number of times a factor is preferred to others by the decision-makers in a pairwise comparisons. No preference scale is used; the process just indicates the winner of the comparison. Then, the priority weights are derived from the Bradley-Terry model. The method is applied in a Financial Software Factory for demonstration and validation. The results are compared against the application of the AHP method for the same data, concluding that despite the simplifications made with the new approach, the results are very similar. The study contributes to the multiple-criteria decision-making domain by building an integrated framework, which can be used as a tool for scorecard prioritization.

1. Introduction

The Balance Scorecard (BSC) framework is probably the most widespread tool to control and manage an organization. The initial proposal was introduced in 1992 by Kaplan and Norton [1,2]. The BSC provides through their perspectives and key performance indicators (KPIs) insights into corporate performance. The BSC provides a template that must be personalized according to the characteristics of each organization. Many authors suggested a set of modifications to customize the initial proposal of the BSC for specific kind of companies or areas.
The BSC framework does not establish the relative importance of its perspectives and indicators, which is a key factor when making decisions and planning strategies. Nevertheless, it can be determined by means of the integration with some multiple-criteria decision-making (MCDM) methods. The prioritizing process of the BSC has been addressed usually following the Saaty’s Analytic Hierarchy Process method (AHP) [3], which is one of the most widely used MCDM methods. The relative importance of each criteria is calculated through making pairwise comparisons using a nine-point scale. Several examples can be found in the literature describing use cases. The works from Clinton et al. [4] and Reisinger et al. [5] were some of the first. Particularly, case studies applying AHP to the BSC have been extensively published. An overview of applications can be consulted in the work of Vaidya and Kumar [6].
When determining the priorities of a BSC, the AHP method is usually applied in a group decision context, collecting the opinions from several decision-makers and determining the preferences of the group as a whole. The opinion of the decision-makers is gathered through an elicitation process by means of pairwise questionnaires. Under this situation, each decision-maker fills a questionnaire with the comparison of each element, and the results are aggregated, usually by means of geometric mean, to arrive at a final solution. Then, the process of AHP is applied for the calculation of the consensual priorities.
Although the Bradley-Terry model is a method that can be used to prioritize criteria, it has been used very little for this purpose, and even less in the context of BSC prioritization. The method is known mainly for the calculation of probabilities in sports tournaments; extensive literature exists regarding this application. Our proposal is to derive the weights of the indicators from the calculation of the Bradley-Terry model, considering that the degree of importance of each indicator will be given by the number of times that each decision-maker has preferred it over the other indicators. Therefore, our method assumes that the prioritization is being carried out in order to get a consensus from a group of decision-makers, and the method is limited to this situation. This is a novel approach that has not been described until now. The Bradley-Terry model is used in this study to determine weights for the perspectives and KPIs included in the BSC. The goal of this paper is to describe the application to this case study and establish a framework that could be replicated in similar scenarios. The results are compared for validation with those provided by the application of the AHP to the same cases.
There are some known issues with the application of the AHP method recognized by academics and practitioners. On the one hand, the number of pairwise comparisons can be very high: n*(n − 1)/2 for n alternatives/criteria. This could yield that comparisons may be entered in a short amount of time by the decision-makers. On the other hand, there are also concerns about the judgment scale. In Saaty’s AHP, the verbal statements are converted into integers from one to nine: the so-called Saaty’s fundamental scale. Even though the scale has its own psychophysical basis, as Saaty wrote [7], it is sometimes difficult for the decision-makers to discern between the different intensity levels and, even more, use the same criteria all the time for all the pairwise comparisons. On the other hand, a matter in question is the difficulty of dealing with inconsistent comparisons in the analysis (the decision-maker’s arbitrary judgment can lead to some inconsistency). For comparison matrixes that fail the consistency test, the decision-maker has to redo the ratios. To expect the decision-maker to provide the comparisons such that the ranges include only consistent comparison ratios is laborious and highly unrealistic [8]. When the AHP is used to get a group consensus, as is the case of scoring the weights of the BSC indicators by a group of decision-makers, the former issues are emphasized. Then, the chance to get inconsistences is stressed. Under these circumstances, our method can be a very interesting alternative to the utilization of AHP.
The paper discusses to what extent the Bradley-Terry model can simplify the calculation of priorities or avoid those issues. Bradley-Terry does not entail a reduction of the needed pairwise comparisons, but the comparisons are simpler because it does not use a scale of intensity. The Bradley-Terry model only needs the winner option for the calculation, which is noticed as a win-to-loss scale. As consequence, the level of inconsistency is also reduced. In addition, Bradley-Terry accept missing comparisons; that is, when one of the decision-makers is not clear about one of the comparisons, there is no need to fill it out, and the calculations can still be performed.
The remainder of this paper is organized as follows. First, a literature review is introduced. Next, the materials and methods are included. The context where the study was conducted is described, as well as a general description of the BSC. A short introduction to the AHP method is also included alongside a discussion about the points that could be simplified using the Bradley-Terry model. Then, the Bradley-Terry model and its integration with BSC are presented, and the research method is stated. Finally, the results are shown and discussed, and the conclusions and practical implications are exposed.

2. Literature Review

Applications of the Bradley-Terry model are many and varied. Traditionally, sport has been one of the most prominent areas from the beginning. In fact, the model is usually described in a context of sport tournaments, where a set of teams or players confront each other. There are well-documented examples of the use of the model for baseball [9], tennis [10], or basketball [11]. Additional examples can be drawn from the work of Király and Qian [12]. The model has been also used for ranking scientific journals [13], market research [14], or social analysis [15], among others. Another field of application is psychometric, where comparisons are made by different human subjects between pairs of items in terms of preferences [16]. That is the approach followed in our method: the decision-makers express their preferences over the different criteria and the KPIs included in the BSC. A general review about Bradley-Terry applications can be found in the work of Cattelan [17].
The basis for deriving priorities with Bradley-Terry has been introduced in the beginning by Dykstra [18] and more recently extended by Genest and M’Lan [19], but until now, the only publication applied to BSC is the work of Golpîra and Veysi [20], who describe the application to the BSC within a non-profit organization. In this work, the logistic regression and Bradley-Terry method were employed for classifying, sorting, and ranking the factors and finding the most important indexes for establishing the organizational strategy map. Not in the same context as that of BSC but very similar, the Bradley-Terry model has been recently applied for the assessment of environmental driving factors [21]. The authors conducted a study for ranking the parameters for coal-mining activities. In this case, 23 parameters of a coal-mining environment were identified and classified into four major categories, calculating the weight of each parameter using Bradley-Terry. The parameters were ranked by assigning the weights, using attitudinal data collected by surveying experts. More recently, the model has also been applied for measuring portfolios salience [22]. For each matchup between two cabinet portfolios, the subjects (experts or politicians) were asked to choose the more valuable one. They strengthened the greatly simplified data collection of the method. The authors also remark that the application of Bradley-Terry to this context remains rare. There is also another publication where the Bradley-Terry model is used for prioritizing, but it is applied to the design goals of a medical simulator [23], which is far from the operational research field. A survey of pairwise comparisons was distributed to experts. The analysis was performed following two methods: a simple method (calculating the proportion of times an alternative was chosen as preferable) and the Bradley-Terry model. They state that the Bradley-Terry method offers a means to calculate measures of uncertainty, showing nuances where scores may overlap, and the method is valuable when reconciling different experts’ opinions. There are no more reported references on the application of the Bradley-Terry model for prioritization in the management domain, even considering that prioritizing performance measures within the balance scorecard is a topic that is very studied nowadays (examples of recent reviews can be consulted in [24,25,26]). Given the few existing references in the literature, this work contributes by reaffirming the applicability of the method for this purpose and establishing a generalizable framework to be used for BSC prioritization.

3. Materials and Methods

The case study is based on a Spanish software factory that develops software and provides services to several financial entities. The company plays an important role in the information technology sector for financial entities in Spain and South America. The company is a subsidiary firm of a banking group. They have started an important process of adaptation and change of their business model a few years ago, with the goal of improving the efficiency and productivity as a way of ensuring its business sustainability. They have adopted a strategic management approach based on a redefined BSC framework, as published in a former work [27]. Table 1, Table 2, Table 3 and 
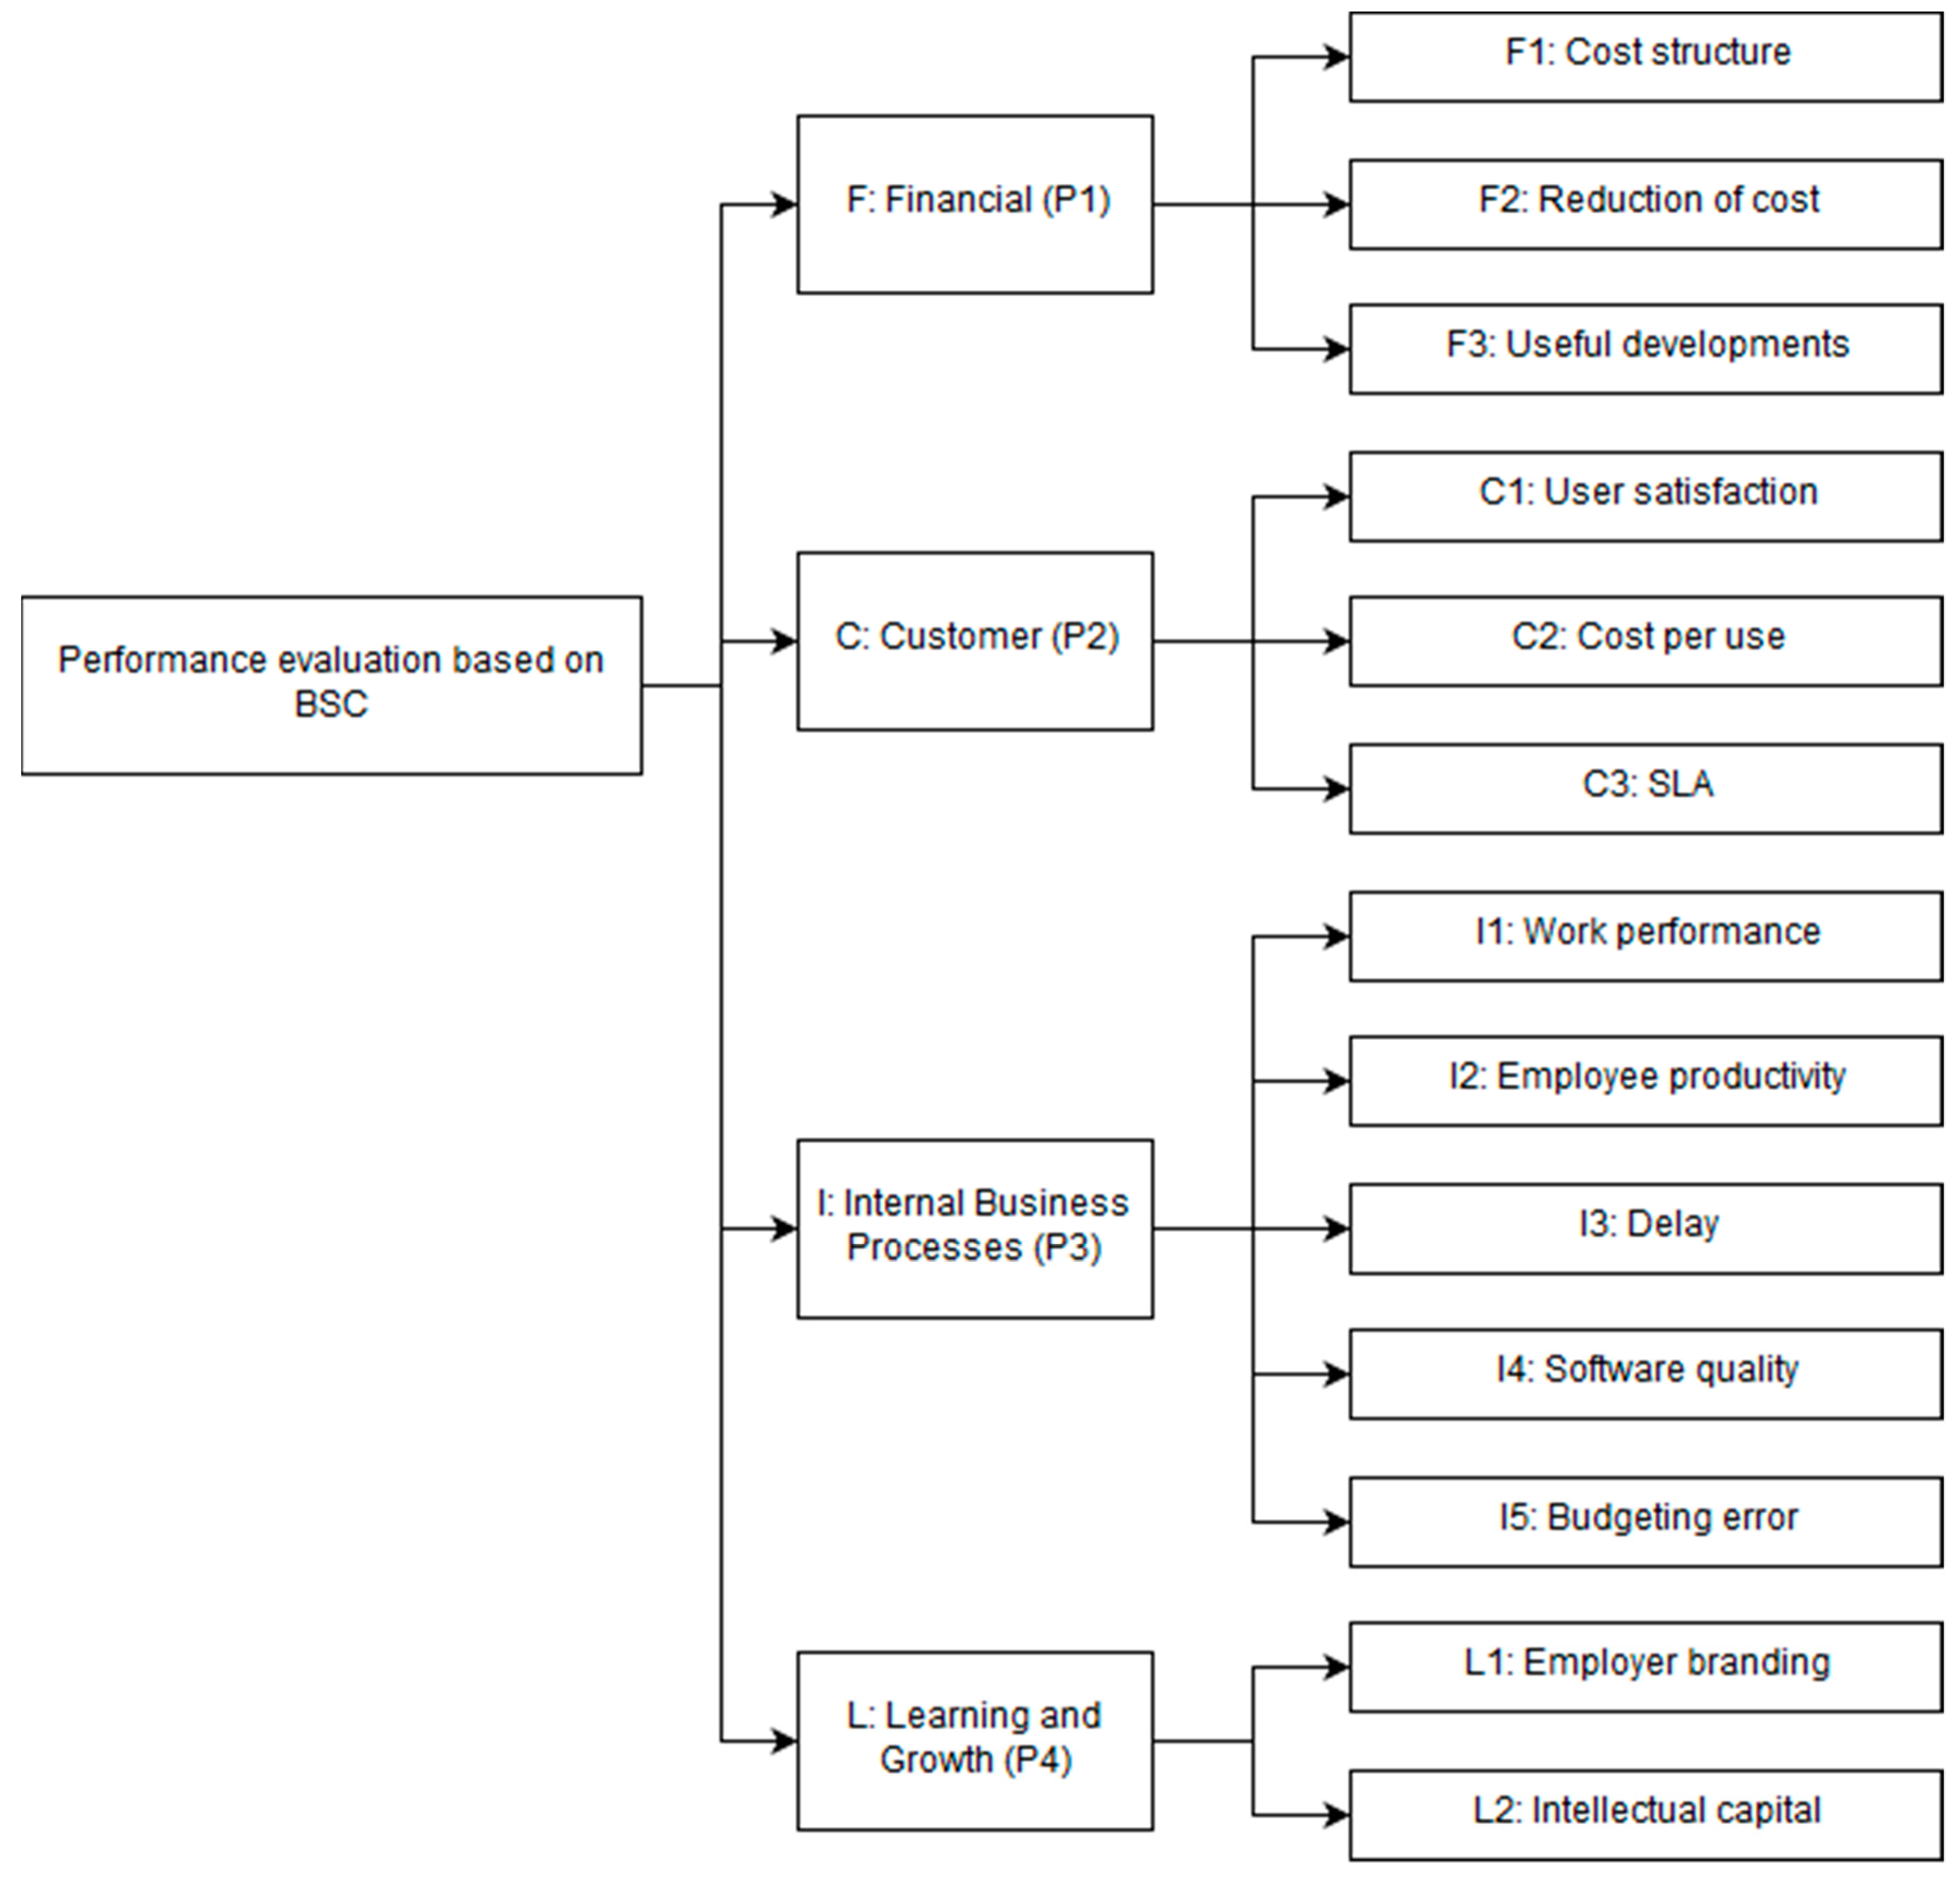
Table 4 summarize the BSC KPIs, which includes the four usual perspectives: Financial, Customer, Internal Business Processes, and Learning and Growth. The KPIs were derived from the strategic goals of the organization.
This framework has been preferred among other existing frameworks in the literature [28] because it has been designed tailored to the environment of this kind of FSF and is the one established in the studied company. Some of the KPIs are simple (i.e., F2-Reduction of cost), but others are complex (i.e., C1-User Satisfaction, C3-SLA, I4-Software Quality, or L1-Employer Branding) because they group several sub-indicators. The description of the KPIs included in the BSC, the method used to measure every KPI, and their justification are extensively explained in [27].

3.1. Analytic Hierarchy Process Method

The method was devised by Saaty in the 1970s [3] and it has been adopted as one of the most used MCDM processes until now. The method is used to prioritize the relative importance of criteria by making pairwise comparisons, instead of sorting, voting, or freely assigning priorities. Saaty establishes an intensity of importance for the comparisons on an absolute scale with nine levels, which is known as Saaty’s scale [29]. The method starts with defining the goal of the decision and the alternatives and structuring them in a hierarchy. Then, the pairwise comparison of criteria in each category is performed, and the priorities are derived.
If an alternative A i is preferable to an alternative A j , then the value of the comparison scale P c ( A i , A j ) =   a i j indicates the intensity of relative importance of A i over A j . The matrix A is the result of all of the comparisons and represents the relative importance a i j of each element.
The method uses the principal eigenvalue method to derive the priorities. The calculation of weights relies on an iterative process in which matrix A is successively multiplied by itself, resulting in normalized weights, w i , which represents the importance of alternative A i relative to all other alternatives.
The judgment of decision-makers in pairwise comparisons may present inconsistencies when all of the alternatives are taken into consideration simultaneously. So, the consistency index (CI) and the consistency ratio (CR) are calculated to measure the degree to which judgments are not coherent [30]. It is normally considered that if CR < 0.10, then the degree of consistency is satisfactory [31]. If the maximum eigenvalue, CI, and CR are satisfactory, then a decision is taken based on the normalized values; else, the procedure is repeated until these values lie in a desired range.
A good description of the usage and different applications of AHP can be found at the work of Ishizaka and Labib [32]. The evolution of the method can be also followed in the Emrouznejad and Marra publication [33]. The application related to this work is the utilization of AHP for priority and ranking, where it has been extensively used.
The application of AHP it is not always easy. The number of comparisons grows exponentially according to the number different criterion to be considered. The scale presents some difficulties also, being subjective for the decision-makers discerning between the different levels of intensity of importance when comparing two alternatives. As Buckley and Uppuluri [34] remark, “It is difficult for people to always assign exact ratios when comparing two alternatives.” In a similar way, Chang [35] states that, “Due to the complexity and uncertainty involved in real world decision problems, it is sometimes unrealistic or even impossible to require exact judgments.” In addition, the consistency analysis is complicated when a large number of decision-makers are involved, resulting in a complex post-processing process that could entail leaving out several opinions. In addition, despite its wide use, the method is not free of criticism from various perspectives. For example, Costa and Vansnick [36] state that the priority vector derived can violate the so-called “condition of order preservation” that is fundamental in decision-making.
For a long period, the predominant tendency was to extend the method by hybridizing it with other methods and thus introducing a higher complexity. The original method was combined with Fuzzy Set theory [37] given the Fuzzy Analytic Hierarchy Process (FAHP) method [35]. Regardless, the introduced complexity of these new methods (more complex questionnaires, fuzzification and defuzzification models, complexity when calculation, and difficulty of interpretation of the results), there is some controversy about the real benefits. For example, the paper published by K. Zhü openly criticizes the fuzzy approaches to AHP [38]. The author claims that despite the popularity of the method, this approach has problems, stating that the operational rules of fuzzy numbers oppose the logic of the AHP and analyzing the validity, among other things. K. Zhü holds the opinion that, “It is not necessary to use a complex paradigm to express complex things, sometimes a simple paradigm may be better.” Thomas L. Saaty has also paid close attention to these extensions, writing some papers from a critical perspective [39,40]. By contrast, a tendency has recently emerged trying to simplify the application of the method as much as possible. For example, Leal [41] develops a simplified method that calculates the priorities of each alternative against a set of criteria with only n − 1 comparisons of n alternatives for each criterion, instead of n*(n − 1)/2 comparisons in the original method.
In any case, our study does not concern the validity or not of the AHP and its extensions, but we want to emphasize the idea that the simplest methods under certain conditions are the most appropriate. Under this context, the Bradley-Terry model could be an easier method, as the Saaty’s scale could be transformed in a win-to-loss scale (the decision-makers only need to specify which criterion is preferred in the comparison, without grading the intensity of importance), and the computing of data might be simpler.

3.2. Bradley-Terry Model and BSC Integration

The Bradley-Terry model [42] is a method of analysis of paired comparisons based on the logit model. A general introduction can be found in Agresti [9]. Given a pair of individuals i and j / (i,j ∈{1, …, K}), the model estimates the probability that i is preferred to j as:
P ( i > j ) = p i p i + p j .
In the Expression (1), pi is a positive real-valued score (the underlying worth of each item) assigned to individual i and P(i > j) + P(j > i) = 1 for all of the pairs. The Bradley-Terry model uses exponential score functions, so the probability of selection is expressed in terms of exponential functions:
p i = e β i
Thus, Expression (1) can be expressed as:
P ( i > j ) = e β i e β i + e β j .
Alternatively, it can be expressed using the logit as:
l o g i t ( P ( i > j ) ) = log ( P ( i > j ) 1 P ( i > j ) ) = log ( P ( i > j ) P ( j > i ) ) = β i β j .
Then, the parameters {pi} can be estimated by maximum likelihood using the Zermelo [43] method. Standard software for generalized linear models can be used for the computing as described by Turner and Firth [44], who are the authors of one of the most used packages for Bradley-Terry calculation under R software.
The observations required are the outcomes of previous comparisons, which are expressed as pairs (i,j), counting the number of times that i is preferred to j and summarizing these outcomes as wij. Thus, wij accounts the times that an indicator i was preferred to j by the decision-makers. The log-likelihood of {pi} can be obtained as:
( p ) = i = 1 m j = 1 m [ w i j ln ( p i ) w i j ln ( p i + p j ) ] .
It is assumed by convention that wii = 0. Starting from an arbitrary vector p, the algorithm iteratively performs the update
p i = W i ( i j w i j + w j i p i + p j ) 1
for all i, where Wi is the number of comparisons ‘won’ by i. After computing all the parameters, they should be renormalized, so i p i = 1 .
Additional extensions have been proposed. For example Böckenholt [45] proposed a method for ranking more than two options. The model has also been extended to allow ordinal comparisons. In this case, the subjects can make their preference decisions on more than two preference categories. The works of Tutz [46], Agresti [47], Dittrich et al. [48], and Casalicchio et al. [49] provide extensions in this sense. However, they are unnecessary here, because our goal is to retrieve the underlying relative worth of each indicator in a simple way. For the calculation, statistical packages have been developed and described in the literature, most of them R extensions: Firth [50], Turner and Firth [44], Hankin [51], or Clark [52], for example.
In terms of calculation, the process starts surveying the decision-makers through a pairwise questionnaire. The difference with respect to the AHP method is that Saaty’s scale is not used. Instead, they indicate which indicator is the most important (the ‘winner’), without expressing a degree of preference. Then, a table is built summarizing the number of times each indicator ‘wins’. For example, in the case of 4 KPIs, the table will follow the structure shown in Table 5:
Here, Nij stands for the number of times KPIi was preferred to KPIj. This is a form of coding widely used by most R extensions that allows the calculations of the Bradley-Terry model.

3.3. Method and Empirical Application

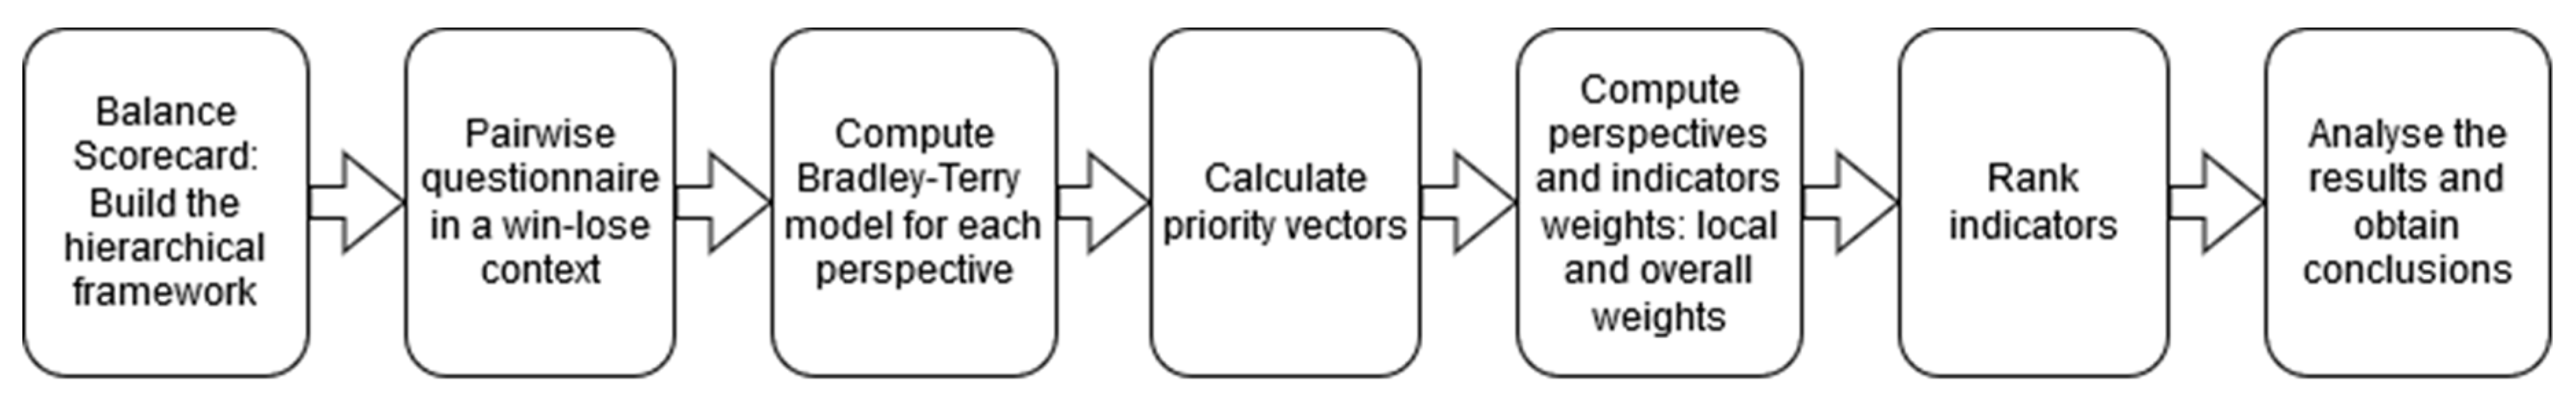
A demonstration of the method is explained in this section. It is necessary to bear in mind that in this case, we have started from the data collected in our former study [53]. The entire process is enumerated, although only those steps specific of the Bradley-Terry modeling are presented in detail. The steps taken to achieve this purpose are:
  • Analyze the BSC of the studied organization.
  • Define the hierarchical framework according to each perspective of the BSC.
  • Survey the decision-makers’ opinions regarding the indicators and perspectives of the BSC using a pairwise questionnaire in a win-to-loss context.
  • Prepare the answers to be processed with Bradley-Terry software.
  • Compute the perspectives and indicators’ weights.
  • Rank the indicators.
  • Analyze the results and obtain conclusions.
The process is depicted in Figure 1.
Figure 2 shows the hierarchical model of the BSC. The specific set of 13 KPIs (Table 1, Table 2, Table 3 and Table 4) are grouped according to their related perspective.
According to the hierarchical structure shown in Figure 2, a conventional questionnaire in AHP format was distributed. The questionnaires were sent to different internal and external stakeholders of the company and some experts in the field of software factories to ask for their professional point of view on sustainability and performance goals in relation to the company scenario. The number of questionnaires sent was 83, and the number of received questionnaires was 61, which represents 73% of the total of questionnaires sent. A detailed description of the considered roles and additional details about the survey process can be found in the section “Data Collection” from our former paper, where the AHP prioritization was published [53].
In this particular case, we have started from an AHP conventional questionnaire, following the scale proposed by Saaty [29], but we have transformed the answers into a win-to-loss context for the application of our method. For each comparison, we have considered only who is the winner (the preferred factor by the expert in the comparison) and the loser, regardless of the intensity of the preference. We have considered the special case of equal importance as a tie. It must be taken into consideration that our proposal starting from scratch consists of carrying out a questionnaire without considering intensities, simply forcing the respondent to indicate the most important factor in the pairwise comparison (or equal).
As a consequence, five different files were built, as shown in Table 6, Table 7, Table 8, Table 9 and Table 10. Table 6 shows decision-makers’ preferences regarding the four different perspectives, which are denoted as P1, …, P4. The column Win1 denotes the number of times that Factor 1 was preferred over Factor 2. For example, the first row in Table 6 indicates that P1 (Financial Perspective) was preferred by 13 of the respondents over P2 (Customer Perspective), and P2 was preferred by 48 of the respondents over P1. The particular case when the respondent has indicated equal importance is considered as a tie, and then a half point is assigned to each factor, truncating the result to an integer number in order to be computed by the Bradley-Terry model.
The data was processed using the extension “BradleyTerry2” for R, following the process described by Turner and Firth [44]. RStudio version 1.2.1335 was used for the computation with a standard Core i5 computer. The standard Bradley-Terry model was used alongside fitting by maximum likelihood. The coefficients returned by the model ( β ^ i ) are the model estimations setting β ^ 0 = 0 . In order to turn these coefficients into the BSC weights w i , they must be transformed calculating e x p ( β ^ i ) and normalizing the setting i ( β ^ i ) = 1 . The results for the BSC perspectives are presented in Table 11 as an example.
We have all the local weights of the indicators after computing the Bradley-Terry model for each set (Table 7, Table 8, Table 9 and Table 10), denoted w P i j (the weight of the indicator j belonging to the perspective i). The next step is to calculate the overall weights of the sub-criteria, W P i j . The local weight of each sub-criteria is multiplied by its corresponding relative importance of the criteria ( w P i ) . Mathematically, it can be expressed as given in Equation (7). The overall weight is finally used for ranking the indicators.
W P i j = w P i * w P i j

4. Results and Discussion

The results after processing all the data are presented in Table 12 and Table 13. The number of considered questionnaires that passed the consistency test when computing the AHP was 44. In order to compare results, the Bradley-Terry model has been calculated in two different ways: computing the 61 questionnaires (denoted as Bradley-Terry-61) and computing the 44 questionnaires (denoted as Bradley-Terry-44) that have passed the AHP consistency test.
Table 12 shows the local weights for the computed Bradley-Terry model compared with the local results provided by the application of the AHP [53]. Table 13 presents the overall weights as well as the ranking of each one.
The results indicate that the “Customer Perspective” is the main point of attention, followed by the “Finance Perspective”. The “Learning and Growth” and “Internal Processes” perspectives, almost with the same weights, are the least considered. The rank remains unchanged regardless of the method used. As can be noted from Table 12, the weights are quite similar for every indicator.
Regarding the indicators, the differences are not significant. The indicators “User Satisfaction” and “SLA” are the most rated for all the methods, followed by the “Intellectual Capital”, Taking the AHP weights as reference, the mean square error considering Bradley-Terry with 61 questionnaires is 0.01 and considering 44 questionnaires is 0.001. In addition, the only difference in the rank is one position between F1 (Cost Structure) and C2 (Cost per use), as remarked with bold font in Table 13.
Figure 3 helps to visualize the different weights of the models for each indicator. As it can be noticed, there are few differences. The most notable difference is that the Bradley-Terry models increase the weight of the C1 indicator (User Satisfaction) compared to AHP.
Therefore, in view of the results, it is shown that the proposed method can be used as an alternative to AHP. One of the main advantages is the simplification of the scale (‘win-to-loss’ context instead of the traditional 9-point scale), which can be an advantage when the decision-makers have to make many comparisons and run the risk of losing the rigor. Another advantage derived from the previous is that the level of inconsistency is more reduced. In addition, the calculation of the Bradley-Terry model is tolerant to missing comparisons; therefore, to some extent, the comparisons could be reduced or it could be accepted that decision-makers do not answer all the comparisons.
The main limitation derives from the fact that the method can only be applied in a context of group consensus among several decision-makers. This should not be a problem in the applied field, since the prioritization of indicators is always carried out with the idea of combining different opinions. However, it remains unclear whether there is a minimum number of participants required for the application of the method. A further study could be performed to investigate more about this aspect. In addition, another limitation is that the method does not incorporate any mechanism to check for the consistency. In the case studied, the method provided reliable results even for the data that had not passed the AHP consistency test (BTM-61), but it is unclear whether the behavior works against more severe levels of inconsistency in the responses. The search for an inconsistency index that is applicable to win-to-loss pairwise comparisons is proposed as further work. The survey done by Brunelli [54] could constitute a good starting point. The author appoints several methods for different representations of pairwise comparisons and also details how to deal with group decision-making. Once a valid index is identified, a comparison of the results from the different methods could be performed in a similar way to the analysis done by Genest and M’Lan [19]. Finally, another limitation of this study is that it has been validated only in the exposed case. The case is very general and representative, but as mentioned, aspects not studied such as the sensitivity to the degree of inconsistency or the number of responses might generate uncertainty.

5. Conclusions

The case of how to determine the weights of the BSC KPIs based on the Bradley-Terry model is presented here. The method, compared with a traditional application of AHP, provides quite similar results while simplifying the whole process, even more if we consider more complicated variations of AHP such as for example Fuzzy AHP. This aligns with the statements of other authors (i.e., Zucco Jr et al. [22] and Clark et al. [52]).
The scale for the comparisons was simplified regarding the usual AHP scale, considering only the winner and the loser of the pairwise comparisons, accepting ties also as an option. This is an important advantage when decision-makers must make the assessments, since it simplifies comparisons, especially when there are many factors to consider.
The method exposed also has the advantage of simplifying the calculation process by not having to evaluate the consistency ratio. The consistency test procedure followed with AHP involves usually analyzing those decision-makers’ answers that cause the consistency ratio to fall below the limits. In the AHP base case, the answers from 17 decision-makers had not been considered because of this effect. This could be a significant issue in surveys with few decision-makers.
Based on the experience implementing this model within the studied company, we could remark as an important conclusion that what really matters is not the exact weight of each indicator but rather the general ranking of indicators. Under this situation, we can state that using a more simplified method such as the one presented here does not provide significant differences regarding the ranking of indicators. So, when planning the deployment of a performance management system, it should be considered whether using a more complex method such as AHP is worthwhile.
This paper contributes to the multi-criteria decision-making domain reporting a successful application of the Bradley-Terry model for weighting the BSC with a simplified scale for the pairwise comparisons and confronting against the AHP results, which is something that has been barely documented in the literature. The method was applied to the case of a Spanish software company, but the approach could be extrapolated to any organization that presents a similar framework to the one exposed. The combination of AHP methods with BSC has been demonstrated in the literature to be a very valuable tool for performance evaluation and making strategic decisions. However, comparing the results obtained using AHP with the Bradley-Terry model, we believe that the AHP does not add extra value in this situation; meanwhile, the calculation is slightly more complex.

Author Contributions

Conceptualization, V.R.M. and C.Á.P.; formal analysis, J.M.V.B. and M.D.P.; investigation, V.R.M. and C.Á.P.; methodology, V.R.M.; supervision, V.R.M.; writing—original draft, V.R.M.; writing—review and editing, M.D.P. and J.M.V.B. All authors have read and agreed to the published version of the manuscript.

Funding

This work has been subsidized through the Plan of Science, Technology and Innovation of the Principality of Asturias (Ref: FC-GRUPIN-IDI/2018/000225).

Conflicts of Interest

The authors declare no conflict of interest.

References

  1. Kaplan, R.S.; Norton, D.P. The balanced scorecard—Measures that drive performance. Harv. Bus. Rev. 1992, 70, 71–79. [Google Scholar] [PubMed]
  2. Kaplan, R.S.; Norton, D.P. Putting the balanced scorecard to work. Harv. Bus. Rev. 1993, 71, 134–140. [Google Scholar]
  3. Saaty, T.L. A scaling method for priorities in hierarchical structures. J. Math. Psychol. 1977, 15, 234–281. [Google Scholar] [CrossRef]
  4. Clinton, B.D.; Webber, S.A.; Hassell, J.M. Implementing the balanced scorecard using the analytic hierarchy process. Manag. Account. Q. 2002, 3, 1–11. [Google Scholar]
  5. Reisinger, H.; Cravens, K.S.; Tell, N. Prioritizing performance measures within the balanced scorecard framework. Manag. Int. Rev. 2003, 43, 429. [Google Scholar]
  6. Vaidya, O.S.; Kumar, S. Analytic hierarchy process: An overview of applications. Eur. J. Oper. Res. 2006, 169, 1–29. [Google Scholar] [CrossRef]
  7. Saaty, T.L. On the measurement of intengibles. A principal eigenvector approach to relative measurement derived from paired comparisons. Not. Am. Math. Soc. 2013, 60, 192–208. [Google Scholar] [CrossRef]
  8. Leung, L.C.; Cao, D. On consistency and ranking of alternatives in fuzzy AHP. Eur. J. Oper. Res. 2000, 124, 102–113. [Google Scholar] [CrossRef]
  9. Agresti, A. Categorical Data Analysis; John Wiley & Sons: Hoboken, NJ, USA, 2003; Volume 482, ISBN 0-471-45876-7. [Google Scholar]
  10. McHale, I.; Morton, A. A Bradley-Terry type model for forecasting tennis match results. Int. J. Forecast. 2011, 27, 619–630. [Google Scholar] [CrossRef]
  11. Koehler, K.J.; Ridpath, H. An application of a biased version of the Bradley-Terry-Luce model to professional basketball results. J. Math. Psychol. 1982, 25, 187–205. [Google Scholar] [CrossRef]
  12. Király, F.J.; Qian, Z. Modelling Competitive Sports: Bradley-Terry- Élő Models for Supervised and On-Line Learning of Paired Competition Outcomes. arXiv 2017, arXiv:170108055. [Google Scholar]
  13. Stigler, S.M. Citation patterns in the journals of statistics and probability. Stat. Sci. 1994, 94–108. [Google Scholar] [CrossRef]
  14. Courcoux, P.; Semenou, M. Preference data analysis using a paired comparison model. Food Qual. Prefer. 1997, 8, 353–358. [Google Scholar] [CrossRef]
  15. Loewen, P.J.; Rubenson, D.; Spirling, A. Testing the power of arguments in referendums: A Bradley-Terry approach. Elect. Stud. 2012, 31, 212–221. [Google Scholar] [CrossRef]
  16. Fienberg, S.E.; Meyer, M.M. Loglinear models and categorical data analysis with psychometric and econometric applications. J. Econom. 1983, 22, 191–214. [Google Scholar] [CrossRef]
  17. Cattelan, M. Models for paired comparison data: A review with emphasis on dependent data. Stat. Sci. 2012, 412–433. [Google Scholar] [CrossRef]
  18. Dykstra, O. Rank analysis of incomplete block designs: A method of paired comparisons employing unequal repetitions on pairs. Biometrics 1960, 16, 176–188. [Google Scholar] [CrossRef]
  19. Genest, C.; M’lan, C.-É. Deriving priorities from the Bradley-Terry model. Math. Comput. Model. 1999, 29, 87–102. [Google Scholar] [CrossRef]
  20. Golpîra, H.; Veysi, B. Flexible balanced Scorecard for nonprofit organizations. Adv. Ind. Eng. Inf. Water Resour. 2012, 139–146. [Google Scholar]
  21. Bhar, C.; Srivastava, V. Environmental capability: A Bradley-Terry model-based approach to examine the driving factors for sustainable coal-mining environment. Clean Technol. Environ. Policy 2018, 20, 995–1016. [Google Scholar]
  22. Zucco, C., Jr.; Batista, M.; Power, T.J. Measuring portfolio salience using the Bradley-Terry model: An illustration with data from Brazil. Res. Polit. 2019, 6, 2053168019832089. [Google Scholar]
  23. Dorton, S.; Frommer, I.; Bailey, M.; Sotomayor, T. Prioritizing Design Goals for a Medical Simulator Using Pairwise Comparisons. In Proceedings of the Human Factors and Ergonomics Society Annual Meeting, Philadelphia, PA, USA, 1–5 October 2018; SAGE Publications Sage CA: Los Angeles, CA, USA, 2018; Volume 62, pp. 1648–1652. [Google Scholar]
  24. Janíčková, N.; Žižlavský, O. Key performance indicators and the Balanced Scorecard approach in small and medium-sized enterprises: A literature review. In Proceedings of the International Conference at Brno University of Technology—Faculty of Business and Management, Brno, Czech Republic, 30 April 2019. [Google Scholar]
  25. Quesado, P.R.; Aibar Guzmán, B.; Lima Rodrigues, L. Advantages and contributions in the balanced scorecard implementation. Intang. Cap. 2018, 14, 186–201. [Google Scholar] [CrossRef] [Green Version]
  26. Janeš, A.; Kadoić, N.; Begičević Ređep, N. Differences in prioritization of the BSC’s strategic goals using AHP and ANP methods. J. Inf. Organ. Sci. 2018, 42, 193–217. [Google Scholar] [CrossRef]
  27. Álvarez, C.; Rodríguez, V.; Ortega, F.; Villanueva, J. A Scorecard Framework Proposal for Improving Software Factories’ Sustainability: A Case Study of a Spanish Firm in the Financial Sector. Sustainability 2015, 7, 15999–16021. [Google Scholar] [CrossRef] [Green Version]
  28. Peredo Valderrama, R.; Canales Cruz, A.; Peredo Valderrama, I. An Approach Toward a Software Factory for the Development of Educational Materials under the Paradigm of WBE. Interdiscip. J. E-Learn. Learn. Objects 2011, 7, 55–67. [Google Scholar] [CrossRef] [Green Version]
  29. Saaty, T.L. How to make a decision: The analytic hierarchy process. Eur. J. Oper. Res. 1990, 48, 9–26. [Google Scholar] [CrossRef]
  30. Sharma, M.K.; Bhagwat, R. An integrated BSC-AHP approach for supply chain management evaluation. Meas. Bus. Excell. 2007, 11, 57–68. [Google Scholar] [CrossRef]
  31. Saaty, T.L. An exposition of the AHP in reply to the paper “remarks on the analytic hierarchy process”. Manag. Sci. 1990, 36, 259–268. [Google Scholar] [CrossRef]
  32. Ishizaka, A.; Labib, A. Review of the main developments in the analytic hierarchy process. Expert Syst. Appl. 2011, 38, 14336–14345. [Google Scholar] [CrossRef] [Green Version]
  33. Emrouznejad, A.; Marra, M. The state of the art development of AHP (1979–2017): A literature review with a social network analysis. Int. J. Prod. Res. 2017, 55, 6653–6675. [Google Scholar] [CrossRef] [Green Version]
  34. Buckley, J.J.; Uppuluri, V.R.R. Fuzzy hierarchical analysis. In Uncertainty in Risk Assessment, Risk Management, and Decision Making; Springer: New York, NY, USA, 1987; pp. 389–401. [Google Scholar]
  35. Chang, D.-Y. Applications of the extent analysis method on fuzzy AHP. Eur. J. Oper. Res. 1996, 95, 649–655. [Google Scholar] [CrossRef]
  36. Costa, C.A.B.; Vansnick, J.-C. A critical analysis of the eigenvalue method used to derive priorities in AHP. Eur. J. Oper. Res. 2008, 187, 1422–1428. [Google Scholar] [CrossRef]
  37. Zadeh, L.A. Fuzzy sets. Inf. Control 1965, 8, 338–353. [Google Scholar] [CrossRef] [Green Version]
  38. Zhü, K. Fuzzy analytic hierarchy process: Fallacy of the popular methods. Eur. J. Oper. Res. 2014, 236, 209–217. [Google Scholar] [CrossRef]
  39. Saaty, T.L. There is no mathematical validity for using fuzzy number crunching in the analytic hierarchy process. J. Syst. Sci. Syst. Eng. 2006, 15, 457–464. [Google Scholar] [CrossRef]
  40. Saaty, T.L.; Tran, L.T. On the invalidity of fuzzifying numerical judgments in the Analytic Hierarchy Process. Math. Comput. Model. 2007, 46, 962–975. [Google Scholar] [CrossRef]
  41. Leal, J.E. AHP-express: A simplified version of the analytical hierarchy process method. MethodsX 2019, 7, 100748. [Google Scholar] [CrossRef]
  42. Bradley, R.A.; Terry, M.E. Rank analysis of incomplete block designs: I. The method of paired comparisons. Biometrika 1952, 39, 324–345. [Google Scholar] [CrossRef]
  43. Zermelo, E. Die berechnung der turnier-ergebnisse als ein maximumproblem der wahrscheinlichkeitsrechnung. Math. Z. 1929, 29, 436–460. (In German) [Google Scholar] [CrossRef]
  44. Turner, H.; Firth, D. Bradley-Terry models in R: The BradleyTerry2 package. J. Stat. Softw. 2012, 48, 1–21. [Google Scholar] [CrossRef] [Green Version]
  45. Böckenholt, U. Hierarchical modeling of paired comparison data. Psychol. Methods 2001, 6, 49. [Google Scholar] [CrossRef] [PubMed]
  46. Tutz, G. Bradley-Terry-Luce models with an ordered response. J. Math. Psychol. 1986, 30, 306–316. [Google Scholar] [CrossRef]
  47. Agresti, A. Analysis of ordinal paired comparison data. J. R. Stat. Soc. Ser. C Appl. Stat. 1992, 41, 287–297. [Google Scholar] [CrossRef]
  48. Dittrich, R.; Francis, B.; Hatzinger, R.; Katzenbeisser, W. A paired comparison approach for the analysis of sets of Likert-scale responses. Stat. Model. 2007, 7, 3–28. [Google Scholar] [CrossRef] [Green Version]
  49. Casalicchio, G.; Tutz, G.; Schauberger, G. Subject-specific Bradley-Terry-Luce models with implicit variable selection. Stat. Model. 2015, 15, 526–547. [Google Scholar] [CrossRef] [Green Version]
  50. Firth, D. Bradley-Terry models in R. J. Stat. Softw. 2005, 12, 1–12. [Google Scholar] [CrossRef] [Green Version]
  51. Hankin, R.K. Partial Rank Data with the hyper2 Package: Likelihood Functions for Generalized Bradley-Terry Models. R J. 2017, 9, 429–439. [Google Scholar] [CrossRef]
  52. Clark, A.P.; Howard, K.L.; Woods, A.T.; Penton-Voak, I.S.; Neumann, C. Why rate when you could compare? Using the “EloChoice” package to assess pairwise comparisons of perceived physical strength. PLoS ONE 2018, 13, e0190393. [Google Scholar] [CrossRef] [Green Version]
  53. Álvarez Pérez, C.; Rodríguez Montequín, V.; Ortega Fernández, F.; Villanueva Balsera, J. Integrating Analytic Hierarchy Process (AHP) and Balanced Scorecard (BSC) Framework for Sustainable Business in a Software Factory in the Financial Sector. Sustainability 2017, 9, 486. [Google Scholar] [CrossRef] [Green Version]
  54. Brunelli, M. A survey of inconsistency indices for pairwise comparisons. Int. J. Gen. Syst. 2018, 47, 751–771. [Google Scholar] [CrossRef]
Figure 1. Process framework.
Mathematics 08 00276 g001
Figure 2. Hierarchical framework of Balance Scorecard (BSC) performance evaluation criteria for a Financial Software Factory (FSF). Adapted from [27,53].
Mathematics 08 00276 g002
Figure 3. Sub-criteria (KPIs) weights chart comparing the models.
Mathematics 08 00276 g003
Table 1. Summary of the financial perspective key performance indicators (KPIs).
CodeNameDescription
F1Cost StructureAssess the cost evolution in relation to the matrix financial entity size. When the size of the matrix financial group decreases, the costs of the software factory should also decrease in a similar proportion.
F2Reduction of CostThe goal of this KPI is to evaluate the percentage of the structural cost of the software factory that is covered by incomes derived by sales to companies outside the corporate group. As a result of the huge cost of software development, sales revenue outside the financial group owner is generally seen as the major reduction of costs.
F3Useful DevelopmentsMeasure the use of the delivered software by the customers. In this particular case, where the company uses a pay-per-use model, the degree of use of the developments is indicated by the number of software executions, and the indicator is calculated as the cumulative number of these executions in relation to the size of the financial institution over the last year. The greater the use, the higher the incomes that should be achieved. It indicates also that the delivered software is useful.
Table 2. Summary of the customer perspective key performance indicators.
CodeNameDescription
C1User SatisfactionThe indicator measures the degree of customer satisfaction concerning software delivered and services provided by the company. User satisfaction KPI is defined as “the overall level of compliance with the user expectations, measured as a percentage of really met expectations”. Therefore, the indicator is an aggregate measure of user satisfaction with various aspects of the service.
C2Cost per UseThe ratio between the cost paid by the company customers and the degree of use of the provided software. As it is a pay-per-use model, it is measured by means of the cumulative number of executions as in (F3).
C3Service Level Agreements (SLA)In the financial software sector, the companies provide critical application services for customers, which need effective mechanisms to manage and control them. SLAs are agreements signed between a service provider and another party such as a service consumer, broker agent, or monitoring agent. The proposed index is a multi-indicator that joins and unifies all the agreements reached with the financial group, and more specifically between the financial institution and the FSF.
Table 3. Summary of the internal business processes’ perspective key performance indicators.
CodeNameDescription
I1Work PerformanceThis efficiency indicator is calculated as the ratio between budgeted hours and the performed hours.
I2Employee ProductivityThis ratio reflects the amount of software that an employee produces for each hour on the job.
I3DelayThis indicator shows the average delay in hours.
I4Software QualityAn aggregated indicator that assesses the company software quality.
I5Budgeting ErrorThe indicator shows how good the estimations were over the last year.
Table 4. Summary of the learning and growth perspective key performance indicators.
CodeNameDescription
L1Employer BrandingReputation of the firm as an employer. The most important metrics are employee satisfaction, employee engagement and loyalty, quality of hire, time and cost per hire, job acceptance rate of candidates, number of applicants, employee turnover, increased level of employee referrals, decreased absenteeism, promotion readiness rating, external/internal hire ratio, performance ratings of newly promoted managers, and manager/executive failure rate.
L2Intellectual CapitalAn aggregated indicator that assesses the intellectual capital as a compendium of human, structural, and relational capital.
Table 5. Data aggregation example for the Bradley-Terry calculation in a win-to-loss context.
Factor 1Factor 2Win1Win2
KPI1KPI2N12N21
KPI1KPI3N13N31
KPI1KPI4N14N41
KPI2KPI3N23N32
KPI2KPI4N24N42
KPI3KPI4N34N43
Table 6. Input file of Perspectives (P) preferences in a win-to-loss context.
Factor 1Factor 2Win 1Win 2
P1P21348
P1P33427
P1P43129
P2P35110
P2P45010
P3P43229
Table 7. Input file of Financial (F) factors preferences in a win-to-loss context.
Factor 1Factor 2Win 1Win 2
F1F24119
F1F32931
F2F32634
Table 8. Input file of Customer (C) factors preferences in a win-to-loss context.
Factor 1Factor 2Win 1Win 2
C1C2537
C1C33922
C2C32041
Table 9. Input file of Internal (I) factors preferences in a win-to-loss context.
Factor 1Factor 2Win 1Win 2
I1I24318
I1I33624
I1I42140
I1I53823
I2I33329
I2I41942
I2I53723
I3I41545
I3I53922
I4I55110
Table 10. Input file of Learning and Growth (L) factors preferences in a win-to-loss context.
Factor 1Factor 2Win1Win2
L1L21842
Table 11. Results of fitting the Bradley-Terry model to Perspectives data.
Factor β ^ i e x p ( β ^ i ) w i
P1010.1493
P21.39174.02170.6006
P3−0.17400.84030.1255
P4−0.18090.83450.1246
Table 12. Bradley-Terry local weights compared with the Analytic Hierarchy Process method (AHP).
Criteria and Sub-CriteriaBradley-Terry-61Bradley-Terry-44AHP
(F) Financial0.14930.17790.2035
 (F1) Cost Structure0.40660.44150.4134
 (F2) Reduction of Cost0.23040.22300.2438
 (F3) Useful Developments0.36300.33550.3429
(C) Customer0.60060.57040.4586
 (C1) User Satisfaction0.60320.64550.5411
 (C2) Cost per Use0.11370.10470.1712
 (C3) SLA0.28310.24980.2876
(I) Internal Business Processes0.12550.12910.1712
 (I1) Work Performance0.22070.23650.2118
 (I2) Employee Productivity0.14230.13450.1516
 (I3) Delay0.14240.16580.1587
 (I4) Software Quality0.40050.37530.3698
 (I5) Budgeting Error0.09410.08790.1082
(L) Learning and Growth0.12460.12260.1667
 (L1) Employer Branding0.30000.34880.3708
 (L2) Intellectual Capital0.70000.65120.6292
Table 13. Bradley-Terry overall weights and rank compared with AHP.
Bradley-Terry-61Bradley-Terry-44AHP
Criteria and Sub-CriteriaWeightsRankWeightsRankWeightsRank
(F) Financial
 (F1) Cost Structure0.060750.078540.08414
 (F2) Reduction of Cost0.034490.039790.04969
 (F3) Useful Developments0.054260.059760.06986
(C) Customer
 (C1) User Satisfaction0.362310.368210.24821
 (C2) Cost per Use0.068340.059750.07855
 (C3) SLA0.170020.142520.13192
(I) Internal Business Processes
 (I1) Work Performance0.0277100.0305100.036310
 (I2) Employee Productivity0.0179120.0174120.026012
 (I3) Delay0.0179110.0214110.027211
 (I4) Software Quality0.050370.048470.06337
 (I5) Budgeting Error0.0118130.0114130.018513
(L) Learning and Growth
 (L1) Employer Branding0.037480.042880.06188
 (L2) Intellectual Capital0.087230.079830.10493

