A Risk-Aversion Approach for the Multiobjective Stochastic Programming Problem


Abstract
1. Introduction
2. Literature Review
2.1. Multicriteria Decision-Making and Optimization under Uncertainty
- Weakly efficient if there is no , , such that i.e., for all .
- Efficient or Pareto optimal if there is no such that for all and for some .
- Strictly efficient if there is no , , such that .
2.2. Multiobjective Stochastic Programming
3. Methodology
- If , the resulting OWA is the average of a.
- If , and for , the OWA is the maximum of a.
- If , and for , the OWA is the minimum of a.
- 1.
- Sort vector a such that .
- 2.
- With as the order induced by a, define .
- 3.
- Let f be a function, such that and . This function is called weight generating function.
- 4.
- Obtain the weights as .
- , assuming
- , assuming
- …
- , since
- …
- For , the scenario is the only one needed to obtain the worst scenario with probability , and hence .
- When β equals 0.3 it is necessary to include scenario 2, obtaining a β-average of .
- Finally, if scenario 3 needs to be added as well, but only with the probability needed until reaching : .
- 1.
- As are already ordered for largest to smallest, the values of are:
- 2.
- The values of under f:
- 3.
- The weights of the OWA:
- 4.
- Consequently, the r-OWA is:
- Reflexivity
- Given x, , and then , so ≿ is reflexive.
- Transitiveness
- Given , , we have and , and then , which leads to , and we conclude that ≿ is transitive.
- Antisymmetry
- Given , , we have and , but, from , it cannot be guaranteed that , and, hence, ≿ is not antisymmetric.
3.1. Idea of Solution and Dominance Properties
- For every there is a function to be minimized which depends on the scenario j and the criterion k.
- The problem is transformed into a deterministic one with multiple objectives (MOP) while using the -average concept.
- When computing the r-OWA, each is assigned a scalar. The problem consists of finding the x, which minimizes this .
- 1.
- is not necessarily efficient of the MOP problem.
- 2.
- is weakly efficient of the MOP problem.
- 3.
- If is the only minimum of , then is efficient.
- 4.
- Given not efficient, an alternative can be found on a second phase, such that is efficient and .
3.2. An Illustrative Example
- Step 0
- Normalize all objective functions .
- Step 1
- Set values for .
- Step 2
- For every and every criterion define as:
- Step 3
- Define as:
- Step 4
- Search for minimizing .
- For the first criterion the worst scenario is , which has probability . The second worst is , with a probability of . As the sum of those probabilities exceeds the fixed, for computing the -average just a probability of is considered:
- , ,
4. Computing the Minimum: Continuous Case
Mathematical Programming Model
- For each feasible solution of model (6), there is at least one feasible solution of model (7) with the same values , being so the same objective function.Let be a feasible solution of model (6), and the optimal solution for each k minimizing (right-hand-side of equation (6b)). Because constraints (7), (7c), (7d), and (7e) are satisfied in model (6), is a feasible solution or model (7).
- For each feasible solution of model (7), is a feasible solution of model (6), hence being the same objective function. Let a feasible solution of model (7). Since constraints (7b), (7c) and (7d) are included in model (7), is feasible for the model that is included in the RHS of constraint (6b) and therefore greater than or equal to the minimum of that model, verifying:and so, feasible for model (6).
5. Application to the Knapsack Problem
5.1. Computational Experiments
| Algorithm 1 Generating random data, with the uniform distribution in | |
1: functionrandomInstance() | |
2: | ▹ proportion of objects that can fit on average |
3: | ▹ average weight of each object |
4: for do | |
5: | ▹ weight of each object |
6: for do | |
7: | ▹ value of each object |
8: end for | |
9: end for | |
10: end function | |
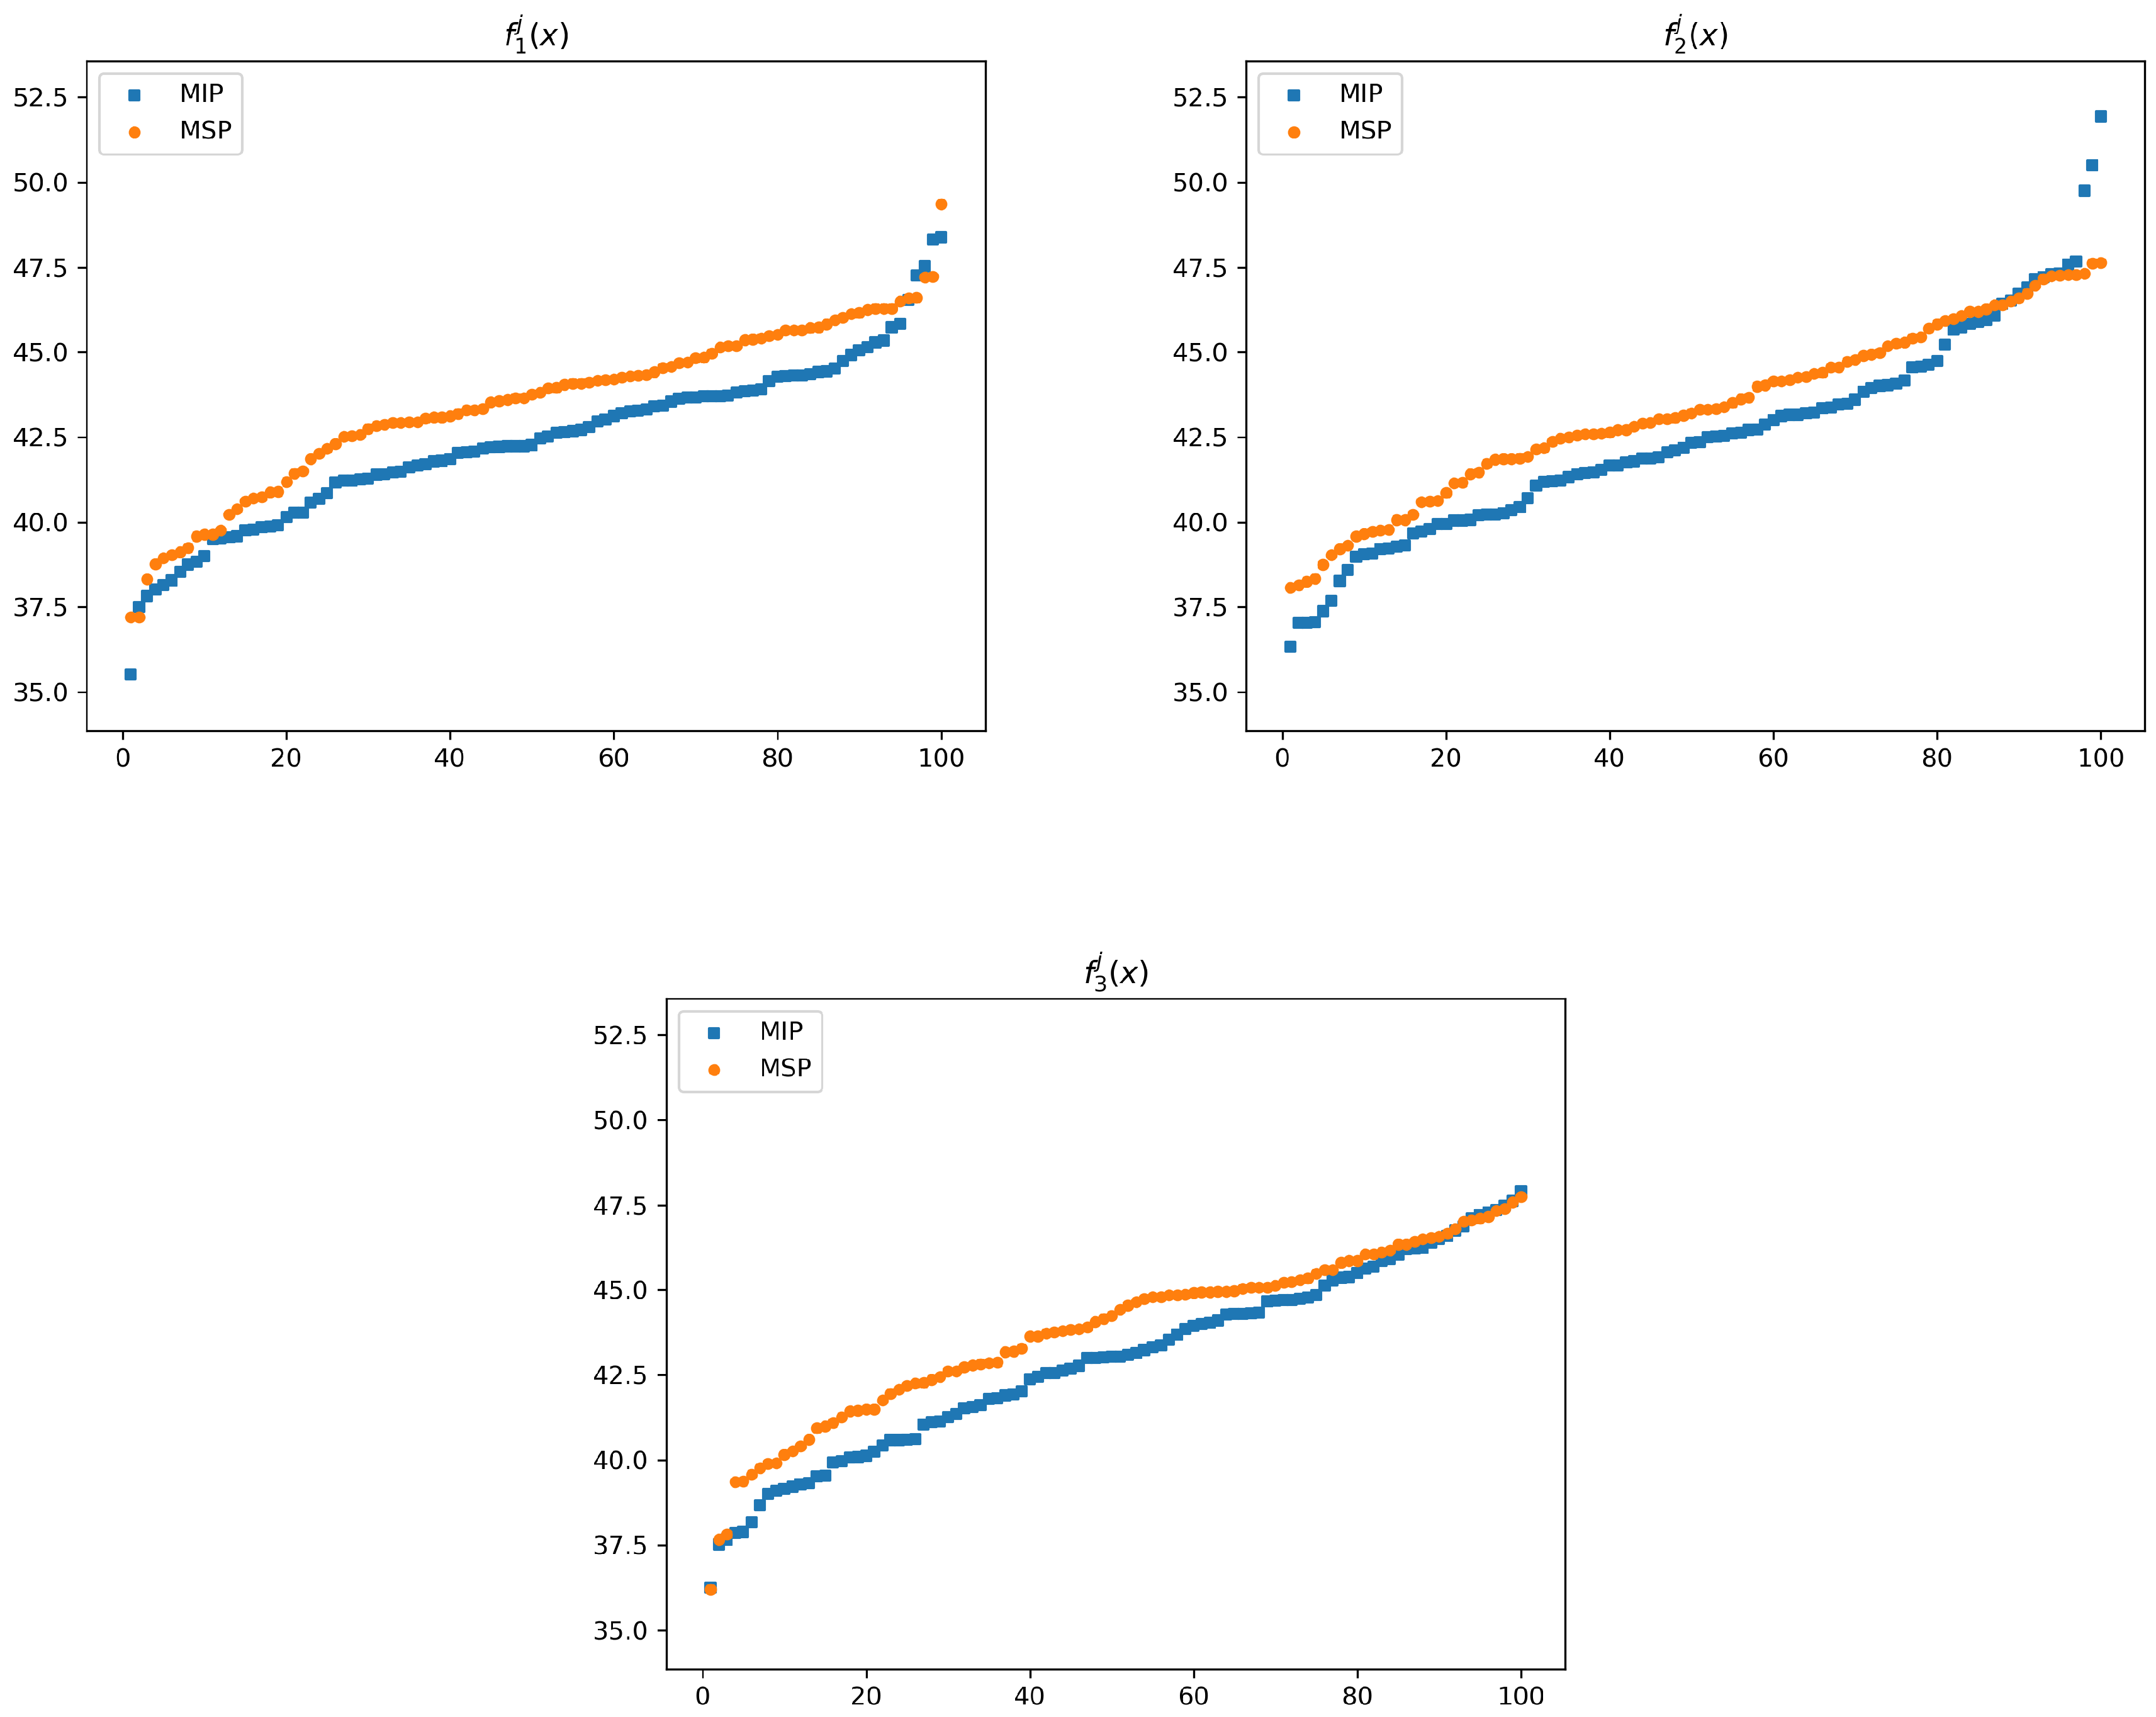
- : solution time in seconds of models (MSP) and (MIP). With them, the following value is calculated:, the time penalty factor, indicates the increase of computing time when solving model (MSP) rather than model (MIP).
- : optimal values of the models.
- : objective value of in model (MSP) and vice versa.
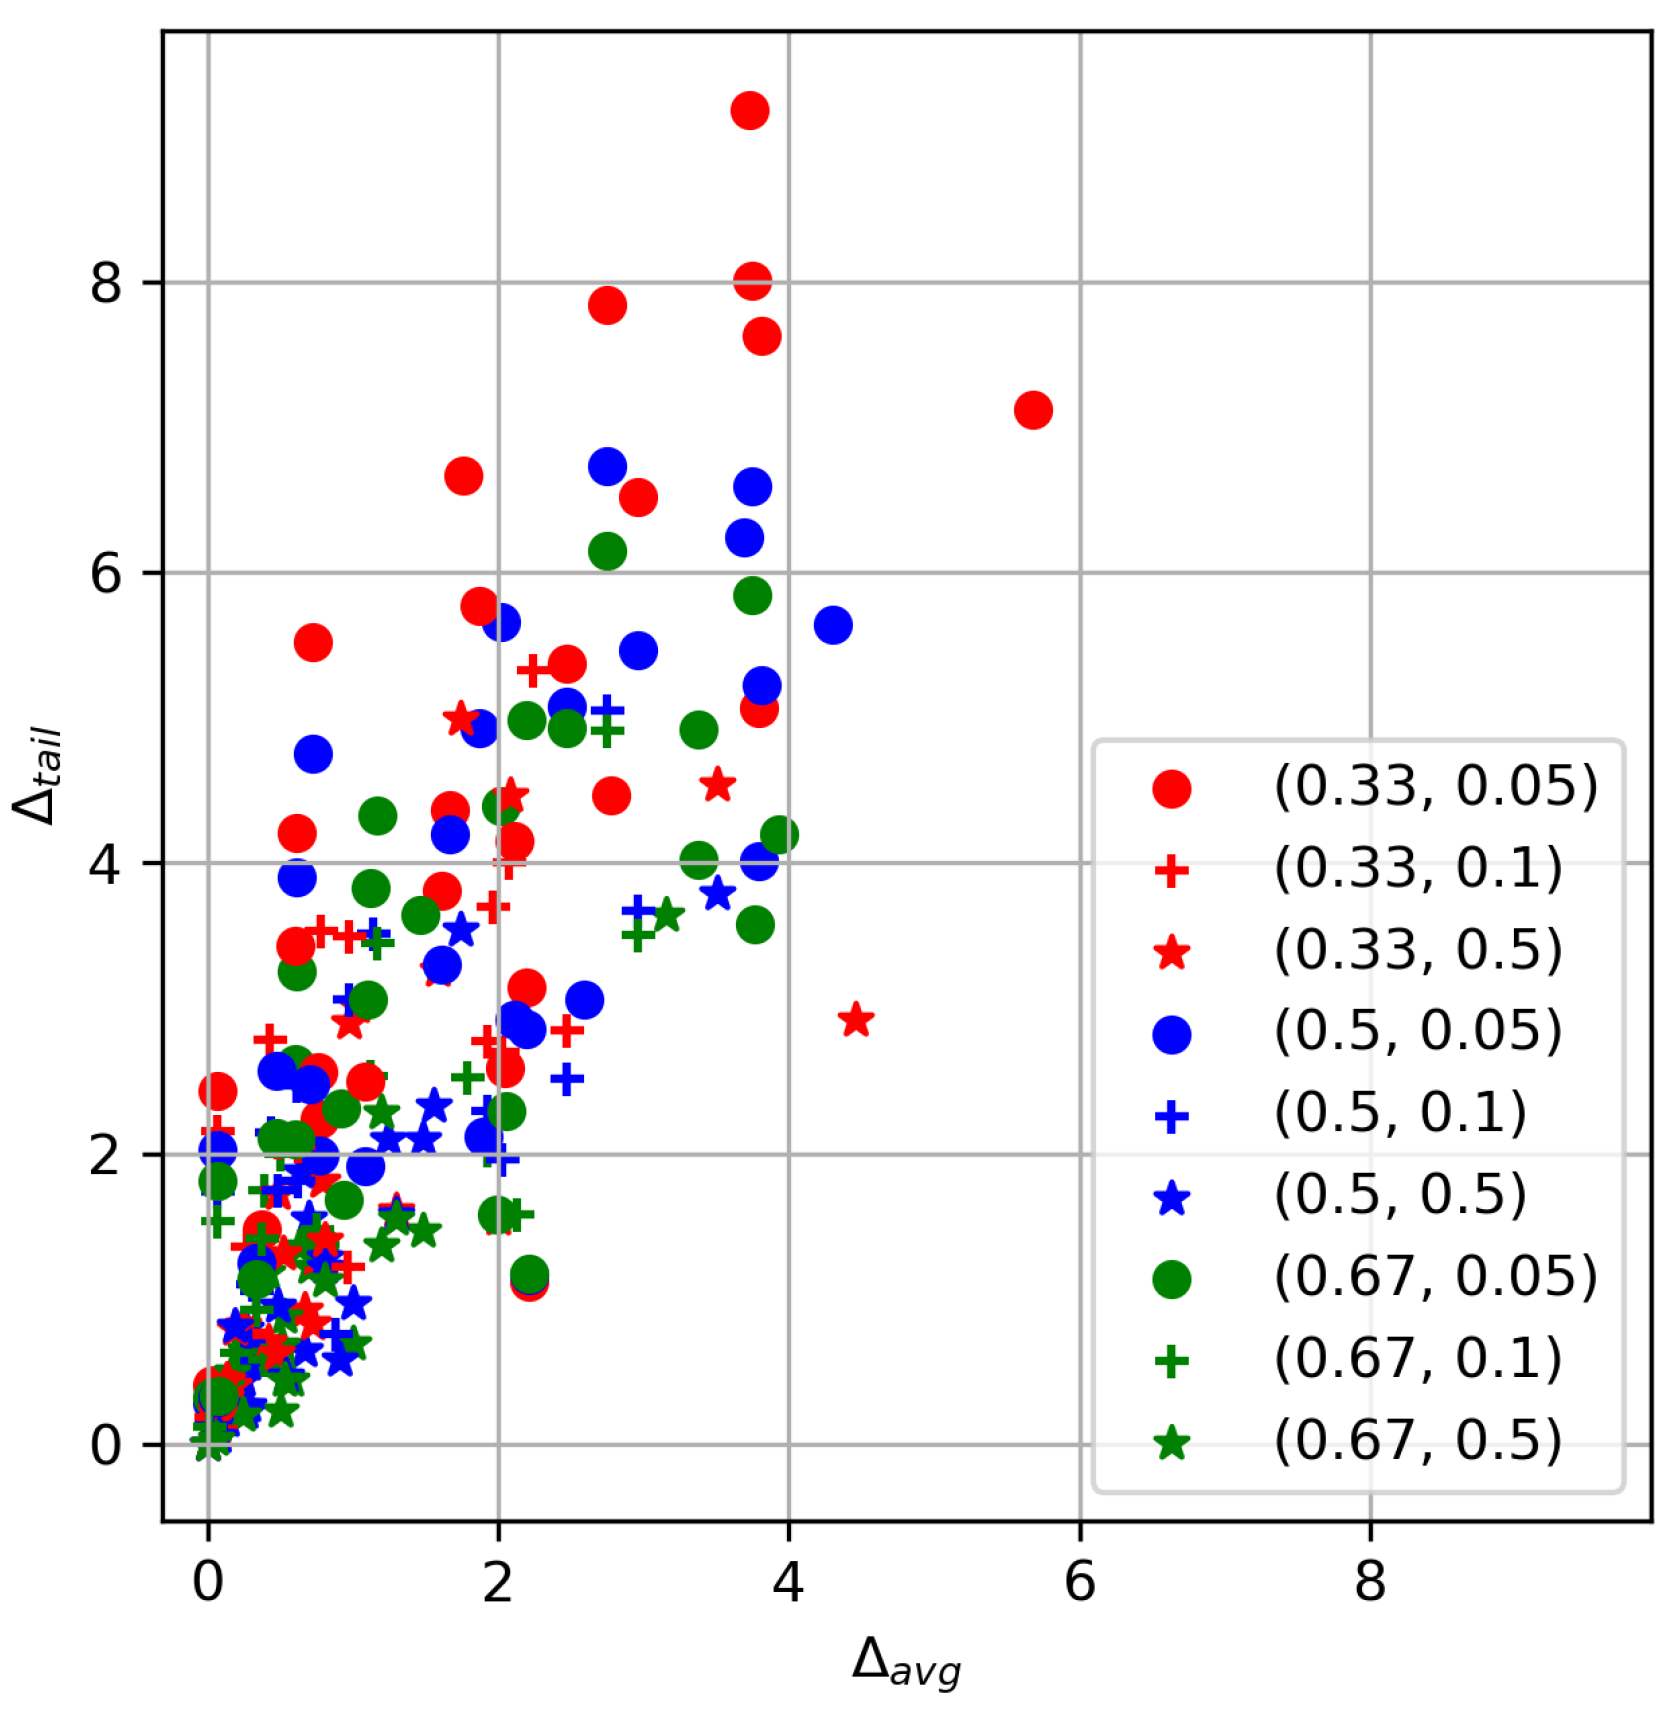
- To grasp the difference between the MSP and the naive approach, the following will be calculated:These quantities reflect what is the effect of making decision instead of . Large values of indicate high penalties for making decision instead of in average scenarios-criteria. Similarly, the larger , the higher benefit obtained from making decision in tail events. They will be, respectively, called deteriorating rate and improvement rate.
- Experiment 1
- Experiment 2
5.2. Results
- Experiment 1
- Experiment 2
6. Conclusions
Author Contributions
Funding
Conflicts of Interest
Abbreviations
| MCDM | Multicriteria decision making |
| VaR | Value-at-risk |
| CVaR | Conditional value-at-risk |
| MSP | Multiobjective stochastic programming |
| OWA | Ordered weighted averaging |
| MOP | Multiple objective problem |
Appendix A

| Criteria | ||||||||
|---|---|---|---|---|---|---|---|---|
| scenarios | 0.40 | 0.58 | 0.39 | 0.45 | 0.54 | 0.18 | ||
| 0.68 | 0.74 | 0.70 | 0.15 | 0.54 | 0.72 | |||
| 0.93 | 0.52 | 0.23 | 0.82 | 0.21 | 0.03 | |||
| 0.37 | 0.85 | 0.07 | 0.42 | 0.52 | 0.22 | |||
| 0.92 | 0.13 | 0.71 | 0.39 | 0.90 | 0.87 | |||
| -average, | 0.930 | 0.832 | 0.703 | 0.820 | 0.660 | 0.770 | ||
| r-OWA, | 0.930 | |||||||
| Criteria | ||||||||
|---|---|---|---|---|---|---|---|---|
| scenarios | 0.80 | 0.90 | 0.61 | 0.28 | 0.94 | 0.09 | ||
| 0.29 | 0.48 | 0.26 | 0.23 | 0.21 | 0.07 | |||
| 0.73 | 0.65 | 0.32 | 0.56 | 0.95 | 0.65 | |||
| 0.58 | 0.39 | 0.21 | 0.66 | 0.70 | 0.93 | |||
| 0.73 | 0.22 | 0.33 | 0.31 | 0.32 | 0.38 | |||
| -average, | 0.765 | 0.775 | 0.468 | 0.643 | 0.950 | 0.883 | ||
| r-OWA, | 0.943 | |||||||
| Criteria | ||||||||
|---|---|---|---|---|---|---|---|---|
| scenarios | 0.30 | 0.52 | 0.12 | 0.68 | 0.46 | 0.73 | ||
| 1.00 | 0.57 | 0.46 | 0.82 | 0.90 | 0.72 | |||
| 0.18 | 0.76 | 0.30 | 0.34 | 0.54 | 0.99 | |||
| 0.53 | 0.21 | 0.13 | 0.12 | 0.66 | 0.86 | |||
| 0.98 | 0.46 | 0.50 | 0.29 | 0.27 | 0.40 | |||
| -average, | 0.993 | 0.760 | 0.473 | 0.773 | 0.820 | 0.990 | ||
| r-OWA, | 0.993 | |||||||
| 0.05 | 0.1 | 0.5 | ||||||||||||||||||||||||||||||||||||
|---|---|---|---|---|---|---|---|---|---|---|---|---|---|---|---|---|---|---|---|---|---|---|---|---|---|---|---|---|---|---|---|---|---|---|---|---|---|---|
| 0.33 | 0.5 | 0.67 | 0.33 | 0.5 | 0.67 | 0.33 | 0.5 | 0.67 | ||||||||||||||||||||||||||||||
| |I| | |J| | |K| | ||||||||||||||||||||||||||||||||||||
| 50 | 5 | 3 | 0.12 | 0.13 | 3.75 | 8.01 | 0.15 | 0.12 | 3.75 | 8.01 | 0.18 | 0.14 | 3.51 | 4.54 | 0.14 | 0.14 | 3.75 | 6.59 | 0.12 | 0.12 | 3.75 | 6.59 | 0.20 | 0.17 | 3.51 | 3.79 | 0.12 | 0.12 | 3.75 | 5.84 | 0.12 | 0.12 | 3.75 | 5.84 | 0.13 | 0.12 | 3.16 | 3.64 |
| 6 | 0.22 | 0.11 | 3.79 | 5.07 | 0.25 | 0.11 | 3.79 | 5.07 | 0.18 | 0.11 | 1.03 | 3.01 | 0.30 | 0.13 | 3.79 | 4.01 | 0.25 | 0.13 | 3.79 | 4.01 | 0.23 | 0.15 | 1.48 | 2.10 | 0.23 | 0.16 | 3.77 | 3.58 | 0.23 | 0.14 | 3.77 | 3.58 | 0.18 | 0.17 | 1.48 | 1.47 | ||
| 9 | 0.28 | 0.14 | 1.76 | 6.67 | 0.36 | 0.14 | 1.76 | 6.67 | 0.20 | 0.15 | 1.58 | 3.26 | 0.22 | 0.14 | 2.02 | 5.66 | 0.21 | 0.14 | 2.02 | 5.66 | 0.22 | 0.14 | 1.24 | 2.10 | 0.20 | 0.15 | 2.02 | 4.39 | 0.22 | 0.13 | 2.02 | 4.39 | 0.25 | 0.15 | 1.20 | 1.37 | ||
| 25 | 3 | 0.76 | 0.18 | 2.47 | 5.37 | 0.66 | 0.17 | 2.47 | 2.85 | 0.26 | 0.17 | 2.00 | 1.55 | 0.64 | 0.18 | 2.47 | 5.08 | 0.62 | 0.16 | 2.47 | 2.51 | 0.25 | 0.15 | 1.00 | 0.97 | 0.60 | 0.17 | 2.47 | 4.93 | 0.51 | 0.16 | 1.79 | 2.52 | 0.26 | 0.14 | 1.00 | 0.69 | |
| 6 | 1.20 | 0.16 | 1.87 | 5.77 | 0.91 | 0.29 | 1.96 | 3.70 | 0.49 | 0.18 | 0.79 | 1.81 | 1.15 | 0.18 | 1.87 | 4.93 | 0.74 | 0.18 | 1.14 | 3.51 | 0.41 | 0.18 | 0.70 | 1.55 | 0.93 | 0.16 | 1.17 | 4.33 | 0.78 | 0.18 | 1.17 | 3.45 | 0.38 | 0.16 | 0.71 | 1.22 | ||
| 9 | 0.69 | 0.16 | 0.61 | 4.21 | 0.78 | 0.16 | 0.43 | 2.78 | 0.57 | 0.16 | 0.67 | 0.92 | 0.52 | 0.15 | 0.61 | 3.90 | 0.96 | 0.16 | 0.44 | 2.14 | 0.61 | 0.16 | 0.67 | 0.65 | 0.69 | 0.15 | 0.61 | 3.25 | 1.02 | 0.18 | 0.39 | 1.75 | 0.47 | 0.18 | 0.51 | 0.68 | ||
| 100 | 3 | 1.15 | 0.15 | 0.07 | 2.43 | 0.78 | 0.15 | 0.07 | 2.15 | 0.44 | 0.14 | 0.07 | 0.16 | 1.07 | 0.14 | 0.07 | 2.02 | 0.83 | 0.19 | 0.07 | 1.74 | 0.34 | 0.14 | 0.07 | 0.16 | 1.14 | 0.15 | 0.07 | 1.81 | 0.85 | 0.16 | 0.07 | 1.53 | 0.36 | 0.14 | 0.07 | 0.14 | |
| 6 | 2.51 | 0.20 | 0.77 | 2.24 | 4.45 | 0.22 | 0.78 | 1.19 | 3.52 | 0.20 | 0.23 | 0.47 | 2.62 | 0.25 | 0.77 | 1.99 | 5.09 | 0.18 | 0.31 | 1.10 | 5.45 | 0.20 | 0.19 | 0.29 | 2.70 | 0.22 | 0.77 | 1.38 | 3.31 | 0.19 | 0.47 | 0.63 | 5.59 | 0.19 | 0.23 | 0.27 | ||
| 9 | 4.06 | 0.18 | 0.03 | 0.41 | 1.47 | 0.17 | 0.03 | 0.30 | 1.07 | 0.16 | 0.00 | 0.00 | 2.75 | 0.17 | 0.03 | 0.29 | 1.12 | 0.16 | 0.03 | 0.30 | 1.11 | 0.16 | 0.00 | 0.00 | 2.06 | 0.19 | 0.03 | 0.32 | 1.10 | 0.16 | 0.03 | 0.18 | 1.16 | 0.17 | 0.00 | 0.00 | ||
| 100 | 5 | 3 | 1.24 | 0.26 | 3.81 | 7.63 | 1.29 | 0.20 | 3.81 | 7.63 | 0.37 | 0.22 | 2.08 | 4.47 | 0.72 | 0.18 | 3.81 | 5.22 | 0.66 | 0.18 | 3.81 | 5.22 | 0.32 | 0.27 | 1.56 | 2.33 | 0.74 | 0.19 | 3.38 | 4.02 | 1.13 | 0.23 | 3.38 | 4.02 | 0.28 | 0.20 | 0.63 | 1.36 |
| 6 | 8.68 | 0.22 | 5.68 | 7.12 | 8.69 | 0.19 | 5.68 | 7.12 | 0.43 | 0.17 | 4.46 | 2.92 | 0.65 | 0.20 | 4.30 | 5.64 | 1.06 | 0.19 | 4.30 | 5.64 | 0.35 | 0.17 | 0.81 | 1.28 | 1.18 | 0.22 | 3.93 | 4.20 | 0.64 | 0.18 | 3.93 | 4.20 | 0.28 | 0.18 | 0.53 | 0.88 | ||
| 9 | 3.31 | 0.18 | 2.19 | 3.14 | 3.26 | 0.20 | 2.19 | 3.14 | 0.67 | 0.18 | 0.97 | 2.90 | 1.04 | 0.20 | 2.19 | 2.86 | 0.96 | 0.20 | 2.19 | 2.86 | 0.23 | 0.14 | 0.64 | 1.88 | 1.02 | 0.17 | 0.92 | 2.31 | 0.90 | 0.17 | 0.92 | 2.31 | 0.24 | 0.18 | 0.41 | 1.18 | ||
| 25 | 3 | 10.65 | 0.17 | 2.96 | 6.52 | 3.39 | 0.18 | 2.07 | 4.00 | 0.29 | 0.15 | 0.48 | 1.73 | 7.09 | 0.18 | 2.96 | 5.46 | 1.83 | 0.19 | 2.96 | 3.67 | 0.30 | 0.14 | 0.48 | 0.95 | 3.46 | 0.19 | 2.19 | 4.98 | 1.30 | 0.16 | 2.96 | 3.50 | 0.34 | 0.16 | 0.41 | 0.59 | |
| 6 | 32.12 | 0.20 | 2.78 | 4.47 | 9.18 | 0.19 | 0.78 | 3.53 | 0.44 | 0.18 | 0.52 | 1.31 | 26.53 | 0.18 | 2.59 | 3.06 | 3.64 | 0.22 | 0.61 | 2.47 | 0.32 | 0.15 | 0.26 | 0.79 | 12.77 | 0.17 | 0.60 | 2.62 | 0.90 | 0.17 | 0.50 | 2.00 | 0.41 | 0.17 | 0.26 | 0.65 | ||
| 9 | 8.58 | 0.18 | 0.72 | 5.52 | 1.90 | 0.17 | 0.97 | 3.49 | 0.42 | 0.18 | 0.24 | 0.82 | 6.32 | 0.19 | 0.72 | 4.75 | 1.24 | 0.16 | 0.97 | 3.06 | 0.51 | 0.20 | 0.24 | 0.44 | 1.60 | 0.19 | 1.12 | 3.83 | 0.88 | 0.19 | 1.12 | 2.53 | 0.59 | 0.17 | 0.50 | 0.23 | ||
| 100 | 3 | 51.23 | 0.22 | 2.21 | 1.12 | 1.67 | 0.21 | 0.27 | 1.36 | 0.82 | 0.18 | 0.09 | 0.25 | 22.70 | 0.21 | 2.21 | 1.16 | 1.22 | 0.19 | 0.34 | 1.05 | 0.81 | 0.18 | 0.05 | 0.17 | 18.75 | 0.16 | 2.21 | 1.17 | 0.84 | 0.22 | 0.34 | 0.92 | 0.75 | 0.18 | 0.05 | 0.13 | |
| 6 | 48.25 | 0.18 | 0.76 | 2.56 | 31.87 | 0.17 | 0.62 | 2.05 | 62.14 | 0.15 | 0.42 | 0.70 | 24.73 | 0.18 | 0.71 | 2.48 | 27.08 | 0.18 | 0.62 | 1.81 | 42.18 | 0.19 | 0.28 | 0.55 | 20.26 | 0.17 | 0.60 | 2.10 | 22.09 | 0.20 | 0.75 | 1.48 | 7.79 | 0.20 | 0.17 | 0.50 | ||
| 9 | 2.16 | 0.19 | 0.37 | 1.48 | 3.34 | 0.18 | 0.29 | 0.77 | 1.84 | 0.17 | 0.18 | 0.41 | 1.80 | 0.17 | 0.34 | 1.25 | 2.87 | 0.20 | 0.28 | 0.69 | 2.22 | 0.19 | 0.26 | 0.22 | 1.67 | 0.18 | 0.34 | 1.14 | 2.77 | 0.19 | 0.20 | 0.63 | 3.09 | 0.16 | 0.08 | 0.13 | ||
| 200 | 5 | 3 | 146.24 | 0.23 | 1.61 | 3.81 | 140.12 | 0.20 | 1.61 | 3.81 | 7.71 | 0.23 | 1.30 | 1.61 | 151.22 | 0.21 | 1.61 | 3.30 | 135.09 | 0.24 | 1.61 | 3.30 | 4.60 | 0.21 | 1.30 | 1.58 | 83.44 | 0.22 | 1.10 | 3.06 | 89.20 | 0.21 | 1.10 | 3.06 | 4.21 | 0.22 | 1.30 | 1.55 |
| 6 | 88.70 | 0.19 | 1.08 | 2.50 | 89.69 | 0.19 | 1.08 | 2.50 | 5.14 | 0.17 | 0.72 | 0.83 | 96.44 | 0.19 | 1.08 | 1.91 | 91.66 | 0.18 | 1.08 | 1.91 | 2.93 | 0.18 | 0.91 | 0.58 | 39.26 | 0.18 | 0.94 | 1.68 | 32.92 | 0.18 | 0.94 | 1.68 | 0.70 | 0.17 | 0.58 | 0.44 | ||
| 9 | 468.37 | 0.15 | 3.73 | 9.18 | 484.89 | 0.14 | 3.73 | 9.18 | 29.46 | 0.16 | 1.74 | 4.99 | 304.04 | 0.16 | 3.69 | 6.24 | 305.90 | 0.16 | 3.69 | 6.24 | 2.71 | 0.16 | 1.74 | 3.54 | 110.03 | 0.15 | 3.38 | 4.92 | 107.34 | 0.14 | 3.38 | 4.92 | 0.91 | 0.17 | 1.20 | 2.28 | ||
| 25 | 3 | 5629.58 | 0.33 | 2.75 | 7.84 | 4765.42 | 0.24 | 2.24 | 5.33 | 4.86 | 0.24 | 0.81 | 1.40 | 5430.90 | 0.25 | 2.75 | 6.73 | 3394.56 | 0.24 | 2.75 | 5.05 | 5.32 | 0.28 | 0.81 | 1.22 | 6896.05 | 0.25 | 2.75 | 6.15 | 2546.43 | 0.21 | 2.75 | 4.91 | 5.66 | 0.34 | 0.81 | 1.13 | |
| 6 | 2886.13 | 0.19 | 1.67 | 4.36 | 146.48 | 0.17 | 1.93 | 2.77 | 0.57 | 0.17 | 0.19 | 0.79 | 1651.91 | 0.21 | 1.67 | 4.20 | 15.06 | 0.22 | 1.93 | 2.29 | 0.71 | 0.21 | 0.19 | 0.81 | 93.66 | 0.19 | 1.46 | 3.64 | 19.36 | 0.19 | 1.93 | 2.02 | 0.55 | 0.18 | 0.12 | 0.40 | ||
| 9 | 1235.12 | 0.32 | 2.05 | 2.59 | 342.32 | 0.22 | 0.96 | 1.22 | 1.99 | 0.21 | 0.22 | 0.26 | 404.70 | 0.29 | 1.90 | 2.12 | 28.09 | 0.21 | 0.88 | 0.76 | 0.82 | 0.20 | 0.13 | 0.17 | 99.73 | 0.21 | 1.99 | 1.58 | 2.23 | 0.22 | 0.39 | 0.58 | 0.87 | 0.20 | 0.06 | 0.08 | ||
| 100 | 3 | 703.05 | 0.23 | 2.11 | 4.15 | 373.65 | 0.22 | 2.03 | 2.70 | 1.42 | 0.22 | 0.47 | 0.63 | 731.09 | 0.22 | 2.11 | 2.92 | 157.29 | 0.20 | 2.03 | 1.96 | 1.11 | 0.22 | 0.54 | 0.47 | 596.88 | 0.27 | 2.06 | 2.29 | 349.78 | 0.30 | 2.13 | 1.58 | 3.22 | 0.29 | 0.53 | 0.44 | |
| 6 | 7222.95 | 0.22 | 0.60 | 3.43 | 1814.25 | 0.18 | 0.48 | 2.08 | 22.11 | 0.21 | 0.13 | 0.44 | 7217.64 | 0.14 | 0.47 | 2.57 | 916.42 | 0.21 | 0.48 | 1.75 | 7.04 | 0.24 | 0.28 | 0.27 | 7216.94 | 0.15 | 0.47 | 2.11 | 656.48 | 0.20 | 0.37 | 1.41 | 7.89 | 0.22 | 0.24 | 0.20 | ||
| 9 | 3321.23 | 0.34 | 0.07 | 0.28 | 16.40 | 0.20 | 0.02 | 0.18 | 2.33 | 0.17 | 0.08 | 0.08 | 198.14 | 0.19 | 0.07 | 0.32 | 14.84 | 0.21 | 0.02 | 0.13 | 2.31 | 0.21 | 0.08 | 0.05 | 47.16 | 0.23 | 0.08 | 0.33 | 9.77 | 0.21 | 0.01 | 0.12 | 2.63 | 0.20 | 0.06 | 0.04 | ||
| 31.15 | 0.23 | 1.53 | 3.20 | 2.15 | 0.16 | 2.24 | 2.09 |
| 1.92 | 0.21 | 1.66 | 6.17 | 20.09 | 0.16 | 1.80 | 6.14 |
| 8.75 | 0.24 | 0.52 | 3.07 | 7.18 | 0.16 | 2.13 | 1.93 |
| 28.06 | 0.23 | 5.08 | 2.86 | 1.02 | 0.16 | 3.03 | 3.61 |
| 1.36 | 0.30 | 1.00 | 1.80 | 3.58 | 0.24 | 1.81 | 6.12 |
| 3.67 | 0.20 | 2.27 | 2.50 | 3.64 | 0.19 | 1.19 | 3.07 |
| 2.00 | 0.20 | 2.51 | 2.03 | 128.69 | 0.23 | 3.27 | 2.98 |
| 192.11 | 0.16 | 2.61 | 8.23 | 0.89 | 0.18 | 1.45 | 0.93 |
| 0.94 | 0.20 | 0.43 | 2.23 | 1.62 | 0.23 | 1.85 | 3.56 |
| 0.80 | 0.18 | 1.64 | 2.55 | 4.19 | 0.22 | 2.10 | 1.97 |
| 16.40 | 0.19 | 2.23 | 2.45 | 2.16 | 0.19 | 0.16 | 1.46 |
| 1.21 | 0.18 | 2.82 | 1.50 | 1.46 | 0.24 | 2.48 | 2.00 |
| 1.79 | 0.20 | 0.72 | 2.77 | 0.69 | 0.20 | 1.79 | 2.54 |
| 21.78 | 0.21 | 4.50 | 4.61 | 20.73 | 0.20 | 2.26 | 3.50 |
| 1.35 | 0.19 | 0.69 | 0.86 | 1.86 | 0.24 | 1.77 | 2.63 |
| 31.11 | 0.19 | 0.98 | 3.21 | 14.92 | 0.17 | 1.99 | 8.57 |
| 8.44 | 0.19 | 1.82 | 3.81 | 0.78 | 0.20 | 0.85 | 1.92 |
| 1.75 | 0.21 | 0.88 | 0.92 | 10.48 | 0.23 | 2.50 | 2.29 |
| 1.94 | 0.21 | 2.18 | 2.65 | 1.63 | 0.24 | 2.08 | 2.29 |
| 0.98 | 0.20 | 0.87 | 3.27 | 10.78 | 0.18 | 0.34 | 1.80 |
| 27.72 | 0.22 | 2.03 | 5.20 | 38.80 | 0.20 | 1.96 | 4.69 |
| 14.72 | 0.15 | 3.34 | 0.99 | 19.74 | 0.24 | 0.65 | 2.20 |
| 0.67 | 0.24 | 0.81 | 2.69 | 1.37 | 0.30 | 2.82 | 2.92 |
| 3.54 | 0.20 | 2.64 | 2.75 | 6.28 | 0.19 | 2.02 | 2.08 |
| 6.37 | 0.21 | 2.79 | 6.35 | 22.27 | 0.34 | 1.91 | 3.13 |
| 1.86 | 0.23 | 0.93 | 2.09 | 1.69 | 0.20 | 2.21 | 2.42 |
| 1.54 | 0.20 | 2.00 | 3.45 | 27.77 | 0.19 | 0.76 | 3.28 |
| 40.16 | 0.17 | 2.06 | 3.44 | 2.00 | 0.21 | 2.57 | 1.93 |
| 7.23 | 0.21 | 3.17 | 3.17 | 2.61 | 0.18 | 2.14 | 3.33 |
| 5.77 | 0.17 | 2.84 | 1.98 | 40.93 | 0.18 | 1.53 | 4.61 |
| 2.10 | 0.19 | 1.39 | 3.00 | 18.84 | 0.16 | 0.89 | 4.37 |
| 404.70 | 0.19 | 1.50 | 2.82 | 11.26 | 0.16 | 3.98 | 4.76 |
| 24.26 | 0.18 | 4.81 | 3.42 | 14.41 | 0.18 | 1.82 | 5.87 |
| 0.76 | 0.20 | 1.28 | 3.88 | 12.14 | 0.16 | 2.75 | 2.75 |
| 0.64 | 0.20 | 0.87 | 1.39 | 12.58 | 0.17 | 1.42 | 3.46 |
| 0.97 | 0.23 | 1.77 | 2.19 | 0.84 | 0.18 | 0.41 | 2.15 |
| 0.53 | 0.18 | 1.95 | 2.04 | 5.20 | 0.19 | 3.80 | 2.02 |
| 7.24 | 0.22 | 2.21 | 1.68 | 28.16 | 0.15 | 4.68 | 3.56 |
| 0.87 | 0.25 | 0.71 | 1.42 | 39.10 | 0.16 | 3.47 | 3.59 |
| 8.51 | 0.20 | 2.48 | 4.06 | 19.22 | 0.16 | 3.78 | 3.13 |
| 13.06 | 0.20 | 4.44 | 2.80 | 0.56 | 0.20 | 0.63 | 3.22 |
| 59.78 | 0.20 | 5.67 | 4.91 | 0.68 | 0.17 | 1.92 | 2.44 |
| 67.50 | 0.19 | 2.96 | 3.02 | 0.70 | 0.17 | 1.86 | 1.40 |
| 3.80 | 0.17 | 0.79 | 1.20 | 15.20 | 0.17 | 0.78 | 2.66 |
| 3.25 | 0.20 | 2.24 | 1.57 | 0.88 | 0.17 | 2.31 | 2.13 |
| 5.23 | 0.16 | 1.14 | 4.91 | 0.59 | 0.15 | 1.78 | 1.68 |
| 0.71 | 0.17 | 0.89 | 3.01 | 1.08 | 0.20 | 2.21 | 3.14 |
| 4.19 | 0.17 | 3.09 | 2.32 | 1.14 | 0.17 | 0.76 | 2.48 |
| 3.53 | 0.18 | 1.37 | 6.33 | 1.58 | 0.19 | 1.45 | 3.14 |
| 19.99 | 0.14 | 3.48 | 5.05 | 13.48 | 0.18 | 1.71 | 5.41 |
References
- Rommelfanger, H. The Advantages of Fuzzy Optimization Models in Practical Use. Fuzzy Optim. Decis. Mak. 2004, 3, 295–309. [Google Scholar] [CrossRef]
- Gutjahr, W.; Nolz, P. Multicriteria optimization in humanitarian aid. Eur. J. Oper. Res. 2016, 252, 351–366. [Google Scholar] [CrossRef]
- Ferrer, J.; Martín-Campo, F.; Ortuño, M.; Pedraza-Martínez, A.; Tirado, G.; Vitoriano, B. Multi-criteria optimization for last mile distribution of disaster relief aid: Test cases and applications. Eur. J. Oper. Res. 2018, 269, 501–515. [Google Scholar] [CrossRef]
- Sun, G.; Zhang, H.; Fang, J.; Li, G.; Li, Q. A new multi-objective discrete robust optimization algorithm for engineering design. Appl. Math. Model. 2018, 53, 602–621. [Google Scholar] [CrossRef]
- Karsu, Ö.; Morton, A. Inequity averse optimization in operational research. Eur. J. Oper. Res. 2015, 245, 343–359. [Google Scholar] [CrossRef]
- Angilella, S.; Mazzù, S. The financing of innovative SMEs: A multicriteria credit rating model. Eur. J. Oper. Res. 2015, 244, 540–554. [Google Scholar] [CrossRef]
- Fotakis, D. Multi-objective spatial forest planning using self-organization. Ecol. Inform. 2015, 29, 1–5. [Google Scholar] [CrossRef]
- Guido, R.; Conforti, D. A hybrid genetic approach for solving an integrated multi-objective operating room planning and scheduling problem. Comput. Oper. Res. 2017, 87, 270–282. [Google Scholar] [CrossRef]
- Eiselt, H.; Marianov, V. Location modeling for municipal solid waste facilities. Comput. Oper. Res. 2015, 62, 305–315. [Google Scholar] [CrossRef]
- Liberatore, F.; Camacho-Collados, M. A Comparison of Local Search Methods for the Multicriteria Police Districting Problem on Graph. Math. Prob. Eng. 2016, 2016, 3690474. [Google Scholar] [CrossRef]
- Bast, H.; Delling, D.; Goldberg, A.; Müller-Hannemann, M.; Pajor, T.; Sanders, P.; Wagner, D.; Werneck, R. Route planning in transportation networks. In Lecture Notes in Computer Science (Including Subseries Lecture Notes in Artificial Intelligence and Lecture Notes in Bioinformatics); Springer: Cham, Switzerland, 2016; pp. 19–80. [Google Scholar]
- Samà, M.; Meloni, C.; D’Ariano, A.; Corman, F. A multi-criteria decision support methodology for real-time train scheduling. J. Rail Transp. Plan. Manag. 2015, 5, 146–162. [Google Scholar] [CrossRef]
- Spina, L.; Scrivo, R.; Ventura, C.; Viglianisi, A. Urban renewal: Negotiation procedures and evaluation models. In Lecture Notes in Computer Science (Including Subseries Lecture Notes in Artificial Intelligence and Lecture Notes in Bioinformatics); Springer: Cham, Switzerland, 2015; pp. 88–103. [Google Scholar]
- Carli, R.; Dotoli, M.; Pellegrino, R. A decision-making tool for energy efficiency optimization of street lighting. Comput. Oper. Res. 2018, 96, 223–235. [Google Scholar] [CrossRef]
- Ehrgott, M. Multicriteria Optimization, 2nd ed.; Springer: Berlin/Heidelberg, Germay, 2005. [Google Scholar]
- Birge, J.R.; Louveaux, F. Introduction to Stochastic Programming; Springer: New York, NY, USA, 2011. [Google Scholar]
- Ben-Tal, A.; Nemirovski, A. Robust solutions of uncertain linear programs. Oper. Res. Lett. 1999, 25, 1–13. [Google Scholar] [CrossRef]
- Chen, X.; Sim, M.; Sun, P. A Robust Optimization Perspective on Stochastic Programming. Oper. Res. 2007, 55, 1058–1071. [Google Scholar] [CrossRef]
- Klamroth, K.; Köbis, E.; Schöbel, A.; Tammer, C. A unified approach to uncertain optimization. Eur. J. Oper. Res. 2017, 260, 403–420. [Google Scholar] [CrossRef]
- Gabrel, V.; Murat, C.; Thiele, A. Recent advances in robust optimization: An overview. Eur. J. Oper. Res. 2014, 235, 471–483. [Google Scholar] [CrossRef]
- Yao, H.; Li, Z.; Lai, Y. Mean–CVaR portfolio selection: A nonparametric estimation framework. Comput. Oper. Res. 2013, 40, 1014–1022. [Google Scholar] [CrossRef]
- Mansini, R.; Ogryczak, W.; Speranza, M.G. Linear and Mixed Integer Programming for Portfolio Optimization; Springer International Publishing: Berlin/Heidelberg, Germany, 2015. [Google Scholar]
- Liu, X.; Küçükyavuz, S.; Noyan, N. Robust multicriteria risk-averse stochastic programming models. Ann. Oper. Res. 2017, 259, 259–294. [Google Scholar] [CrossRef]
- Dixit, V.; Tiwari, M.K. Project portfolio selection and scheduling optimization based on risk measure: A conditional value at risk approach. Ann. Oper. Res. 2020, 285, 9–33. [Google Scholar] [CrossRef]
- Fernández, E.; Hinojosa, Y.; Puerto, J.; da Gama, F.S. New algorithmic framework for conditional value at risk: Application to stochastic fixed-charge transportation. Eur. J. Oper. Res. 2019, 277, 215–226. [Google Scholar] [CrossRef]
- Rockafellar, R.; Uryasev, S. Conditional value-at-risk for general loss distributions. J. Bank. Financ. 2002, 26, 1443–1471. [Google Scholar] [CrossRef]
- Goicoechea, A. Deterministic Equivalents for Use in Multiobjective, Stochastic Programming. IFAC Proc. Vol. 1980, 13, 31–40. [Google Scholar] [CrossRef]
- Leclercq, J.P. Stochastic programming: An interactive multicriteria approach. Eur. J. Oper. Res. 1982, 10, 33–41. [Google Scholar] [CrossRef]
- Caballero, R.; Cerdá, E.; Muñoz, M.M.; Rey, L. Stochastic approach versus multiobjective approach for obtaining efficient solutions in stochastic multiobjective programming problems. Eur. J. Oper. Res. 2004, 158, 633–648. [Google Scholar] [CrossRef]
- Aouni, B.; Ben Abdelaziz, F.; Martel, J.M. Decision-maker’s preferences modeling in the stochastic goal programming. Eur. J. Oper. Res. 2005, 162, 610–618. [Google Scholar] [CrossRef]
- Ben Abdelaziz, F.; Masri, H. A compromise solution for the multiobjective stochastic linear programming under partial uncertainty. Eur. J. Oper. Res. 2010, 202, 55–59. [Google Scholar] [CrossRef]
- Ben Abdelaziz, F.; Aouni, B.; Fayedh, R.E. Multi-objective stochastic programming for portfolio selection. Eur. J. Oper. Res. 2007, 177, 1811–1823. [Google Scholar] [CrossRef]
- Muñoz, M.M.; Luque, M.; Ruiz, F. INTEREST: A reference-point-based interactive procedure for stochastic multiobjective programming problems. OR Spectr. 2010, 32, 195–210. [Google Scholar] [CrossRef]
- Ben Abdelaziz, F. Solution approaches for the multiobjective stochastic programming. Eur. J. Oper. Res. 2012, 216, 1–16. [Google Scholar] [CrossRef]
- Gutjahr, W.J.; Pichler, A. Stochastic multi-objective optimization: A survey on non-scalarizing methods. Ann. Oper. Res. 2013, 236, 475–499. [Google Scholar] [CrossRef]
- Engau, A.; Sigler, D. Pareto solutions in multicriteria optimization under uncertainty. Eur. J. Oper. Res. 2020, 281, 357–368. [Google Scholar] [CrossRef]
- Álvarez-Miranda, E.; Garcia-Gonzalo, J.; Ulloa-Fierro, F.; Weintraub, A.; Barreiro, S. A multicriteria optimization model for sustainable forest management under climate change uncertainty: An application in Portugal. Eur. J. Oper. Res. 2018, 269, 79–98. [Google Scholar] [CrossRef]
- Díaz-García, J.A.; Bashiri, M. Multiple response optimisation: An approach from multiobjective stochastic programming. Appl. Math. Model. 2014, 38, 2015–2027. [Google Scholar] [CrossRef]
- Teghem, J.; Dufrane, D.; Thauvoye, M.; Kunsch, P. Strange: An interactive method for multi-objective linear programming under uncertainty. Eur. J. Oper. Res. 1986, 26, 65–82. [Google Scholar] [CrossRef]
- Bath, S.K.; Dhillon, J.S.; Kothari, D.P. Stochastic Multi-Objective Generation Dispatch. Electr. Power Compon. Syst. 2004, 32, 1083–1103. [Google Scholar] [CrossRef]
- Gazijahani, F.S.; Ravadanegh, S.N.; Salehi, J. Stochastic multi-objective model for optimal energy exchange optimization of networked microgrids with presence of renewable generation under risk-based strategies. ISA Trans. 2018, 73, 100–111. [Google Scholar] [CrossRef] [PubMed]
- Claro, J.; De Sousa, J. A multiobjective metaheuristic for a mean-risk multistage capacity investment problem. J. Heurist. 2010, 16, 85–115. [Google Scholar] [CrossRef]
- Manopiniwes, W.; Irohara, T. Stochastic optimisation model for integrated decisions on relief supply chains: Preparedness for disaster response. Int. J. Prod. Res. 2016, 55, 979–996. [Google Scholar] [CrossRef]
- Bastian, N.; Griffin, P.; Spero, E.; Fulton, L. Multi-criteria logistics modeling for military humanitarian assistance and disaster relief aerial delivery operations. Optim. Lett. 2016, 10, 921–953. [Google Scholar] [CrossRef]
- Şakar, C.T.; Köksalan, M. A stochastic programming approach to multicriteria portfolio optimization. J. Glob. Optim. 2012, 57, 299–314. [Google Scholar] [CrossRef]
- Salas-Molina, F.; Rodriguez-Aguilar, J.A.; Pla-Santamaria, D. A stochastic goal programming model to derive stable cash management policies. J. Glob. Optim. 2020, 76, 333–346. [Google Scholar] [CrossRef]
- Yager, R. On ordered weighted averaging aggregation operators in multicriteria decisionmaking. IEEE Trans. Syst. Man Cybern. 1988, 18, 183–190. [Google Scholar] [CrossRef]
- Fernández, F.; Puerto, J. Análisis de sensibilidad de las soluciones del problema lineal múltiple ordenado. TOP 1992, 7, 17–29. [Google Scholar]
- Nickel, S.; Puerto, J. A unified approach to network location problems. Networks 1999, 34, 283–290. [Google Scholar] [CrossRef]
- Yager, R.R.; Alajlan, N. Some issues on the OWA aggregation with importance weighted arguments. Knowl. Based Syst. 2016, 100, 89–96. [Google Scholar] [CrossRef]
- Puerto, J.; Rodríguez-Chía, A.M.; Tamir, A. Revisiting k-sum optimization. Math. Program. 2017, 165, 579–604. [Google Scholar] [CrossRef]
- Kalcsics, J.; Nickel, S.; Puerto, J.; Tamir, A. Algorithmic results for ordered median problems. Oper. Res. Lett. 2002, 30, 149–158. [Google Scholar] [CrossRef]
- Blanco, V.; Ali, S.E.H.B.; Puerto, J. Minimizing ordered weighted averaging of rational functions with applications to continuous location. Comput. Oper. Res. 2013, 40, 1448–1460. [Google Scholar] [CrossRef]
- Blanco, V.; Puerto, J.; El Haj Ben Ali, S. Revisiting Several Problems and Algorithms in Continuous Location with τ Norms. Comput. Optim. Appl. 2014, 58, 563–595. [Google Scholar] [CrossRef]
- Ponce, D.; Puerto, J.; Ricca, F.; Scozzari, A. Mathematical programming formulations for the efficient solution of the k-sum approval voting problem. Comput. Oper. Res. 2018, 98, 127–136. [Google Scholar] [CrossRef]
- Filippi, C.; Ogryczak, W.; Speranza, M.G. Bridging k-sum and CVaR optimization in MILP. Comput. Oper. Res. 2019, 105, 156–166. [Google Scholar] [CrossRef]
- Nickel, S.; Puerto, J. Location Theory; Springer: Berlin/Heidelberg, Germany, 2005. [Google Scholar]
- Bilbao-Terol, A.; Arenas-Parra, M.; Cañal-Fernández, V. Selection of Socially Responsible Portfolios using Goal Programming and fuzzy technology. Inf. Sci. 2012, 189, 110–125. [Google Scholar] [CrossRef]


| Scenario | ||||||||
|---|---|---|---|---|---|---|---|---|
| 1 | 2 | 3 | 4 | 5 | 0.2 | 0.3 | 0.5 | |
| 0.2 | 0.1 | 0.3 | 0.25 | 0.15 | 10 | 9 | 7 | |
| 10 | 7 | 4 | 3 | 2 | ||||
| Criterion | r | |||||||
|---|---|---|---|---|---|---|---|---|
| 1 | 2 | 3 | 4 | 5 | 0.2 | 0.3 | 0.5 | |
| 0.2 | 0.1 | 0.3 | 0.25 | 0.15 | 10 | 9 | 7 | |
| 10 | 7 | 4 | 3 | 2 | ||||
| (a) Alternative 1 | (b) Alternative 2 | ||||||
|---|---|---|---|---|---|---|---|
| 0.80 | 0.40 | 0.30 | 0.70 | 0.45 | 0.65 | ||
| 0.60 | 0.20 | 0.65 | 0.80 | 0.30 | 0.50 | ||
| -average | 0.80 | 0.40 | 0.65 | -average | 0.80 | 0.45 | 0.65 |
| r-OWA | 0.725 | r-OWA | 0.725 | ||||
| Criteria | ||||||||
|---|---|---|---|---|---|---|---|---|
| scenarios | 0.51 | 0.27 | 0.39 | 0.45 | 0.75 | 0.76 | ||
| 0.58 | 0.65 | 0.47 | 0.26 | 0.90 | 0.24 | |||
| 0.48 | 0.44 | 0.90 | 0.50 | 0.93 | 0.65 | |||
| 0.76 | 0.18 | 0.01 | 0.90 | 0.56 | 0.02 | |||
| 0.86 | 0.36 | 0.21 | 0.28 | 0.63 | 0.72 | |||
| -average, | 0.793 | 0.580 | 0.900 | 0.833 | 0.930 | 0.728 | ||
| r-OWA, | 0.927 | |||||||
| -Averages | r-OWA | ||||||
|---|---|---|---|---|---|---|---|
| Alternative 1 | 0.793 | 0.580 | 0.900 | 0.833 | 0.930 | 0.728 | 0.927 |
| Alternative 2 | 0.930 | 0.832 | 0.703 | 0.820 | 0.660 | 0.770 | 0.930 |
| Alternative 3 | 0.765 | 0.775 | 0.468 | 0.643 | 0.950 | 0.883 | 0.943 |
| Alternative 4 | 0.993 | 0.760 | 0.473 | 0.773 | 0.820 | 0.990 | 0.993 |
| (a) MSP Solution | (b) MIP Solution | ||||||
|---|---|---|---|---|---|---|---|
| 11.97 | 11.26 | 11.00 | 9.65 | 10.75 | 9.71 | ||
| 11.96 | 9.92 | 13.71 | 11.19 | 10.17 | 14.90 | ||
| 13.48 | 13.51 | 10.92 | 14.05 | 13.55 | 9.40 | ||
| 13.62 | 13.13 | 13.71 | 14.12 | 13.00 | 13.35 | ||
| 12.94 | 11.35 | 13.47 | 13.64 | 10.33 | 11.42 | ||
| |I| | |J| | |K| | r | ||
|---|---|---|---|---|---|
| 0.34 | 0.09 | −0.11 | −0.05 | −0.19 | |
| 0.51 | 0.18 | −0.14 | −0.03 | −0.07 | |
| 0.31 | 0.11 | −0.08 | −0.02 | −0.18 | |
| −0.05 | −0.57 | −0.28 | −0.09 | −0.36 | |
| −0.07 | −0.56 | −0.18 | −0.21 | −0.50 |
| Min | Mean | Median | Max | Std | Min | Mean | Median | Max | Std | |
|---|---|---|---|---|---|---|---|---|---|---|
| 0.05 | 0.12 | 659.49 | 6.32 | 7222.95 | 1787.07 | 0.94 | 3188.96 | 32.77 | 50473.04 | 9472.55 |
| 0.10 | 0.12 | 212.47 | 2.23 | 4765.42 | 728.49 | 0.98 | 1002.35 | 11.09 | 20192.48 | 3245.85 |
| 0.50 | 0.13 | 3.49 | 0.67 | 62.14 | 9.05 | 1.06 | 19.14 | 3.75 | 414.29 | 55.51 |
| r | |||||||||||
|---|---|---|---|---|---|---|---|---|---|---|---|
| Min | Mean | Median | Max | Std | Min | Mean | Median | Max | Std | ||
| 0.33 | 0.05 | 0.03 | 1.94 | 1.87 | 5.68 | 1.42 | 0.28 | 4.37 | 4.21 | 9.18 | 2.43 |
| 0.10 | 0.02 | 1.70 | 1.61 | 5.68 | 1.44 | 0.18 | 3.54 | 2.85 | 9.18 | 2.42 | |
| 0.50 | 0.00 | 0.93 | 0.52 | 4.46 | 1.08 | 0.00 | 1.57 | 0.92 | 4.99 | 1.46 | |
| 0.50 | 0.05 | 0.03 | 1.87 | 1.90 | 4.30 | 1.30 | 0.29 | 3.58 | 3.30 | 6.73 | 1.89 |
| 0.10 | 0.02 | 1.65 | 1.14 | 4.30 | 1.37 | 0.13 | 2.87 | 2.47 | 6.59 | 1.86 | |
| 0.50 | 0.00 | 0.72 | 0.54 | 3.51 | 0.75 | 0.00 | 1.07 | 0.79 | 3.79 | 1.01 | |
| 0.67 | 0.05 | 0.03 | 1.64 | 1.17 | 3.93 | 1.24 | 0.32 | 3.04 | 3.06 | 6.15 | 1.62 |
| 0.10 | 0.01 | 1.50 | 1.10 | 3.93 | 1.31 | 0.12 | 2.43 | 2.02 | 5.84 | 1.58 | |
| 0.50 | 0.00 | 0.60 | 0.50 | 3.16 | 0.66 | 0.00 | 0.80 | 0.59 | 3.64 | 0.81 | |
| mean | 16.98 | 0.20 | 91.31 | 2.03 | 3.09 |
| std | 46.57 | 0.03 | 254.68 | 1.12 | 1.49 |
| min | 0.53 | 0.14 | 2.81 | 0.16 | 0.86 |
| 25% | 1.37 | 0.17 | 6.73 | 1.18 | 2.09 |
| 50% | 3.74 | 0.19 | 19.72 | 1.93 | 2.81 |
| 75% | 15.50 | 0.21 | 86.19 | 2.52 | 3.51 |
| max | 404.70 | 0.34 | 2175.82 | 5.67 | 8.57 |
Publisher’s Note: MDPI stays neutral with regard to jurisdictional claims in published maps and institutional affiliations. |
© 2020 by the authors. Licensee MDPI, Basel, Switzerland. This article is an open access article distributed under the terms and conditions of the Creative Commons Attribution (CC BY) license (http://creativecommons.org/licenses/by/4.0/).
Share and Cite
León, J.; Puerto, J.; Vitoriano, B. A Risk-Aversion Approach for the Multiobjective Stochastic Programming Problem. Mathematics 2020, 8, 2026. https://doi.org/10.3390/math8112026
León J, Puerto J, Vitoriano B. A Risk-Aversion Approach for the Multiobjective Stochastic Programming Problem. Mathematics. 2020; 8(11):2026. https://doi.org/10.3390/math8112026
Chicago/Turabian StyleLeón, Javier, Justo Puerto, and Begoña Vitoriano. 2020. "A Risk-Aversion Approach for the Multiobjective Stochastic Programming Problem" Mathematics 8, no. 11: 2026. https://doi.org/10.3390/math8112026
APA StyleLeón, J., Puerto, J., & Vitoriano, B. (2020). A Risk-Aversion Approach for the Multiobjective Stochastic Programming Problem. Mathematics, 8(11), 2026. https://doi.org/10.3390/math8112026