1. Introduction
Organic livestock farming is a model of sustainable development in rural areas, based on techniques that can have less impacts to the environment [
1], promote animal welfare [
2] and are beneficial to human health [
3,
4]. This type of farming reduces atmospheric emissions [
5], preserves soil fertility, and through the appropriate use of natural resources, reduces production costs and avoids the use of chemicals and genetically modified organisms [
6].
Andalusia is the Spanish region with the highest output of organically-reared livestock [
7]. It has 48% of the cattle farms and 54% of the sheep farms in the country [
8] and their numbers have risen considerably in recent years. However, the majority of the population remains unaware of the reality of ecological production. A study of consumption patterns [
9] revealed that most individuals who claim to consume organic products (22%) do not actually do so, although they believe they do. This highlights the importance of conveying a good understanding of what organic production actually means and of promoting the recognition of eco-certified products (in Andalusia, the body responsible for certification is the Directorate General for Industry and Food Quality, together with the Directorate General for Organic Agriculture).
Organic livestock farming has significant advantages over the non-organic approach, including environmental protection, concern for animal welfare and greater consumer confidence in the quality of the food produced [
10]. Organic livestock farming also plays an important role in heightening the biodiversity of breeds [
11]. Moreover, it benefits rural development [
12], since to a large extent it is the small and medium-sized producers who have adopted this type of production.
To ensure high-quality organic production, the EU has issued general rules on organic production, processing, distribution, labelling and controls. Farmers, processors, intermediaries and retailers must meet strict EU requirements to label their products as organic, under Regulation (EC) 834/2007 of the EU Council of 28 June 2007 on organic production and labelling of organic products. Under this regulation, under organic farming, the animals’ health must be maintained through “the application of animal husbandry practices, which enhance the immune system and strengthen natural defences against diseases, in particular including regular exercise and access to open air areas and pastureland”.
Other organizations, too, have published requirements or recommendations for the implementation of efficient organic production. A WWF report sets out proposals for improvements in organic production [
13], to reduce its environmental impact. For the region examined in our study, the Andalusian Organic Farming Plan sets out a series of measures to encourage this type of production, such as support for organic products, support for the handling and processing of organic products, encouraging the domestic consumption of organic food, promoting training and research, ensuring the protection and transparency of the organic sector, increasing the participation of women in the organic sector and achieving effective horizontal strategic planning.
1.1. Objectives
In this paper, we describe how the discrete variable “number of organic livestock farms” can be fitted using the univariate generalized Waring distribution [
14]. The paper has the following main aims. On the one hand, we propose a statistical distribution for fitting discrete variables which present very low frequencies of appearance. In addition, the variance can be split to reveal the intrinsic randomness in the individuals, the internal differences between individuals (liability) and, finally, the external factors that may influence this behavior (proneness). This approach can be very useful because it highlights the origin of the observed variability in the data. Finally, the paper presents a new tool that may be of great interest in future research, since this distribution has never been used before in the field of livestock farming.
There are three goals of our research. The first is to consider the suitability of the Waring distribution as a means of investigating phenomena presenting very low frequencies of appearance (i.e., asymmetric distributions), as is the case of organic livestock farms. The second is to show how the Waring distribution can be used to decompose the variance, thus highlighting the origin of the variability observed in the data. The last goal is to establish the best method for estimating the parameters of the Waring distribution.
1.2. Waring Distribution
The generalized Waring distribution [
15,
16] is a discrete distribution on nonnegative integers. It is infinitely divisible, self-compensating as defined by Steutel and Van Harn [
17], and is, “in limit terms”, complete [
18]. The generalized Waring is a particular case of equilibrium distribution [
19] and in fact, there are different efficient algorithms for it that generate Sibuya’s digamma and trigamma distributions [
20]. Furthermore, it is used in stochastic aggregation models [
21]. Sarabia and Castillo [
22] presented two multivariate extensions of the distribution of Waring and Rodríguez-Avi et al. [
23] published an analysis of different parameter estimation methods for hypergeometric Gaussian distributions. In Rodríguez-Avi et al. [
24] the maximum likelihood method was applied to the generalized univariate Waring distribution, to the negative binomial distribution and the extended Waring distribution.
The generalized Waring distribution has been applied in many scientific fields. Newbold [
25] fitted a negative binomial distribution to the number of accidents of factory workers. Later, Irwin (1968) used these data to improve the fit through univariate generalized Waring distribution. Since then, the Waring distribution has been used, in addition to the theory of accidents [
15,
26], in other fields such as biology [
27], reliability theory [
26], library science [
28], computer science [
29], psychiatry [
30], medicine [
31], linguistics, economics [
32] and agriculture [
33]. However, in this research it is applied in studies related to livestock, which has never been done.
2. Materials and Methods
The data used were obtained from the Agricultural Census [
34] conducted by the Spanish National Statistics Institute and from the interpretation of this information by the Andalusian Institute of Statistics and Cartography [
35]. Maps were created using R free software together with SPSS for data cleaning.
In the following, we define the Waring distribution. A random variable X follows a univariate generalized Waring distribution, with parameters
,
and
,
, when its probability mass function is:
where
, and where
is the gamma function.
The mean of the Waring distribution is infinite if
and takes the following form:
and the variance is infinite if
:
when the variance is finite, that is when
, it can be divided into three components: the first,
, contains random factors, the second,
, reflects the internal variability between individuals (liability) and the third,
, reflects the variability caused by external factors affecting the population (proneness):
Various methods can be used to estimate the parameters of this distribution [
36] including maximum likelihood estimation (MLE), the method of moments (MM3) (which relates the non-centred moments of the distribution and in which a three-equation system must be resolved) and “mixed” methods (MF21 and MF12) with two equations describing the moments, and one, the relation between frequencies (MF21) or otherwise one equation for the moments and two for the frequencies (MF12).
The advantages and disadvantages of each method can be summarized as follows. The three moments method (MM3) usually provides relatively high values for the parameters and the chi-square statistic, due to the multiplicative nature of the calculations needed to resolve the system. The mixed methods (moments and frequencies) usually improve these results considerably. With the MF21 method, we obtain finite values for the statistic and reasonably valid values for the parameters. On the other hand, with one equation for the moments and two for frequencies (MF12), we again obtain infinite values for the goodness-of-fit statistic, for the same reasons given above. The maximum likelihood method has the disadvantage that numerical methods must be used to obtain estimates of the parameters. In the present study, the MM3 and MF21 methods were applied in R-project, and the GWRM package in R [
37] was used for optimisation by maximum likelihood.
3. Results
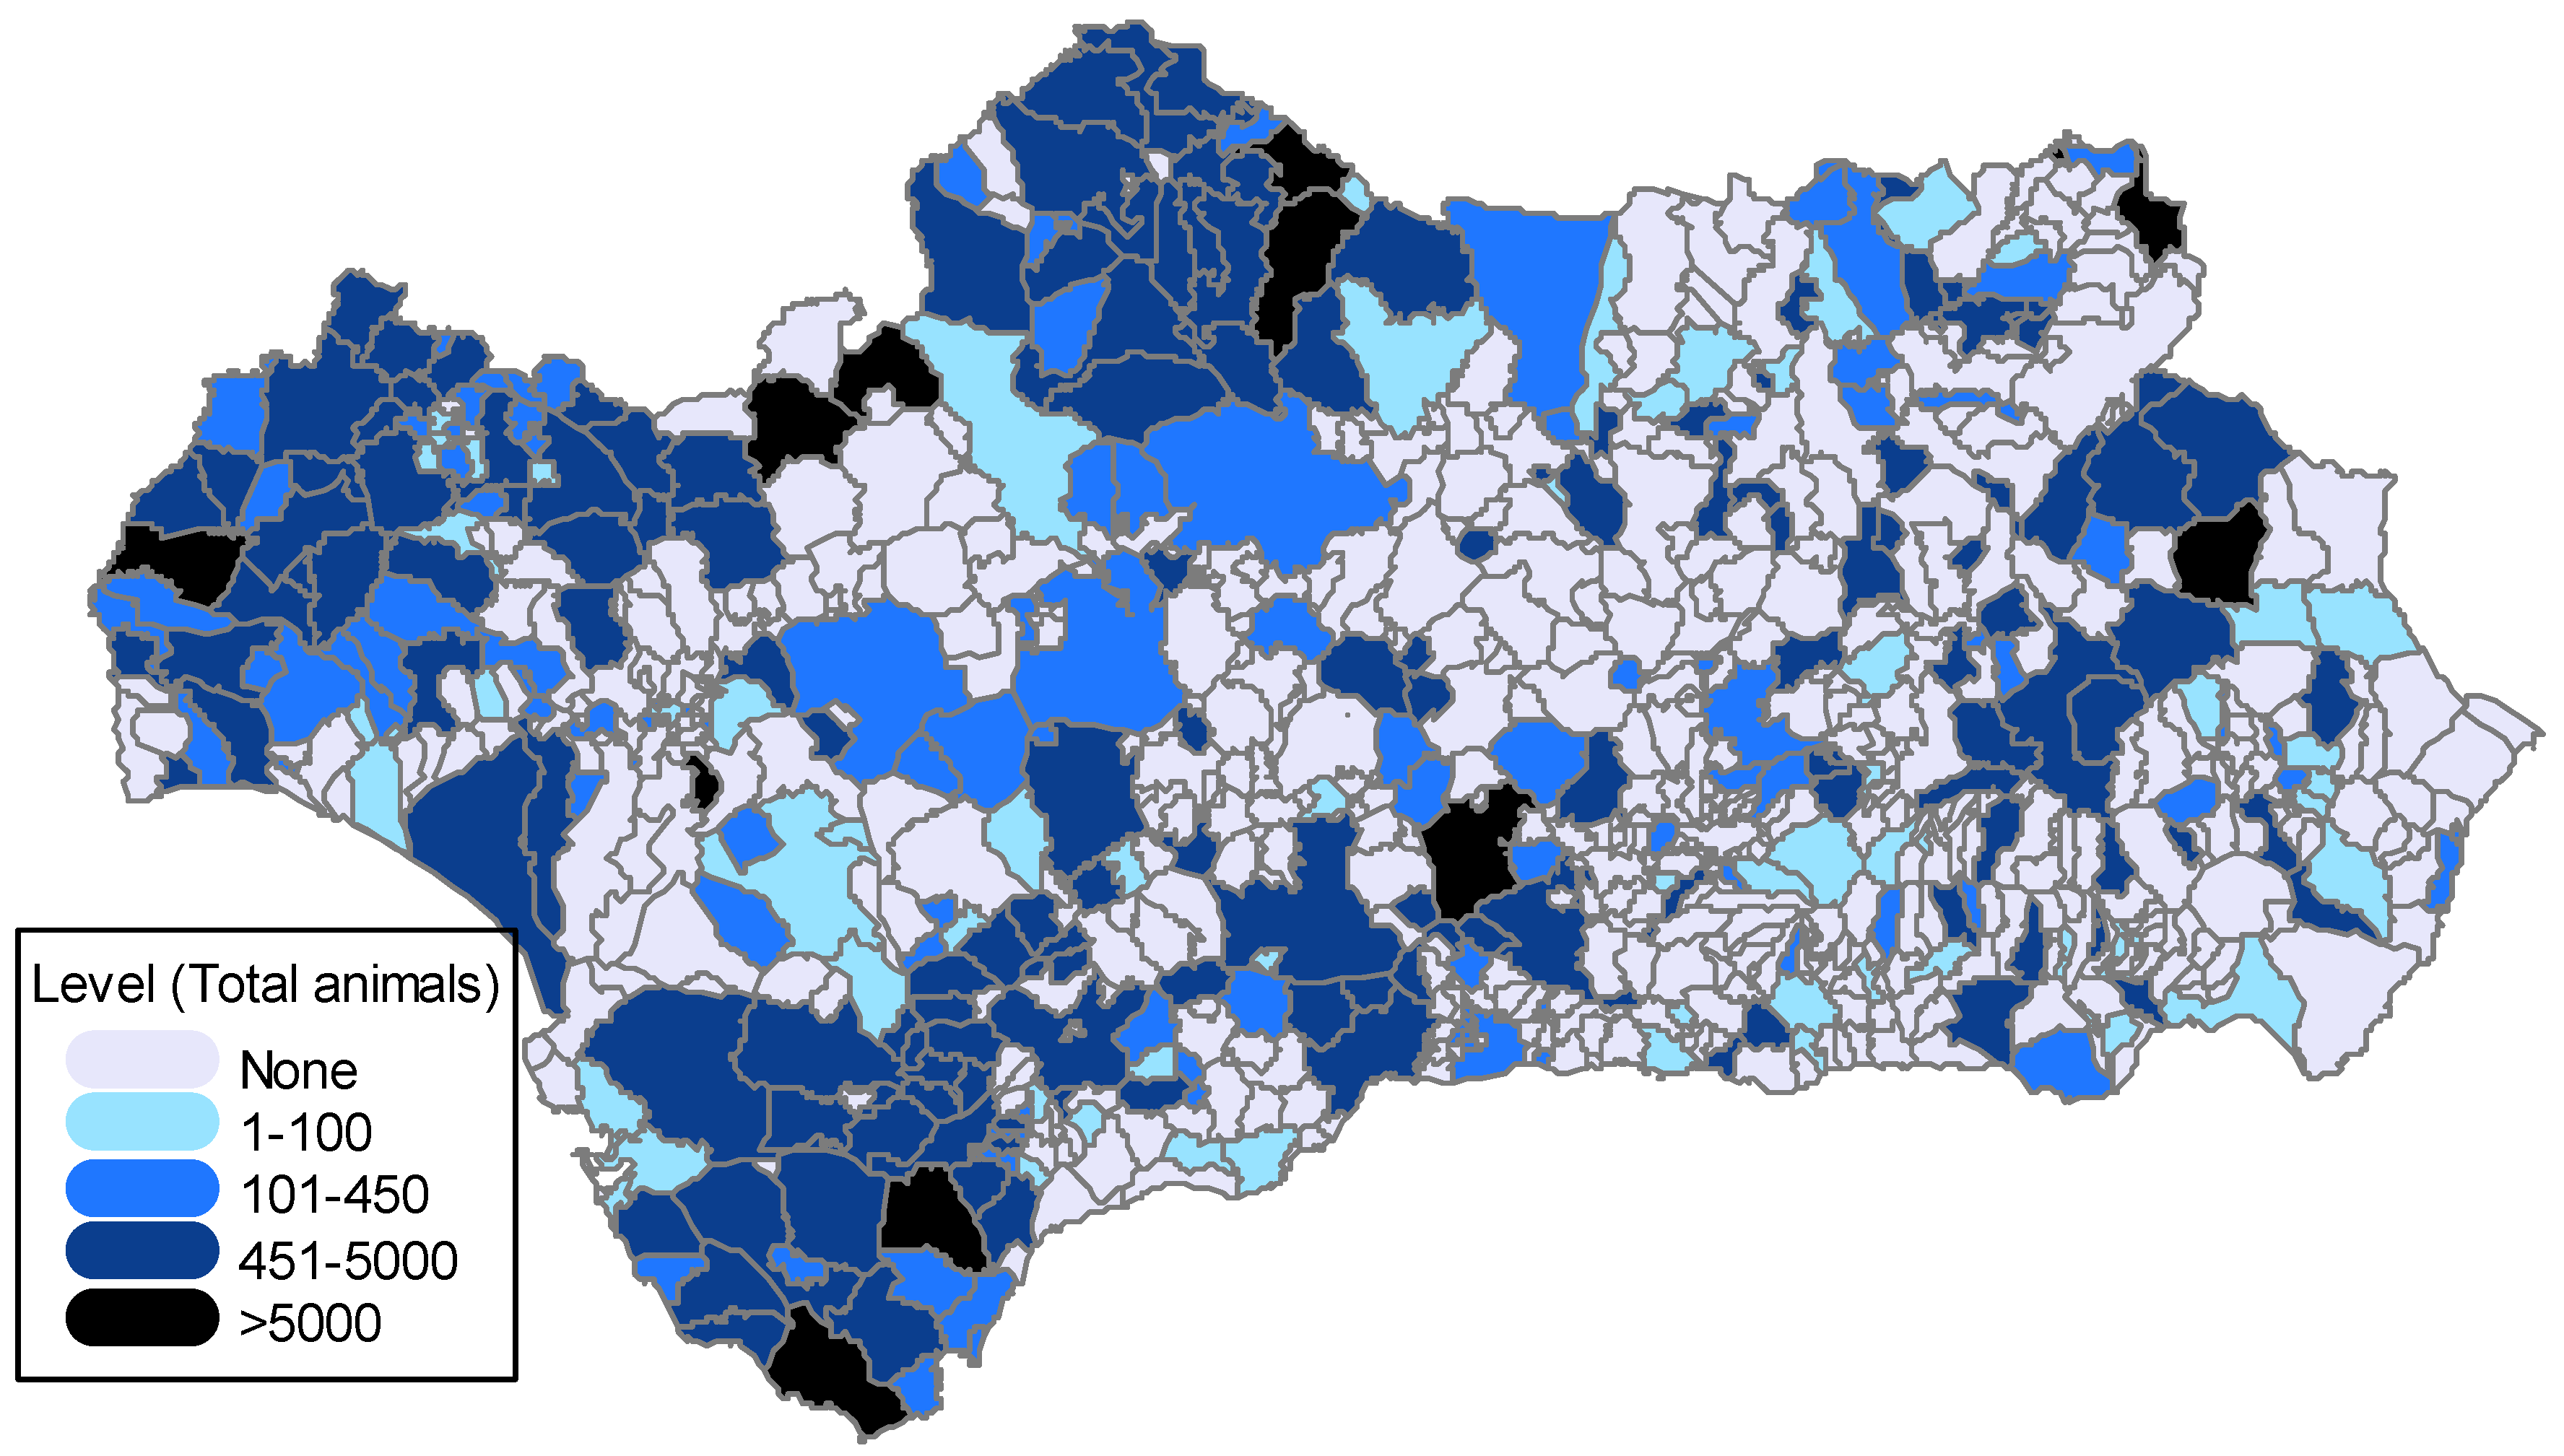
We analyzed the number of farms dedicated to “organic cattle farming”, “organic sheep and goat farming”, “organic pig farming” and “organic poultry farming” and recorded the total number of farms. Andalusia has a total of 1819 farms with 339,859 animals. This represents an average of 2.36 farms per municipality, with the municipality of Tarifa containing the highest number (87 farms, with a total of 8562 animals, mostly cattle). The spatial distribution of the number of farms per municipality is shown in
Figure 1, where it can be seen that the majority of the organic production of livestock takes place in the eastern part of the region, especially in the provinces of Huelva and Cádiz and, to a lesser extent, Córdoba. With respect to the number of animals reared in organic farms, the spatial pattern is similar (
Figure 2).
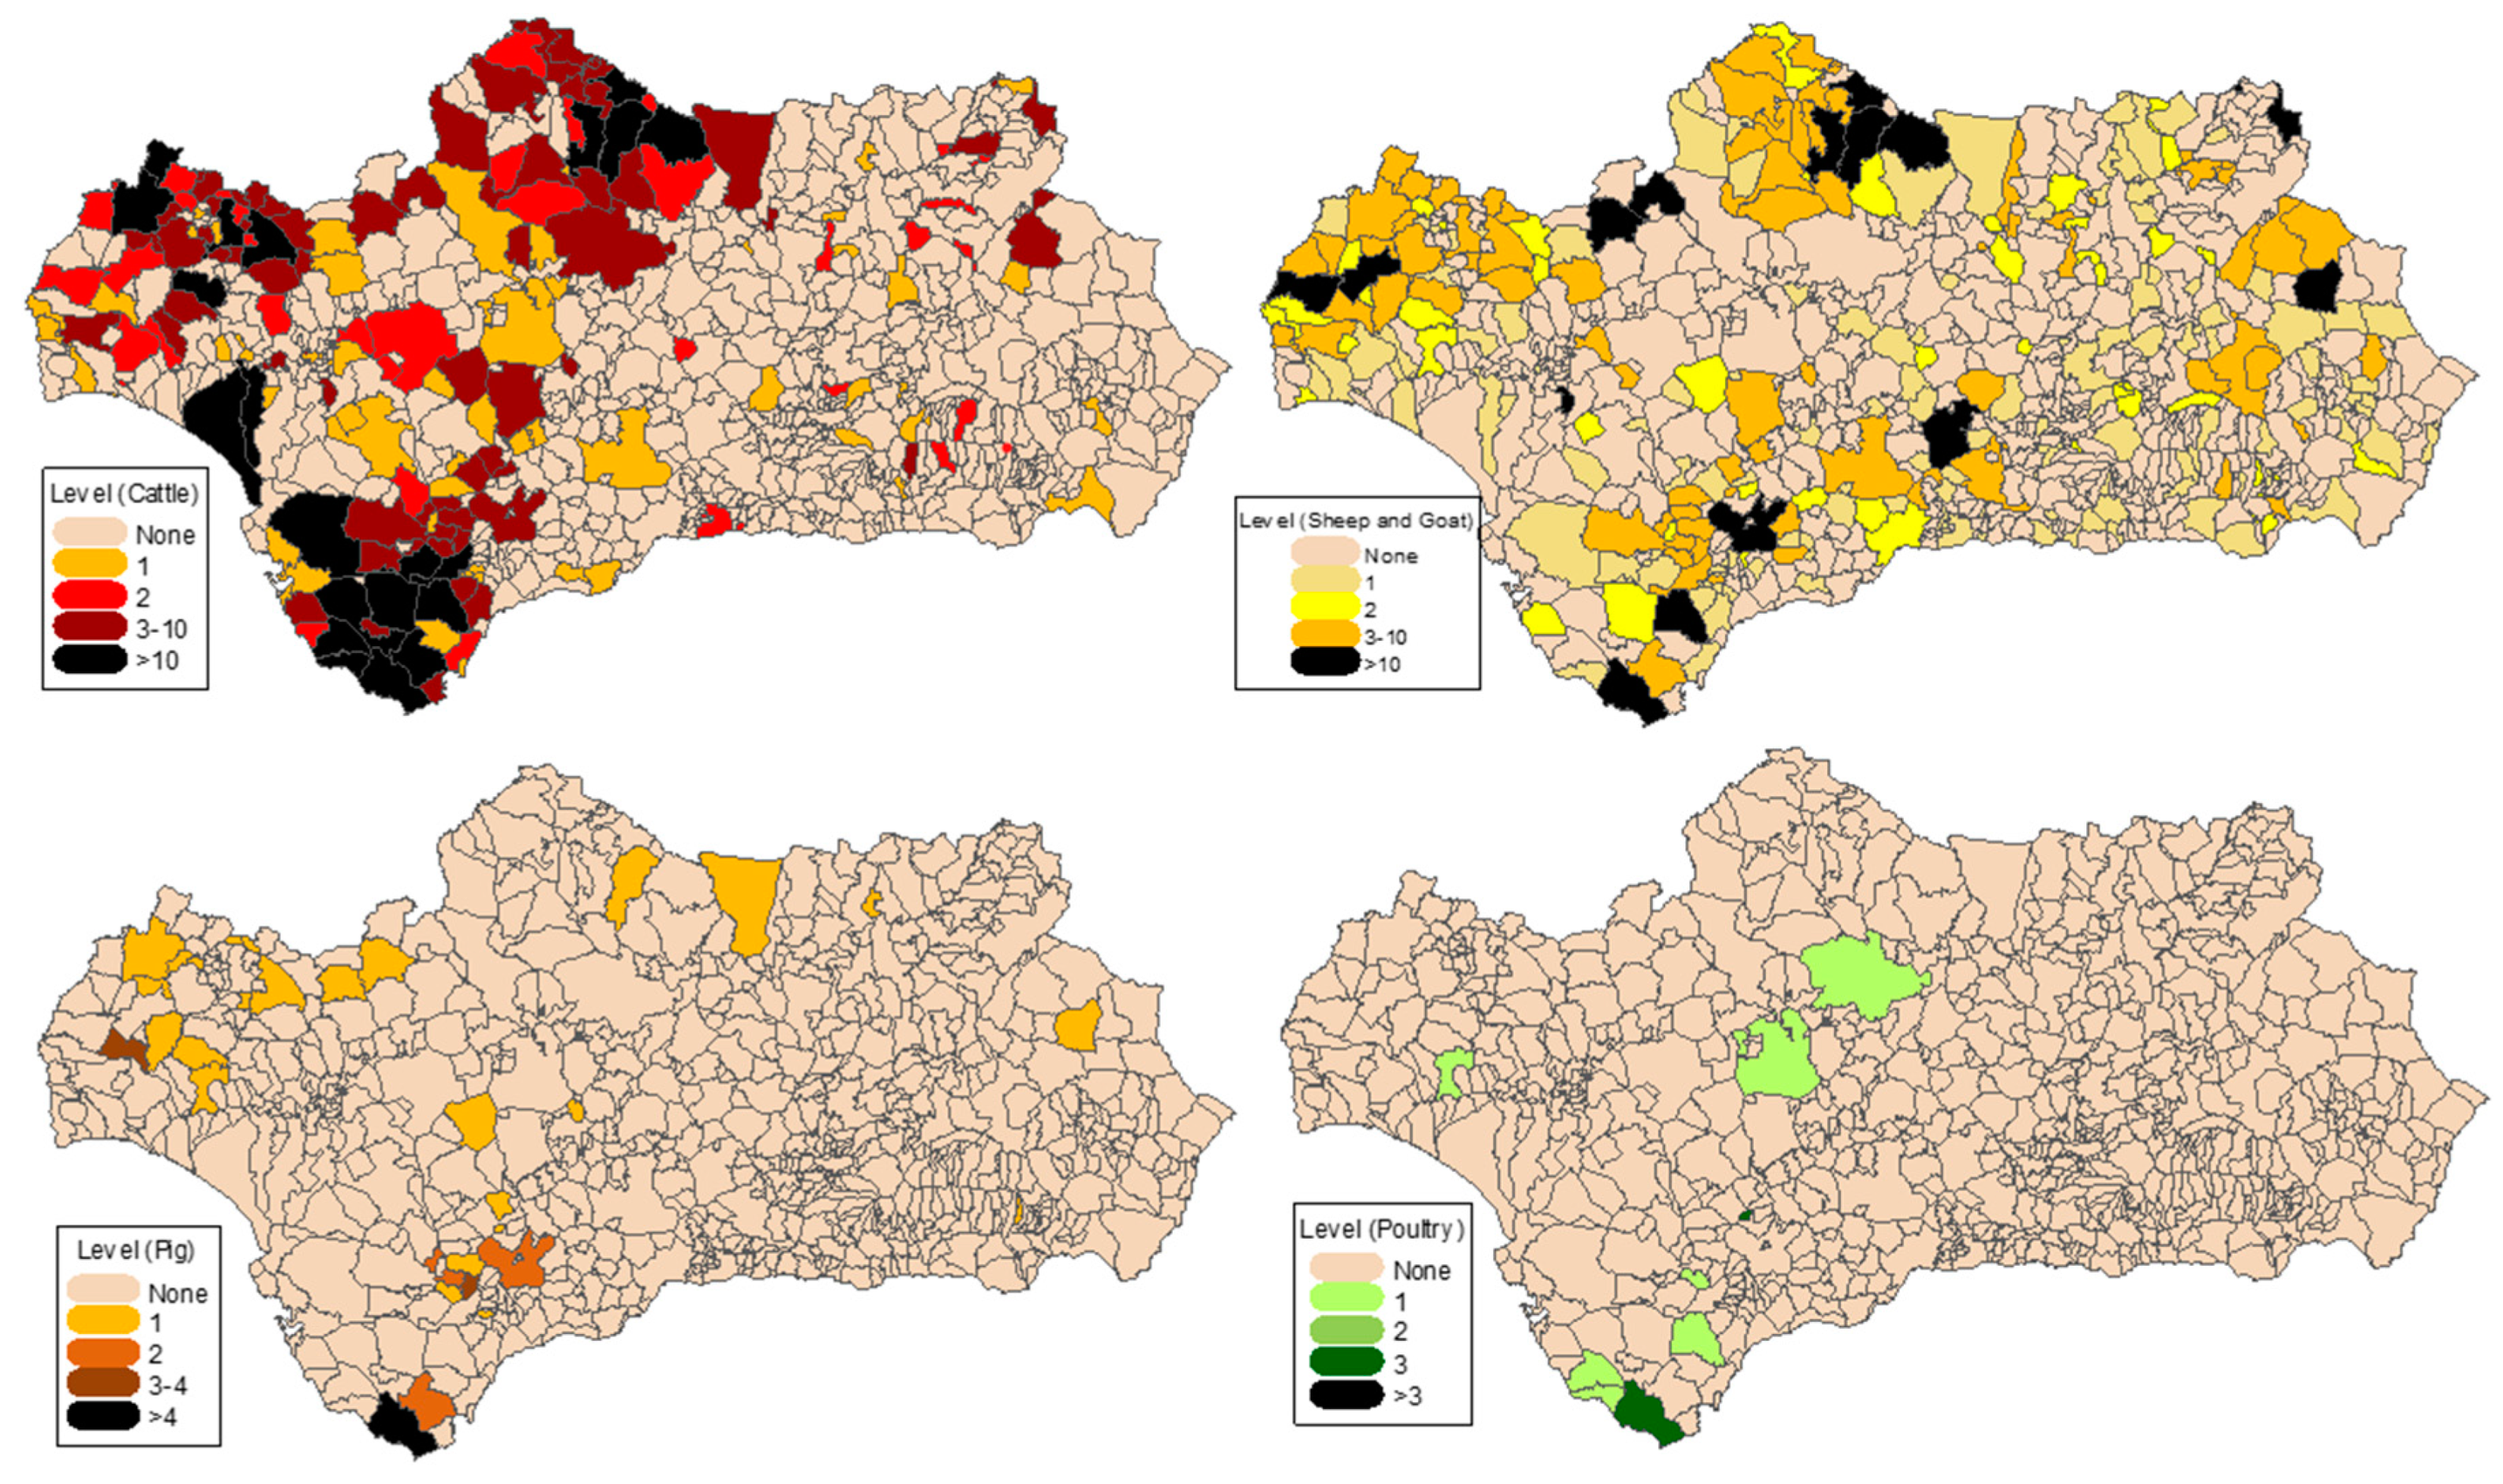
Analysis by each kind of animal (
Figure 3) shows that on average there are 1.21 cattle farms per municipality and 1.07 for sheep and goats. The values for pigs and poultry are negligible (0.05 and 0.02, respectively). There are 934 organic cattle farms in Andalusia (with 59,339 animals), representing 51.35% of the total holdings and 17.46% of the total head of cattle. By municipality, Tarifa is at the forefront, with 65 farms and 6989 animals, followed by Barbate (49 farms with 3777 animals) and Almonte (47 farms with 994 animals). Also significant is the municipality of Los Barrios, where although there are only 42 farms, they have 3437 animals.
With respect to sheep and goats, there are 829 farms with 275,826 animals; these values represent 45.27% of the total number of farms and 81.16% of the animals. The leading municipalities are Santiago-Pontones (33 farms with 16,263 animals), Alanís (32 farms with 17 602 animals) and Cazalla de la Sierra (24 farms with 11,196 animals). There are 43 pig farms (2.36% of the total), with 3760 animals (1.11% of the total). By municipalities, the most important are Tarifa (five farms with 134 animals), Villaluenga del Rosario (three farms with 215 animals and Alosno (three farms with 71 animals). As is also noteworthy, not by number of farms but by the number of animals, is Pulpí with 1909 animals on just one farm. With respect to poultry, there are 13 farms with 934 animals, representing 0.71% and 0.27% of the total, respectively. The leading producers are in Tarifa (three farms with 80 animals) and Torre Alháquime (three farms with 56 animals). Jimena de la Frontera and the city of Córdoba each have only one farm, but 300 and 140 animals, respectively.
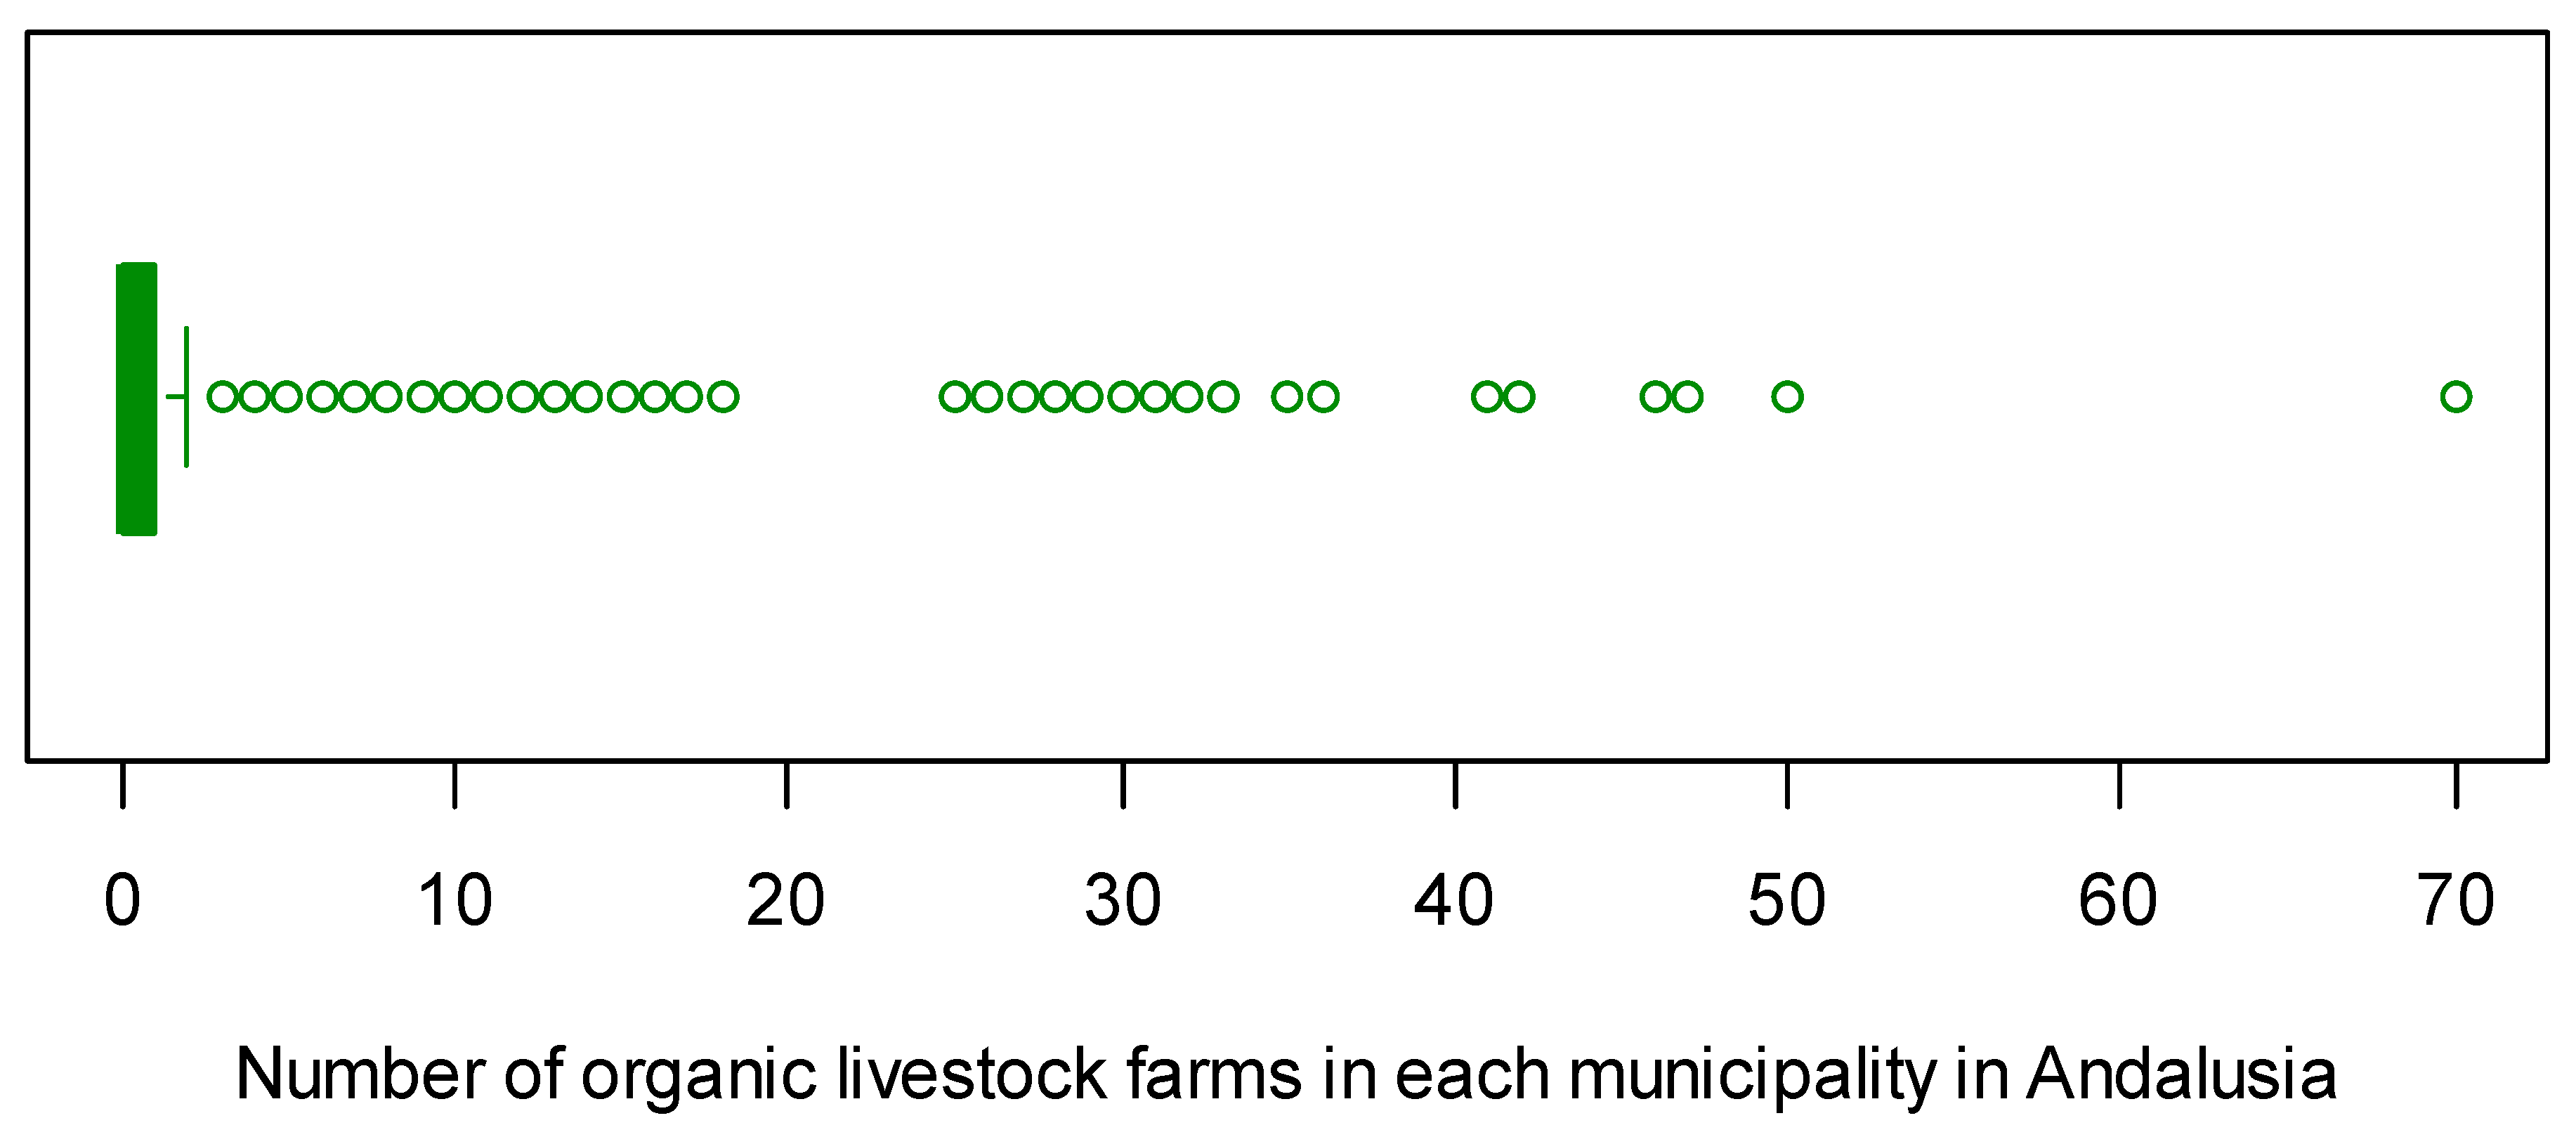
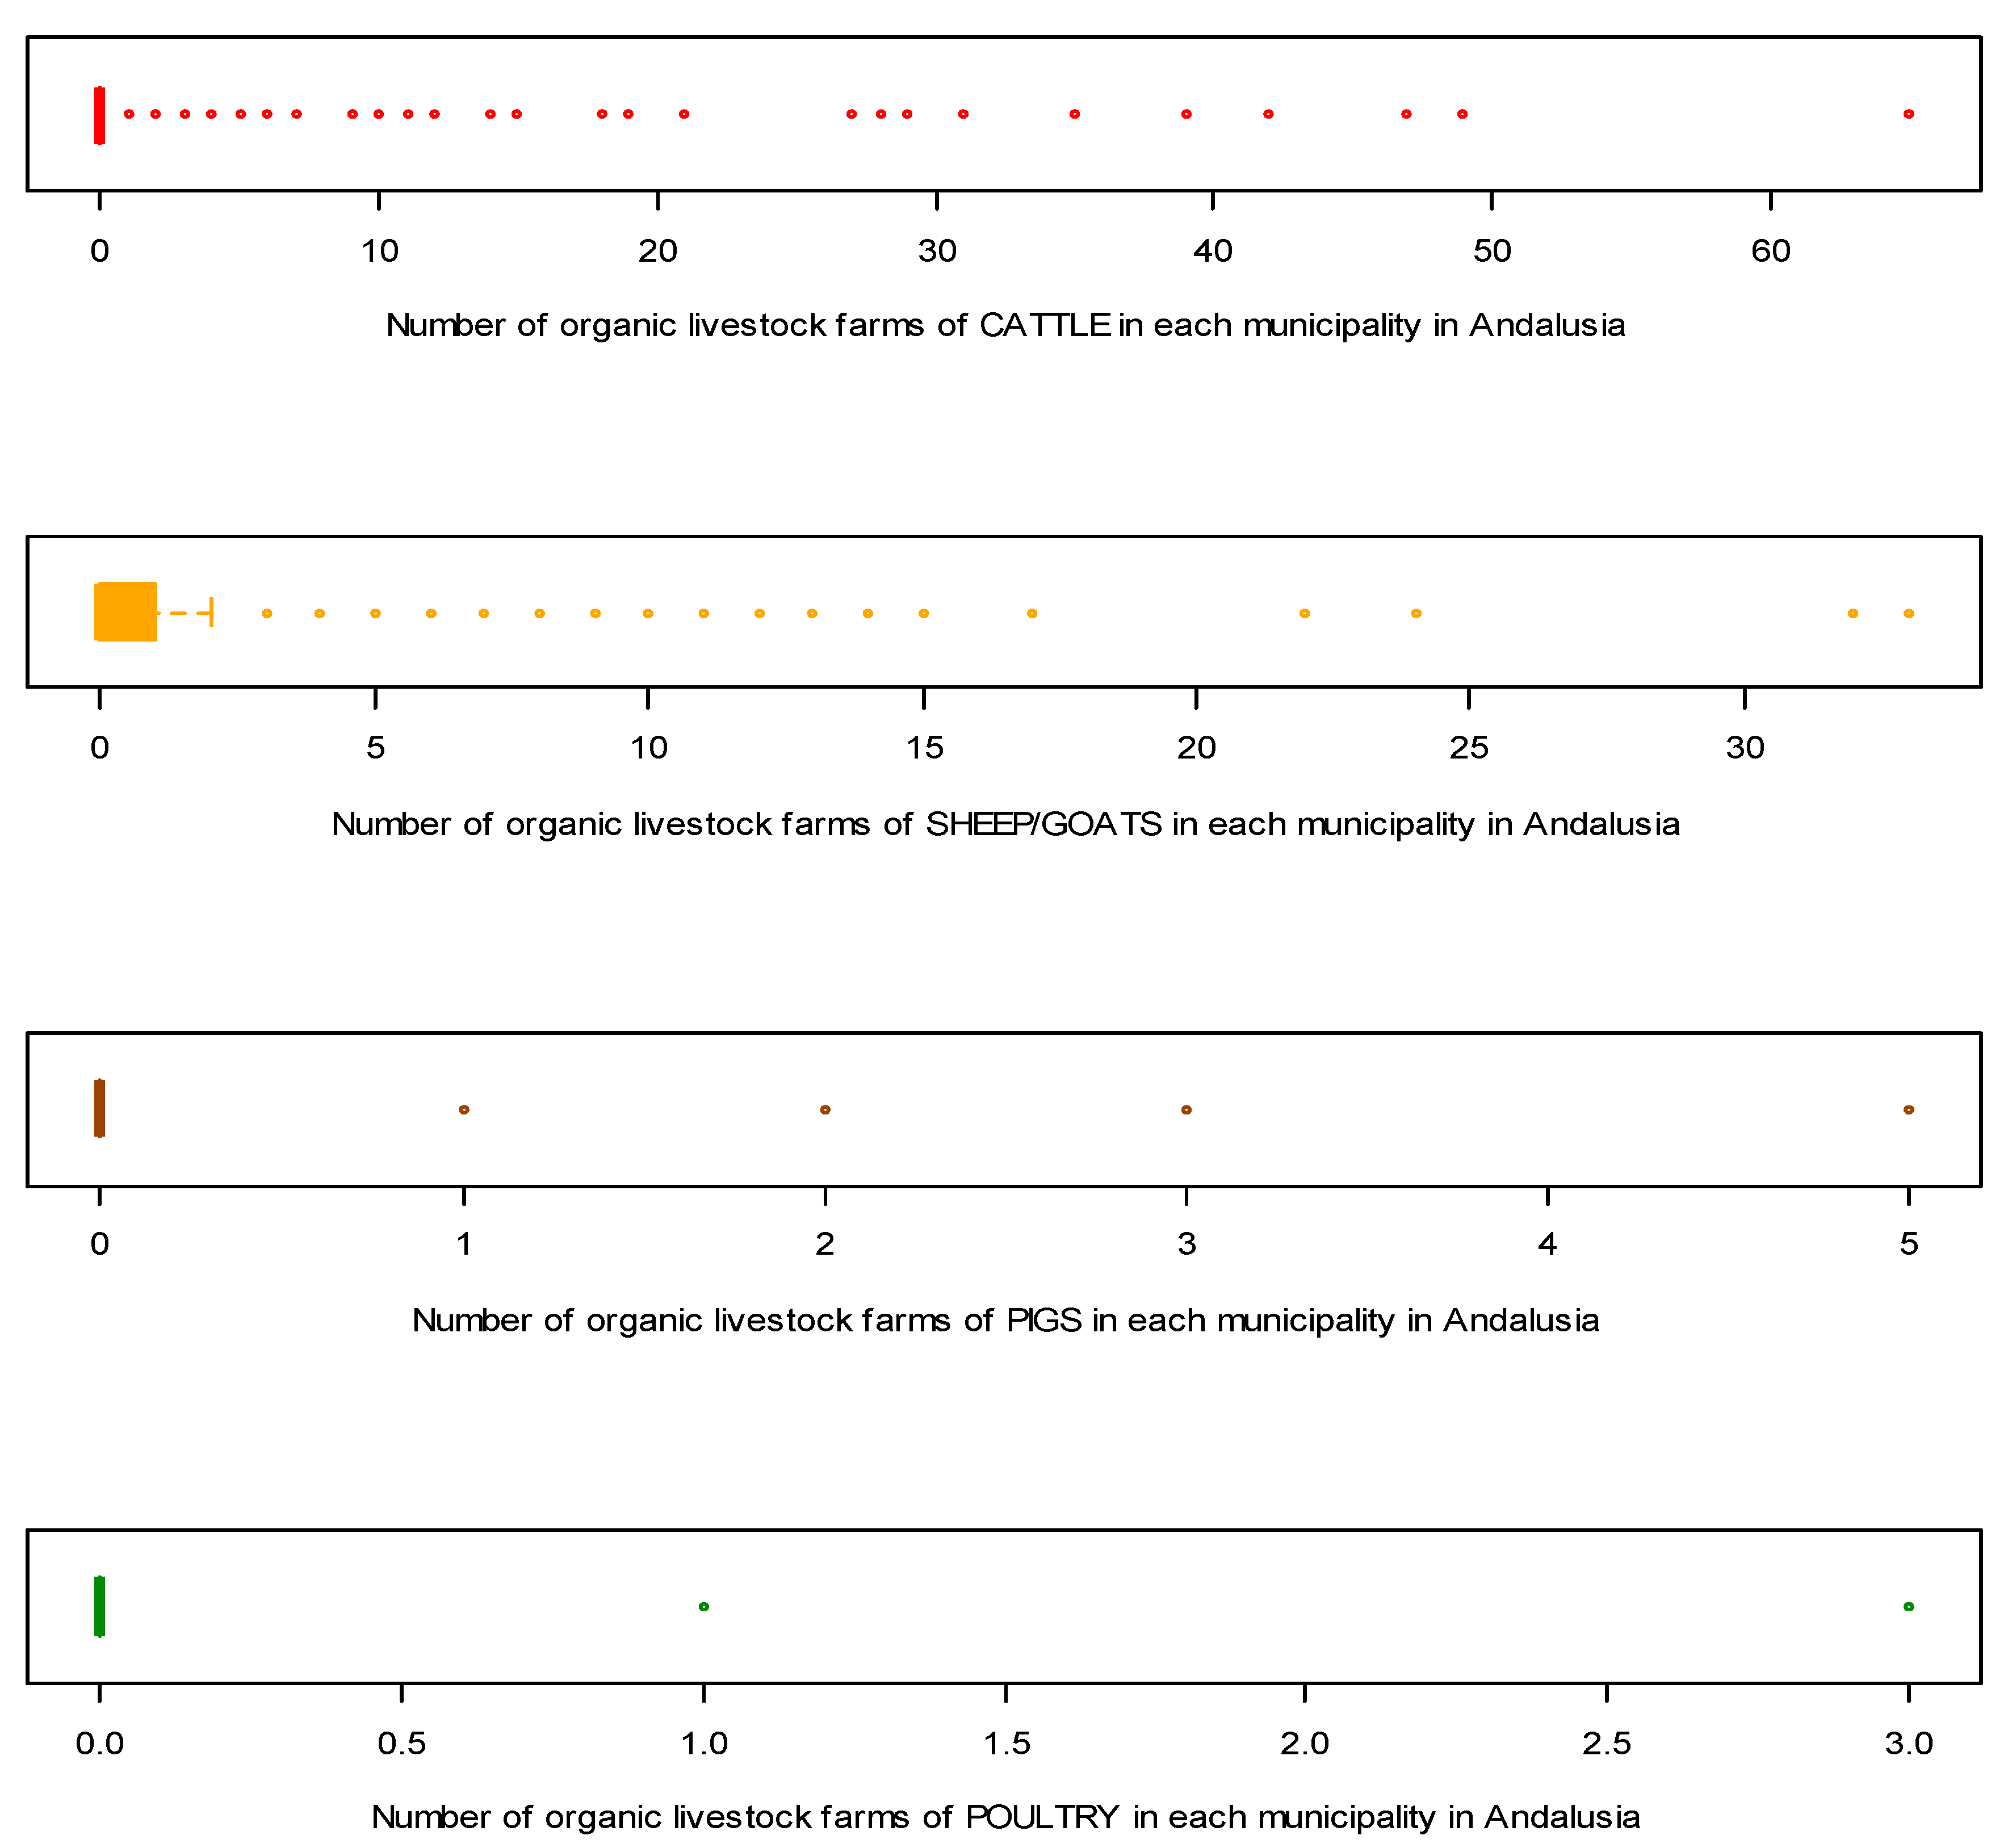
As the aim of this analysis is to apply the univariate Waring distribution, we examine the shape of the variable “number of farms”. The corresponding Box plots (
Figure 4 and
Figure 5) reveal the severe asymmetry of the distributions, in which the value 0 has a high density, as do the initial values. However, not all the skewed distributions will correctly fit a Waring distribution.
Figure 5 shows that the distributions of “pig” and “poultry” have a very small range of values; in these cases, the Waring distribution is not at all appropriate. For this reason, we model the distribution of all organic farms (without distinguishing by type of livestock).
By applying the maximum likelihood method, we obtain
,
and
(
p-value χ
2 = 0.8628), which indicates that the fit obtained is correct. The data observed and the fitted values are shown in
Table 1. By the method of the three relations between moments (MM3), we find that
,
and
(
p-value χ
2 < 0.001), and by the MF21 method, the corresponding results are
,
and
(
p-value χ
2 = 0.008). Therefore, the best estimates in this case are obtained with the maximum likelihood method; nevertheless, the variance cannot be decomposed, because
.
4. Discussion
The generalized Waring process is a non-homogeneous stationary Markov process. Two models lead to the generalized Waring process: the Cox process and the compound Poisson process. The Poisson and Pólya processes arise as particular cases of the Generalized Waring process [
38,
39].
Various methods can be used to estimate the parameters of in addition to the maximum likelihood method, the method of moments and methods based on relations between moments and/or frequencies. In this respect, Rodríguez-Avi et al. observed that the minimum estimator χ2 based on the relations between moments produced a relative asymptotic efficiency result close to 1. It can be seen in the result of the method of moments that the Waring distribution is practically biparametric as the value of is very close to zero. All the analyzed methods produce similar results, but the method of two relations between moments and one for frequencies not only produces a good fit, in addition it has an important advantage over maximum likelihood in the speed of calculation, as it does not require the use of numerical methods, because the equations that must be solved in this approach do not require them. For this reason, many authors reject the use of this method to estimate the parameters of Waring-family distributions.
Not all distributions with significant asymmetry can be fitted by the Waring distribution. Our analysis shows that the fit for the variable “organic livestock holdings” is significant, and we believe this finding is of interest to those wishing to use this distribution to fit discrete observations. The estimators of the parameters using maximum likelihood estimation (MLE) and the method based on two equations of moments and one of frequencies (MF21) are described in
Section 2. It is important to note that
for the method of moments (MM3) and for the method with two equations for the moments and one for frequencies (MF21). Therefore, in this case the variance will be finite and can be decomposed as described by Irwin (1968). This is not the case, however, with maximum likelihood (
) as we show for the variable studied.
On the other hand, the estimators of the parameters obtained by maximum likelihood, by the method of moments and by the method based on the first two relations between moments and the first relation between probabilities enable us to calculate the value of the χ2 statistic. This is another reason for rejecting the method of one equation of moments and two of frequencies (MF12), apart from the fact that it does not produce good estimators. Therefore, we do not recommend using this method to estimate the parameters of the univariate generalized Waring distribution.
The estimators obtained by the method of moments (MM3) are considerably higher (, and ), an outcome that is totally logical in view of the multiplicative nature of the calculations performed. This is apparent from the expression of the mass probability function.
When the decomposition of the variance is addressed using the MM3 method, of the total variability found in the data,
, only
(5.6%) corresponds to the part of the variability that is truly random, while
(<1%) is the part caused by internal differences within each municipality and which therefore cannot be modelled, and
(94.3%) is the variability produced by the influence of external factors. Therefore, this decomposition which is not possible with other distributions indicates that a high percentage of variability is caused by external factors such as those that are economic, environmental, etc. For this reason, an open line of research would be the consideration of other environmental variables in the model, performing a Waring regression [
40,
41]. Such an approach would reveal which factors cause the proneness component to be so high.
Another promising future line of research regarding organic livestock would be to consider the spatial correlation structure of the data collected. It would be very useful to obtain geostatistical models to estimate the spatial trend of organic farming through covariates, when the location (latitude, longitude) of the information is known. Another possibility would be to consider lattice or raster type models. Such an approach could include all the aspects that might promote or hamper the adoption of organic livestock farming methods, such as economic factors (tax benefits, market prices and production costs), physical factors (for example, the type of soil and land elevation) or environmental factors such as the quantity and quality of grassland area, average temperatures and rainfall.
5. Conclusions
The Waring distribution is used mainly when the variable under study has a low probability of occurrence and one of the most important characteristics of the Waring distribution is the division of its variance, which reveals the behavior of the distribution in relation to the intrinsic randomness in the individuals, the internal differences between individuals (liability) and, finally, the external factors that may influence this behavior (proneness). This knowledge can be very useful to researchers because it reveals the origin of the observed variability in the data. The Waring distribution converges to the normal one when the parameters and tend towards infinity. If any of the parameters or are sufficiently small (as is the case in the present study) the distribution presents a strong skewness to the right, which makes it valid for modelling real random situations in which this skewness occurs.
Due to the nature of the distribution, by including a significant number of factorial products, the maximum likelihood method presents a series of calculation problems (calculation errors even using powerful computer software). For this reason, we present some important alternatives: the MM3 moment method and “mixed” estimation methods using MF12 and MF21 moments and frequencies. This research clearly shows that the use of the method of MF21 moments and frequencies is the one with the best results. It is more suitable than all other methods considered, including the method of moments, which produces estimates that are too high. Our study shows that the MLE and MF12 methods do not allow the necessary decomposition of the variance since they do not offer values of greater than 2.
This paper introduces a new field in which the Waring distribution can be studied and applied. This was done in an earlier study in the context of crop farming, and is now extended to that of livestock farming, with particular regard to its sustainable application, namely organic livestock farming.
A good fit of the Waring distribution to livestock data will allow other researchers to use this distribution to determine the origin of the variability in their data (i.e., the influence of external factors on the variance, or on randomness or responsibility), which is a great advantage versus other distributions. In the case discussed in this paper, we show that the variability in the data is mainly due to external factors (94.3%). This leads us to conclude that a Waring regression could be an ideal tool to reflect the variability provoked by external factors. In the field of livestock farming, for example, the costs of production, the extension of pasture or the sale prices of this meat could be included.
It is important to note that the Waring distribution will be valid when when the frequency of occurrence in the variable is very low. Using this distribution we can divide the variance when , thus highlighting its behavior in relation to the intrinsic randomness in the observations, the internal differences between individuals and the external factors that can influence this behavior. This property is very useful for researchers because it reveals the origin of the variability in the data. Therefore, using a distribution with the properties described in this paper makes it possible to detect and quantify the degree of influence of every source of variation.
Author Contributions
Formal analysis, J.A.M.-M.; Methodology, J.A.M.-M.; Software, M.D.H.-M.; Validation, M.D.H.-M.; Writing—original draft, M.D.H.-M. and J.A.M.-M. All authors have read and agreed to the published version of the manuscript.
Funding
This work was supported by the Faculty of Social and Legal Sciences (Melilla), by the Department of Statistics and Operational Research, by the Research Group “Survival Analysis and Probability Distributions” and the Office for Political Science and Research, through the project “Social-Labour Statistics and Demography” at the University of Granada (Spain).
Conflicts of Interest
The authors declare no conflict of interest.
Abbreviations
L (Liability), MF12 (method of one equation of moments and two relations between frequency), MF21 (method of two relations between moments and one equation of frequency), MLE (method of log-likelihood optimisation), MM3 (method of the three relations between moments), P (Proneness), R (Randomness), UGWD (Univariate Generalized Waring Distribution), , , (Waring distribution parameters), μ1 (mean of the Waring distribution), σ2 (variance of the Waring distribution).
References
- García Romero, C. Problemática actual e importancia del modelo ganadero ecológico (I): Ganadería ecológica y medio ambiente. Ganadería 2009, 60, 58–61. (In Spanish) [Google Scholar]
- Krieger, M.; Jones, J.; Blanco-Penedo, I.; Duval, J.; Emanuelson, U.; Hoischen-Taubner, S.; Sjöström, K.; Sundrum, A. Improving Animal Health on Organic Dairy Farms: Stakeholder Views on Policy Options. Sustainability 2020, 12, 3001. [Google Scholar] [CrossRef]
- Fardet, A.; Rock, E. Ultra-Processed Foods and Food System Sustainability: What Are the Links? Sustainability 2020, 12, 6280. [Google Scholar] [CrossRef]
- Kyryliuk, I. Ways of increasing domestic livestock supply and improving its quality. Cherkasy Univ. Bull. Econ. Sci. 2016, 1, 67–75. [Google Scholar]
- Tullo, E.; Finzi, A.; Guarino, M. Review: Environmental impact of livestock farming and Precision Livestock Farming as a mitigation strategy. Sci. Total Environ. 2019, 650, 2751–2760. [Google Scholar] [CrossRef]
- Mondelaers, K.; Aertsens, J.; Van Huylenbroeck, G. A meta-analysis of the differences in environmental impacts between organic and conventional farming. Br. Food J. 2009, 111, 1098–1119. [Google Scholar] [CrossRef]
- Gaona, C.; Rodríguez, M.; Castro, G.; Estévez, V. La ganadería ecológica en la gestión de los espacios naturales protegidos: Andalucía como modelo. Arch. De Zootec. 2014, 63, 25–54. (In Spanish) [Google Scholar] [CrossRef][Green Version]
- Junta de Andalucía. II Plan. Andaluz de Agricultura Ecológica (2007–2013); Consejería de Agricultura y Pesca: Sevilla, Spain, 2017. (In Spanish) [Google Scholar]
- Junta de Andalucía. Consumo De Aliment. Ecológicos En Andal; Consejería de Agricultura y Pesca: Sevilla, Spain, 2007. (In Spanish) [Google Scholar]
- Palupi, E.; Jayanegara, A.; Ploeger, A.; Kahl, J. Comparison of nutritional quality between conventional and organic dairy products: A meta-analysis. J. Sci. Food Agric. 2012, 92, 2774–2781. [Google Scholar] [CrossRef]
- AviAlter. Contribución de AviAlter a la Consulta Para la Revisión de la Política Europea Sobre Agricultura Ecológica for European Commission (Consultations); AviAlter: Pinseque, Spain, 2013. (In Spanish) [Google Scholar]
- Manca, G.; Attaway, D.; Waters, N. Program assessment and the EU’s agrienvironmental Measure 214: An investigation of the spatial dynamics of agrienvironmental policies in Sardinia, Italy. Appl. Geogr. 2014, 50, 24–30. [Google Scholar] [CrossRef]
- WWF. Propuestas de WWF España para la mejora ambiental de los reglamentos de producción ecológica. In Fondo Mundial Para la Naturaleza; WWF: Morges, Switzerland, 2013. (In Spanish) [Google Scholar]
- Xekalaki, E. Chance Mechanisms for the Univariate Generalized Waring Distribution and Related Characterizations. In Statistical Distributions in Scientific Work; NATO Advanced Study Institutes Series (Series C: Mathematical and Physical Sciences); Taillie, C., Patil, G.P., Baldessari, B.A., Eds.; Springer: Dordrecht, The Netherlands, 1981; p. 79. [Google Scholar] [CrossRef]
- Irwin, J.O. The generalized Waring distribution applied to accident theory. J. R. Stat. Soc. A 1968, 131, 205–207. [Google Scholar] [CrossRef]
- Irwin, J.O. The generalized Waring distribution. J. R. Stat. Soc. A 1975, 138, 18–31, 204–227, 374–378. [Google Scholar] [CrossRef]
- Danial, E.J. Generalization to the suficient conditions for a discrete random variable to be infinitely divisible. Stat. Probab. Lett. 1988, 6, 379–382. [Google Scholar] [CrossRef]
- Xekalaki, E. Infinite divisibility, completeness and regression properties of the univariate generalized Waring distribution. Ann. Inst. Stat. Math. 1983, 35, 279–289. [Google Scholar] [CrossRef]
- Ferreri, C. On the hypergeometric birth process and some implications about the gamma distribution representation. J. R. Stat. Soc. B 1984, 46, 52–57. [Google Scholar] [CrossRef]
- Devroye, L. Random variate generation for the digamma and trigamma distributions. Stat. Comput. Simul. 1992, 43, 197–216. [Google Scholar] [CrossRef]
- Duerr, H.P.; Dietz, K. Stochastics models for aggregation processes. Math. Biosci. 2000, 165, 135–145. [Google Scholar] [CrossRef]
- Sarabia, J.M.; Castillo, E. Extensiones Multivariantes de la Distribución de Waring Generalizada, XVII Congreso Nacional de Estadística e I.O; Universitat de Lleida: Lleida, Spain, 2003; pp. 344–354. (In Spanish) [Google Scholar]
- Rodríguez-Avi, J.; Conde-Sánchez, A.; Sáez-Castillo, A.; Olmo-Jiménez, M.J. Estimation of parameters in gaussian hypergeometric distributions. Commun. Stat. 2003, 32, 1101–1118. [Google Scholar] [CrossRef]
- Rodríguez-Avi, J.; Conde-Sánchez, A.; Sáez-Castillo, A.; Olmo-Jiménez, M.J. A new generalization of the Waring distribution. Comput. Stat. Data Anal. 2007, 51, 6138–6150. [Google Scholar] [CrossRef]
- Newbold, E. A Contribution to the Study of the Human Factor in the Causation of Accidents; Report No. 34; Industrial Fatigue Research Board. H.M. Stationery Office: London, UK, 1926. [Google Scholar]
- Xekalaki, E. The univariate generalized Waring distribution in relation to accident theory: Proneness, spells or contagion? Biometrics 1983, 39, 887–895. [Google Scholar] [CrossRef]
- Irwin, J.O. The place of mathematics in medical and biological statistics. J. R. Stat. Soc. A 1963, 126, 1–44. [Google Scholar] [CrossRef]
- Boxenbaum, H.; Pivinski, F.; Stephen, J.R. Publication rates of pharmaceutical scientists: Application of the Waring distribution. Drug Metab. Rev. 1987, 18, 553–571. [Google Scholar] [CrossRef] [PubMed]
- Wolfran, D. Applying informetric characteristics of databases to IR system file design, part I: Informetric models’. Inf. Process. Manag. 1992, 28, 121–133. [Google Scholar] [CrossRef]
- Canal, L.; Micciolo, R. Modelli probabilisciti per l’analisi dei contatti psichiatrici. Epidemiol. E Psichiatr. Soc. 1999, 8, 47–55. (In Italian) [Google Scholar] [CrossRef] [PubMed]
- Kemp, A.W. The q-beta-geometric distribution as a model for fecundability. Commun. Stat. Theory Methods 2001, 30, 2373–2384. [Google Scholar] [CrossRef]
- Kendall, M.G.; Stuart, A. The Advanced Theory of Statistics, Vol I, Vol II; Griffin: London, UK, 1969. [Google Scholar]
- Huete-Morales, M.D.; Marmolejo-Martín, J.A. Modelling the number of olive groves in Spanish municipalities. Span. J. Agric. Res. 2016, 14, e0201(1)–e0201(8). [Google Scholar]
- INE. National Institute of Statistics (Spain). In Agrarian Census 2009; INE: Madrid, Spain, 2009. [Google Scholar]
- SIMA. Sistema de Información Multiterritorial de Andalucía 2015; Instituto de Estadística y Cartografía de Andalucía: Seville, Spain, 2015. [Google Scholar]
- Marmolejo, J.A. Métodos de Generación de Distribuciones. Aplicación a la Distribución de Waring. Ph.D. Thesis, University of Granada, Granada, Spain, 2003. (In Spanish). [Google Scholar]
- Sáez-Castillo, A.J.; Vílchez-López, S.; Olmo-Jiménez, M.J.; Rodríguez-Avi, J.; Conde-Sánchez, A.; Martínez-Rodríguez, A.M. GWRM: Generalized Waring Regression Model for Count Data. GWRM R Package Version 2.1.0.3. Available online: https://cran.r-project.org/package=GWRM. (accessed on 13 November 2020).
- Rivas-Calabrán, L.I. Análisis de Influencia para el Modelo de Regresión de Waring. Ph.D. Thesis, Universidad Católica, Católica, Chile, 2017. (In Spanish). [Google Scholar]
- Xekalaki, E.; Zografi, M. The Generalized Waring Process and Its Application. Commun. Stat. Theory Methods 2008, 37, 1835–1854. [Google Scholar] [CrossRef]
- Rodríguez-Avi, J.; Conde-Sánchez, A.; Sáez-Castillo, A.J.; Olmo-Jiménez, M.J.; Martínez-Rodríguez, A.M. A generalized Waring regression model for count data. Comput. Stat. Data Anal. 2009, 53, 3717–3725. [Google Scholar] [CrossRef]
- Rivas-Calabrán, L.; Galea, M. Influence Measures for the Waring Regression Model. Braz. J. Probab. Stat. 2019, 33, 402–424. [Google Scholar] [CrossRef]
| Publisher’s Note: MDPI stays neutral with regard to jurisdictional claims in published maps and institutional affiliations. |
© 2020 by the authors. Licensee MDPI, Basel, Switzerland. This article is an open access article distributed under the terms and conditions of the Creative Commons Attribution (CC BY) license (http://creativecommons.org/licenses/by/4.0/).


