Article

A Numerical Study on the Crack Development Behavior of Rock-Like Material Containing Two Intersecting Flaws

1
School of Resources Environment and Safety Engineering, University of South China, Hengyang 421000, China
2
School of Resources and Safety Engineering, Central South University, Changsha 410000, China
*
Authors to whom correspondence should be addressed.
Mathematics 2019, 7(12), 1223; https://doi.org/10.3390/math7121223
Submission received: 31 October 2019 / Revised: 3 December 2019 / Accepted: 10 December 2019 / Published: 11 December 2019
(This article belongs to the Special Issue Mathematical Physics II)

Abstract

:
It is quite often that rocks contain intersecting cracks. Therefore, crack behavior cannot be completely studied by only considering several isolated, single flaws. To investigate the crack behavior of rock or rock-like material containing intersecting flaws under uniaxial loading, numerical simulations were carried out using parallel bonded-particle models containing two intersecting flaws with different inclination angles (varying β) and different intersection angles (varying αα). The crack propagation processes are analyzed and two typical patterns of linkage are observed between two intersecting flaws: (1) One-tip-linkage that contains three subtypes: Coalescence position near the tip; coalescence position at the flaw, but far away from the tip; coalescence position outside the flaw at a certain distance from the tip; and (2) two-tip-linkage with two subtypes: Straight linkage and arc linkage. The geometries of flaws influence the coalescence type. Moreover, the effects of intersection angle α and inclination angle β on the peak stress, the stress of crack initiation, and the stress of crack coalescence are also investigated in detail.

1. Introduction

Numerous discontinuities on different scales occur in rocks and rock masses, such as flaws, joints, cracks, and faults, which are induced during the formation of rock masses and successive tectonic processes. The existence of joints, cracks, or faults in rock masses has two mechanical effects [1,2,3,4]: (1) The strength and stiffness of the rock mass will be decreased; and (2) they will generate new fractures that may further develop and connect with other flaws and then may lead to the degradation of the strength and stiffness of the rock or rock mass, respectively. Therefore, the mechanism of crack propagation and coalescence is of great interest in geomechanics [5,6].
To further study the laws of cracks and the development of single cracks, physical experiments were conducted [7,8,9,10,11,12,13,14,15,16,17,18]. The observed crack patterns under uniaxial compression can be categorized as follows: (1) Wing cracks initiated at the tips of single, pre-existing flaws propagating along the direction of axial stress; and (2) secondary shear or mixed mode tensile-shear cracks initiated later from the tips of single pre-existing flaws propagating as quasi-coplanar or oblique cracks.
Crack coalescence mechanisms were studied by other researchers with rock-like materials containing two or more parallel flaws in a compression state [1,19,20,21,22,23,24,25,26,27]. It was observed that flaw angle, bridging angle, non-overlapping length, and frictional coefficient have significant effects on the crack initiation modes and the patterns of crack coalescence. Moreover, it was shown that the peak strength and stiffness of rocks and rock-like material depends on the number and geometry of flaws [28].
Previous work provides a good understanding of the coalescence patterns obtained from specimens with one or several single, non-intersecting flaws. However, joint patterns with more than one joint set are common in nature. Pollard and Aydin [29] defined several types of joint intersection geometries, which can be classified as orthogonal (+intersections) and non-orthogonal (X intersections). Both types can be divided into three groups according to the continuity of the joints at the intersections: (1) “all continuous joints”; (2) “continuous and discontinuous sets”; and (3) “all discontinuous sets”.
Lee and Jeon [30] used three materials (PMM, Diastone and Hwangdeung granite) to study the coalescence of a horizontal flaw with an underneath lying, inclined flaw. They stated that the geometry of a double-flaw can improve the understanding of crack propagation and coalescence because echelon type of cracks can be initiated by fracture planes that are not parallel to each other. Zhang et al. also studied the crack coalescence of gypsum with two non-parallel flaws under different flaw angles and different bridge angles. Their results showed that the stress distribution in the bridge area of the non-parallel flaws is more complicated than that of the parallel flaws. This difference affects the crack initiation stress as well as the coalescence pattern. Their studies provided fundamental understanding of the coalescence of non-parallel flaws, but observations made from two non-parallel flaws can only provide a limited understanding of the complex behavior of the rock mass with several crossing discontinuities. Besides this, numerical simulation also plays an important role in crack coalescence research [1,22,31,32,33]. One of the popular tools nowadays is the discrete element method [18,34,35,36,37,38,39,40].
In the present study, numerical simulation results are shown in respect to peak strength, crack initial stress, crack coalescence stress, and coalescence patterns of rock-like material with two intersecting flaws under uniaxial compression using a bonded-particle model (BPM).

2. Numerical Simulation Procedure

We used the bonded particle model (BPM), which is one of the contact models available in the two-dimensional particle flow code (PFC2D) software for numerical simulation. Turco [41] suggested a micro-mechanical model, which completely is described by the definition of the strain energy of the interaction between two nearby grains without consideration of the dynamical effects. This model can also effectively handle large deformation processes, even if quasistatic simulations require the solution of remarkable numerical challenges because they might present instabilities and bifurcation phenomena [42]. In the present study, numerical simulation focuses on the peak strength, crack initial stress, crack coalescence stress, and coalescence patterns of rock-like material with two intersecting flaws under uniaxial compression, thus the bonded particle model (BPM) could satisfy this study.
In PFC (such as that in BPM), the model specimens are created by combining a large number of circular particles with varying diameters. These particles are interconnected using parallel bonds, as shown in Figure 1. Tensile and shear stresses acting on the parallel bonds are calculated during simulations and if the maximum tensile stress exceeds the tensile strength of the parallel bonds or the maximum shear stress exceeds the shear strength of the parallel bonds, the parallel bonds will break and a microscopic tensile or shear crack will form (Figure 1).
To resemble the real cracking processes, discrete cracks that are close enough are connected with each other by a unique technique [18]. The symbol “a” stands for the centroids’ distance form a crack to the other one nearby, and the symbol “c” stands for the length of any of these two cracks (Figure 2). If a/c is less than or equal to 1, the crack, and the other one nearby, are regarded as a single continuous crack, and then the centroids of the two micro-cracks will connect with each other as a macroscopic crack trace line [18].
The geometry and parameters of the model specimens were chosen in such a way that the model duplicates the mechanical behavior of the gypsum specimens used in the experimental investigation of Wong and his subsequent numerical simulations [43]. The model specimens were created with the dimensions 50 mm in width and 100 mm in height, which are consistent with those of the specimens used for the laboratory testing by Wong [25]. The model specimens created in this manner comprised about 19,650 particles. The porosity of the model specimens was found to be 0.01.
The simulation program consisted of two stages. First, model specimens free of pre-existing flaws (i.e., intact) were simulated. Micro-parameters for the particles were selected in order to obtain a consistent macro-scale mechanical behavior with that of the gypsum specimens used by Wong [25]. Table 1 outlines these micro parameters assigned for the particles and parallel bonds of the numerical specimens independently. The next section reports the comparison of the mechanical properties of the numerical specimens of the present study and those of the specimens used for laboratory testing by Wong [25].
The second stage of the study involved a series of numerical simulations on model specimens containing two intersecting flaws with varied geometry to explore the influence of various geometries on the mechanical behavior of model specimens; flaw length L and thickness were fixed at 20 and 1 mm for both flaws, respectively, while the intersection angle α of the two flaws varied at 90°, 60°, 45°, and 30° (Figure 3). The inclination angle of one flaw (angle β of flaw B as shown in Figure 3b) was also varied in the next stage, while α was kept unchanged. To better distinguish the crack coalescence types and for the clarity of the explanations, the bridging zone (the zone surrounding the intersection of flaws) was divided into four zones, as shown in Figure 3c (I, II, III, and IV).
For all the simulations in the present numerical study, specimens were vertically loaded in a velocity-controlled manner and no confining pressure was applied (i.e., uniaxial compression). A sufficiently low loading rate −0.05 m/s was applied to ensure that the specimens remained in a quasi-static equilibrium throughout the test.

3. Results and Discussion

3.1. Mechanical Properties of Intact Models

We first determined the macro-scale mechanical properties of the model specimens and compared them with the corresponding properties reported by Wong [43]. Table 2 and Figure 4 show this comparison. It can be seen that the numerical model has very closely reproduced the mechanical behavior of gypsum specimens used in the laboratory investigation by Wong [43]. Following this verification, we simulated the mechanical behavior of specimens containing two intersecting flaws and the forthcoming sub-sections report the results of those simulations.

3.2. Mechanical Behavior of Specimens Containing Flaws

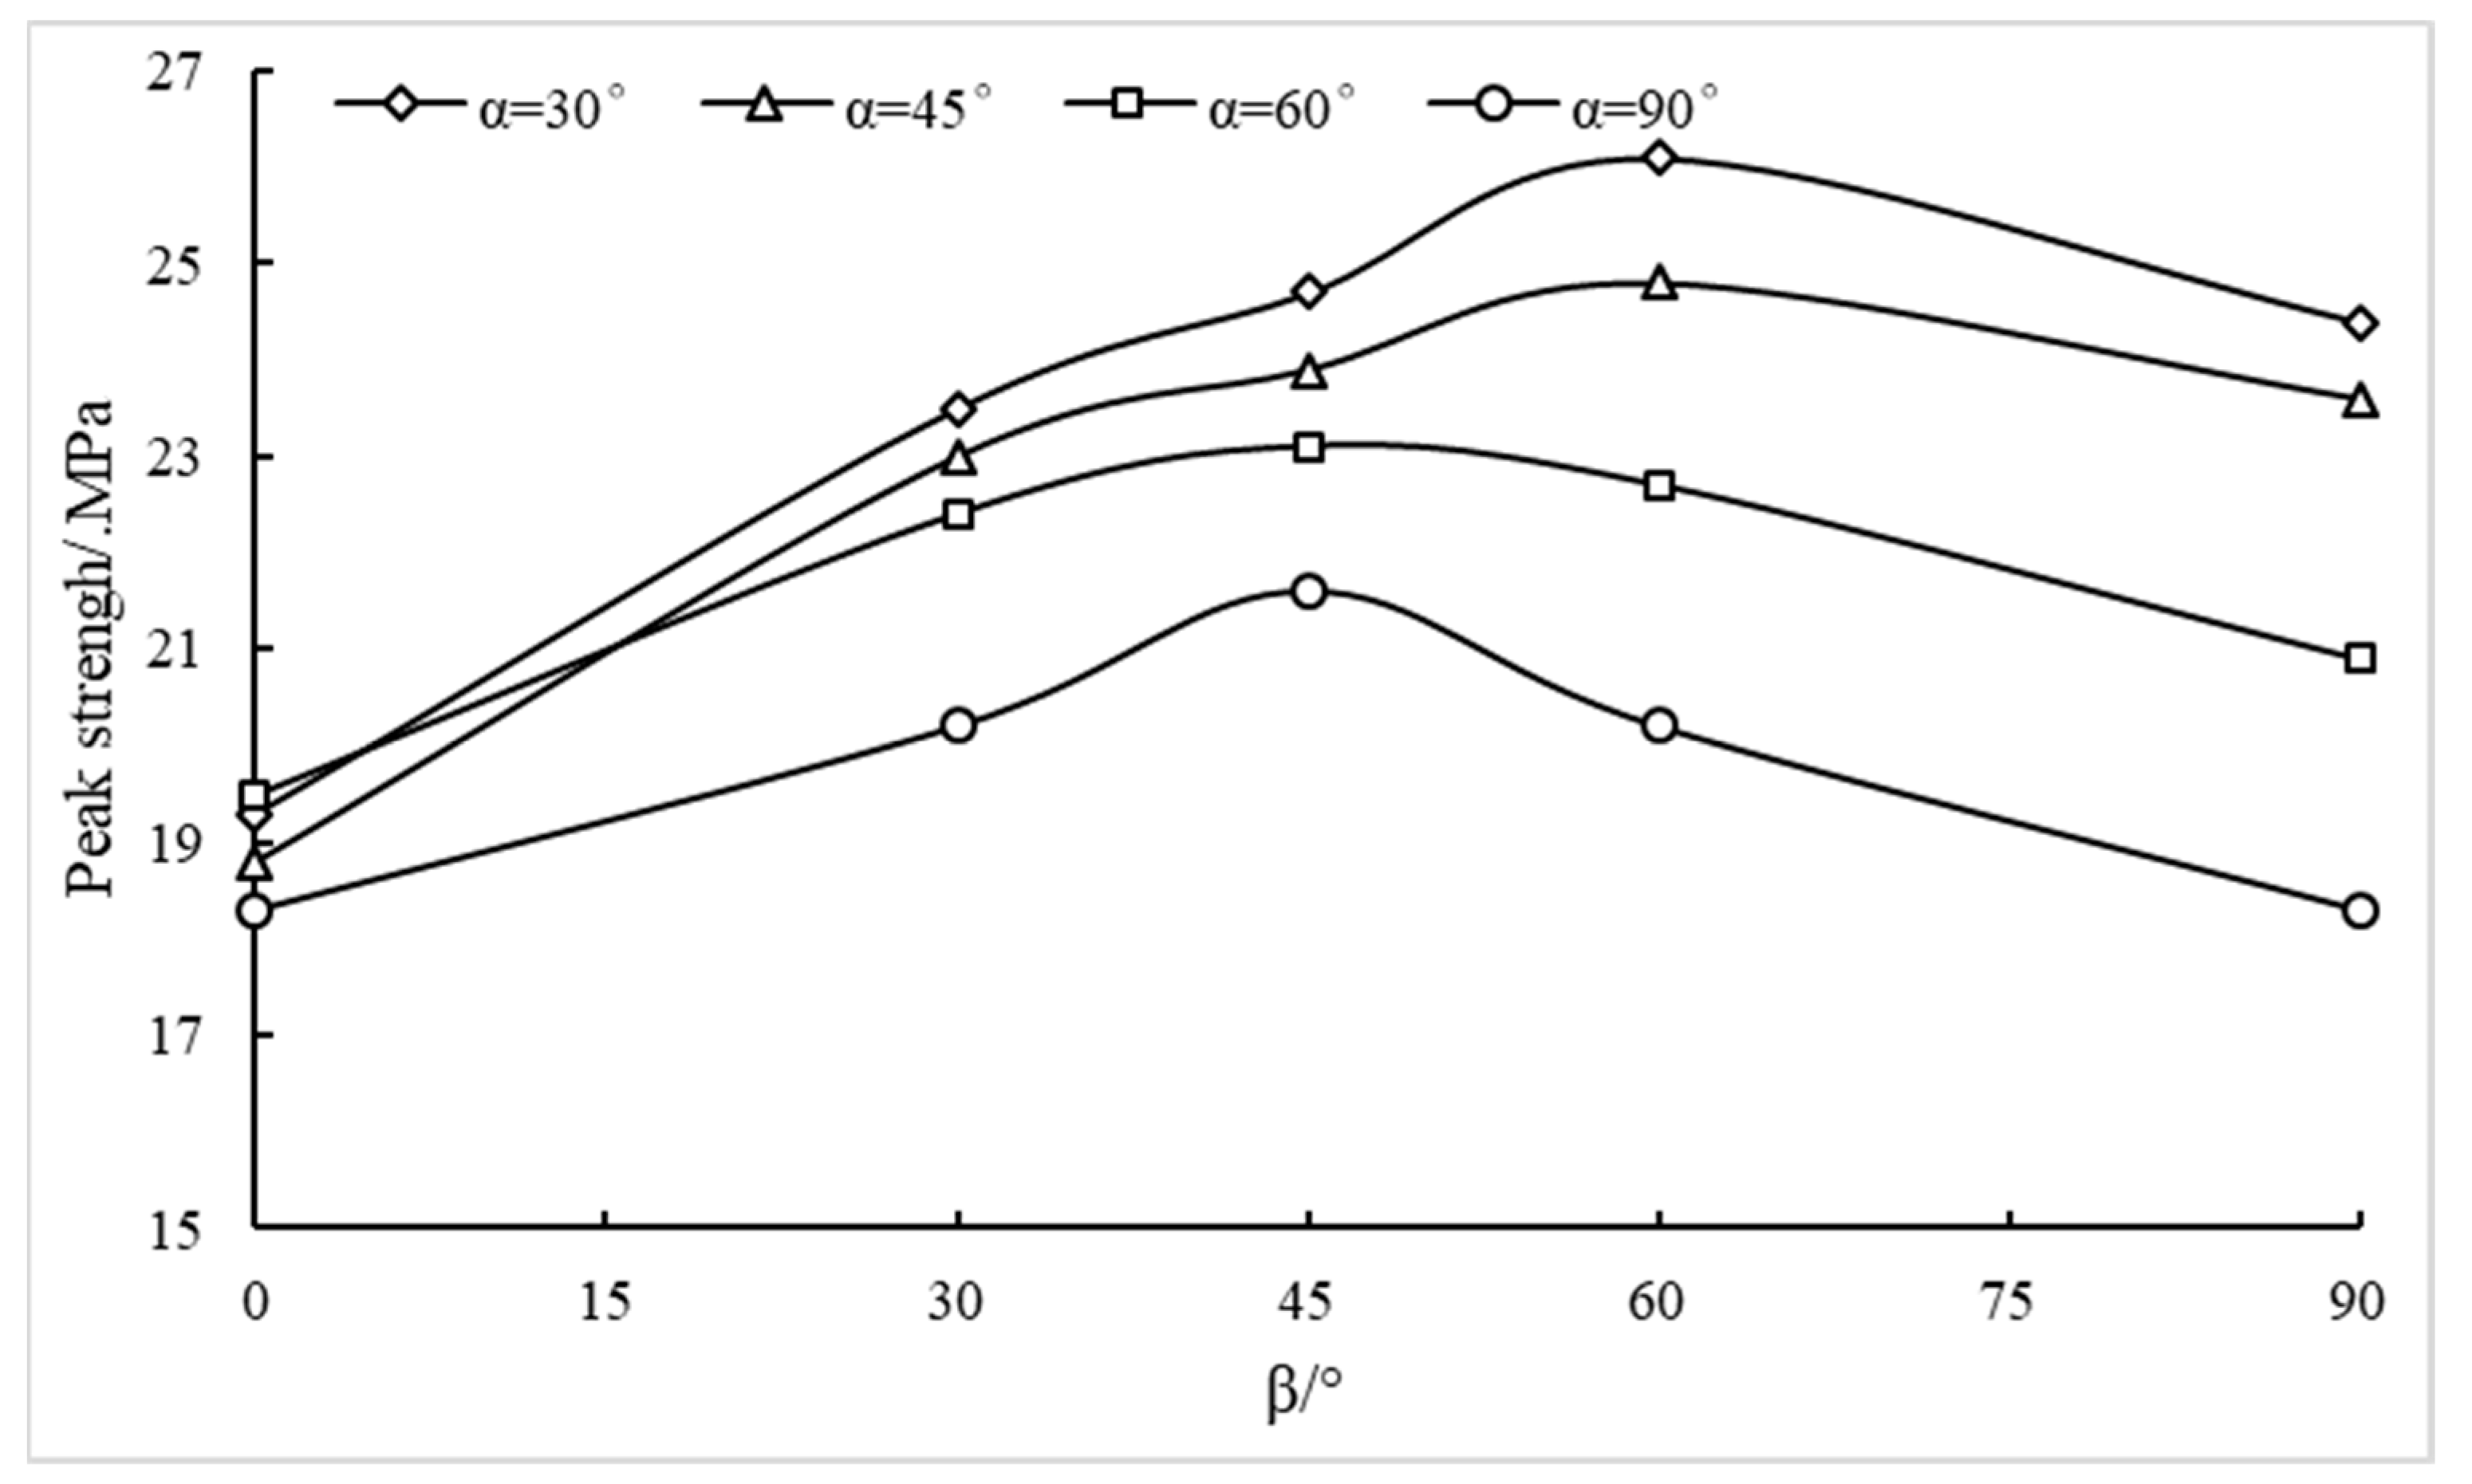
3.2.1. Effect of the Flaw Geometries on Peak Strength

The influence of flaw geometry was investigated in regards to the strength of the sandstone samples, gypsum, and marble containing single crack, parallel cracks, or non-parallel cracks in uniaxial loading [20,21,44,45]. Their results revealed that flaw geometry has a key effect on the strength. Thus, variations of peak strength against β for different values of α are shown in Figure 5.
From Figure 5, the following general trends can be deduced:
(1)
For low values of α (below app. 50°), the peak strength first increases up to about β = 60° and then decreases.
(2)
For higher values of α (above app. 50°), the peak strength first increased up to about β = 45° and then decreased.
(3)
For the values of β (above app. 15°), the peak strength decreased with increasing α.
To explain this, the peak strengths of the model containing single crack against β for different initial angles are shown in Figure 6.
The overall strength of a rock mass containing two sets of discontinues is given by the lowest strength envelope in the individual strength curves, according to Bray’s suggestion [46]. It is clear from Figure 6 that the strength curves of the model containing intersect cracks had a similar trend with the lowest strength envelope in the individual strength curves. For example, the lowest strength envelope in the individual strength curves ① ⑤ show the strength of the model containing two intersect cracks (α = 90°); the peak strength first increases up to about β = 45° and then decreases with the increase of the inclination angle. It is worth noting that the lowest strength envelope in the individual strength curves ① ④ are a little bit different (when β = 60°) from the trend of α = 60° in Figure 5. One plausible explanation is that it was due to the two cracks effecting each other. Another plausible explanation is that it was due to a random distribution of particle sizes.

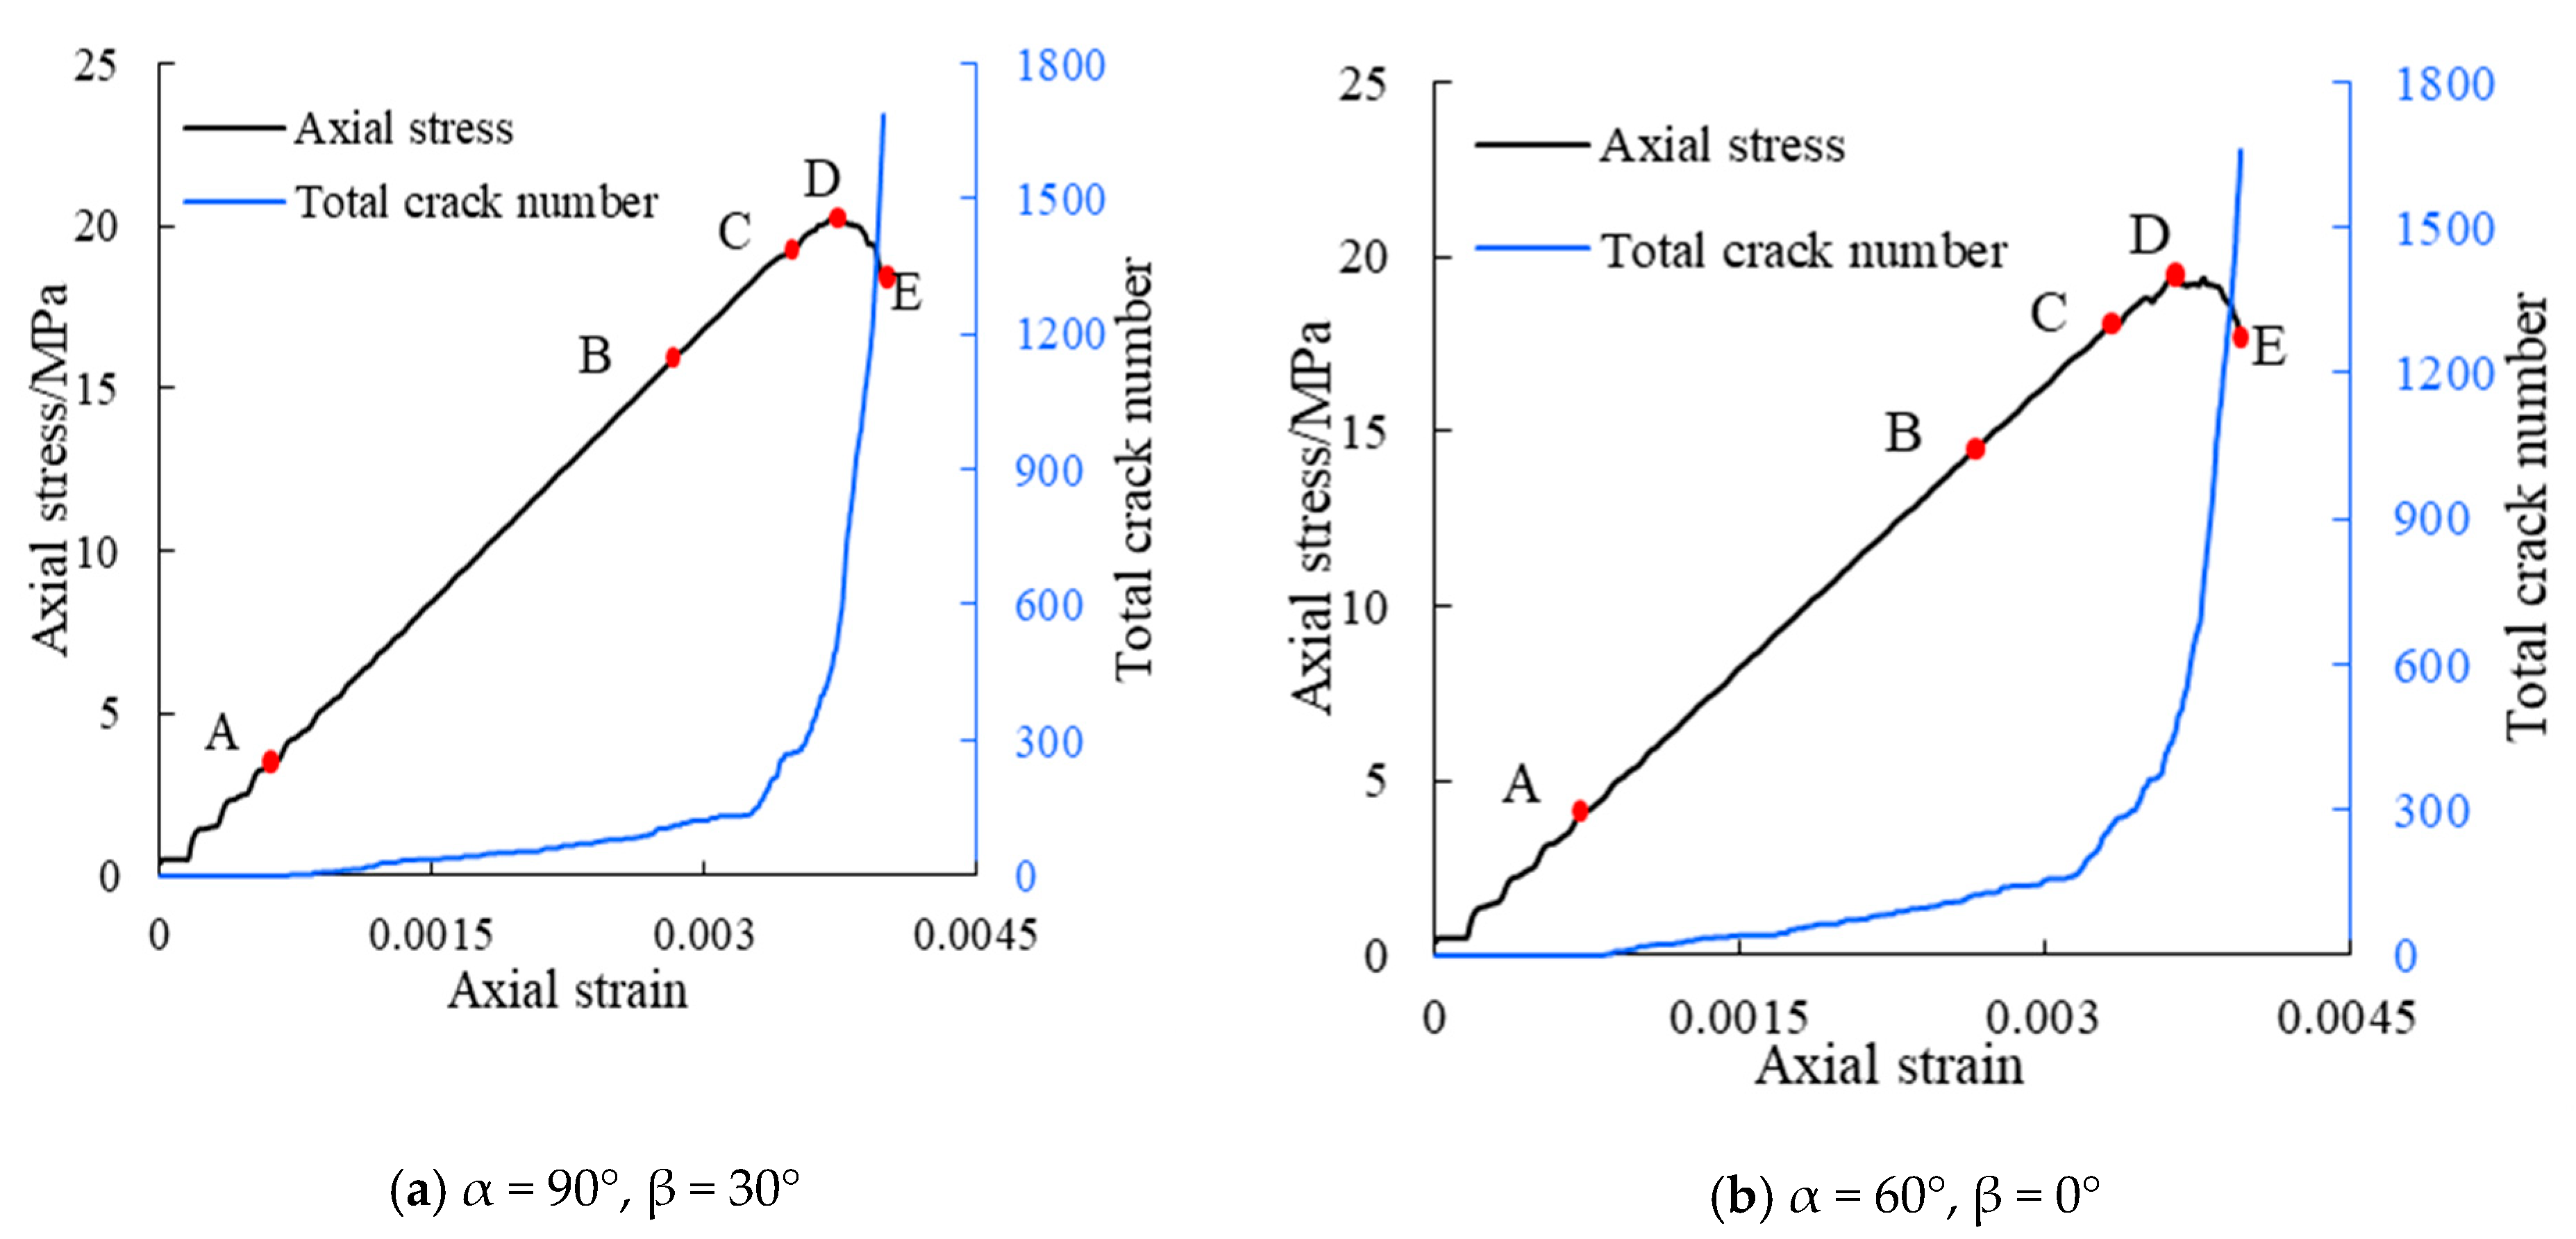
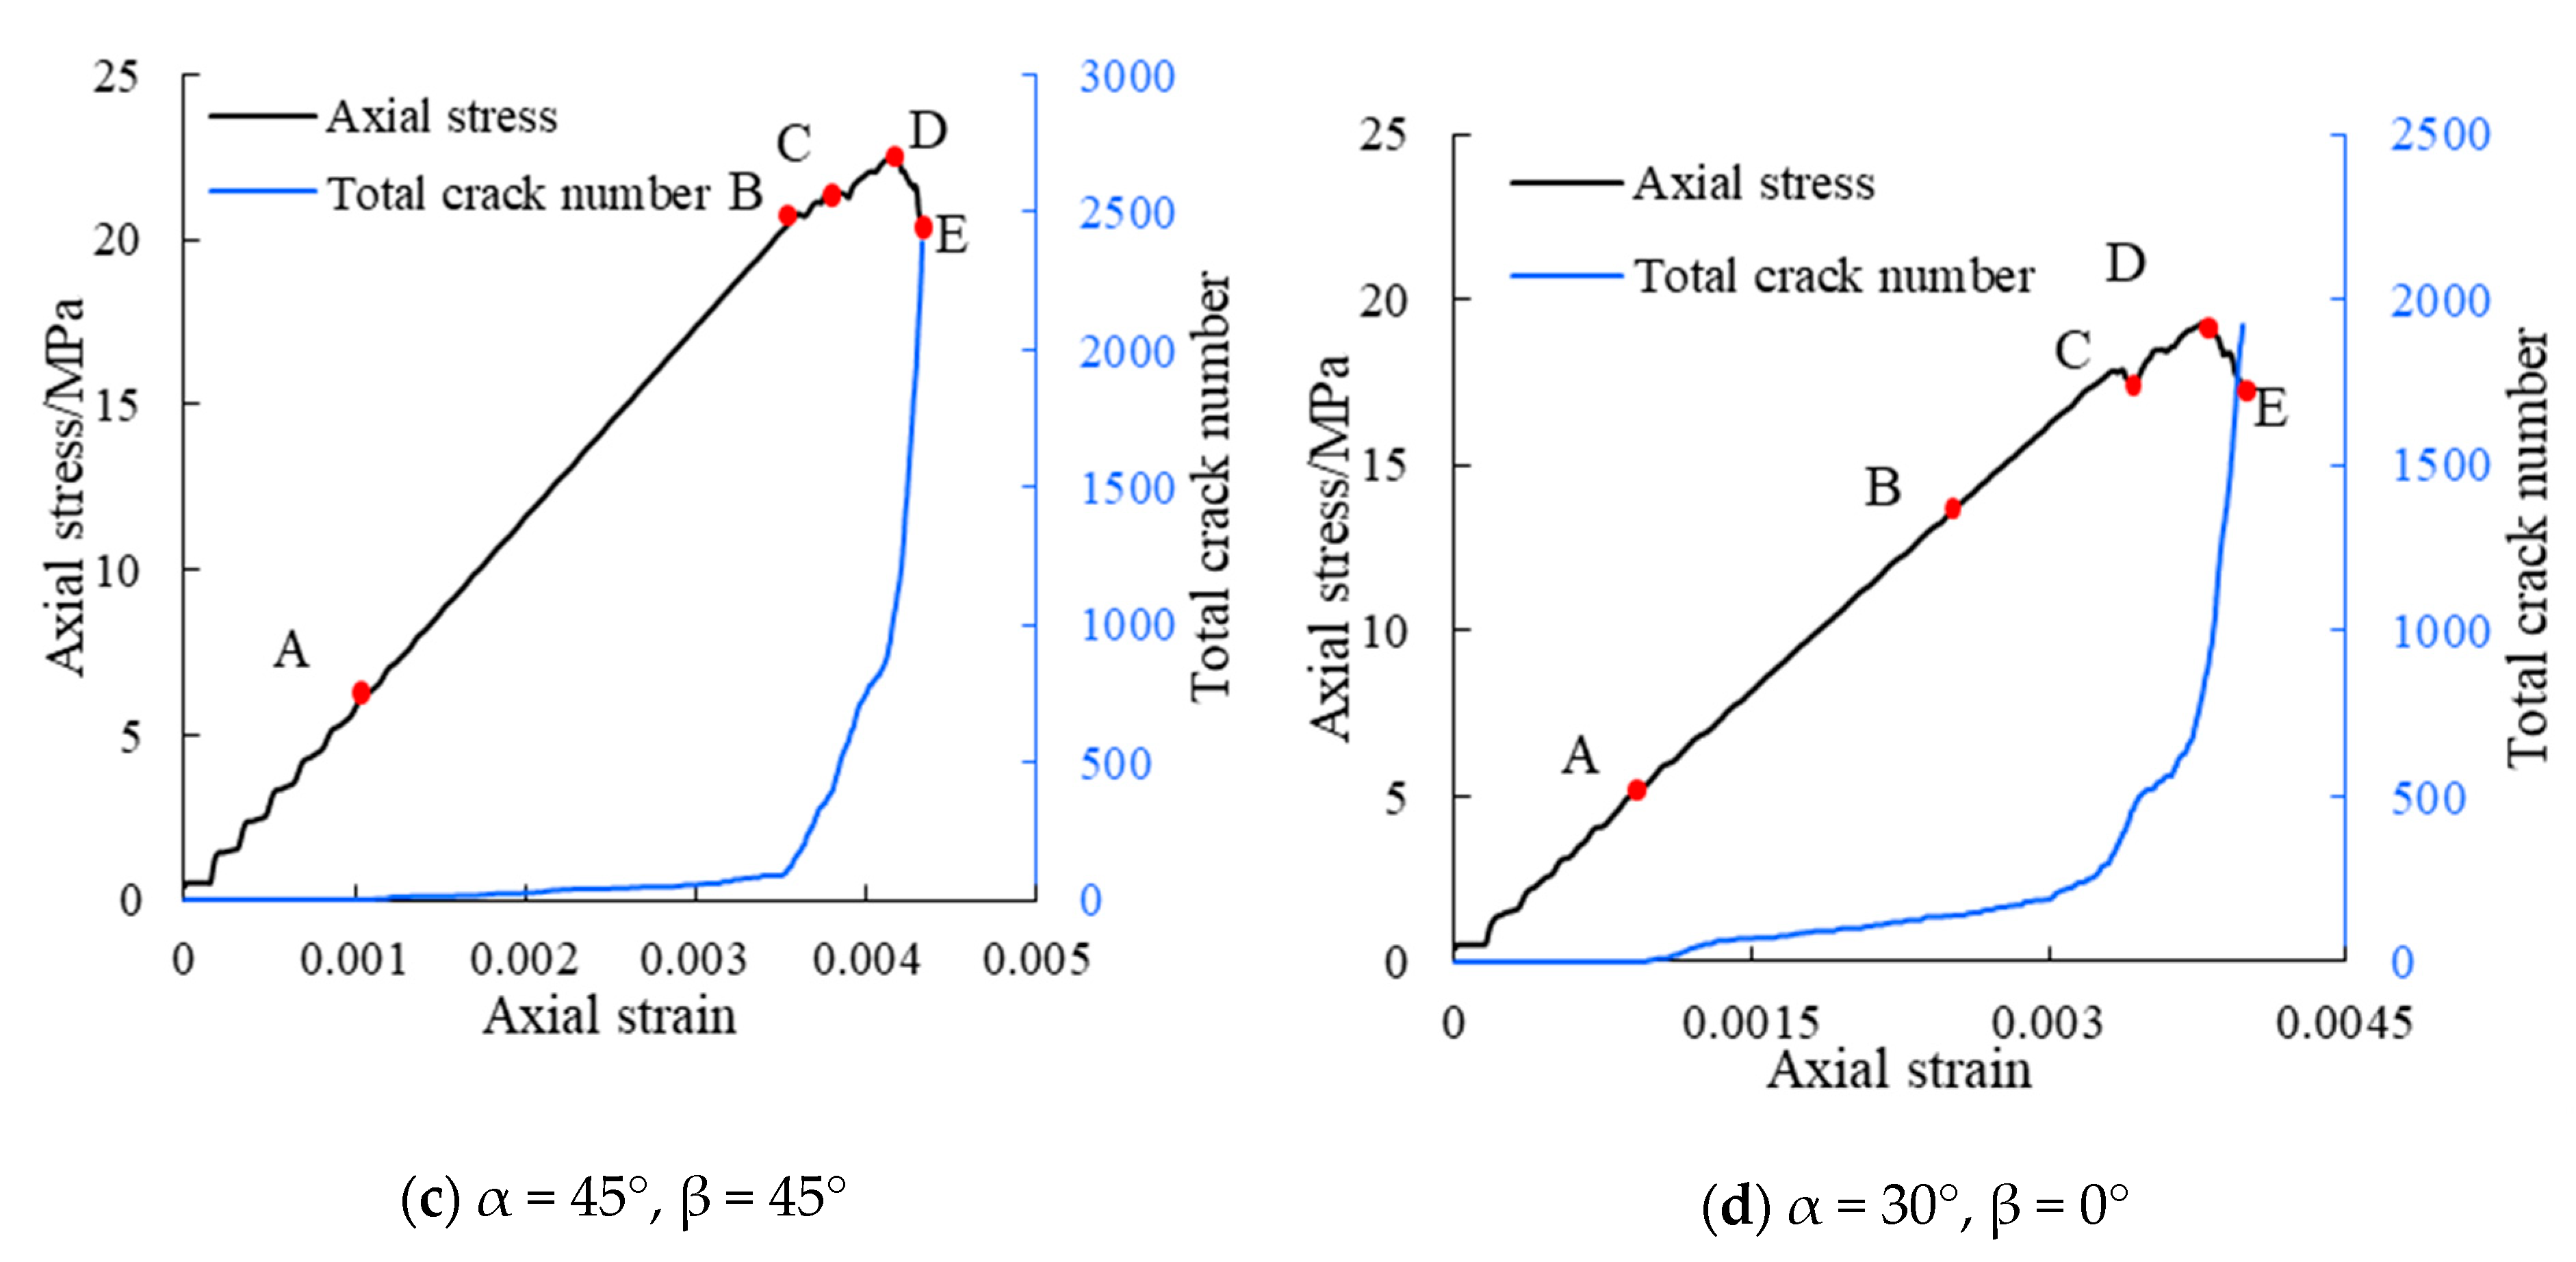
3.2.2. Crack Initiation and Coalescence Behavior

The crack evolution of models containing two intersecting flaws (α = 90°, 60°, 45°, and 30°) is shown in Table 3. Five stages corresponded to five points on the stress–strain curve in Figure 8: Document crack initiation, propagation, coalescence, as well as crack type at peak stress or post-peak stress level. To shorten and avoid repetition, only selected constellations of α and β are documented in detail.
For flaw geometry with α = 90° and β = 30°, macroscopic wing cracks initiate from the tips of the A flaw. With an increasing load, the wing cracks extend, and macroscopic tensile cracks appear in the tip area of the B flaw as secondary cracks. When axial stress reaches 18.8 MPa, the first coalescence is achieved in bridge zone II by the extension of the secondary crack starting from the right tip of the B flaw. During a further load increase up to the peak strength, a downward extension of the macroscopic tensile crack, starting from the left tip of the B flaw, reaches the left tip of the A flaw, and the second coalescence occurs in bridge zone IV. The test specimen is broken by the development of cracks during the post-peak stress stage. The coalescence cracks in the bridge region become progressively wider during the cracking processes.
For flaw geometry with α = 60° and β = 0°, and when axial stress has reached 4.8 MPa, macroscopic wing cracks start to propagate from the tips of the A flaw. With a further load increase, the wing cracks extend and some microscopic cracks appear in the tip area of the B flaw (secondary cracks). At 18 MPa vertical stress, the first coalescence is achieved in bridge zone III by the extension of the secondary crack initiated from the right tip of the B flaw. At peak stress of 19.5 MPa, coalescence cracks become wider and some new microscopic tensile and shear cracks propagate downwards or upwards from the tips of the B flaw. Beyond peak stress, some secondary cracks extend quickly towards the edge of the model, and finally the model fails.
For flaw geometry with α = 45° and β = 45°, macroscopic tensile cracks start from the tips of the A flaw. With an increasing load, wing cracks extend and some microscopic tensile cracks are initiated at the tips of the B flaw. With a further stress increase, secondary tensile and shear cracks propagate towards the wing crack initiated at the top tip of the A flaw. At 21.1 MPa, the first coalescence occurs in bridge zone I. At peak stress of 23.9 MPa, the secondary cracks propagate further upwards from the right tip of the B flaw towards the top tip of the A flaw. Secondary coalescence occurs in bridge zone II. Additional cracks are induced close to the B flaw tip regions in the post-peak stage.
For flaw geometry with α = 30° and β = 0°, at 5.4 MPa, a macroscopic wing crack starts to propagate from the tips of the A flaw. Further load increases lead to the initiation of micro tensile cracks at the right tip of the B flaw. When the axial stress increases further up to 17.6 MPa, the first coalescence is achieved in bridge zone III by the extension of a secondary crack initiated from the right tip of the B flaw. At peak strength, coalescence occurs in bridge zone I. Meanwhile, some mixed mode tensile–shear cracks appear and extend downwards near the right tips of the A and B flaws. In the post-peak region at a stress of 17.4 MPa, some secondary cracks become wider and extend to the edge of the model and the model fails.

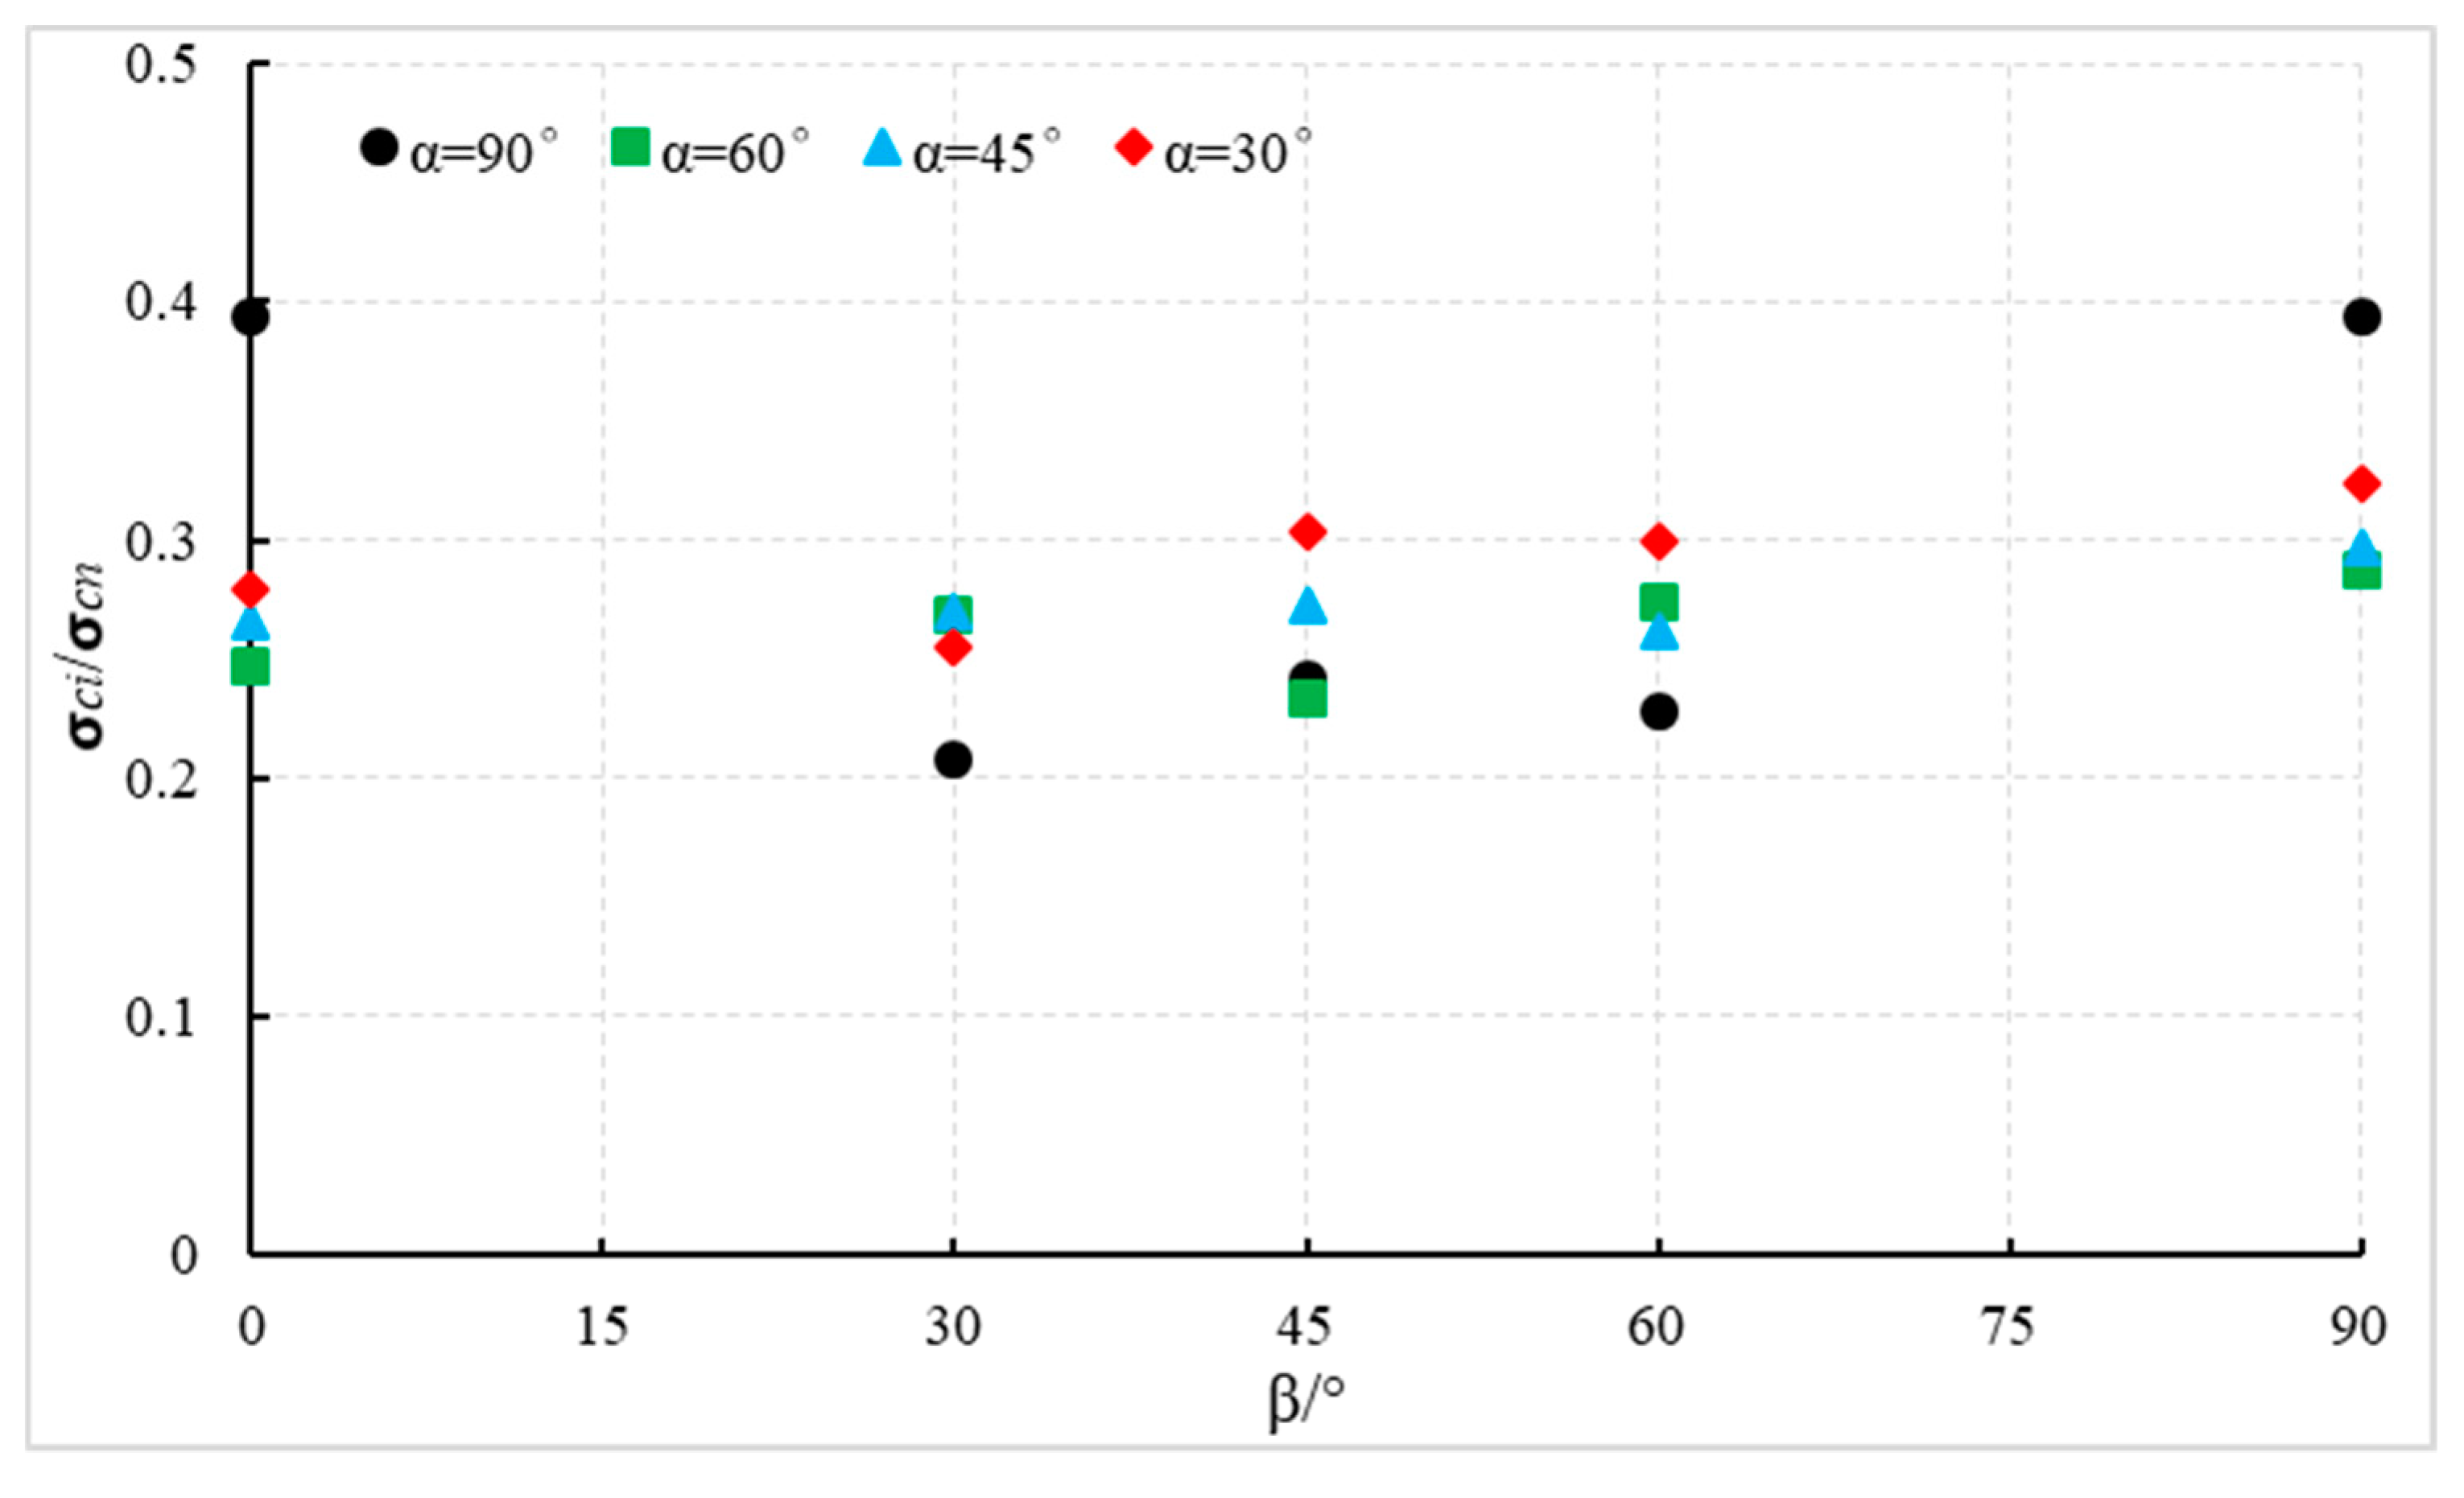
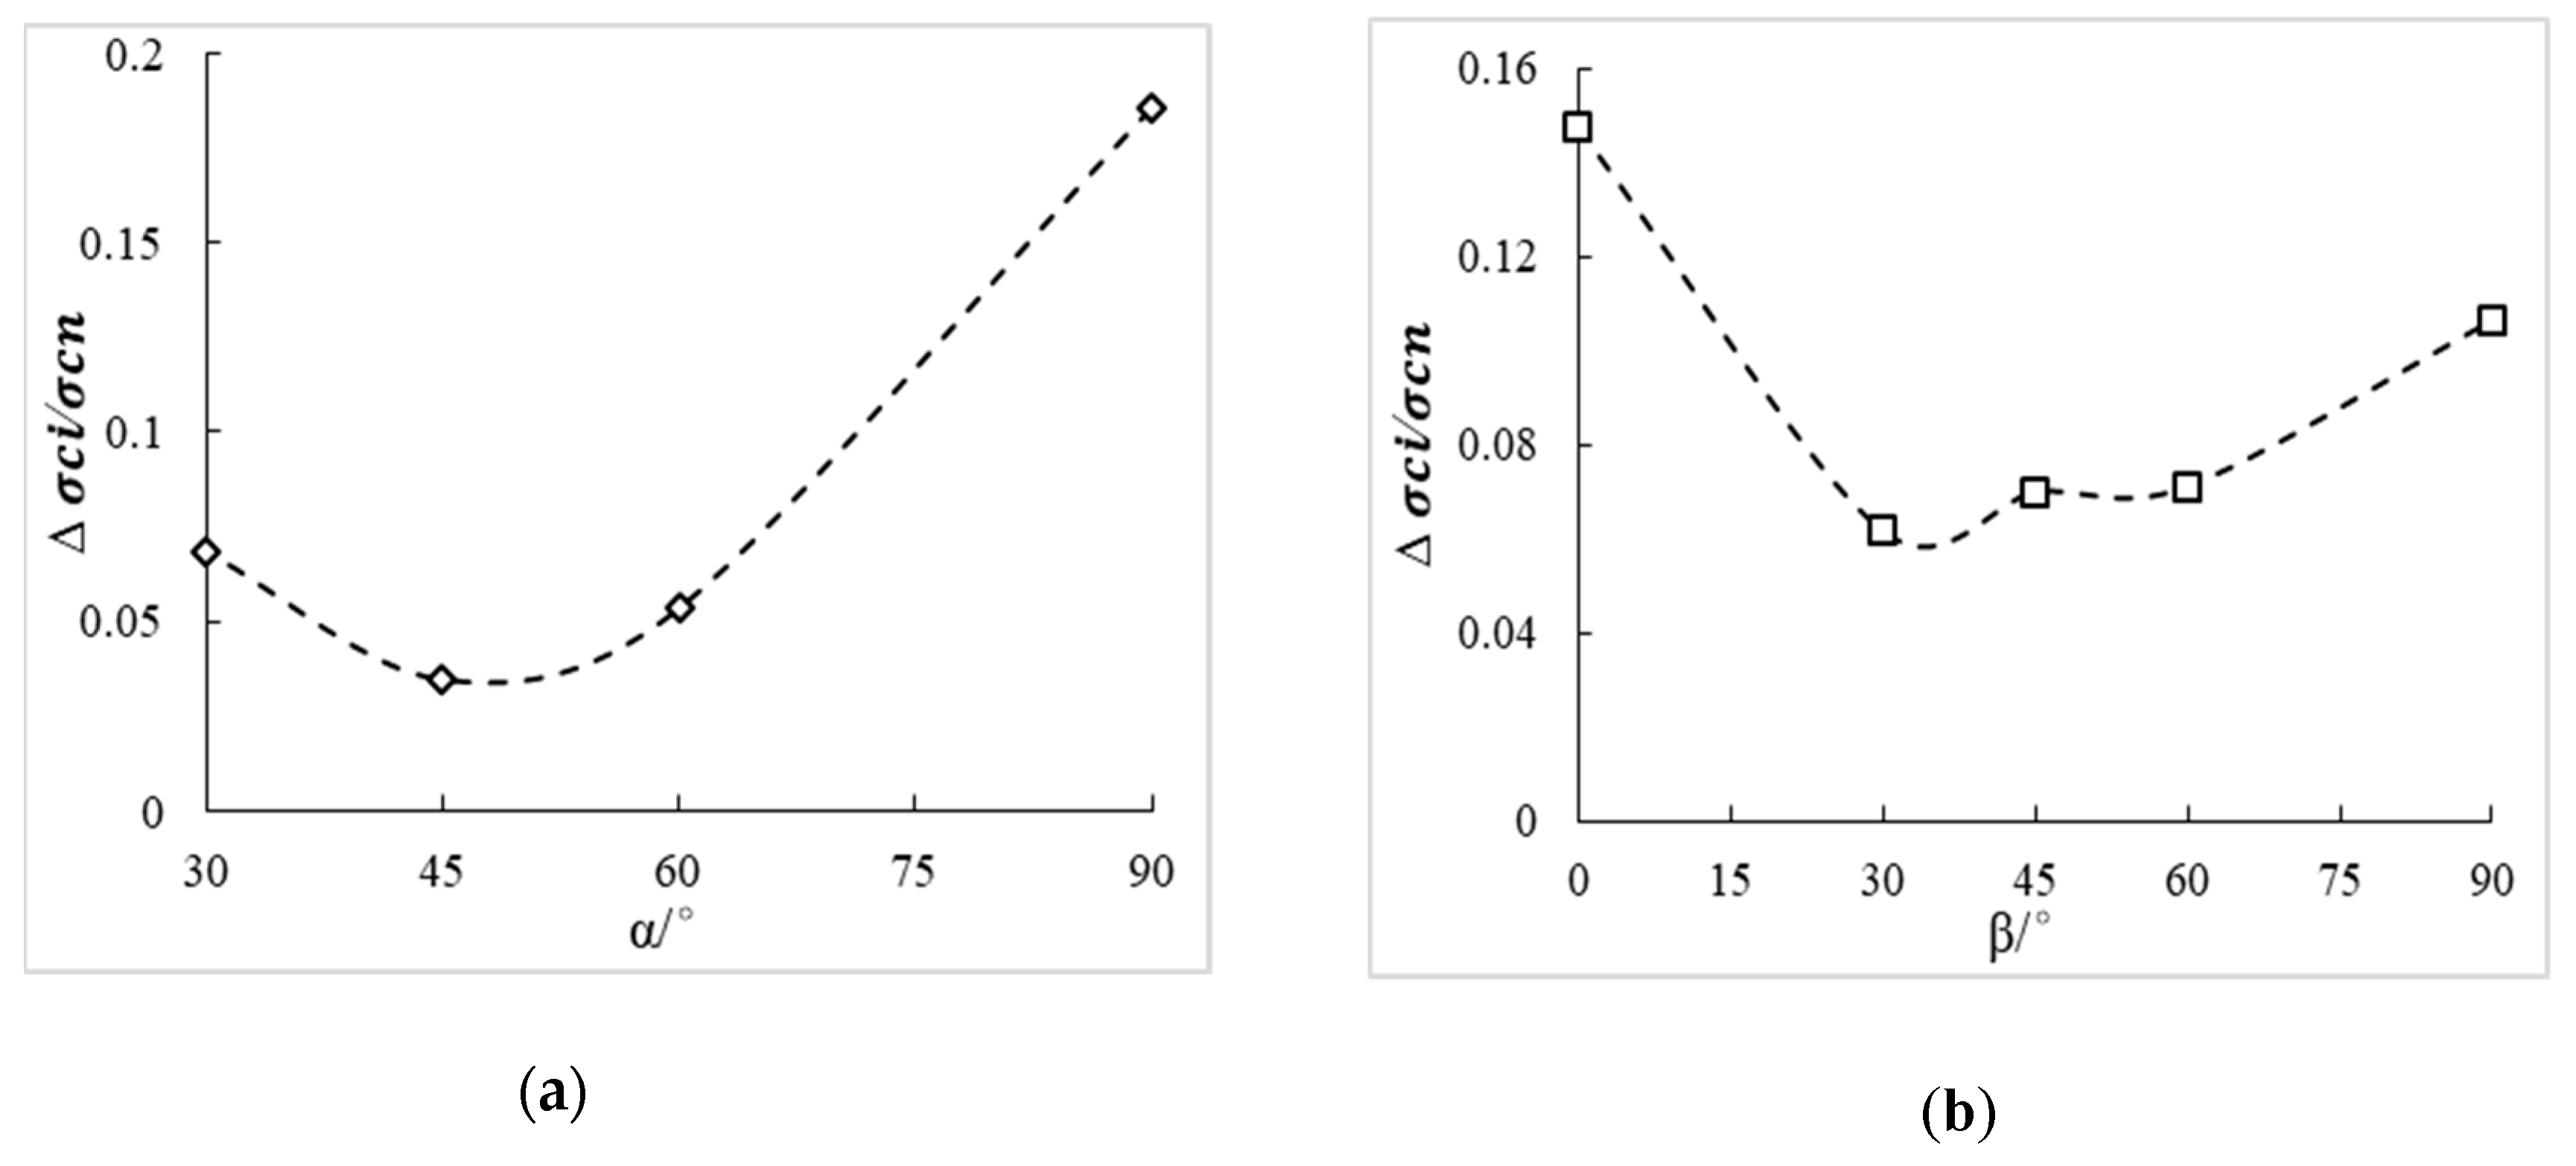
3.3. Crack Initiation Stress

In the numerical studies performed by Zhang et al., wing cracks start to propagate simultaneously at the tips of the flaws. However, in this study, the macro-cracks initiated at the tips of the two intersecting flaws do not occur simultaneously. Therefore, the stress state when a macro-crack starts to develop from either the A flaw or B flaw is called crack initiation (CI) stress.
Specimens with different flaw geometries have different peak strengths; therefore, CI stress cannot be compared directly. Thus, the CI stress σ c i is normalized by the respective peak strength σ c n (see Figure 9). From Figure 9, the following general trends can be deduced:
  • The ration σ c i / σ c n varies between 0.2 and 0.4.
  • For the same values of α, the minimum values of σ c i / σ c n are observed at β = 30°, which means that the first crack initiates more easily (except α = 60°, β = 45°). For four cases of β = 90° and one case of β = 0°, α = 90° is the maximum value of σ c i / σ c n observed.
To better understand the effect of α and β in the ratio σ c i / σ c n , the differences (∆ σ c i / σ c n ) between the maximum and minimum values of σ c i / σ c n are calculated, as shown in Figure 9. From Figure 10a, the difference of σ c i / σ c n is first decreased down to α = 45° and then increased with the increase of α, which indicates that the inclination angle β had less effect on the ration σ c i / σ c n when α = 45°.
From Figure 10b, it can be deduced that the difference of σ c i / σ c n also decreases down to β = 30° and then increases with the increase of β, which indicates that the intersection angle α had less of an effect on the ration σ c i / σ c n when β = 30°.

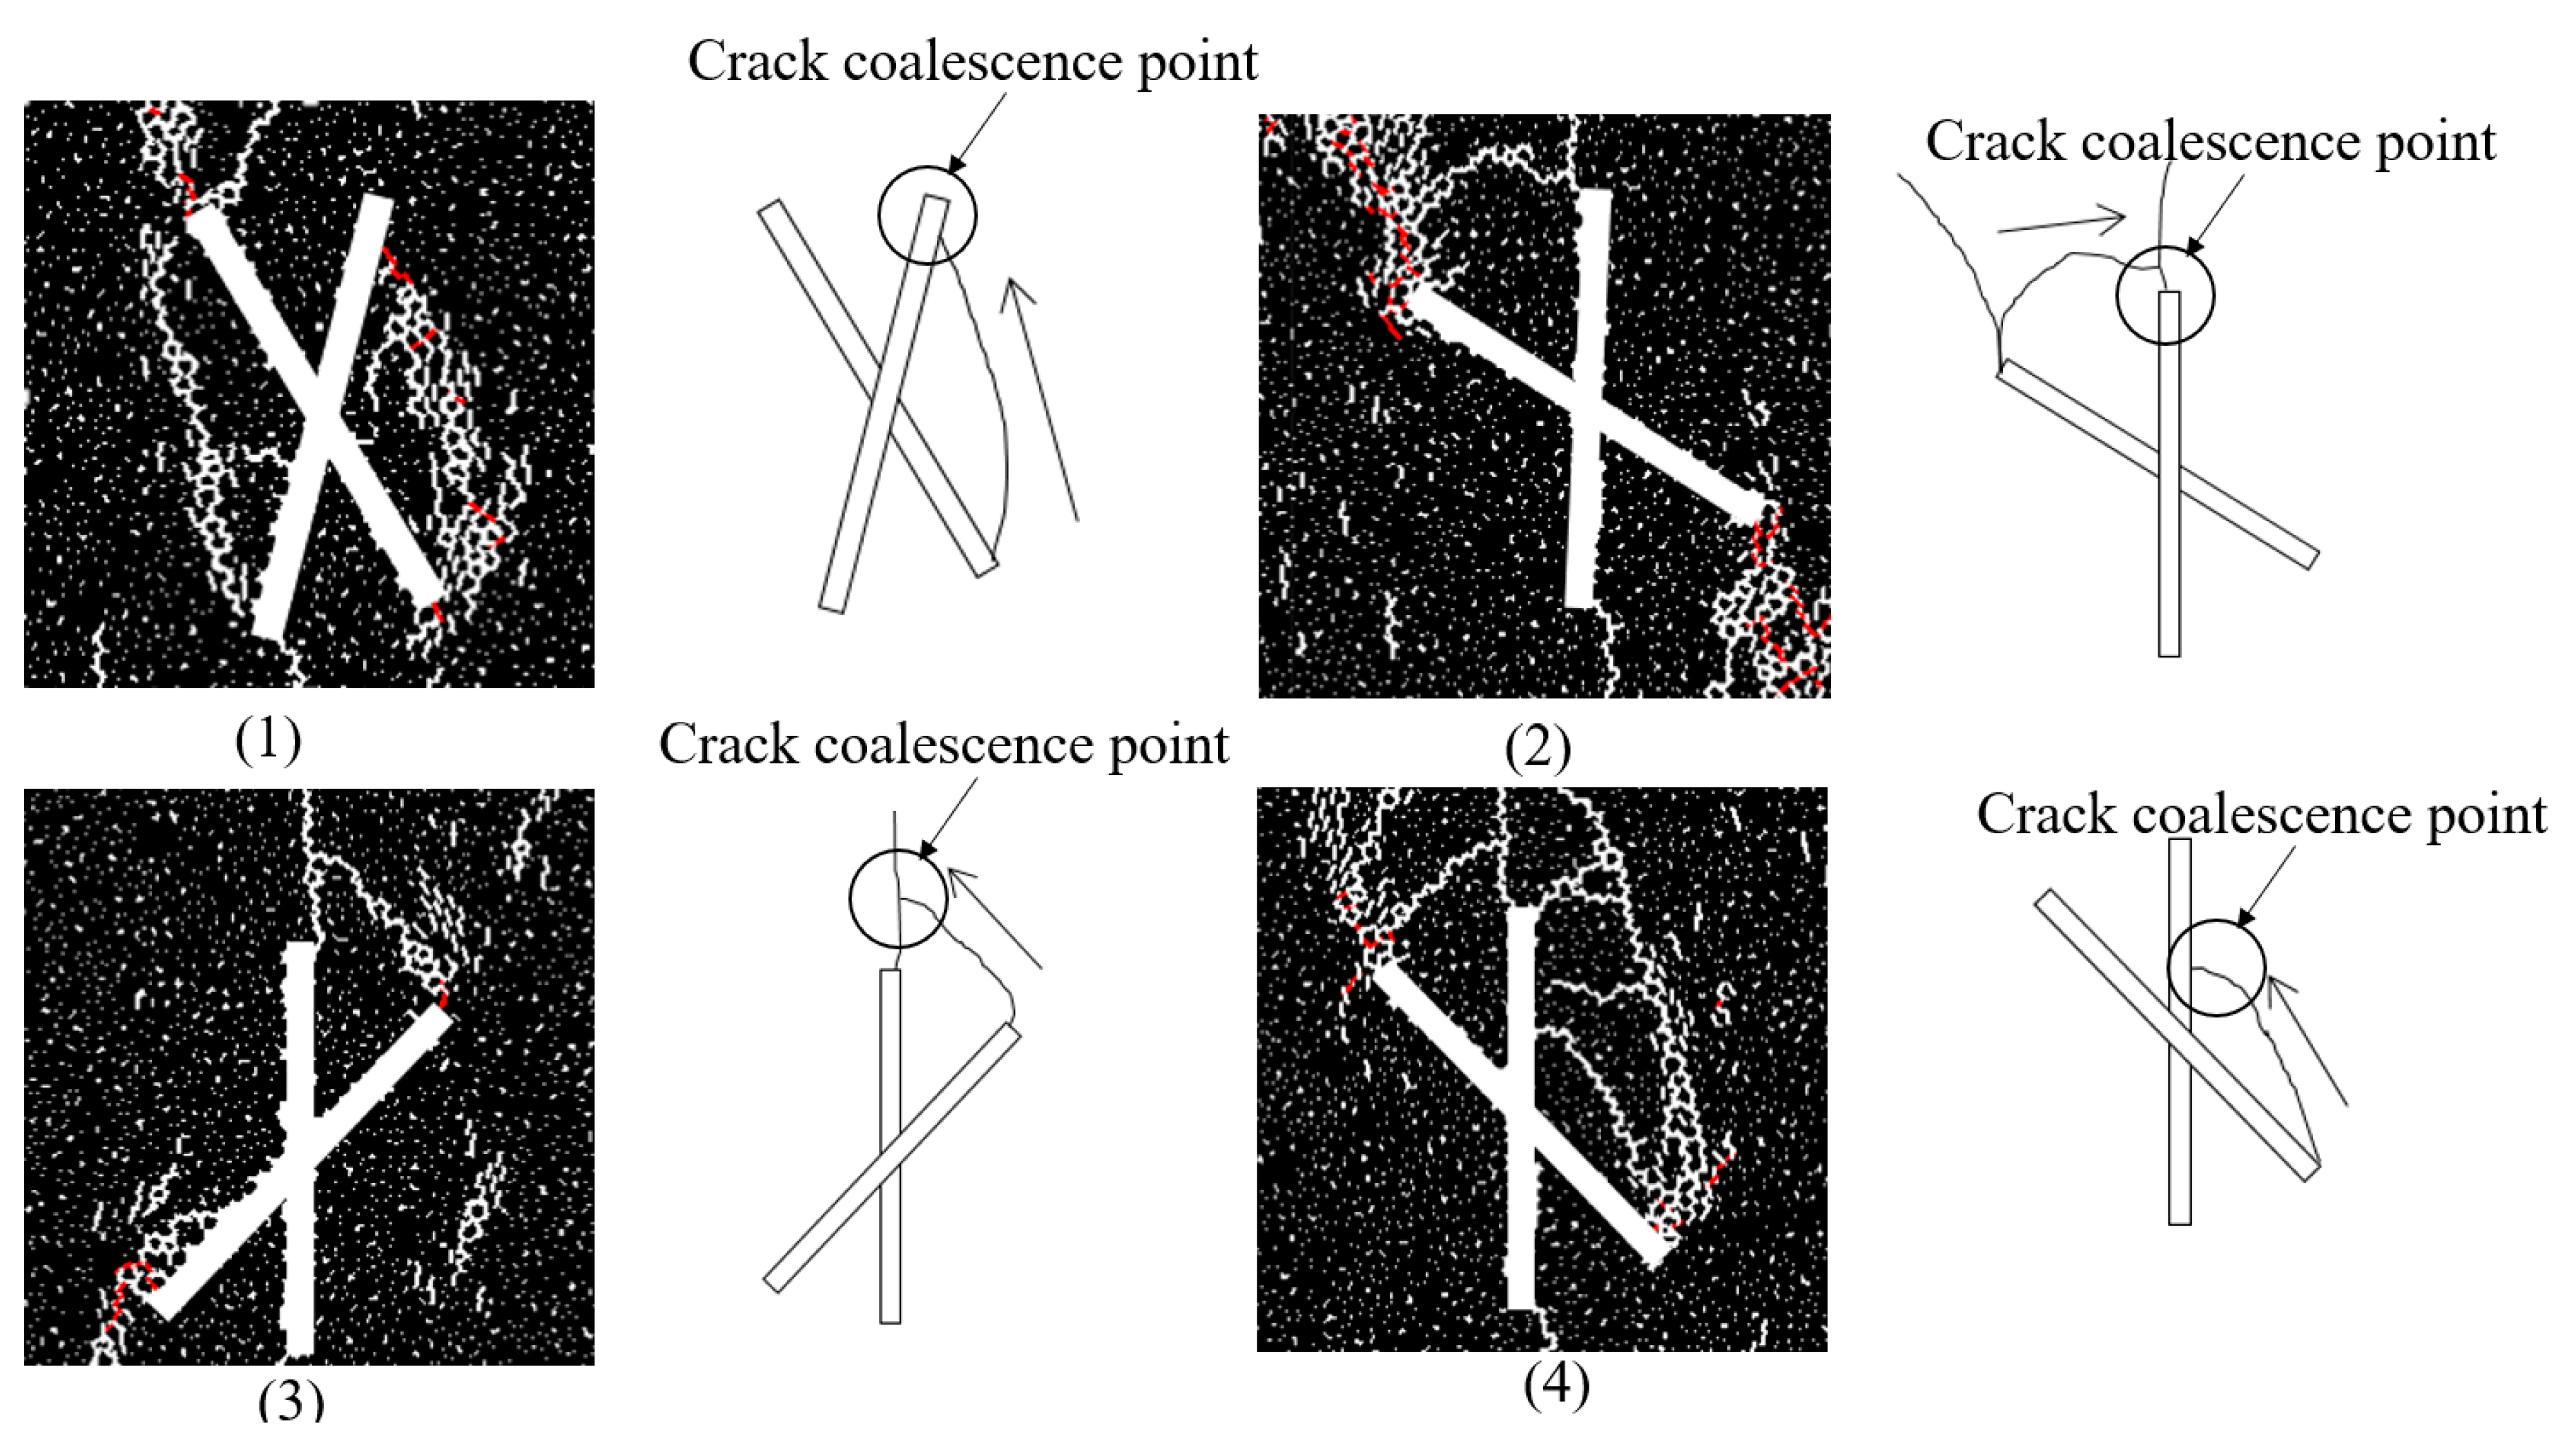
3.4. Crack Coalescence

Many crack coalescence types have been observed in physical experiments [1,21,26] and have been classified as seven different crack coalescence types, based on their geometry and propagation mechanism using a high-speed camera. Zhang [40] classified five types of linkages observed between two non-parallel flaws using parallel bonded-particle models. However, these crack coalescence types are based on the coalescence between two parallel or non-parallel flaws. Our study reveals that two intersect flaws show different coalescence behavior. Table 4 shows the crack coalescence patterns for two intersecting flaws with different values for α and β.
The different crack coalescence patterns observed in the case of two intersecting flaws with different geometries are shown in Figure 11 and are summarized in Table 5. Two typical patterns can be distinguished:
  • A macroscopic tensile crack initiated from the tip of one of the flaws extends upwards or downwards to the other flaw but does not reach the tip and some microscopic shear or mixed tensile-shear cracks participate at coalescence. This is classified as one-tip-linkage. According to the coalescence position, the one-tip-linkage mechanism contains three sub-types: Coalescence position near the tip (Figure 11(1),(2)), coalescence position at the flaw, but far away from the tip (Figure 11(4)), or coalescence position outside the flaw with a certain distance from the tip (Figure 11(3)).
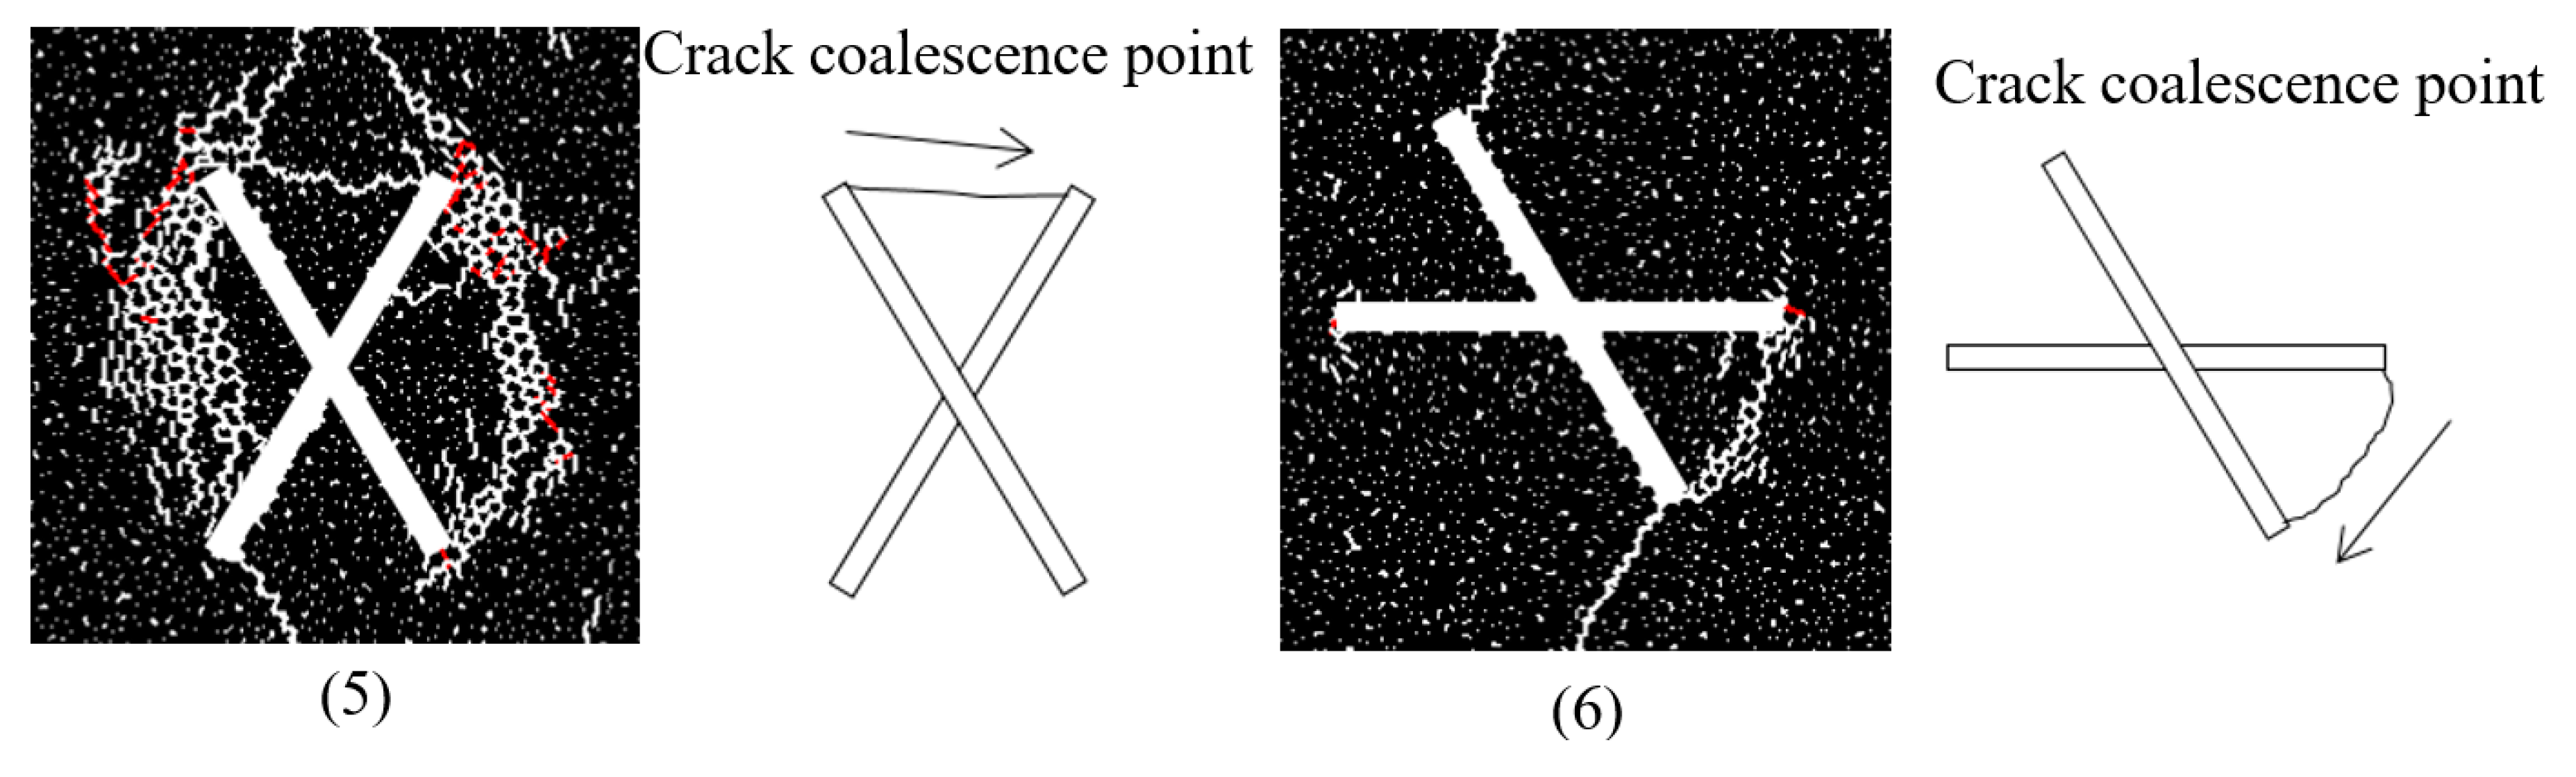
  • A macroscopic tensile crack initiated from the tip of one flaw extends upwards or downwards to the tip of the other flaw. The coalescence occurred by the linkage of tensile cracks and is classified as two-tips-linkage. The two tips linkage has two sub-types: Straight linkage (Figure 11(5)) and arc linkage (Figure 11(6)).

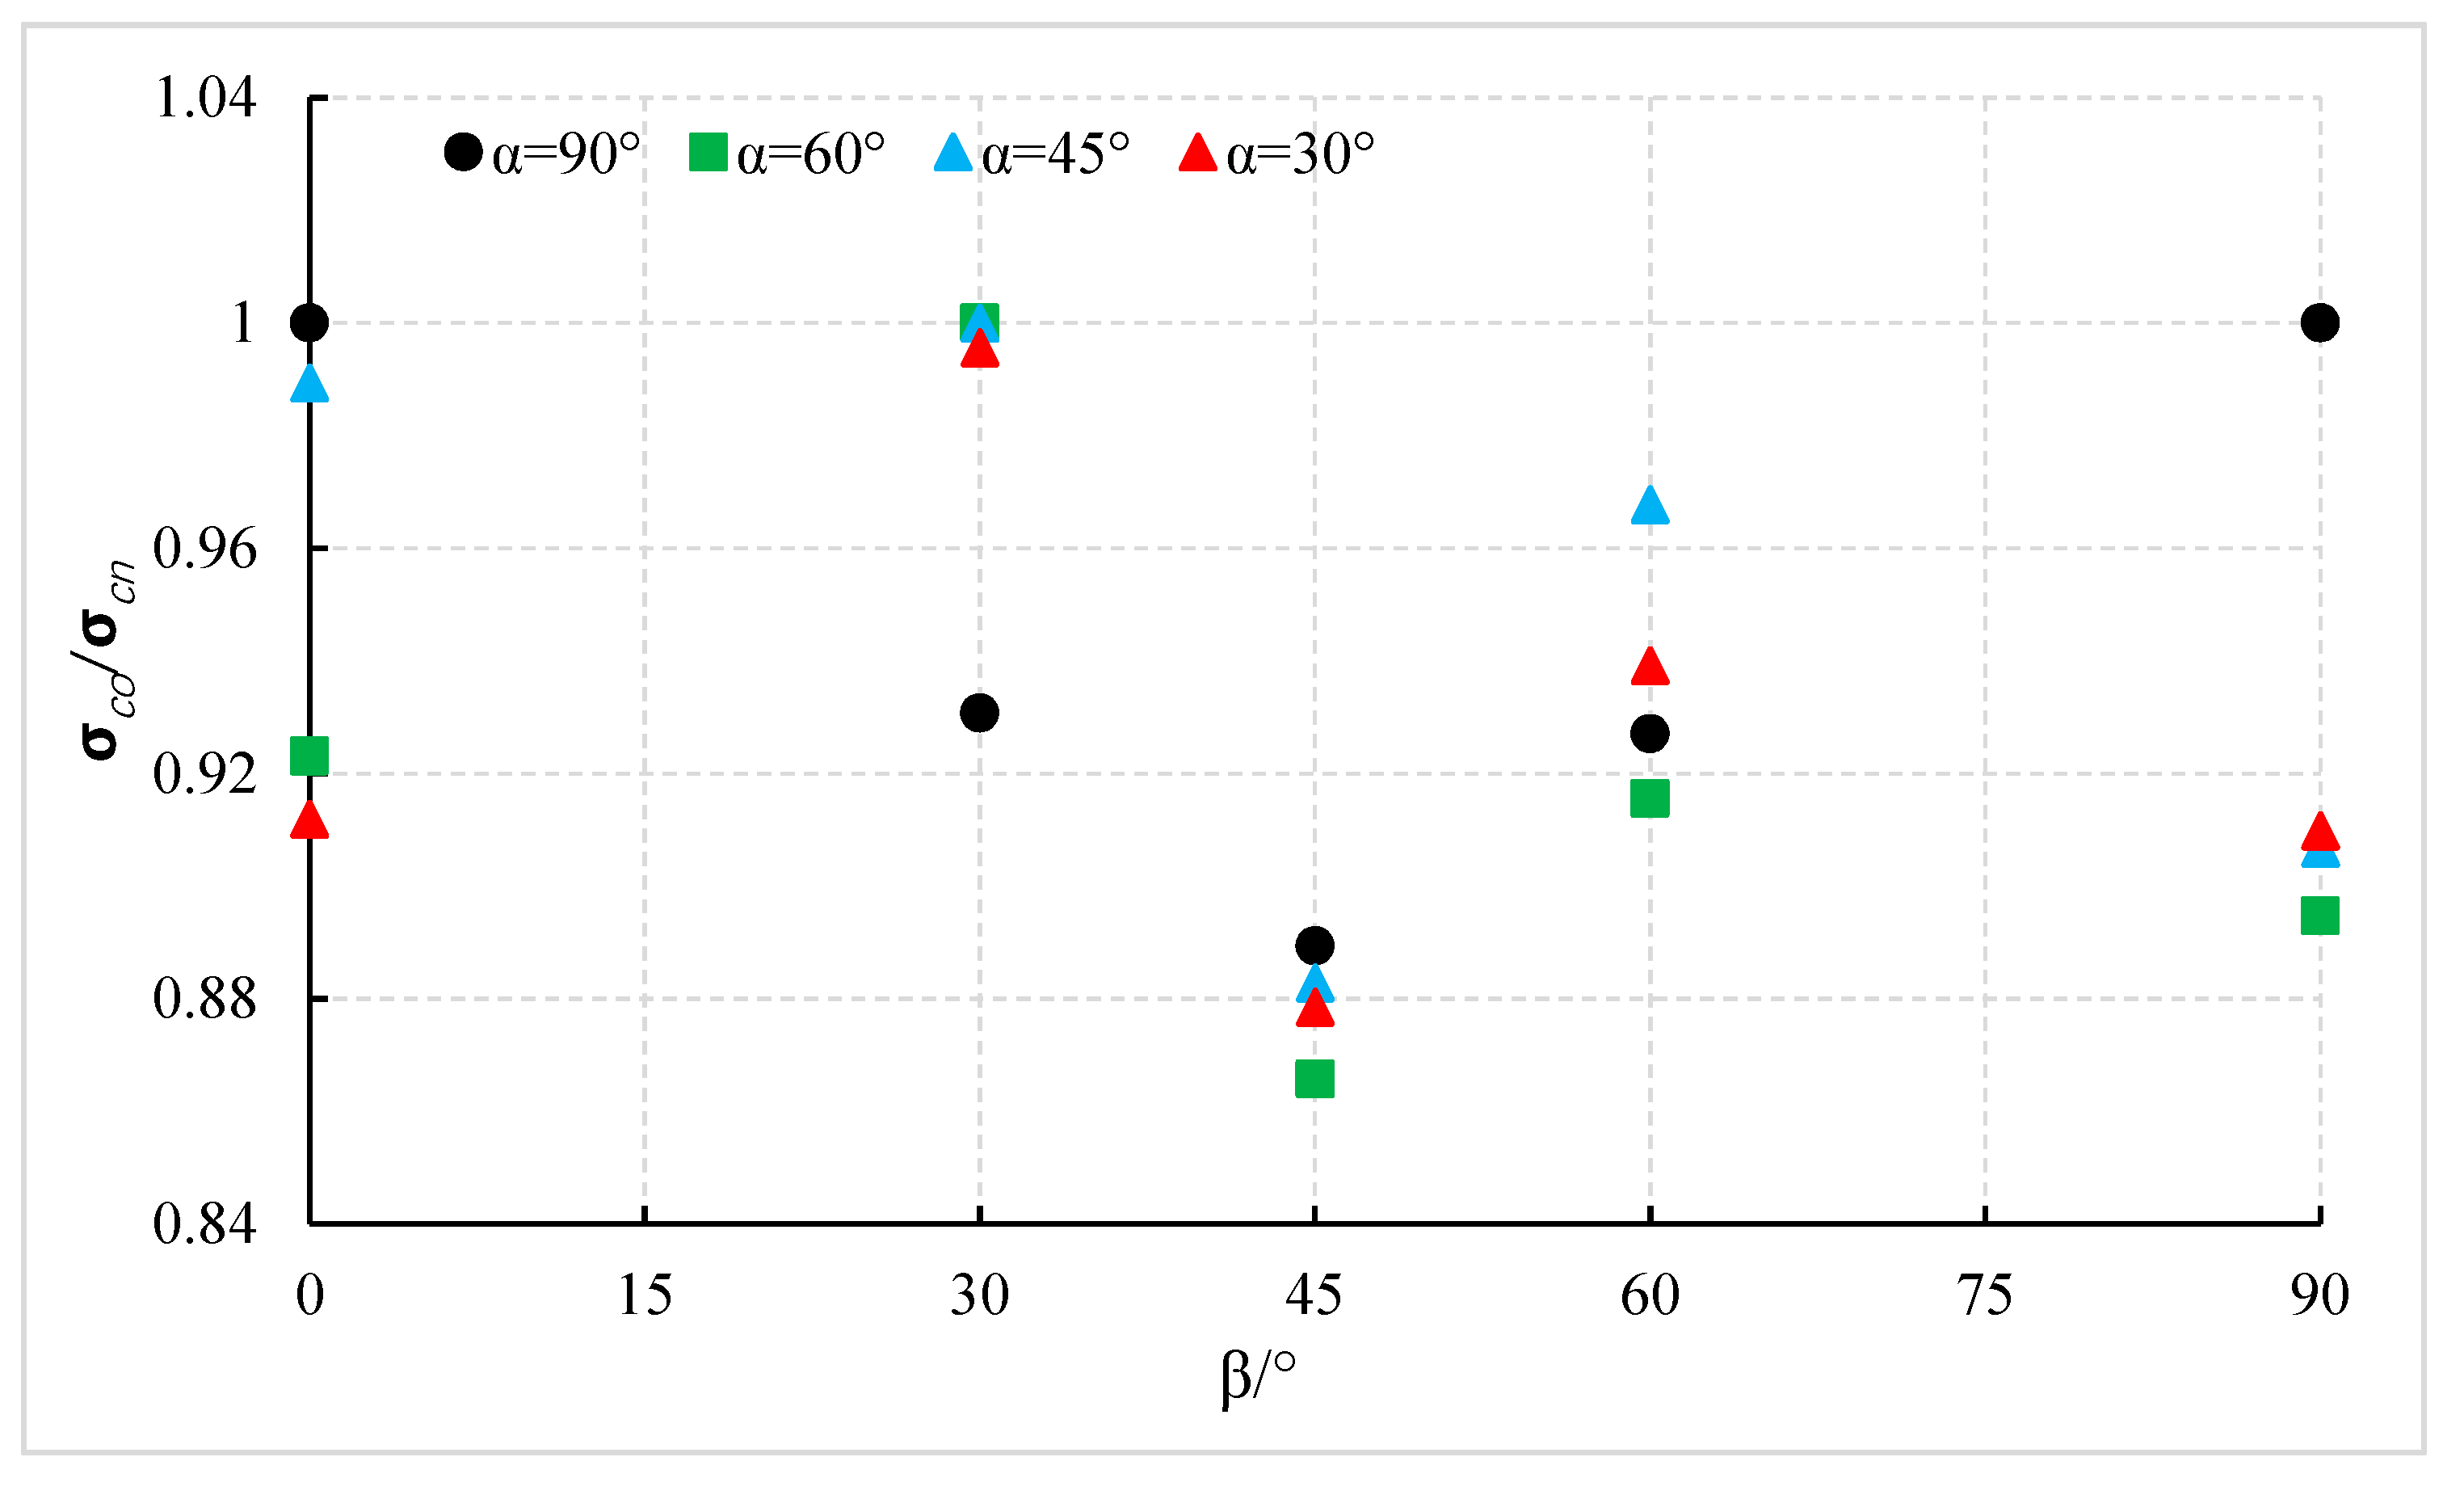
3.5. Crack Coalescence Stress

The coalescence stress σ c o is the vertical stress that is observed when the first coalescence of the two intersecting flaws occurs. The ratio between crack coalescence stress σ c o and peak strength σ c n varies, as shown in Figure 12. The crack coalescence stress reaches 85%–100% of the peak stress.
For two cases of α = 90° and one case of α = 60°, α = 45°, and α = 30°, the ratios of their cases are at or just less than 1.0, which means that their model coalesced near or at the peak stress. In contrast, for four cases of β = 45°, three cases of β = 90°, and one case of β = 0°, the ratios of their cases are significantly less than 1.0, which means that the coalescence occurs more easily. In addition, for any intersection angle α, the minimum values of σ c o / σ c n are observed at β = 45°, which indicates that coalescence occurred more easily with that geometry.

4. Conclusions

Numerical simulations were performed on rock-like specimens containing two intersecting flaws with different inclination angle β and different intersection angle α subjected to uniaxial compressive loads. The main conclusions can be summarized as follows:
  • For any intersection angle α, the strength is increases for flaw inclination angle β, ranging from 0° to about 45°. For intersection angle α up to about 45°, the strength is further slightly increased for inclination angle β, bigger than 45°. For intersection angle α, it is bigger than about 45° and the strength is strongly decreased for inclination angle β, bigger than 45°.
  • The macro-crack initiated from the tips of two intersect flaws that did not occur simultaneously. The crack initial stress σ_ci of the first crack, obtained at the tip of flaw (A flaw or B flaw), normalized by the respective specimen peak strength σ c n , which changed between 0.2 and 0.4 with different flaw geometries.
  • Two major crack coalescence patterns were observed: (a) One-tip-linkage (either near the crack tip, at the flaw but far away from the crack tip or outside the flaw at a certain distance from the tip) and (b) two-tips-linkage (straight or arc linkage). The geometry of flaws governed the coalescence type.
The ratio between coalescence stress σ c o and peak strength σ c n varied between 0.85–1.0, which meant the first coalescence occurred near or at the peak strength. For the same values of α, the minimum values of σ c o / σ c n were observed at β = 45°, which indicated that coalescence occurred more easily with that geometry.

Author Contributions

Conceptualization, B.D.; Methodology, Y.C.; Software, G.Z.; Validation, W.L.; Formal analysis, H.W.; Data curation, Y.C.; Writing—original draft preparation, Y.C.; Writing—review and editing, B.D.; Funding acquisition, B.D.

Funding

This study was financially supported by the national natural science foundation (51804163).

Conflicts of Interest

The authors declare no conflict of interest.

References

  1. Bobet, A.; Einstein, H.H. Fracture coalescence in rock-type materials under uniaxial and biaxial compression. Int. J. Rock Mech. Min. Sci. 1998, 35, 863–888. [Google Scholar] [CrossRef]
  2. Peng, K.; Zhou, J.; Zou, Q.; Yan, F. Deformation characteristics of sandstones during cyclic loading and unloading with varying lower limits of stress under different confining pressures. Int. J. Fatigue 2019, 127, 82–100. [Google Scholar] [CrossRef]
  3. Hoek, E.; Martin, C.D. Fracture initiation and propagation in intact rock–a review. J. Rock Mech. Geotech. Eng. 2014, 6, 287–300. [Google Scholar] [CrossRef] [Green Version]
  4. Peng, K.; Zhou, J.; Zou, Q.; Zhang, J.; Wu, F. Effects of stress lower limit during cyclic loading and unloading on deformation characteristics of sandstones. Constr. Build. Mater. 2019, 217, 202–215. [Google Scholar] [CrossRef]
  5. Liang, W.; Zhao, G.; Wang, X.; Zhao, J.; Ma, C. Assessing the rockburst risk for deep shafts via distance-based multi-criteria decision making approaches with hesitant fuzzy information. Eng. Geol. 2019, 260, 105211. [Google Scholar] [CrossRef]
  6. Wang, S.; Li, X.; Yao, J.; Gong, F.; Li, X.; Du, K.; Du, S. Experimental investigation of rock breakage by a conical pick and its application to non-explosive mechanized mining in deep hard rock. Int. J. Rock Mech. Min. Sci. 2019, 122, 104063. [Google Scholar] [CrossRef]
  7. Adams, M.; Sines, G. Crack extension from flaws in a brittle material subjected to compression. Tectonophysics 1978, 49, 97–118. [Google Scholar] [CrossRef]
  8. Peng, K.; Liu, Z.; Zou, Q.; Zhang, Z.; Zhou, J. Static and dynamic mechanical properties of granite from various burial depths. Rock Mech. Rock Eng. 2019, 52, 3545–3566. [Google Scholar]
  9. Camones, L.A.M.; do Amaral Vargas, E.; de Figueiredo, R.P.; Velloso, R.Q. Application of the discrete element method for modeling of rock crack propagation and coalescence in the step-path failure mechanism. Eng. Geol. 2013, 153, 80–94. [Google Scholar] [CrossRef]
  10. Dyskin, A.V.; Sahouryeh, E.; Jewell, R.J.; Joer, H.; Ustinov, K.B. Influence of shape and locations of initial 3-D cracks on their growth in uniaxial compression. Eng. Fract. Mech. 2003, 70, 2115–2136. [Google Scholar] [CrossRef]
  11. Peng, K.; Wang, Y.; Zou, Q.; Liu, Z.; Mou, J. Effect of crack angles on energy characteristics of sandstones under a complex stress path. Eng. Fract. Mech. 2019, 218, 106577. [Google Scholar] [CrossRef]
  12. Li, Y.P.; Chen, L.Z.; Wang, Y.H. Experimental research on pre-cracked marble under compression. Int. J. Solids Struct. 2005, 42, 2505–2516. [Google Scholar] [CrossRef]
  13. Zhang, B.; Li, Y.; Fantuzzi, N.; Zhao, Y.; Liu, Y.-B.; Peng, B.; Chen, J. Investigation of the Flow Properties of CBM Based on Stochastic Fracture Network Modeling. Materials 2019, 12, 2387. [Google Scholar] [CrossRef] [Green Version]
  14. Wong, L.N.Y.; Einstein, H.H. Crack coalescence in molded gypsum and Carrara marble: Part 1. Macroscopic observations and interpretation. Rock Mech. Rock Eng. 2009, 42, 475–511. [Google Scholar] [CrossRef]
  15. Wong, L.N.Y.; Einstein, H.H. Crack coalescence in molded gypsum and Carrara marble: Part 2—Microscopic observations and interpretation. Rock Mech. Rock Eng. 2009, 42, 513–545. [Google Scholar] [CrossRef]
  16. Wong, R.H.C.; Chau, K.T.; Tang, C.A.; Lin, P. Analysis of crack coalescence in rock-like materials containing three flaws—Part I: Experimental approach. Int. J. Rock Mech. Min. Sci. 2001, 38, 909–924. [Google Scholar] [CrossRef]
  17. Yang, S.Q. Crack coalescence behavior of brittle sandstone samples containing two coplanar fissures in the process of deformation failure. Eng. Fract. Mech. 2011, 78, 3059–3081. [Google Scholar] [CrossRef]
  18. Zhang, X.P.; Wong, L.N.Y. Cracking processes in rock-like material containing a single flaw under uniaxial compression: A numerical study based on parallel bonded-particle model approach. Rock Mech. Rock Eng. 2012, 45, 711–737. [Google Scholar] [CrossRef]
  19. Ko, T.Y.; Einstein, H.; Kemeny, J. Crack coalescence in brittle material under cyclic loading. In Proceedings of the Golden Rocks 2006, The 41st US Symposium on Rock Mechanics (USRMS), Golden, CO, USA, 17–21 June 2006; American Rock Mechanics Association: Alexandria, VA, USA, 2006. [Google Scholar]
  20. Park, C.H.; Bobet, A. Crack coalescence in specimens with open and closed flaws: A comparison. Int. J. Rock Mech. Min. Sci. 2009, 46, 819–829. [Google Scholar] [CrossRef]
  21. Sagong, M.; Bobet, A. Coalescence of multiple flaws in a rock-model material in uniaxial compression. Int. J. Rock Mech. Min. Sci. 2002, 39, 229–241. [Google Scholar] [CrossRef]
  22. Tang, C.A.; Lin, P.; Wong, R.H.C.; Chau, K.T. Analysis of crack coalescence in rock-like materials containing three flaws—Part II: Numerical approach. Int. J. Rock Mech. Min. Sci. 2001, 38, 925–939. [Google Scholar] [CrossRef]
  23. Zhang, Z.; Cao, S.; Li, Y.; Guo, P.; Yang, H.; Yang, T. Effect of moisture content on methane adsorption- and desorption- induced deformation of tectonically deformed coal. Adsorpt. Sci. Technol. 2018, 36, 1648–1668. [Google Scholar] [CrossRef] [Green Version]
  24. Wong, L.N.Y.; Li, H.Q. Numerical study on coalescence of two pre-existing coplanar flaws in rock. Int. J. Solids Struct. 2013, 50, 3685–3706. [Google Scholar] [CrossRef] [Green Version]
  25. Zhao, Y.; Cao, S.; Li, Y.; Zhang, Z.; Guo, P.; Yang, H.; Zhang, S.; Pan, R. The occurrence state of moisture in coal and its influence model on pore seepage. RSC Adv. 2018, 8, 5420–5432. [Google Scholar] [CrossRef] [Green Version]
  26. Wong, R.H.; Chau, K.T. Crack coalescence in a rock-like material containing two cracks. Int. J. Rock Mech. Min. Sci. 1998, 35, 147–164. [Google Scholar] [CrossRef]
  27. Yang, S.Q.; Jing, H.W. Strength failure and crack coalescence behavior of brittle sandstone samples containing a single fissure under uniaxial compression. Int. J. Fract. 2011, 168, 227–250. [Google Scholar] [CrossRef]
  28. Yang, S.Q. Strength, Failure and Crack Evolution Behavior of Rock Material Containing Pre-Existing Fissures; Springer: Cham, Switzerland, 2015; p. 246. [Google Scholar]
  29. Pollard, D.D.; Aydin, A. Progress in understanding jointing over the past century. GSA Bull. 1988, 100, 1181–1204. [Google Scholar] [CrossRef]
  30. Lee, H.; Jeon, S. An experimental and numerical study of fracture coalescence in pre-cracked specimens under uniaxial compression. Int. J. Solids Struct. 2011, 48, 979–999. [Google Scholar] [CrossRef] [Green Version]
  31. Li, H.; Wong, L.N.Y. Influence of flaw inclination angle and loading condition on crack initiation and propagation. Int. J. Solids Struct. 2012, 49, 2482–2499. [Google Scholar] [CrossRef] [Green Version]
  32. Ning, Y.; Yang, J.; An, X.; Ma, G. Modelling rock fracturing and blast-induced rock mass failure via advanced discretisation within the discontinuous deformation analysis framework. Comput. Geotech. 2011, 38, 40–49. [Google Scholar] [CrossRef]
  33. Wu, Z.; Wong, L.N.Y. Frictional crack initiation and propagation analysis using the numerical manifold method. Comput. Geotech. 2012, 39, 38–53. [Google Scholar] [CrossRef]
  34. Amarasiri, A.; Kodikara, J. Use of material interfaces in DEM to simulate soil fracture propagation in Mode I cracking. Int. J. Geomech. 2010, 11, 314–322. [Google Scholar] [CrossRef]
  35. Cundall, P.A.; Strack, O.D. A discrete numerical model for granular assemblies. Geotechnique 1979, 29, 47–65. [Google Scholar] [CrossRef]
  36. Chen, W.; Konietzky, H.; Tan, X.; Frühwirt, T. Pre-failure damage analysis for brittle rocks under triaxial compression. Comput. Geotech. 2016, 74, 45–55. [Google Scholar] [CrossRef]
  37. Chen, W.; Konietzky, H.; Abbas, S.M. Numerical simulation of time-independent and-dependent fracturing in sandstone. Eng. Geol. 2015, 193, 118–131. [Google Scholar] [CrossRef]
  38. Gui, Y.L.; Zhao, Z.Y.; Kodikara, J.; Bui, H.H.; Yang, S.Q. Numerical modelling of laboratory soil desiccation cracking using UDEC with a mix-mode cohesive fracture model. Eng. Geol. 2016, 202, 14–23. [Google Scholar] [CrossRef]
  39. Gui, Y.L.; Bui, H.H.; Kodikara, J.; Zhang, Q.B.; Zhao, J.; Rabczuk, T. Modelling the dynamic failure of brittle rocks using a hybrid continuum-discrete element method with a mixed-mode cohesive fracture model. Int. J. Impact Eng. 2016, 87, 146–155. [Google Scholar] [CrossRef]
  40. Zhang, X.P.; Wong, L.N.Y.; Wang, S. Effects of the ratio of flaw size to specimen size on cracking behavior. Bull. Eng. Geol. Environ. 2015, 74, 181–193. [Google Scholar] [CrossRef]
  41. Turco, E. In-plane shear loading of granular membranes modeled as a Lagrangian assembly of rotating elastic particles. Mech. Res. Commun. 2018, 92, 61–66. [Google Scholar] [CrossRef]
  42. Turco, E.; dell’Isola, F.; Misra, A. A nonlinear Lagrangian particle model for grains assemblies including grain relative rotations. Int. J. Numer. Anal. Methods Geomech. 2019, 43, 1051–1079. [Google Scholar] [CrossRef] [Green Version]
  43. Wong, L.N.Y.; Zhang, X.P. Size effects on cracking behavior of flaw-containing specimens under compressive loading. Rock Mech. Rock Eng. 2014, 47, 1921–1930. [Google Scholar] [CrossRef]
  44. Shen, B.; Stephansson, O.; Einstein, H.H.; Ghahreman, B. Coalescence of fractures under shear stresses in experiments. J. Geophys. Res. Ser. 1995, 100, 5975. [Google Scholar] [CrossRef]
  45. Vesga, L.F.; Vallejo, L.E.; Lobo-Guerrero, S. DEM analysis of the crack propagation in brittle clays under uniaxial compression tests. Int. J. Numer. Anal. Methods Geomech. 2008, 32, 1405–1415. [Google Scholar] [CrossRef]
  46. Bray, J.W. A study of jointed and fractured rock. Rock Mech. Eng. Geol. 1967, 5, 117–136. [Google Scholar]
Figure 1. Illustration of the parallel bond model.
Mathematics 07 01223 g001
Figure 2. Constructing a macro-crack based on connecting centroids of micro-cracks [18].
Mathematics 07 01223 g002
Figure 3. Geometries of the model containing two intersecting flaws: (a) Flaws are numbered A and B; (b) flaw inclination angle β, intersection angle α and flaw length L; and (c) four bridging zones.
Mathematics 07 01223 g003
Figure 4. The stress-strain curves: Lab test vs. numerical simulation results.
Mathematics 07 01223 g004
Figure 5. Variations of peak strength against β for different values of α.
Mathematics 07 01223 g005
Figure 6. The peak strengths of the model containing a single flaw against β for different flaw initial inclination angles. ① ② ③ ④ ⑤ curves corresponding to five flaw initial inclination angles in Figure 7.
Mathematics 07 01223 g006
Figure 7. Five flaw initial inclination angles of the model containing a single flaw. The red dotted line represents the final state of rotation for the flaw. The blue arrow represents the direction of rotation.
Mathematics 07 01223 g007
Figure 8. Axial stress (black line) and total crack number (blue line) versus axial strain with different values of α and β. Five points, A, B, C, D, and E, on the stress–strain curve are monitored to observe the crack initiation, propagation, and coalescence.
Mathematics 07 01223 g008aMathematics 07 01223 g008b
Figure 9. σ c i / σ c n versus flaw inclination angle β for different values of α.
Mathematics 07 01223 g009
Figure 10. Variations of ∆ σ c i / σ c n against α (a) and β (b).
Mathematics 07 01223 g010
Figure 11. Observed crack coalescence patterns for two intersecting flaws (left: Simulation results, right: Simplified sketch). White and red segments represent microscopic tensile and shear cracks, respectively. The arrows represent the crack propagation direction.
Mathematics 07 01223 g011aMathematics 07 01223 g011b
Figure 12. Ratio between coalescence stress σ c o and peak strength σ c n for different values of α and β.
Mathematics 07 01223 g012
Table 1. Micro-parameters used for the model specimens.
Particle ParametersValueParallel Bond ParametersValue
Ec Young’s modulus of the particle2.5 GPa E ¯ c Young’s modulus of the parallel bond2.5 GPa
kn/ks ratio of normal to shear stiffness of the particle1 k ¯ n / k ¯ s ratio of normal to shear stiffness of the parallel bond1
Grain friction coefficient,0.01 σ ¯ c tensile strength of the parallel bond6 MPa
Rmax/Rmin ratio of max particle radius to min particle radius1.66 c ¯ cohesion of the parallel bond15 MPa
Rmin Lower bound of particle radius0.21 mm λ ¯ radius multiplier1
ρ particle density1.83 g/m3 Φ ¯ Friction angle of the parallel bond0
Table 2. Lab test results [43] vs. numerical simulation results.
ParameterExperimental TestsBPM
Density (g/cm3)1.541.54
Young’s modulus (GPa)5.966.09
Poisson’s ratio0.150.15
Uniaxial compressive strength (MPa)33.8534.2
Tensile strength (MPa)3.24.8
Table 3. The crack evolution pattern at different stages of loading with different flaw geometry. The cracks corresponding to five points on the stress–strain curve in Figure 8. Microscopic tensile and shear cracks are shown in white and red, respectively. Original flaws are in yellow.
Flaw GeometryCrack Evolution Pattern at Different Stages of Loading
(A)(B)I(D)I
α = 90° β = 30° Mathematics 07 01223 i001 Mathematics 07 01223 i002 Mathematics 07 01223 i003 Mathematics 07 01223 i004 Mathematics 07 01223 i005
α = 60° β = 0° Mathematics 07 01223 i006 Mathematics 07 01223 i007 Mathematics 07 01223 i008 Mathematics 07 01223 i009 Mathematics 07 01223 i010
α = 45° β = 45° Mathematics 07 01223 i011 Mathematics 07 01223 i012 Mathematics 07 01223 i013 Mathematics 07 01223 i014 Mathematics 07 01223 i015
α = 30° β = 0° Mathematics 07 01223 i016 Mathematics 07 01223 i017 Mathematics 07 01223 i018 Mathematics 07 01223 i019 Mathematics 07 01223 i020
Table 4. Crack coalescence patterns for two intersecting flaws with different values of α and β. Microscopic tensile and shear cracks are shown in white and red, respectively. Original flaws are in yellow.
Flaw GeometryThe Crack Coalescence Patterns of Loading
β = 0°β = 30°β = 45°β = 60°β = 90°
α = 90° Mathematics 07 01223 i021 Mathematics 07 01223 i022 Mathematics 07 01223 i023 Mathematics 07 01223 i024 Mathematics 07 01223 i025
α = 60° Mathematics 07 01223 i026 Mathematics 07 01223 i027 Mathematics 07 01223 i028 Mathematics 07 01223 i029 Mathematics 07 01223 i030
α = 45° Mathematics 07 01223 i031 Mathematics 07 01223 i032 Mathematics 07 01223 i033 Mathematics 07 01223 i034 Mathematics 07 01223 i035
α = 30° Mathematics 07 01223 i036 Mathematics 07 01223 i037 Mathematics 07 01223 i038 Mathematics 07 01223 i039 Mathematics 07 01223 i040
Table 5. The coalescence patterns of different geometries.
Angle/°Coalescence Types of Different Geometries
β = 0°β = 30°β = 45°β = 60°β = 90°
TypeZoneTypeZoneTypeZoneTypeZoneTypeZone
α = 90°(3)II(6)II IV(6)II IV(3) (6)II III(3)II
α = 60°(6)III(2) (3)I III(1) (2) (3) (4) (5)I II IV(1) (5) (6)I Ⅱ IV(3)I III
α = 45°(3)II(2) (6)I III(2) (3) (4) (6)I II(1) (4) (6)II IV(3) (6)I II
α = 30°(5) (6)I III(5) (6)I III(2) (3)I II(2) (3) (4)I III IV(3) (4) (6)I III

