Article

Fuzzy Evaluation Model for Enhancing E-Learning Systems

1
Department of Cultural and Creative Industries, National Chin-Yi University of Technology, Taichung 41170, Taiwan
2
Department of Leisure Industry Management, National Chin-Yi University of Technology, Taichung 41170, Taiwan
3
Institute of Innovation and Circular Economy, Asia University, Taichung 41354, Taiwan
4
Counseling Center, National Chin-Yi University of Technology, Taichung 41170, Taiwan
*
Authors to whom correspondence should be addressed.
Mathematics 2019, 7(10), 918; https://doi.org/10.3390/math7100918
Submission received: 8 September 2019 / Revised: 29 September 2019 / Accepted: 30 September 2019 / Published: 2 October 2019

Abstract

:
As the environment and information-technology conditions of the Internet of Things matured, various applications were launched. In education, e-learning is promoted so that students’ learning is no longer restricted to the classroom. E-learning schedules are flexible, and learners’ commuting costs are low. Apparently, improving the quality of e-learning systems can enhance learners’ learning effectiveness, satisfaction, engagement, and learning efficacy. A performance evaluation matrix is a useful tool for collecting users’ opinions to assess the performance of an operating system, and it is widely used to evaluate and improve performance in numerous industries and organizations. Therefore, this study used this matrix to construct a model for evaluation and analysis, providing suggestions on improving e-learning systems. This approach maintained the simple response model of Likert scales, which increases the efficiency and accuracy of data collection. Furthermore, the fuzzy membership function of the discriminant index was constructed based on the confidence interval, thereby solving the problems of sampling error and the complexity of collecting fuzzy linguistic data. Besides, we simplified calculations by standardizing test statistics to increase evaluation efficiency. As a result, this study improved the quality of e-learning system, enhanced users’ learning effectiveness, satisfaction, and engagement, and achieved the goal of sustainability.

1. Introduction

Product process quality and service quality performance are two critical axes which explore quality performance. Good product quality is the best backing for service quality. The Taguchi loss function and the corresponding process capability indicators are the best tools for exploring process quality [1,2,3,4,5,6,7,8]. The best tool for service quality performance evaluation is the performance evaluation matrix (PEM). As the environment of the Internet of Things gradually matures and data-collection technology improves, both types of quality performance evaluations are more immediate and accurate [9,10,11,12,13,14,15]. Thus, various applications have enabled the launch of sharing economies, such as Uber, bicycle-sharing, and ridesharing. In education, e-learning is promoted so that student learning is no longer restricted to the classroom. With e-learning, learning schedules are flexible, and the costs of learners’ traveling to and from their learning institutions are lower. Also, learners can learn at any time and place, without being restricted by the environment, which will improve their learning efficiency. As a result, constructing a comprehensive e-learning system can benefit the learning effectiveness and satisfaction of students or learners and certainly increase the number of people engaged in e-learning, thereby creating a profitable commercial model.
Lambert and Sharma (1990) proposed the performance evaluation matrix (PEM) to define the importance index (Y-axis) and the satisfaction index (X-axis) for the evaluation of the operating system by means of collecting users’ perceptions through the questionnaire. Hung, Huang, and Chen (2003) revised the position of the PEM performance block to make the evaluation rules more rational. Subsequently, many scholars conducted relevant revised studies to make the evaluation model more complete [9,10,16,17,18,19]. Obviously, performance evaluation method or performance evaluation matrix (PEM) is a useful tool that collects the opinions of customers or users to assess the performance of an operating system. Compared to other evaluation methods that require complex data comparisons, PEMs have an advantage in terms of ease of analysis. PEMs are thus widely applied by various researchers to evaluate and improve performance in a variety of industries and organizations. Such researchers include Chen and Chen [16], Hossain and Ahmed [20], Markovic’ and Jankovic’ [21], Wang, et al. [17], Wong and Szeto [22], Basso and Funari [23], Wu et al. [24], and Zhou et al. [25]. In view of this, this study used PEMs to construct a model for the assessment, analysis, and provision of recommendations for e-learning systems, so as to improve the quality of these systems.
As mentioned earlier, some scholars also use fuzzy methods to explore the performance evaluation of online learning and provide good suggestions for improvement. Those scholars include Çelikbilek et al. [26], Lange [27], Ma et al. [28], Shanmugam et al. [29], and Wong et al. [30]. In order to improve the data collection of fuzzy numbers, which is complicated and may reduce customers’ willingness to answer questions, Chen et al. [18] developed a discriminate index to determine whether a service item requires improvement by having customers rank how important a service item is to them and how satisfactory they found that service item to be. They referred to the fuzzy test methods used by Buckley [31], Wang [32], Chen et al. [33], and Chen et al. [34] to propose a discriminant index and develop a fuzzy test method to identify the service items that needed improvement in PEMs. The advantage of this approach is that it maintains the simple response model of Likert scales, which increases the efficiency and accuracy of data collection. Furthermore, the fuzzy membership function of the discriminant index was constructed based on the confidence interval, which solves the problems of sampling error and the complexity of collecting fuzzy linguistic data. Although this approach simplifies many calculation models, multiple question items must be evaluated simultaneously, which still presents some complexity in practical applications. This study thus simplified calculations by standardizing test statistics and developed fuzzy evaluation criteria based on the fuzzy evaluation method proposed by Chen et al. [18] to identify the service items that need improvement in a PEM. Finally, we used a case study of a computer-assisted language learning system (CALL system) to demonstrate the efficacy of the proposed approach.
The remainder of this paper is organized as follows. Section 2 defines the performance indices, PEM, discriminant index, and performance zones in the PEM. Section 3 uses statistical inference to derive the confidence interval of the discriminant index, following which the confidence interval is used to construct the fuzzy membership function of the discriminant index. Then, Section 3 presents the fuzzy test method and fuzzy evaluation criteria based on the fuzzy membership function to identify items considered critical to quality (CTQ). Section 4 contains the case study involving the computer-assisted language learning system (CALL system) to demonstrate the efficacy of the proposed approach. Conclusions are summarized in Section 5.

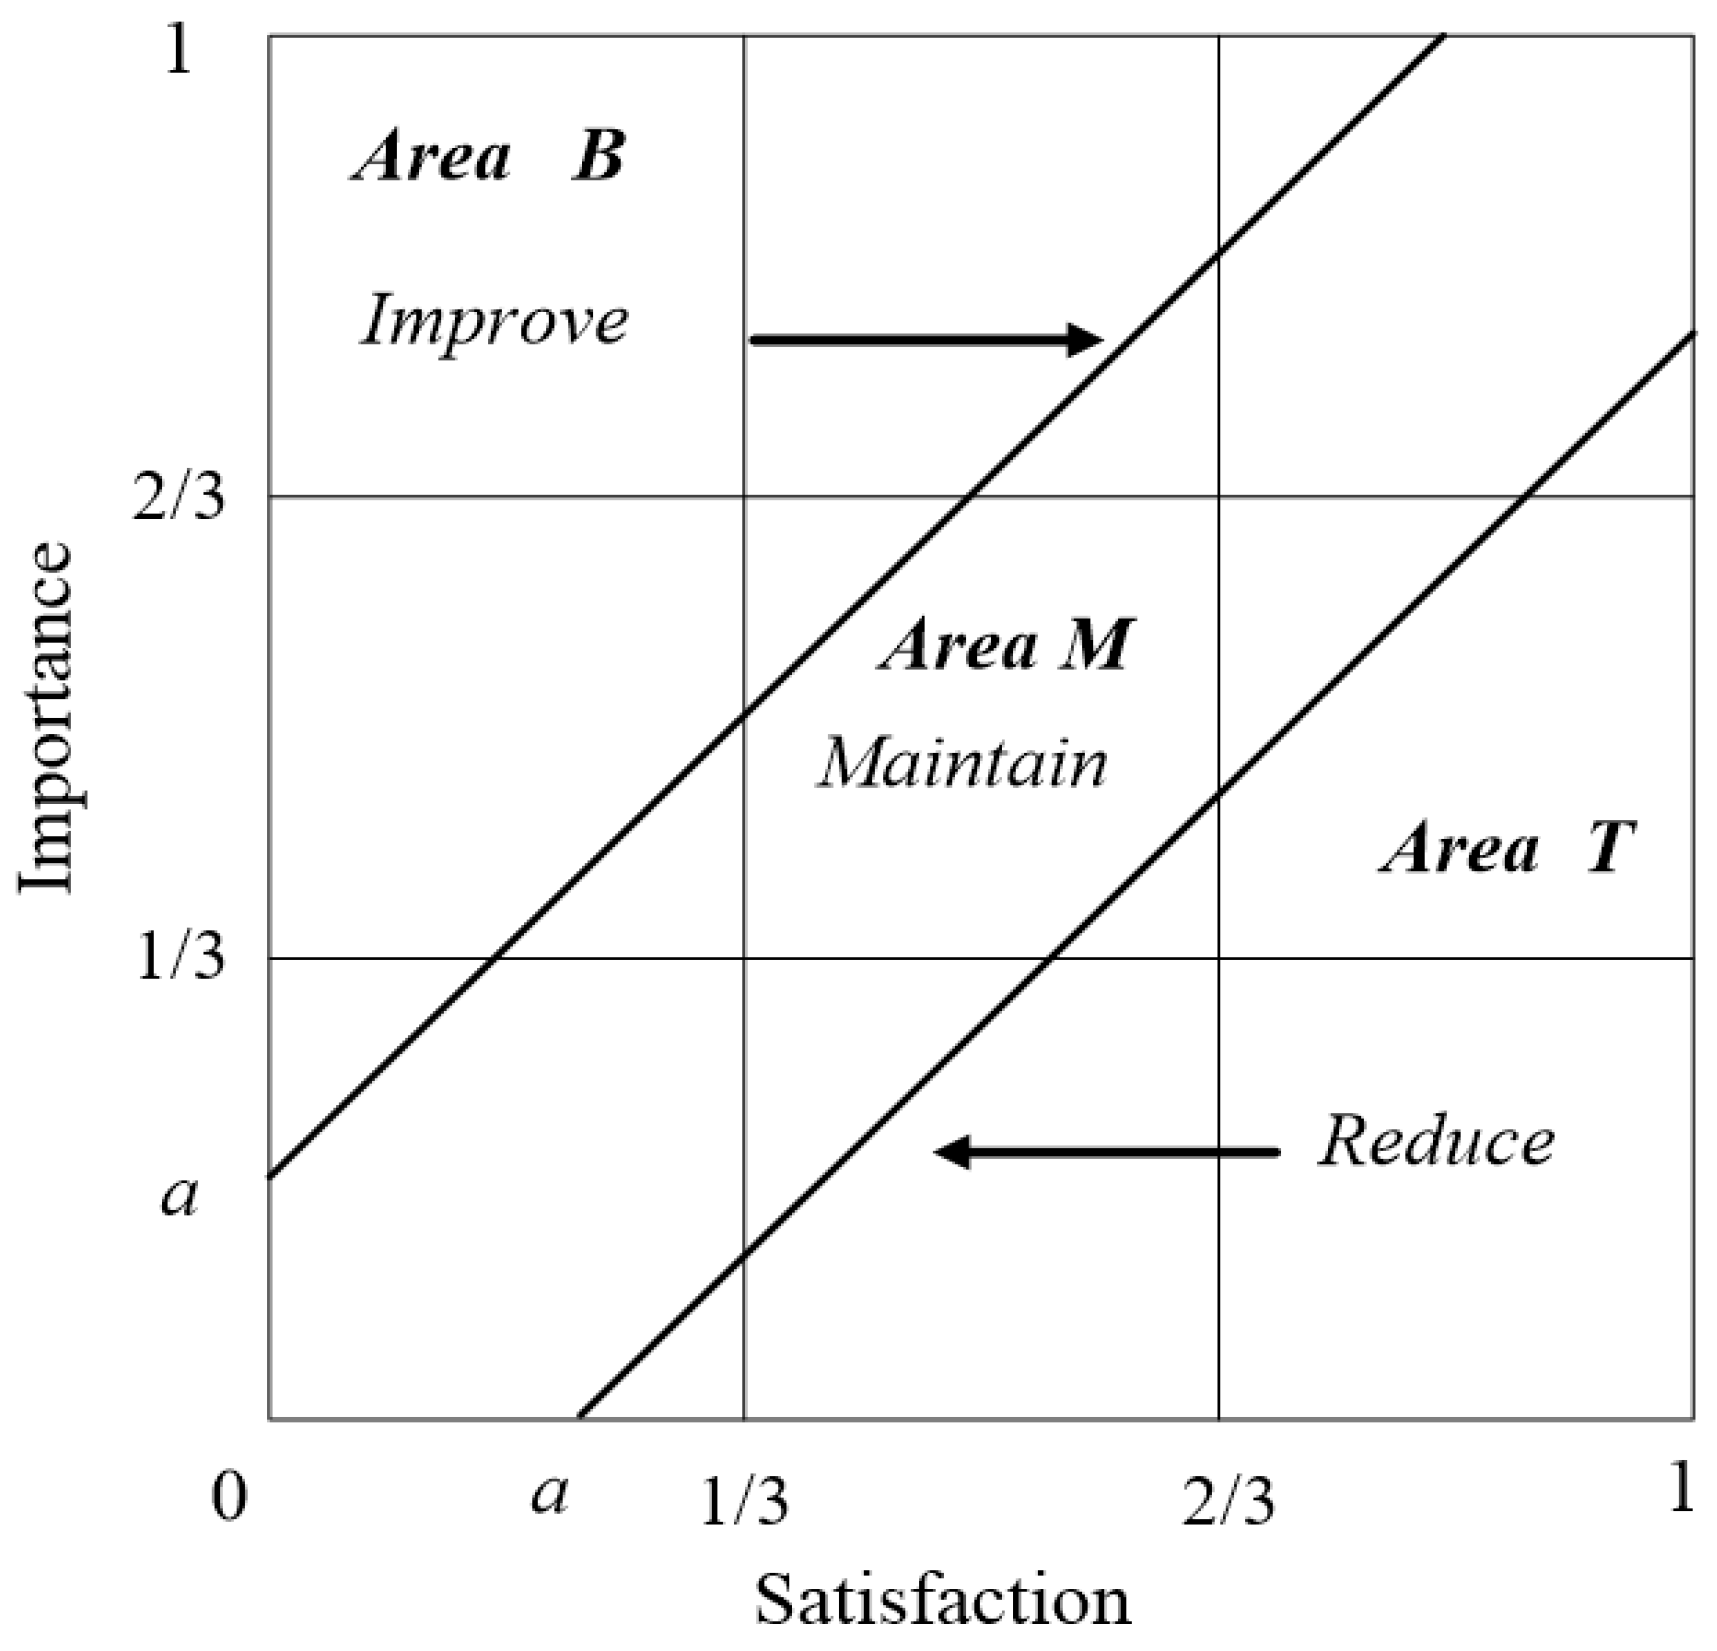
2. Performance Indices and Performance Evaluation Matrix

Similar to Chen et al. [18] and Yu, Chang, and Chen [19], for the sake of generality, this paper investigates q service items on the satisfaction scale; each item is associated with one question related to importance and one related to satisfaction, thereby totaling 2q questions. This paper uses the web-based e-learning system (WELS) questionnaire developed by Shee and Wang [35] to collect information on user satisfaction with the CALL system. The WELS questionnaire comprises 4 dimensions (learner interface, learning community, system content, and personalization) and the 13 items (q = 13) listed in Table 1.
Based on Chen et al. [18], we use random variable Y i to represent the importance of service item i, and random variable X i to represent the user’s satisfaction with service item i. For a questionnaire using a k-point scale, let R = k 1 . If we let Y t i = ( Y i 1 ) / R , the expectation E ( Y t i ) = θ i of random variable Y t i results in the following importance index:
importance   index :   θ i = μ i 1 R
where μ i = E ( Y i ) . Similarly, if we let X t i = ( X i 1 ) / R , the expectation E ( X t i ) = θ i of random variable X t i results in the following satisfaction index:
satisfaction   index :   θ i = μ i 1 R
where μ i = E ( X i ) . Obviously, 0 θ i 1 and 0 θ i 1 , i = 1,…, 13. Based on Hung, et al. [16], the importance index θ i is the vertical coordinate, and the satisfaction index θ i is the horizontal coordinate. They revised the method employed by Lambert and Sharma [9] and constructed a PEM divided into three zones that are equal in area (Figure 1):
  • Upper left corner (to improve): Area B = { ( θ i , θ i ) | θ i > a + θ i , θ i 0 , θ i 1 }
  • Middle zone (to maintain): Area M = { ( θ i , θ i ) | a + θ i θ i a + θ i , 0 θ i 1 , 0 θ i 1 }
  • Lower right corner (to reduce resource allocation): Area T = { ( θ i , θ i ) | θ i < a + θ i , θ i 1 , θ i 0 }
Each zone covers a third of the matrix; therefore, 0.5 ( 1 a ) 2 = 1 / 3 . Thus, we can easily obtain the result, a = 1 6 / 3 = 0.1835 . Hung, Huang, and Chen [10] pointed out that when ( θ i , θ i ) B , the service items in question need to be improved. To determine whether service item i falls in Area B, we let D i = Y t i X t i , whereby the expected value of random variable D i is E ( D i ) = δ i and serves as the following discriminant index:
discriminant   index :   δ i = θ i θ i
When discriminant index δ i > 0.1835 , then θ i > 0.1835 + θ i , which means that service item i falls in Area B and its quality must be improved. Similarly, when δ i 0.1835 , then θ i 0.1835 + θ i , which means that service item i does not fall in Area B. In this case, its quality should be maintained, or it should be discussed whether resources should be reallocated from this area to another for better overall quality.

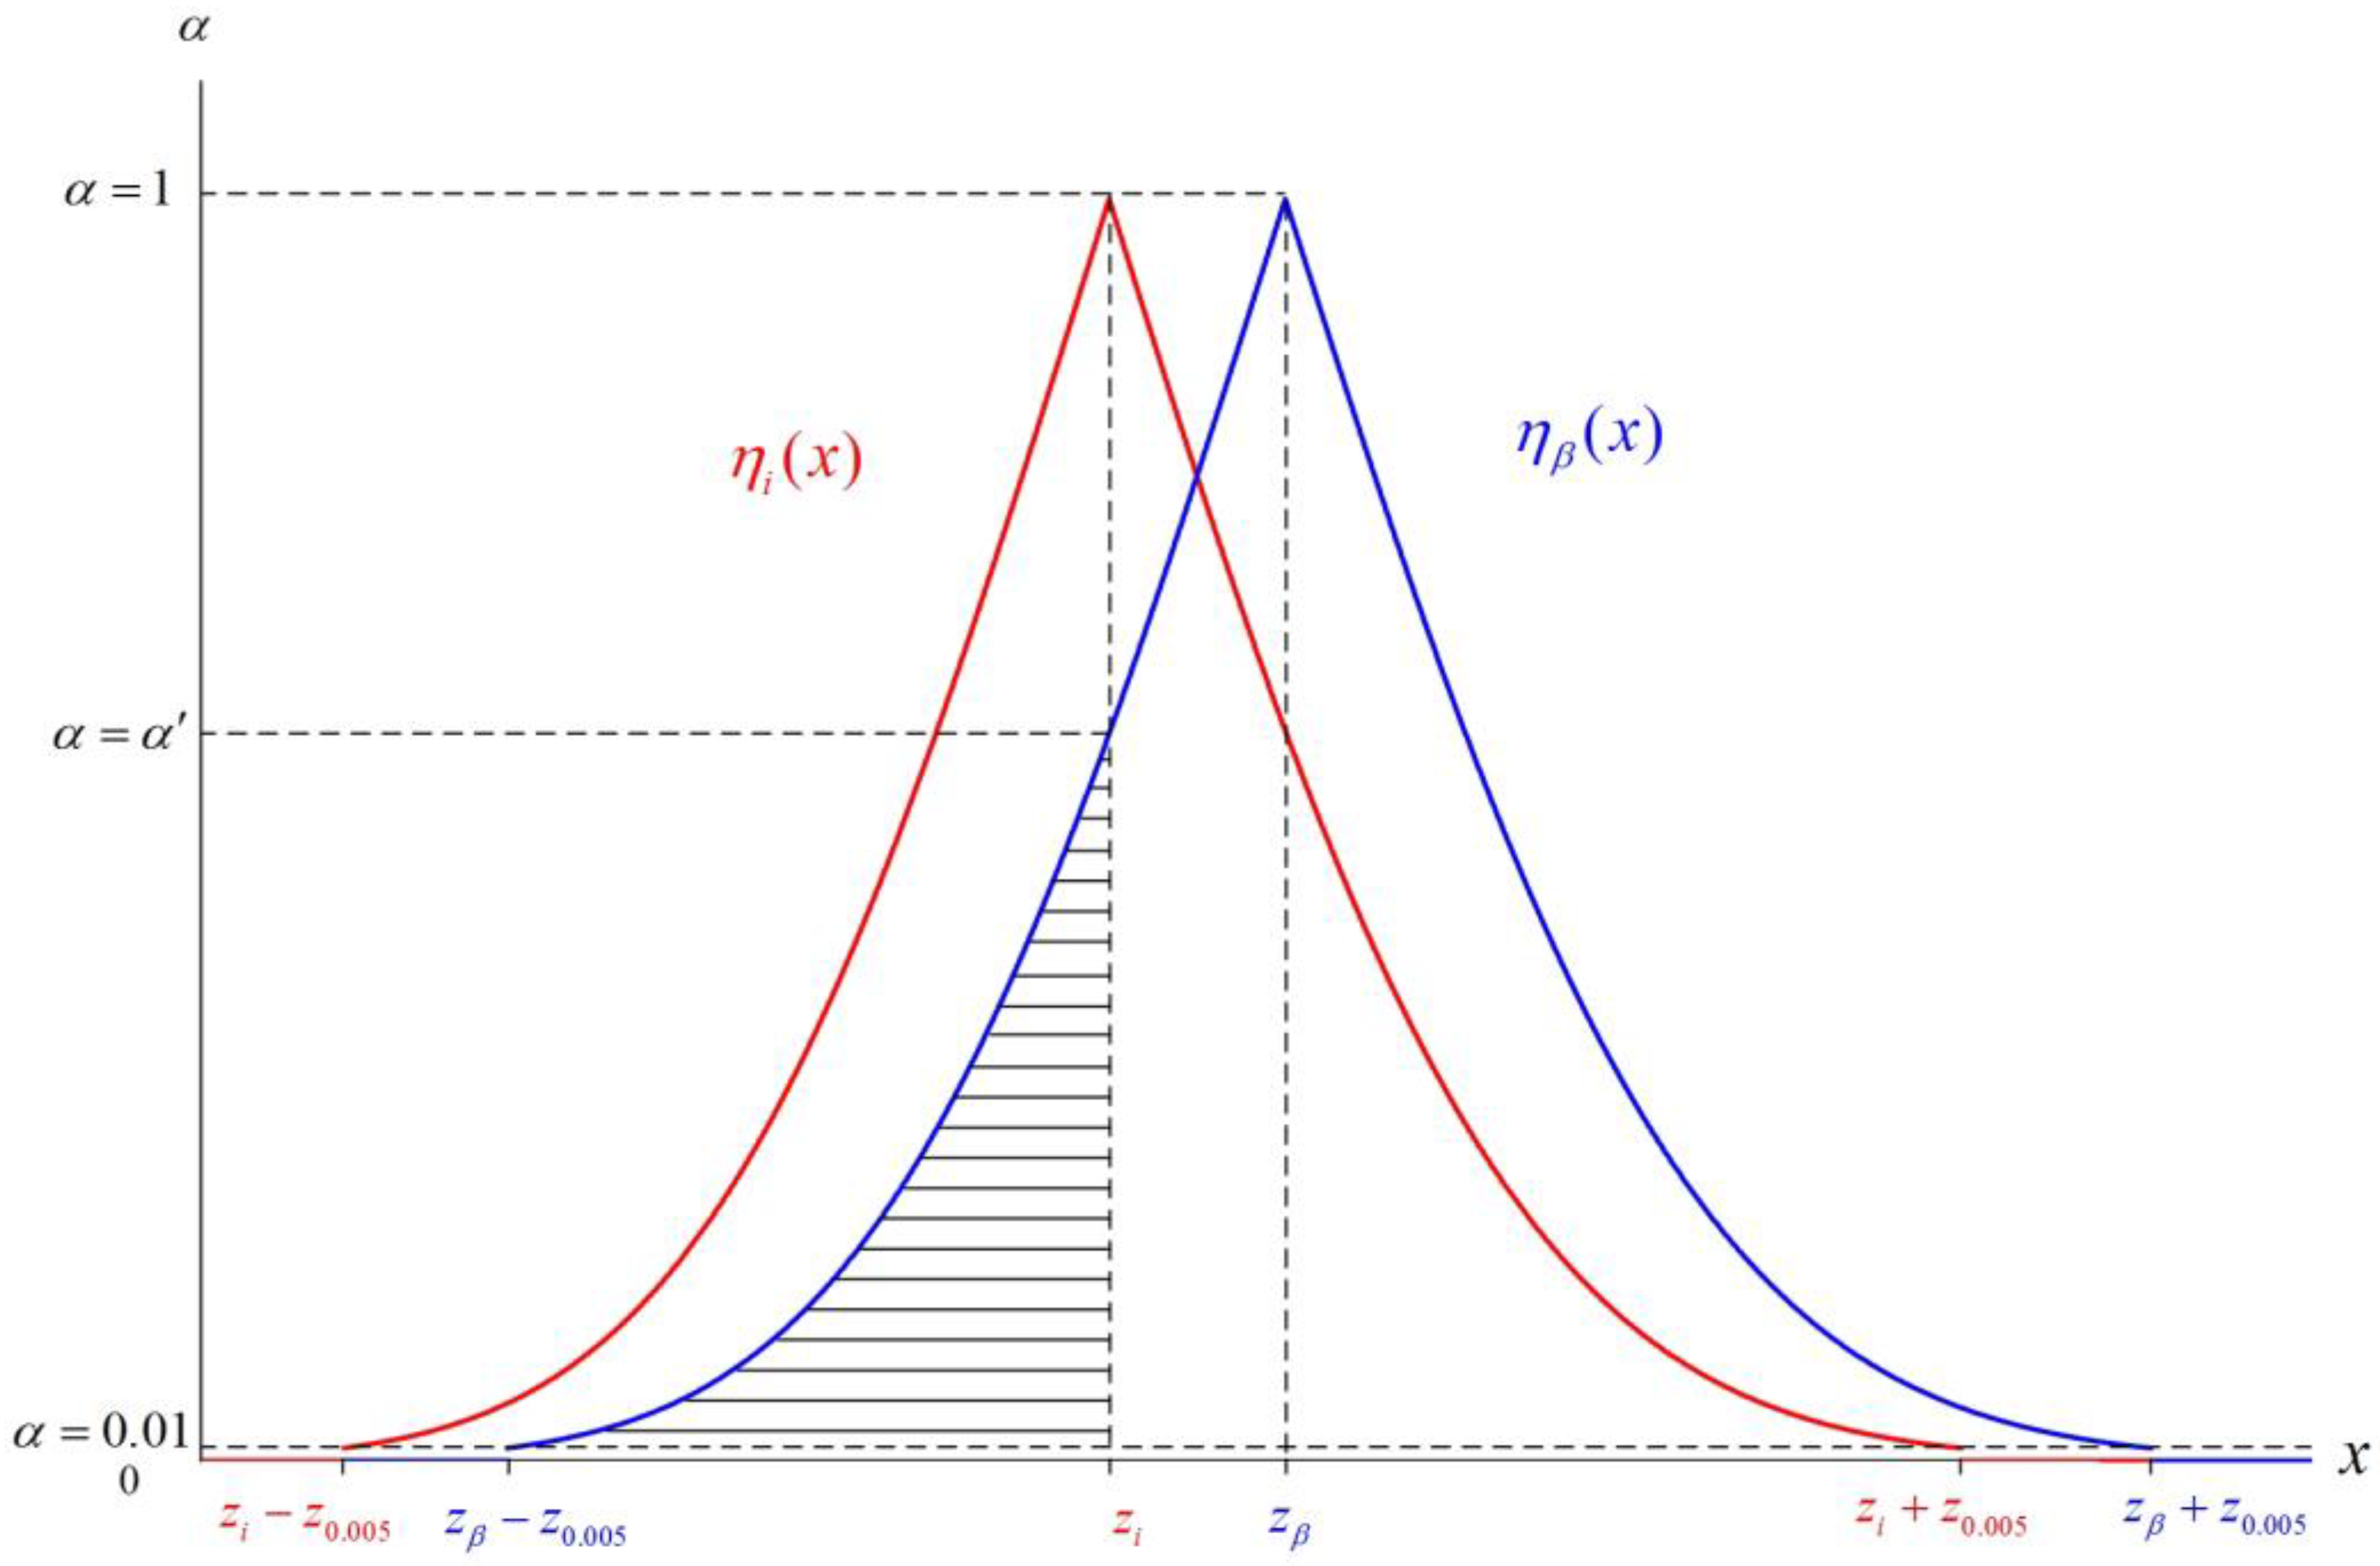
3. Fuzzy Hypothesis Testing

Let ( X t i 1 , X t i 2 , , X t i n ) be a random sample of satisfaction with service item i and ( Y t i 1 , Y t i 2 , , Y t i n ) be a random sample of the importance of service item i, and then
( D i 1 , D i 2 , , D i n )   =   ( Y t i 1 X t i 1 , Y t i 2 X t i 2 , , Y t i n X t i n )
The sample mean and sample standard deviation of X t i can be shown as follows:
X ¯ t i = 1 n × j = 1 n X t i j   and   S t i = 1 n 1 × j = 1 n ( X t i j X ¯ t i ) 2
Similarly, the sample mean and sample standard deviation of Y t i can be shown as follows:
Y ¯ t i = 1 n × j = 1 n Y t i j   and   S t i = 1 n 1 × j = 1 n ( Y t i j Y ¯ t i ) 2
In addition, let D ¯ i and S i denote the sample mean and sample standard deviation of D i , respectively, as follows:
D ¯ i = 1 n × j = 1 n D i j
S i = 1 n 1 × j = 1 n ( D i j D ¯ i ) 2
Based on the above data, satisfaction index estimator is θ i * . Importance index estimator θ i * and improvement index estimator δ i * can therefore be shown as follows:
θ i * = X ¯ t i
θ i * = Y ¯ t i
δ i * = θ i * θ i * = Y ¯ t i X ¯ t i = D ¯ i
Obviously, E [ θ i * ] = E [ X ¯ t i ] = θ i , E [ θ i * ] = E [ Y ¯ t i ] = θ i , and E [ δ i * ] = E [ D ¯ i ] = δ i . Using the satisfaction index δ i to determine whether service item i requires improvement is equivalent to the following hypothesis test:
H 0 :   δ i 0.1835   ( no   improvement   needed ) ; H 1 :   δ i > 0.1835   ( improvement   needed ) .
From the random sample, we compute the test statistic δ i * = D ¯ i . First, let
Z i = n ( δ i * 0.1835 ) S i
Then Z i is distributed as N ( 0 , 1 ) for n ; that is
Z i   H 0   i s   t r u e n N ( 0 , 1 )
Let ( y t i 1 , y t i 2 , , y t i n ) be the observed value of ( Y t i 1 , Y t i 2 , , Y t i n ) and ( x t i 1 , x t i 2 , , x t i n ) be the observed value of ( X t i 1 , X t i 2 , , X t i n ) . Then the observed value of ( D i 1 , D i 2 , , D i n ) is ( d i 1 , d i 2 , , d i n ) and the observed value of δ i * and S i is
δ i 0 * = 1 n × j = 1 n d i j   and   s i = 1 n 1 × j = 1 n ( d i j δ i 0 * ) 2
Therefore, the observed value of Z i is
z i = n ( δ i 0 * 0.1835 ) s i
The critical region C = { z i z β } , where β is the significance level of the test and usually β are 0.01, 0.05, and 0.10. When the null hypothesis holds, the decision rule is as follows:
(1)
Reject H 0 if z i z β ;
(2)
Do not reject H 0 if z i < z β .
In fact, P { z α / 2 Z i z α / 2 } = 1 α , based on Buckley (2005), and the α -cuts of triangular-shaped fuzzy number z ˜ i is
z ˜ i [ α ] = { [ z i 1 ( α ) , z i 2 ( α ) ] = [ z i z α / 2 , z i + z α / 2 ] ,   0.01 α 1 [ z i 1 ( α ) , z i 2 ( α ) ] = [ z i z 0.005 , z i + z 0.005 ] ,   0 α 0.01
Obviously, when α = 1 , then z α / 2 = z 0.5 = 0 , z i 1 ( 1 ) = z i 2 ( 1 ) = z i . Thus, the triangular-shaped fuzzy number of z ˜ i is as follows:
z ˜ i = ( z i z 0.005 ,   z i ,   z i + z 0.005 )
Then, the membership function of triangular-shaped fuzzy number z ˜ i is
η i ( x ) = { 0 , i f   x z i z 0.005 2 × ( 1 Φ ( z i x ) )   , i f   z i z 0.005 < x < z i 1 , i f   x = z i 2 × ( 1 Φ ( x z i ) )   , i f   z i < x < z i + z 0.005 0 , i f   z i + z 0.005 x
where Φ ( · ) denotes the cumulative distribution function of the standard normal distribution. Similarly to z i , the α -cuts of triangular-shaped fuzzy number z ˜ β is
z ˜ β [ α ] = { [ z β 1 ( α ) , z β 2 ( α ) ] = [ z β z α / 2 , z β + z α / 2 ] ,   0.01 α 1 [ z β 1 ( α ) , z β 2 ( α ) ] = [ z β z 0.005 , z β + z 0.005 ] ,   0 α 0.01
Obviously, when α = 1 , then z α / 2 = z 0.5 = 0 , z i 1 ( 1 ) = z i 2 ( 1 ) = z i . Thus, the triangular-shaped fuzzy number of z ˜ β is z ˜ β = ( z β z 0.005 ,   z β ,   z β + z 0.005 ) . Then the membership function of triangular-shaped fuzzy number z ˜ β is
η β ( x ) = { 0 , i f   x z β z 0.005 2 × ( 1 Φ ( z β x ) )   , i f   z β z 0.005 < x < z β 1 , i f   x = z β 2 × ( 1 Φ ( x z β ) )   , i f   z β < x < z β + z 0.005 0 , i f   z β + z 0.005 x
Subsequently, the diagram of η i ( x ) and η β ( x ) is presented below (Figure 2).
If set A T is the area in the graph of η β ( x ) , then
A T = { ( x , α ) | z β z α / 2 x z β + z α / 2 , 0.01 α 1 }
If d T is the length of the bottom of A T , then
d T = ( z β + z 0.005 ) ( z β z 0.005 ) = 2 × z 0.005   =   5.15
On the other hand, if set A T is the area in the graph of η β ( x ) to the left of the vertical line x = z i , then
A i = { ( x , α ) | z β z α / 2 x z i , 0.01 α b }
where b = 2 × Φ 1 ( z β z i ) . If d i is the length of the bottom of A i , then
d i = z i ( z β z 0.005 ) = z i + 0.93
with β = 0.05 . Obviously,
d i / d T = { 0 , z i 0.93 z i + 0.93 5.15   , 0.93 < z i < 4.22 1 , 4.22 z i
and d i / d T = 0.5 with z i = z β . Based on Chen et al. (2019), we can use d i / d T to replace the ratio A i / A T . If we let 0 < ϕ 1 < ϕ 2 < 0.5 , then the fuzzy test rule can be show as follows:
(1)
If d i / d T ϕ 1 , then do not reject H 0 and conclude that δ i 0.1835 .
(2)
If ϕ 1 < d i / d T < ϕ 2 , then make no decision.
(3)
If d i / d T ϕ 2 , then reject H 0 and conclude that δ i > 0.1835 .
Clearly, the calculations for d i / d T are relatively easy compared to those for A i / A T , so this approach has an advantage in practical application.

4. Case Study

As mentioned previously, this study developed a fuzzy evaluation model using a PEM for an e-learning system and formulated suggestions for system improvement. According to Hwang and Tsai [36], e-learning applications rank at the top of language learning. We conducted a case study using a CALL system that is commonly used in universities in Taiwan to demonstrate the fuzzy test method and evaluation criteria proposed in this study.

4.1. Samples

Respondents reported their perceptions regarding their satisfaction with and the importance of each item of the CALL system using Shee and Wang’s [35] web-based e-learning system (WELS) questionnaire, which is often used to collect satisfaction data regarding e-learning systems [26,27,28,29,30]. The WELS questionnaire contains 13 items under the four following dimensions: learner interface, learning community, system content, and personalization. Response options for importance are not important at all, not important, neutral, important, and very important. Response options for satisfaction are very dissatisfied, dissatisfied, neutral, satisfied, and very satisfied. Respondents were asked to express how important they felt each item was and how satisfied they felt with each item. The respondents in this study comprised students who use the CALL system at four universities in Central Taiwan. We distributed a total of 405 questionnaires and recovered 367questionnaires, representing a recovery rate of 90.6%. Twelve of the questionnaires were invalid, so the valid recovery rate was 87.7%. Among the 355 valid samples, male and female subjects occupied 34.9% and 65.1% of the subject population, respectively. The majority of the respondents were second-year students, accounting for 45.1% of the valid samples. First-year students accounted for 35.2%, while third- and fourth-year students accounted for 13.5% and 6.2%, respectively.

4.2. Results and Confirmatory Factor Analyses

With regard to reliability, SPSS analysis revealed the overall Cronbach’s α of the importance items to be 0.946 and the overall Cronbach’s α of the satisfaction items to be 0.973, which indicates that the questionnaire in this study has good reliability (DeVellis [37]). With regard to validity, confirmatory factor analysis (CFA) using LISREL for importance resulted in χ 2 ( 59 ) = 217.06 ( p -value = 0.000), CFI = 0.98, GFI = 0.91, and SRMR = 0.057; and for satisfaction χ 2 ( 59 ) = 212.92 ( p -value = 0.000), CFI = 0.99, GFI = 0.92, and SRMR = 0.023. These values are all acceptable (Hooper, Coughlan, and Mullen [38]). This analysis showed that the sample data had good reliability and validity and were suitable for this study.
The observed values of δ i * , S i , and Z i were computed as follows:
δ i 0 * = 1 n × j = 1 n d i j ,   s i = 1 n 1 × j = 1 n ( d i j δ i 0 * ) 2   and   z i = n ( δ i 0 * 0.1835 ) s i ,   i = 1 , , 13
Furthermore, based on these three observed values, δ i 0 * , s i , and z i , we can compute the d i / d T value shown in Table 2.

4.3. Discussion and Management Implications

As shown in Table 2, z 1 = 1.3083 and z 2 = 1.5339 , both of which are less than z β = 1.645 with β = 0.05 . Based on statistical testing rules, neither requires improvement. However, δ 10 * = 0.2028 and δ 20 * = 0.2049 , both of which are clearly greater than 0.1835. We therefore suggest further fuzzy hypothesis testing, the results of which are d 1 / d T = 0.4346 and d 2 / d T = 0.4784 . Both are greater than ϕ 2 = 0.4 . Based on the previous fuzzy decision principles, Items 1 and 2 require improvement.
The model shows that when the importance index ( θ i ) is not significantly higher than the satisfaction index ( θ i ) , ( θ i , θ i ) falls in Area M or Area T. This in turn means that H 0 is not rejected and that the service item in question does not need improvement. In contrast, a greater δ i 0 * means a greater z i as well, which means that θ i > θ i ; furthermore, H 0 is rejected, which means that ( θ i , θ i ) falls in Area B. In this case, the satisfaction index ( θ i ) is significantly greater than the satisfaction index, so the service item in question needs improvement. From a practical-implications perspective, it is clear that the results of fuzzy hypothesis testing are more reasonable. The managerial implications are as follows:
(1)
Items 1 and 2 both involve the learner interface, which must be easy for users to use in order to enhance their satisfaction and attract more users.
(2)
More users mean more commercial profits, thereby enabling corporate sustainability.
(3)
Similarly, more users mean that more corporations will be encouraged to invest in e-learning systems, which will reduce the amount of carbon emissions produced by vehicle transportation even further and promote sustainable development.
(4)
More corporations will be encouraged to promote sustainable development and their joint existence and prosperity with the environment.
(5)
Increased commercial profits will also make corporations more willing to fulfill their social responsibility, create good corporate image, and form a virtuous cycle.

5. Conclusions

A PEM is a useful tool that collects the opinions of customers or users to assess the performance of an operating system. PEMs are widely applied to evaluate and improve performance in a variety of industries and organizations. Compared to other evaluation methods that require complex data comparisons, PEMs have an advantage in the ease of analysis they offer. This is also the main background and purpose of this paper—to propose a fuzzy evaluation model for e-learning. We referred to the methods used by Chen et al. [11] to construct a PEM for an e-learning system using importance and satisfaction indices. In addition, we referred to the fuzzy test methods utilized by Buckley [12] and Chen et al. [13] and simplified calculations by standardizing test statistics. We also developed fuzzy evaluation criteria based on the fuzzy evaluation method proposed by Chen et al. [11] and identified items considered critical to quality (CTQ) that need improvement using the PEM. This approach maintains the simple response model of Likert scales, which increases the efficiency and accuracy of data collection. Furthermore, the fuzzy membership function of the discriminant index was constructed based on the confidence interval, which solves the problems of sampling error and the complexity of collecting fuzzy linguistic data. We also presented a case study of a CALL system to demonstrate the efficacy of the proposed approach. In fact, the model proposed in this paper can be applied to the performance evaluations of various service industries, such as educational services, cultural creativity, and food service industries, except for the case of a CALL system. However, when applying this model in the above-mentioned industries, a suitable questionnaire needs to be made first, and then the method proposed in this paper can be applied. That is a research limitation and can also be regarded as an important topic for future research.
In e-learning, learning schedules are flexible, and the costs for learners to travel to and from their learning institutions are lower, including the carbon emissions of vehicle transportation. Constructing a comprehensive e-learning system can benefit the learning effectiveness and satisfaction of students or learners and increase the number of people engaged in e-learning, thereby creating a profitable commercial model.

Author Contributions

Data curation, methodology, and writing, T.-S.L.; methodology, writing, and editing, C.-H.W.; Data curation, methodology, writing, and editing, C.-M.Y.

Funding

This research received no external funding.

Conflicts of Interest

The authors declare no conflicts of interest.

References

  1. Chen, K.S. Estimation of the process incapability index. Commun. Stat. Theory Methods 1998, 27, 1263–1274. [Google Scholar] [CrossRef]
  2. Chen, K.S.; Pearn, W.L.; Lin, P.C. A new generalization of cpm for processes with asymmetric tolerances. Int. J. Reliab. Qual. Saf. 1999, 6, 383–398. [Google Scholar] [CrossRef]
  3. Chen, K.S.; Chen, S.C.; Li, R.K. Process quality analysis of products. Int. J. Adv. Manuf. Technol. 2002, 19, 623–628. [Google Scholar] [CrossRef]
  4. Yu, K.T.; Sheu, S.H.; Chen, K.S. The evaluation of process capability for a machining center. Int. J. Adv. Manuf. Technol. 2007, 33, 505–510. [Google Scholar] [CrossRef]
  5. Huang, C.F.; Chen, K.S.; Sheu, S.H.; Hsu, T.S. Enhancement of axle bearing quality in sewing machines using six sigma. Proc. Inst. Mech. Eng. Part B J. Eng. Manuf. 2010, 224, 1581–1590. [Google Scholar] [CrossRef]
  6. Wang, C.H.; Tseng, M.L.; Tan, K.H.; Yu, K.T. Application of a mathematical programming model to solve the confidence interval of process capability index Spk. Int. J. Inf. Manag. Sci. 2017, 28, 11–23. [Google Scholar] [CrossRef]
  7. Wang, C.H.; Chen, K.S.; Tan, K.H. Lean six sigma applied to process performance and improvement model for the development of electric scooter water-cooling green motor assembly. Prod. Plan. Control 2019, 30, 400–412. [Google Scholar] [CrossRef]
  8. Lin, K.P.; Yu, C.M.; Chen, K.S. Production data analysis system using novel process capability indices- based circular economy. Ind. Manag. Data Syst. 2019, accepted. [Google Scholar] [CrossRef]
  9. Lambert, D.M.; Sharma, A. A customer-based competitive analysis for logistics decisions. Int. J. Phys. Distrib. Logist. Manag. 1990, 20, 7–24. [Google Scholar] [CrossRef]
  10. Hung, Y.H.; Huang, M.L.; Chen, K.S. Service quality evaluation by service quality performance matrix. Total Qual. Manag. Bus. Excell. 2003, 14, 79–89. [Google Scholar] [CrossRef]
  11. Chen, K.S.; Ouyang, L.Y.; Hsu, C.H.; Wu, C.C. The communion bridge to six sigma and process capability indices. Qual. Quant. 2009, 43, 463–469. [Google Scholar] [CrossRef]
  12. Chen, K.S.; Chen, H.T.; Wang, C.H. A study of process quality assessment for golf club-shaft in leisure sport industries. J. Test. Eval. 2012, 40, 512–519. [Google Scholar] [CrossRef]
  13. Lin, K.P.; Chang, H.F.; Chen, T.L.; Lu, Y.M.; Wang, C.H. Intuitionistic fuzzy C-regression by using least squares support vector regression. Expert Syst. Appl. 2016, 64, 296–304. [Google Scholar] [CrossRef]
  14. Li, L.L.; Yang, Y.F.; Wang, C.H.; Lin, K.P. Biogeography-based optimization based on population competition strategy for solving the substation location problem. Expert Syst. Appl. 2018, 97, 290–302. [Google Scholar] [CrossRef]
  15. Wang, C.H.; Chen, K.S. New process yield index of asymmetric tolerances for bootstrap method and six sigma approach. Int. J. Prod. Econ. 2020, 219, 216–223. [Google Scholar] [CrossRef]
  16. Chen, K.S.; Chen, H.T. Applying importance-performance analysis with simple regression model and priority indices to assess hotels’ service performance. J. Test. Eval. 2014, 42, 455–466. [Google Scholar] [CrossRef]
  17. Wang, K.J.; Chang, T.C.; Chen, K.S. Determining critical service quality from the view of performance influence. Total Qual. Manag. Bus. Excell. 2015, 26, 368–384. [Google Scholar] [CrossRef]
  18. Chen, K.S.; Lii, P.C.; Li, S.Y.; Yu, C.M. Development and application of a performance evaluation matrix: A case study on exploring the items considered critical to quality. J. Test. Eval. 2018, in press. [Google Scholar] [CrossRef]
  19. Yu, C.M.; Chang, H.T.; Chen, K.S. Developing a performance evaluation matrix to enhance the learner satisfaction of an e-learning system. Total Qual. Manag. Bus. Excell. 2018, 29, 272–745. [Google Scholar] [CrossRef]
  20. Hossain, M.J.; Ahmed, S.M.Z. Developing a service performance assessment system to improve service quality of academic libraries. Bus. Inf. Rev. 2013, 30, 210–221. [Google Scholar] [CrossRef]
  21. Markovic´, S.; Jankovic´, S.R. Exploring the relationship between service quality and customer satisfaction in Croatian hotel industry. Tour. Hosp. Manag. 2013, 19, 149–164. [Google Scholar]
  22. Wong, R.C.P.; Szeto, W.Y. An alternative methodology for evaluating the service quality of urban taxis. Transp. Policy 2018, 69, 132–140. [Google Scholar] [CrossRef]
  23. Basso, A.; Funari, S. Introducing weights restrictions in data envelopment analysis models for mutual funds. Mathematics 2018, 6, 164. [Google Scholar] [CrossRef]
  24. Wu, J.; Wang, Y.; Zhang, R.; Cai, J. An approach to discovering product/service improvement priorities: Using dynamic importance-performance analysis. Sustainability 2018, 10, 3564. [Google Scholar] [CrossRef]
  25. Zhou, Z.; Jin, Q.; Peng, J.; Xiao, H.; Wu, S. Further study of the DEA-Based framework for performance evaluation of competing crude oil prices’ volatility forecasting models. Mathematics 2019, 7, 827. [Google Scholar] [CrossRef]
  26. Çelikbilek, Y.; Adıgüzel Tüylü, A.N. Prioritizing the components of e-learning systems by using fuzzy DEMATEL and ANP. Interact Learn Environ. 2019. [Google Scholar] [CrossRef]
  27. Lange, C. The relationship between system-provided learner control and maintained situational interest within e-learning courses. Interactive Interact Technol Smart Educ. 2018, 15, 205–219. [Google Scholar] [CrossRef]
  28. Ma, S.; Zhang, S.; Li, G.; Wu, Y. Exploring information security education on social media use: Perspective of uses and gratifications theory. Aslib J. Inf. Manag. 2019. [Google Scholar] [CrossRef]
  29. Shanmugam, K.; Zainal, N.K.; Gnanasekaren, C. Technology foresight in the virtual learning environment in malaysia. J. Phys. Conf. Ser. 2019, 1228. [Google Scholar] [CrossRef]
  30. Wong, T.; Xie, H.; Zou, D.; Wang, F.L.; Tang, J.K.T.; Kong, A.; Kwan, R. How to facilitate self-regulated learning? A case study on open educational resources. J. Comput. Educ. 2019. [Google Scholar] [CrossRef]
  31. Buckley, J.J. Fuzzy statistics: hypothesis testing. Soft Comput. 2005, 9, 512–518. [Google Scholar] [CrossRef]
  32. Wang, C.H. An intuitionistic fuzzy set-based hybrid approach to the innovative design evaluation mode for green products. Adv. Mech. Eng. 2016, 8, 1–16. [Google Scholar] [CrossRef]
  33. Chen, K.S.; Wang, C.H.; Tan, K.H. Developing a fuzzy green supplier selection model using six sigma quality indices. Int. J. Prod. Econ. 2019, 212, 1–7. [Google Scholar] [CrossRef]
  34. Chen, K.S.; Wang, C.H.; Tan, K.H.; Chiu, S.F. Developing one-sided specification six-sigma fuzzy quality index and testing model to measure the process performance of fuzzy information. Int. J. Prod. Econ. 2019, 208, 560–565. [Google Scholar] [CrossRef]
  35. Shee, D.Y.; Wang, Y.S. Multi-criteria evaluation of the web-based e-learning system: A methodology based on learner satisfaction and its applications. Comput. Educ. 2008, 50, 894–905. [Google Scholar] [CrossRef]
  36. Hwang, G.J.; Tsai, C.C. Research trend in mobile and ubiquitous learning: A review of publications in selected journal from 2001 to 2010. Br. J. Educ. Technol. 2011, 42, E65–E70. [Google Scholar] [CrossRef]
  37. DeVellis, R.F. Scale Development: Theory and Applications, 2nd ed.; Sage: Newbury Park, CA, USA, 2003. [Google Scholar]
  38. Hooper, D.; Coughlan, J.; Mullen, M.R. Structural Equation Modelling: Guidelines for Determining Model Fit. Electron. J. Bus. Res. Methods 2008, 6, 53–60. [Google Scholar] [CrossRef]
Figure 1. Performance evaluation matrix.
Mathematics 07 00918 g001
Figure 2. Membership functions of η i ( x ) and η β ( x ) .
Mathematics 07 00918 g002
Table 1. Four dimensions and 13 items on the web-based e-learning system (WELS) questionnaire.
DimensionsItems
Learner interface1.  Ease of use
2.  User-friendliness
3.  Ease of understanding
4.  Operational stability
Learning community5.  Ease of discussion with other learners
6.  Ease of discussion with teachers
7.  Ease of accessing shared data
8.  Ease of exchanging learning with the others
System content9.  Up-to-date content
10. Sufficient content
11. Useful content
Personalization12. Capability of controlling learning progress
13. Capability of recording learning performance
Table 2. Importance and satisfaction survey for computer-assisted language learning (CALL) system.
DimensionsItems s i δ i 0 * z i d i / d T
Learner interface1.  Ease of use0.27820.20281.30830.4346 *
2.  User-friendliness0.26320.20491.53390.4784 *
3.  Ease of understanding0.28160.1704−0.87510.0107
4.  Operational stability0.29330.1775−0.38770.1053
Learning community5.  Ease of discussion with other learners0.2672−0.1049−20.33650
6.  Ease of discussion with teachers0.3276−0.2268−23.59430
7.  Ease of accessing shared data0.2711−0.0965−19.46190
8.  Ease of exchanging learning with the others0.2756−0.1162−20.48650
System content9.  Up-to-date content0.32390.0472−7.92870
10. Sufficient content0.33120.0556−7.27340
11. Useful content0.32750.0556−7.35680
Personalization12. Capability of controlling learning progress0.33550.0507−7.45850
13. Capability of recording learning performance0.32000.0592−7.32050
* Remarks: 1. Let ϕ 1 = 0.2 ; ϕ 2 = 0.4 ; 2. When value of d i / d T is marked *, it indicates d i / d T > ϕ 2 .

