Article

Modeling of the Public Opinion Polarization Process with the Considerations of Individual Heterogeneity and Dynamic Conformity

1
School of Statistics and Mathematics, Zhejiang Gongshang University, Hangzhou 310018, China
2
School of Management and E-Business, Zhejiang Gongshang University, Hangzhou 310018, China
3
Department of Computer Science and Information Systems, University of North Georgia, Oakwood, GA 30566, USA
4
School of Tourism and Urban-Rural Planning, Zhejiang Gongshang University, Hangzhou 310018, China
5
Hubei Key Laboratory of Mechanical Transmission and Manufacturing Engineering, Wuhan University of Science and Technology, Wuhan 430081, China
*
Author to whom correspondence should be addressed.
Mathematics 2019, 7(10), 917; https://doi.org/10.3390/math7100917
Submission received: 19 August 2019 / Revised: 28 September 2019 / Accepted: 30 September 2019 / Published: 2 October 2019
(This article belongs to the Special Issue Mathematical Modeling: From Nonlinear Dynamics to Complex Systems)

Abstract

:
Nowadays, hot issues are likely become bipolar or multipolar after heated discussion on the Internet. This article is focused on the study of the polarization phenomenon and establishes a public opinion polarization model with the considerations of individual heterogeneity and dynamic conformity. At first, this article introduces the dynamic changing function of an individual’s conformity tendency to other’s attitudes in the interaction process. It further defines the influential weight between different interactive individuals, and expands the interactive individual from complete homogeneity to initial attitude heterogeneity, and finally, conformity heterogeneity. Then, through simulation experiments, we find that the degree of changing in individual attitude is limited. That is, it is difficult for the individuals who have one directional attitude at the initial time to change into another opposite attitude through interaction. In addition, individuals with low conformity within a certain threshold are more likely to form polarization. Finally, the rationality and effectiveness of the proposed model are verified by the typical case “Mimeng Event”.

1. Introduction

Internet users who are interested in the same hot issue may have certain similarities, and these netizens who are similar to each other often stimulate each other and deepen each other’s emotional level when discussing online, thus reaching an extreme value gradually. This phenomenon is the polarization of public opinion. The emergence of public opinion polarization can easily deepen the dissatisfaction of netizens and lead to cyber violence, and may even extend to the offline, escalating to group behaviors, such as sit-ins and parades that are against social stability. Therefore, it is of great theoretical and practical significance to study the mechanism of network polarization.
At present, scholars have carried out some studies on public opinion polarization, mainly including qualitative analyses of the macroscopic characteristics of the polarization phenomenon by using statistical methods [1] and quantitative research by modeling and simulation [2,3]. However, most of the qualitative analysis methods rely on personal experience and lack a reliable theoretical basis, which severely limits their scope of application. The model used by the quantitative method is relatively simple. Although it reveals some local characteristics of polarization phenomena, it cannot accurately reflect the reality of many complex and changeable network polarization phenomena. At first, the representative J-A model was widely used in simulating polarization phenomenon because of its simple principle and strong practicability, but it assumes that individuals have homogeneity in the interaction process, which is different from the psychological point of view. The psychological view holds that all individuals are heterogeneous, and even if individuals a and b encounter and interact with individual c at the same time, the influence degree of individual c on each of them is still different. Therefore, this article defines the mutual influence degree by the relationship between the two interactors and the social status of the interactors themselves, thus measuring the individuals’ heterogeneity. Secondly, network polarization is a dynamic evolution process, which is produced by many individuals interacting with each other. When the deviation degree of different opinions in the network changes, individuals will have different herd mentality. Currently, there are relatively few studies on this situation in academia. Thus, this article puts forward the idea of dynamic conformity and explains it; that is, when the degree of opinion deviation in the network decreases gradually, the individual will be more inclined to listen to the mainstream of the society. Furthermore, a new public opinion polarization model is constructed by introducing the dynamic conformity function. In addition, the influences of an individual’s conformity and initial cognitive heterogeneity on the process of public opinion polarization are also analyzed.
The structure of this article is organized as follows: Section 2 is the literature review. Section 3 constructs a public opinion polarization model considering individual heterogeneity and dynamic conformity. Section 4 simulates the proposed model and studies the influences of key parameters on polarization. Section 5 carries on the analysis with a real world case study. The last section is the conclusions and the prospects for future work.

2. Literature Review

The phenomenon of group polarization was first noticed in 1961. Sunstein [4] believed that if the attitudes of group members had some bias at the beginning, the bias would be reinforced after discussion, and eventually a consistent, extreme attitude would be formed. At present, there have been many studies on the polarization phenomenon, which are mainly reflected in the following aspects:
In terms of individual heterogeneity: Urrutia-Mosqueraet et al. [5] found that people generally tended to become neighbors and friends with those who are close to their own class when studying racial segregation, but this tendency varied from group to group. Dhar et al. [6] held that different genders, ages, and hometown groups had different perceptions of health through community surveys. Abeleset et al. [7] suggested that while people usually tended to think their views were in line with the mainstream, and celebrities were more likely to choose to hide their actual views when they found that their views diverged from the mainstream. Zhang [8] found that individuals could change their opinions by interacting with others, but the level to which individuals could change their opinions varied with their preferences. Qiu et al. [9] used simulated annealing algorithms to divide the network nodes into three groups—supporters, opponents, and neutral groups, thereby studying the distribution of views hidden behind user comments.
In terms of dynamic evolution: Lewandowsky et al. [10] simulated the actual evolution of public opinion in the face of political conflict and scientific discovery by constructing a proxy model, and found that even if the scientific community had presented more compelling evidence on climate change, under the influence of the politicians’ views, the public remained ambivalent about the reality of climate change. Bode and Vraga [11] studied the situation in which individuals with different conformities were corrected after receiving false information. Chan et al. [12] analyzed the factors behind the individual’s acceptance of effective information from the perspective of individual’s probability of changing views. Hamilton et al. [13] found that the individuals who expressed their views in advance on the web could influence latecomers through the forum’s real data and four experiments. Colliander [14] pointed out that the individuals’ willingness to interact with each other on the web was variable, and this willingness would decrease after being criticized by others. Chen et al. [15] established a network that could be used to describe the network synchronization behavior, and the network structure was optimized by using the artificial immune algorithm to improve the network synchronization effect. Kleiner [16] proposed that in a polarized environment, citizens would have a sense of threat and become more actively involved in political decision-making than ever before.
In terms of the mechanism of polarization formation: Dandekar et al. [17] proposed that if individuals had enough bias at the initial moment, then this bias would continue to ferment with interaction and ultimately lead to polarization. Etesami and Basar [18] studied the phenomenon of perspective polarization in higher dimensions and found that if the interlocutors’ minds were open enough during the evolution of ideas, eventually a variety of results were formed, but not only unidirectional or bidirectional polarization. Li et al. [19] analyzed the convergence properties of the opinion dynamics and explored the underlying characteristics that marked the phase transition from opinion polarization to consensus. Leon-Medini [20] established a new multi-agent model, and studied the transformation of public opinion under three states of unification, polarization, and clusterization. Fu [21] constructed a new limited trust model, divided agents into the open, moderate, and closed types in simulation, and found that the open-minded agent might even diversify his/her final opinions.
In addition, some other studies mainly used particle interaction analysis methods in simulation physics to build interaction behavior between different agents by constructing the appropriate network and the nodes representing the interacting individuals. This interactive behavior is iterated several times to construct the interactive model among agents, and the interactive mode of each agent’s attitude and the evolution process of the whole public opinion are analyzed by simulation. Then, the complex behavior of macroscopic system is simulated on the whole. At present, there are two kinds of discrete models and continuous models to simulate the process of public opinion evolution. The core idea of these models is to assume that the updating of an individual’s attitude is influenced by other neighboring individuals. Usually, discrete models mainly include the Ising model [22], voter model [23,24], majority rule model (MR model) [25], Sznajd model [26], etc. The Ising model assumes that the updating of an individual’s attitude is influenced by his neighbors and social trends. The voter model assumes that an individual has only one specific attitude value (+1 or −1) at each time step, and randomly selects a neighbor’s attitude for updating. The MR model follows the principle of minority obeying majority, and each individual chooses the attitude of the majority. The Sznajd model assumes that individual opinions are influenced by external groups and are related to group size. It is assumed that each node occupies a position in a one-dimensional chain, and there are only two views, +1 and −1. agent i and agent (i + 1) determine the views of their connected neighbor nodes agent (i − 1) and agent (i + 2). If the views of agent i and agent (i + 1) are the same, then the views of these four nodes are the same at the next moment. If the views of agent i and agent (i + 1) are different, only the neighbors of another node will be affected. That means, agent i’s neighbor node agent (i − 1) will turn into the viewpoint of agent (i + 1) and agent (i + 1)’s neighbor node agent (i + 2) will turn into the viewpoint of agent i. Furthermore, continuous models use continuous values within a specific interval to describe individual viewpoint values, which are considered continuous attitudes. Such models mainly include the Deffuant model (D model) [27], the Weisbuch-Deffuant model (W-D model) [28], the Hegselmann-Krause model (H-K model) [29], the Jager-Amblard model (J-A model) [30], etc. The D model introduces the attitude of interactive individuals into the trust threshold, and defines the opinion difference value of interactive individuals within the trust threshold, and then takes the opinion difference value to update their own views. The H-K model is similar to the D model. Their common point is that only nodes with similar views can communicate. The difference is that individuals in the D model communicate with only one neighbor at a time, while in H-K model, individuals communicate with multiple individuals. It is assumed that netizens communicate with each other within a specific trust range. The W-D model supposes that attitude gap between two individuals will have a direct influence. The J-A model, which an improvement based on the W-D model, is proposed to increase the assimilation effect in the opinion margin and the repulsion effect outside the opinion margin. In addition, multidimensional models and hybrid models have also emerged in recent years. For example, Sîrbuet al. [31] modified the well-known continuous opinion dynamics model of bounded confidence to enhance probability to choose individuals whose opinions were already close to each other, thus mimicking the behavior of online media, which suggests interaction with similar peers. Li and Xiao [32] extended the polarization model to be multi-dimensional and observed the phenomenon of public opinion polarization in multiple dimensions. Andreas et al. [33] discussed more models in their review literature, and the achievements of scholars in the evolutionary model of public opinion were introduced in detail.
Although the above scholars have made great contributions to the polarization of public opinion, there are still some shortcomings. In particular, the treatment of individual heterogeneity in polarization modeling is not sufficient, resulting in the inaccurate representation of the significant differences among individuals in the same network at the same time. Usually, this difference affects the polarization phenomenon of public opinion. In addition, throughout the evolution of public opinion, along with the emergence of polarization, the attitude of all individuals gradually split into two or more camps, and the conformities of individuals whose attitudes do not belong to these camps will be increased less than those who do at the initial time. That is, when all individuals hold the same attitude, they are more inclined to obey it than they were before. At present, however, there is little consideration of individual heterogeneity and dynamic conformity, and qualitative analysis is taken as the main method. Although qualitative analysis can explain the cause of polarization phenomenon from a macro perspective, it cannot reflect the whole process of polarization behavior from birth to development and to extinction, lacking intuitiveness and positivism. Therefore, based on the J-A model, this article proposes a new network public opinion polarization model by considering individual heterogeneity and dynamic conformity.

3. Public Opinion Polarization Model with the Consideration of Individual Heterogeneity and Dynamic Conformity

3.1. The Classic W-D and J-AModels

Among the models that describe public opinion polarization, the classic ones are the W-D and J-A models. In the classic W-D model, all the individuals in the network are taken as agents and simulated by the Monte Carlo method. The specific idea is as follows: suppose the event propagation group is composed of n agents, and xi(t) represents agent i’s attitude value at time t. In addition, the value xi(t) ∊ [−1,1] follows continuous distribution. In each iteration, two random pairs of agents are paired up to spread their attitudes. When the attitude distance |xixj| of the randomly selected agents i and j is less than a given threshold d, the two agents update their own attitudes and interact with each other. But, if the attitude distance |xixj| is not within the threshold d, the interaction behavior does not occur and the two agents’ attitudes do not change.
The specific description is as follows:
When |xixj| ≤ d, there are
xi(t + 1) = xi(t) + μ[xj(t) − xi(t)]
xj(t + 1) = xj(t) + μ[xi(t) − xj(t)]
Otherwise (i.e., |xixj|>d) the interaction does not occur, there are
xi(t + 1) = xi(t)
xj(t + 1) = xj(t)
where μ∈(0,0.5) is an influence parameter, reflecting the degree to which an agent adheres to his attitude.
However, the W-D model only considers that when the difference of agents’ opinions is within a threshold, they are willing to accept others’ similar attitudes, thus it making the two sides more similar, but it never considers the situation when the gap is very large. In fact, netizens rarely just consider like-minded netizens when they interact with each other. When gap is very large, they may argue with each other and reinforce each other’s attitude, making the two sides even more at odds. Based on this, Jager and Amblard proposed the classic J-A model on the basis of W-D. Since the J-A model not only considers the assimilation effect in the social appraisal theory, but also considers the repulsion effect and neutrality effect, it is more appropriate to the polarization phenomenon and has more practical significance to the explanation of the polarization process.
The J-A model is described in detail as follows:
(1) Assimilation Rules
If the attitude distance between the randomly selected agent i and j is less than a given threshold d1, that is, when |xi − xj|<d1, then the attitudes of agents i and j change correspondingly, and the updated formulas are:
xi(t + 1) = xi(t) + μ(xj(t) − xi(t))
xj(t +1 ) = xj(t) + μ(xi(t) − xj(t))
where μ∈(0,0.5) is the influence parameter.
(2) Repulsion Rules
If the attitude distance between the randomly selected agents i and j is greater than another given threshold d2, i.e., when |xi − xj| >d2, the updated formulas of agents i and j are:
xi(t + 1) = xi(t) + μ(xj(t) − xi(t))
xj(t + 1) = xj(t) + μ(xi(t) − xj(t))
(3) Neutrality Rules
In other cases, the attitudes of agents i and j do not change, and the updated formulas are as follows:
xi(t + 1) = xi(t)
xj(t + 1) = xj(t)

3.2. A Polarization Model Combining Individual Dynamic Conformity with Heterogeneity

At present, most studies give a fixed value to calculate the individual conformity. However, according to the individual’s own habits, alienation, and the influence of neighboring nodes, the opinions of conformity are different. Moreover, people tend to be more amenable to the opinions of individuals who are more authoritative than they are; that is idea of the opinion leader [34,35]. For example, the words of close friends are more persuasive than those of a stranger. In addition, due to individual heterogeneity, the probability of whether the different individuals tend to follow the mainstream public opinion or listen to their friends is different.
According to the basic idea of the J-A model, this article proposes a new public opinion polarization model, described as follows:
It is assumed that at time t, the number of all agents involved in the interactive behavior of the network event is n. At the initial time, their attitudes xi~N(0,1), and value xi is in interval [−1,1]. At time t, the attitude value of agent i is expressed as xi(t), and the xi(t) ∊ [−1,1]. The social average attitude value T(t) is expressed as follows:
T ( t )   =   1 n i   =   1 n x i ( t ) ,
The ρ(t) is used to indicate the polarization degree of the attitudes in the whole network when the public opinion evolves to time t, which is inversely related to the standard deviation of the attitude value as follows:
ρ ( t )   =   1   1 n i   =   1 n ( ( x i ( t )   T ( t ) ) 2 ,
The Π(t), dominant social attitude, is the influence degree of social mainstream attitudes on agent i at time t, which is proportional to the overall polarization degree of society ρ(t) and the social average attitude value T(t), shown as follows:
Π(t) = ρ(t)*T(t),
When ρ(t) is very low, it indicates that the distribution of attitudes in the network at time t is scattered significantly and does not form the mainstream public opinion. Therefore, the probability that agent i tends to obey the mainstream public opinion is low, which is called social conformity. With the evolution of public opinion, opinions gradually reach unity. Additionally, as a result of the “spiral of silence” effect [36], individuals in the network fear being isolated, so the tendency to obey the mainstream public opinion has risen. The influence of social mainstream public opinion on individuals is proportional to the degree of social polarization, and is proportional to the average value of society.
In addition, the strength of weak ties theory [37,38] believes that the relationship among netizens can be simply divided into strong ties and weak ties in terms of the frequency of communication and interaction. The strong tie usually represents high interaction between the interactive agents, whereas the weak tie indicates weak interaction between individuals, which is a kind of connection that exists widely in the network and has a wider role. In the public opinion polarization model proposed in this article, it is considered that the agents who interact directly with agent i are agent i’s strong tie interactors, while the other agents in the same network still have an imperceptible influence on agent i, which is the weak tie relation of agent i. Therefore, the influence of mainstream public opinion on agent i is based on the weak tie. Moreover at time t, agent i adjusts his attitude properly according to the social mainstream attitude transmitted by the weakly connected agents in the network. However, although these agents have some influences on agent i, agent i does not interact directly with these agents who are only weakly connected. When a hot event occurs, some communities around the event will emerge due to the agglomeration of the network. Agents in the community communicate their attitudes to other agents by publishing essays, blog posts, and mutual comments. This article assumes that the relationship of direct interaction is a strong tie relation. At this point, agent j, who interacts directly with agent i, becomes the neighbor of agent i, and has a greater influence on agent j.
It is assumed that when agent i interacts with his neighbor agent j, the influence of agent j on agent i will be affected by agent j’s authority pj and agent i’s own authority pi (usually, the value of pi is equal to degree centrality of agent i). In a simulation experiment, each agent’s authority is calculated on the basis of the degree centrality, and the magnitude of the influence between i and j is related to the difference of degree centrality between the two. The Zij is expressed as agent j’s influence on agent i, shown as follows:
Z i j   =   { p i p j A ( i , j ) p j 0 0   p j   =   0 ,
where A represents the adjacency matrix of the constructed social network, which only consists of 0 and 1, shown in formula (9). The adjacency matrix is undirected graph with symmetry. If A (i,j) = 1, then A (j,i) = 1, which means that agent i and agent j are connected and neighbors; if A (i,j) = 0, then A (j,i) = 0, which means there exists no connection between these two agents.
A   =   ( 1 0 0 1 ) n   ×   n
At any given time, it is assumed that agent i can receive attitudes transmitted by all neighbor agents connected to it and then be affected. The influence degree of agent j on agent i’s attitude depends on the attitude xj(t) that agent j transmits to agent i at time t and the influence, Zij, between them. The influence degree of agent i by all neighbors is represented by neighbor attitude Zi(t), which is described as follows:
Z i ( t )   =   { j   =   1 n ( Z i j x j ( t ) ) j   =   1 n Z i j j   =   1 n Z i j 0 0   j   =   1 n Z i j   =   0 ,
After adjusting according to formula (11), the total attitude Xi(t) received by agent i at each time consists of the received mainstream attitude Π(t) and the neighbor attitude Zi(t)) transmitted by the neighbor agents of agent i:
Xi(t) = μΠ(t) + (1 − μ) Zi(t),
where μ is the influence parameter, indicating the probability that agent i tends to be consistent with the dominant social attitude Π(t), and 1 − μ indicates the probability that agent i tends to be consistent with the strongly connected neighbor agent’s attitude Zi(t).
When agent i’s attitude xi(t) is close to the total received attitude Xi(t) (in the assimilation effect zone), it will be encouraged to reinforce its attitude and adjust the attitude closer to Xi(t). On the contrary, when the difference is very large (in the repulsion effect zone), the reverse psychology will strengthen their attitude value and adjust the attitude far from Xi(t). At the same time, agent I only interacts directly with its neighboring agents; that is, the opinion is only approved or disapproved by the neighboring agents. When the agent i and the neighbor’s attitude Zi(t) have the same positive or negative tendency, they will be affirmed, thus enhancing the certainty degree about their own attitudes. At time t, agent i selects the assimilation rule, the repulsion rule, or the neutral rule according to the difference calculated by total received attitude Xi(t) and his own attitude to adjust his attitude at the next time, shown as follows:
(1) Assimilation Rules
When |Xi(t) − xi(t)| ≤ d1, there are
xi(t + 1) = fi(t) * xi(t) + ζi(t) * (Xi(t) − xi(t)),
fi(t) = (ek1i(t)/ki(t) − 1) + Yi,
ζi(t) = 1 − fi(t),
where fi(t) indicates the degree that agent i confirms his attitude at time t. If agent i confirms his attitude when interacting with neighbor agents, he will strengthen his attitude; otherwise, he will doubt the correctness of attitude because of being attacked all the time. This article assumes that all agents in the network have a one-to-many interaction at each moment (agent i interacts with all neighbor agents at the same time). After the interaction occurs, agent i adjusts his attitude according to dominant social attitude Π(t)and neighbor attitude Zi(t) passed to him by all the neighbor nodes it receives. ki(t) denotes the number of times agent i receives neighbor attitude Zi(t). Because each agent interacts one-to-many with its neighbors at each moment, the ki(t) of all agents is the same, and its value is equal to the number of iterations t.k1i(t) indicates that during the initial time to time t, agent i is positively counted when performing attitude interaction (assuming that agent i’s attitude xi(t) has the same positive and negative tendency as the received neighbor attitude Zi(t) when interacting with neighbor agents); k1i(t)/ki(t) indicates the positive probability, which changes as the interaction goes on; and Yi indicates the inherent confidence of agent i, which is an inherent property of agent i and does not change with the interaction. If agent i is very confident about his attitude, and the fi(t) is at a relatively large value, then their conformity ζi(t) will be reduced, so ζi(t) is inversely related to fi(t), as shown in the Formula (14). At time = 0, since the agent does not participate in the interaction and not be influenced by other agents’ attitude, so the conformity is only related to himself, and the conformity of agent i is ζi(0) = 1 − Yi.
(2) Repulsion Rules
When |Xi(t) − xi(t)|≥d2, there is
xi(t + 1) = fi(t) * xi(t) − ζi(t) * (Xi(t) − xi(t)),
(3) Neutral rules
In other cases, the attitude value does not change, as follows:
xi(t + 1) = xi(t),
The simulation process (the simulation code used in this article can be found in the following link: https://github.com/lilyqweeoooo/projects.git) is shown in Figure 1.

4. Numerical Simulation Experiments

This section mainly examines the effects of dynamic conformity and individual heterogeneity discussed in Section 3 on the polarization process based on numerical simulation experiments.

4.1. The Influence of Individual Dynamic Conformity

This article proposes the concept of individual dynamic conformity, and presents that with the decrease of the deviation degree of the attitudes of all individuals in the network and the formation of the mainstream attitude, agent i’s confidence in his own opinions is influenced by the mainstream public opinion, and he is more inclined to accept others’ attitudes, which is expressed in formulas (13)–(17). The simulation experiments test the influence of public opinion polarization from two aspects of dynamic conformity and static conformity, revealing the mechanism of polarization. According to the dynamic conformability function ζi(t) represented by formulas (14) and (15) at time t = 0, the conformity ζi(0) = 1 − Yi. So in the formula of static conformity, agent i’s conformity of all moments, is 1 − Yi, as shown in formulas (18) and (19). For visualization, Yi takes 0.6, and the result is shown in Figure 2, Figure 3, Figure 4, Figure 5, Figure 6 and Figure 7. The network used in the simulation is fully connected network, and the other parameters are set as follows: n = 500,μ = 0.1, d1=0.10, andd2=0.70.
xi(t + 1) = Yi * xi(t) + (1 − Yi) * (Xi(t) − xi(t)),
xi(t + 1) = Yi * xi(t) − (1− Yi) * (Xi(t) − xi(t)).
Figure 2 and Figure 5 show the evolution of public opinion under static and dynamic conformity, respectively. Figure 3 and Figure 6 show the probabilities of the numbers of individuals approaching polarization in a network evolving over time. Figure 4 and Figure 7 show the distribution of attitudes in the network under different time in two types of conformities. According to the simulation results of the static conformity shown in Figure 2, Figure 3 and Figure 4, at time = 10, except for a few neutral individuals, the polarization of other individuals has basically been formed, and the time to form polarization of these individuals is very close to each other. Figure 5, Figure 6 and Figure 7 show that the initial polarization effect is formed at time = 30, but the polarization degree is obviously greater than the former which demonstrates that the attitudes formed after enough interaction are more persistent. That is to say, it is more difficult for individuals in reality to change their attitudes when they have fully expressed their opinions and collected enough information. Therefore, this model proposed in this article is more realistic. At the same time, the study of dynamic conformity can help reveal the mechanism of polarization evolution, and even can intervene in the polarization process.
The intrinsic self-confidence parameter Yi, one of the important parameters in the dynamic conformity function ζi(t), has a crucial influence on the polarization, representing the affirmation of the attitude of individual i at the initial time, thus it affects the conformity degree. To study the influence of Yi on polarization, four different values of 0.2, 0.4, 0.6, and 0.8 were set as Yi, and the proportion of individuals polarized under different values of Yi was observed, as shown in Figure 8. The network used in the simulation was a fully connected network, and the other parameters were set as follows: n = 500, μ = 0.3, d1 = 0.2, and d2 = 0.70.
As can be seen from Figure 8, the proportion of individuals with attitude polarization is related to the intrinsic self-confidence parameter Yi after all agents in the network have fully interacted. We set the social average attitude value T(0) = 0 in this simulation. When the value of Yi is small, due to the “spiral of silence” effect [36], the individual is not confident enough to hold his own attitude, so it is easy for a stronger view to overcome the other side. However, as Yi increases, the strength of the stronger view weakens, and gradually, both the polarization levels are evenly matched.
In addition to the intrinsic self-confidence parameter Yi, there is the influence parameter of social conformity μ, defined formula (12), which indicates the probability of the tendency to be consistent with the dominant social attitude Π(t). In order to analyze the influence of parameter μ on polarization phenomenon, four different values, 0.2, 0.4, 0.6, and 0.8, were set, and the results are shown in Figure 9 and Figure 10. Figure 9a–d shows the evolution of public opinion under four different values μ. Figure 10a–d shows the polarization probability of the proportion of all individuals in the network forming the opinion polarization under four different values of μ. In the fully connected network used above, all individuals in the network were directly connected; that is, all individuals were neighbors of each other, and the difference between dominant social attitude Π(t) and connected neighbor agent’s attitude Zi(t)could not be accurately analyzed. Therefore, this section uses the Barabasi-Albert (BA) scale-free network in the simulation (the other parameters are set as follows: the number of nodes is n = 500, the clustering coefficient is 0.12839, and the average degree is 35.872).
It can be seen from Figure 9, in the BA network where the aggregation and average were much lower than those of a fully connected network, the proportion of polarized individuals in the network was much lower than that of a fully connected network. However, with the increase of parameter μ, the polarizability increased significantly. It means that if an individual is more inclined to be consistent with the mainstream of society, his probability of reaching polarization after many discussions will increase.
In order to avoid contingency, we adjusted the remaining parameters to observe whether the proportion of polarized individuals whose attitude values were greater than 0.9 or less than −0.9 was different, as shown in Figure 10.
As shown in the Figure 10, through debugging the parameters, we found that the existence of the social influence parameter μ has a significant impact on the polarization phenomenon of public opinion. Regardless of how the factors such as conformity change, the group with larger social parameter μ will achieve greater polarization.

4.2. The Influence of Individual Heterogeneity

Because of their different experiences, environments, and personalities, even facing the same thing, each individual will have a different position and hold a different attitude, so each individual is heterogeneous. Therefore, it is necessary to analyze the effect of such heterogeneity on polarization.

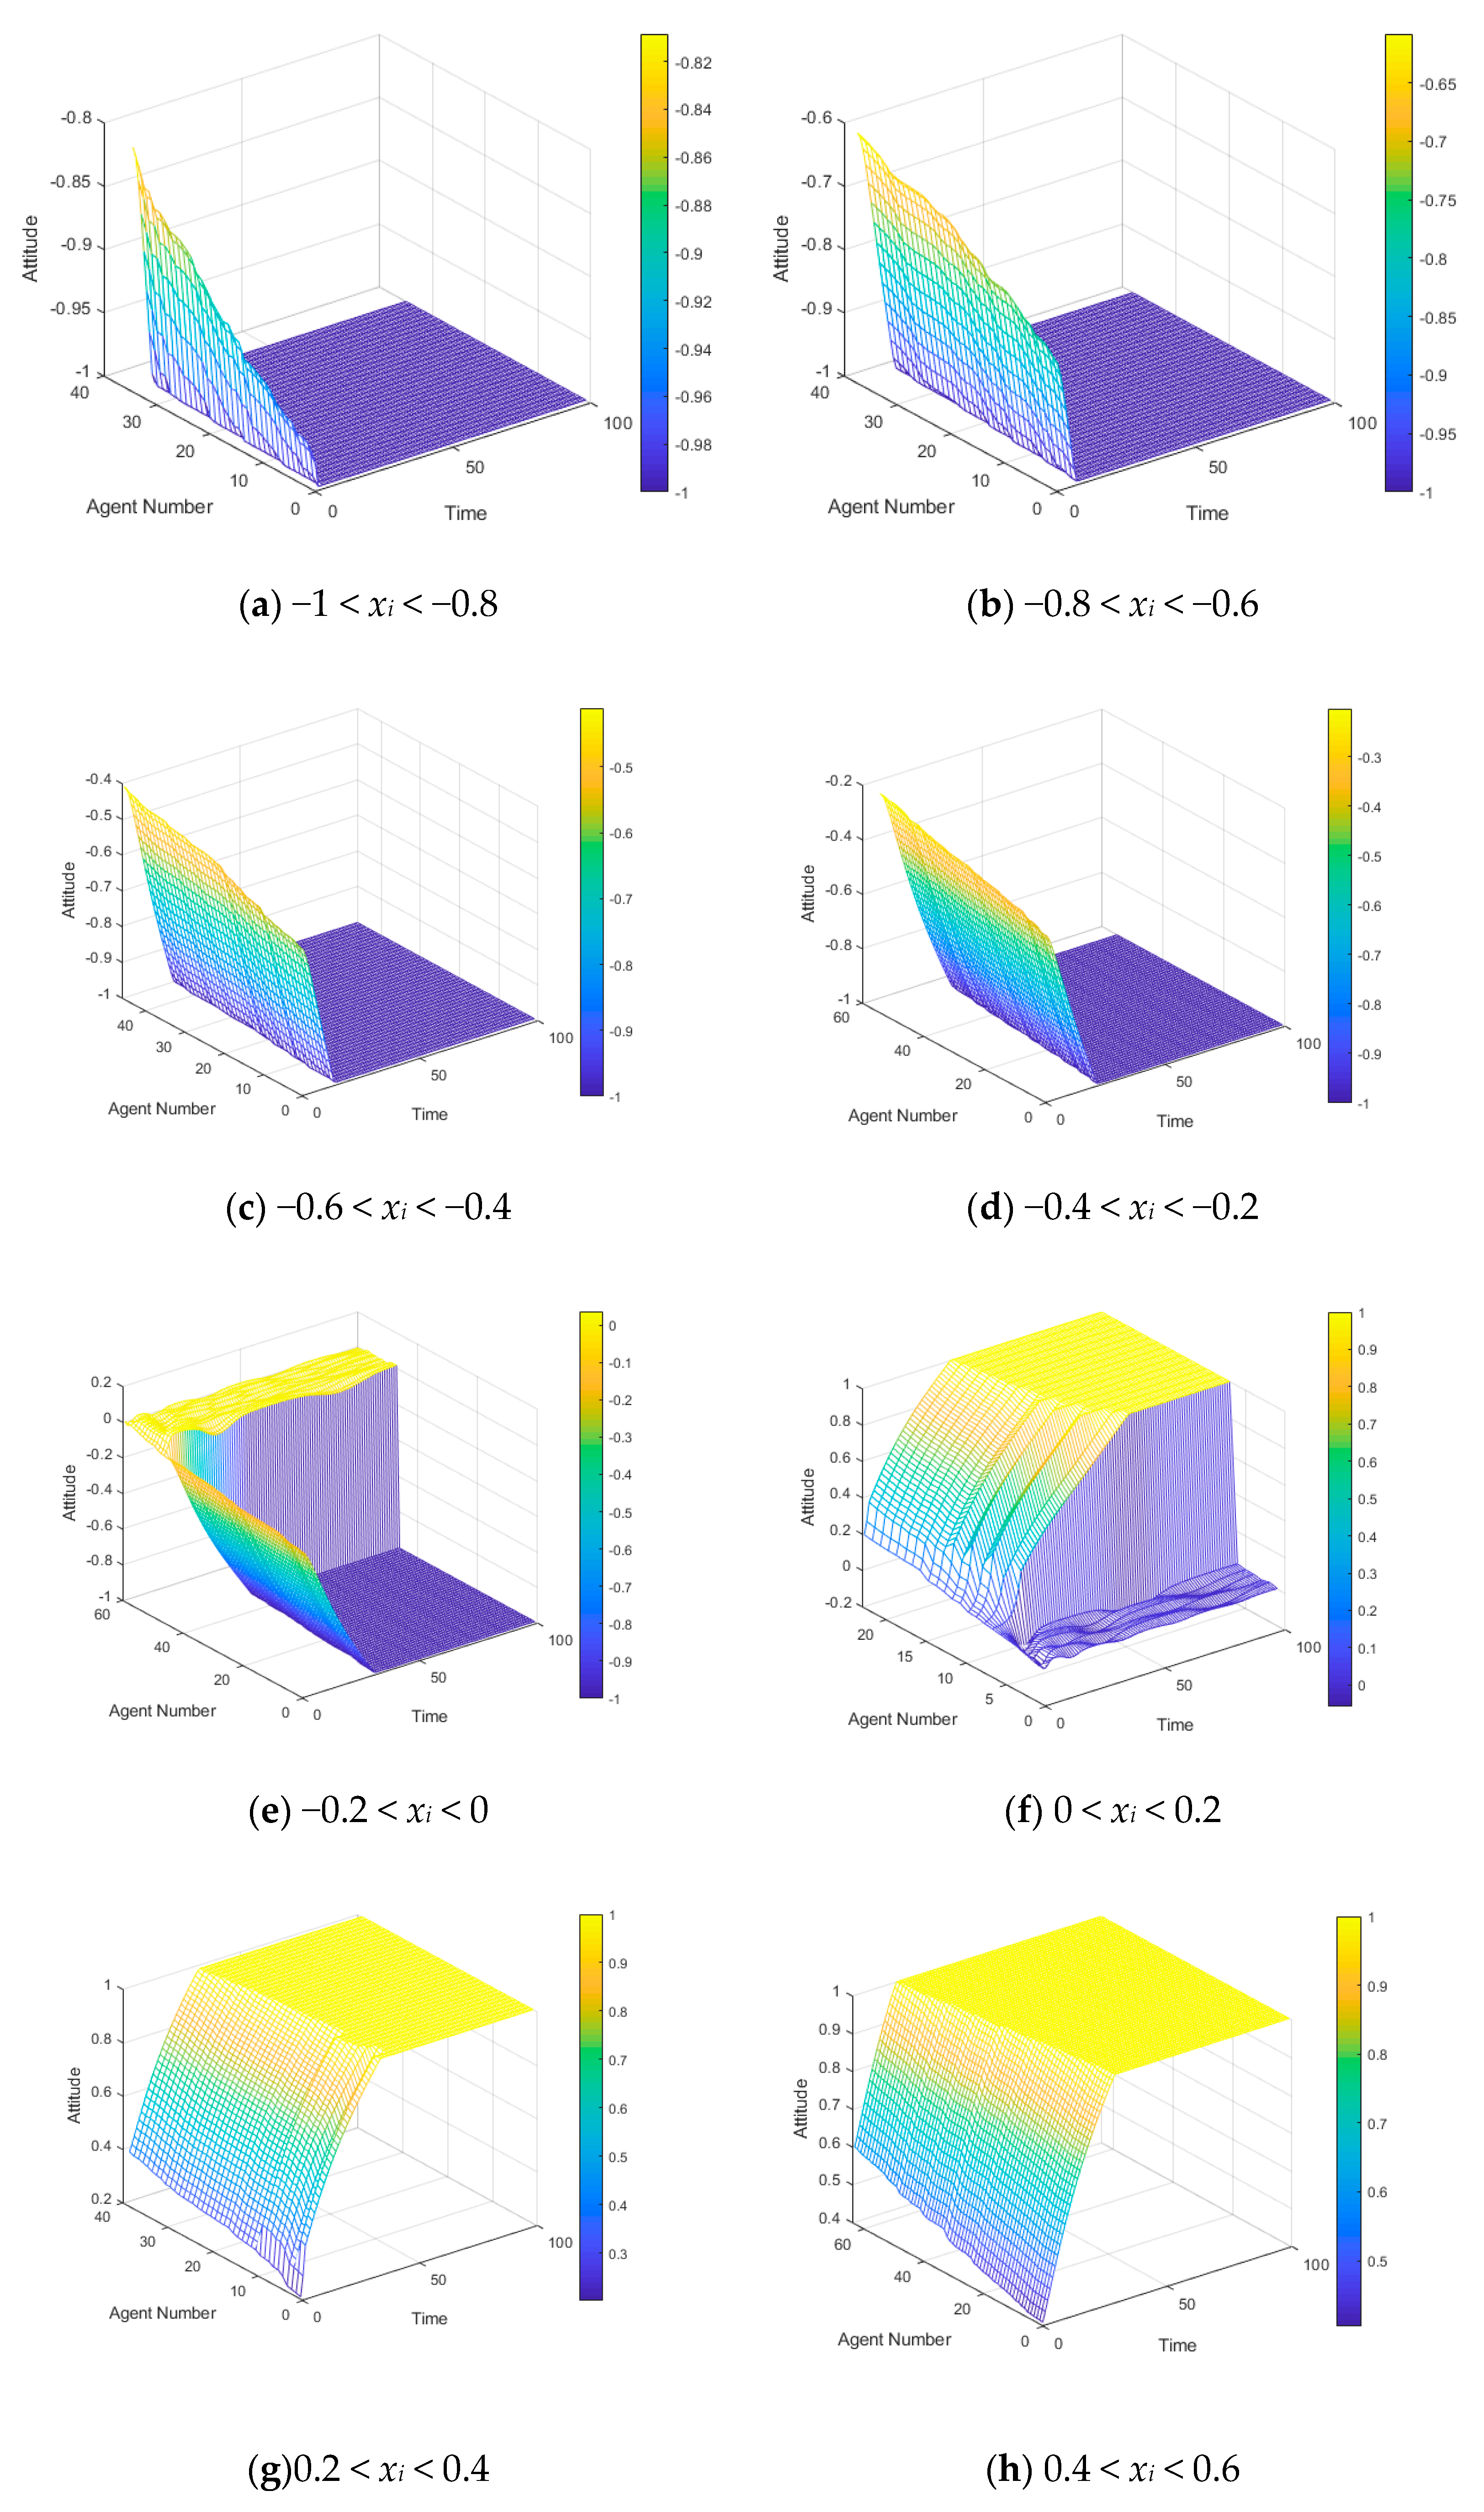
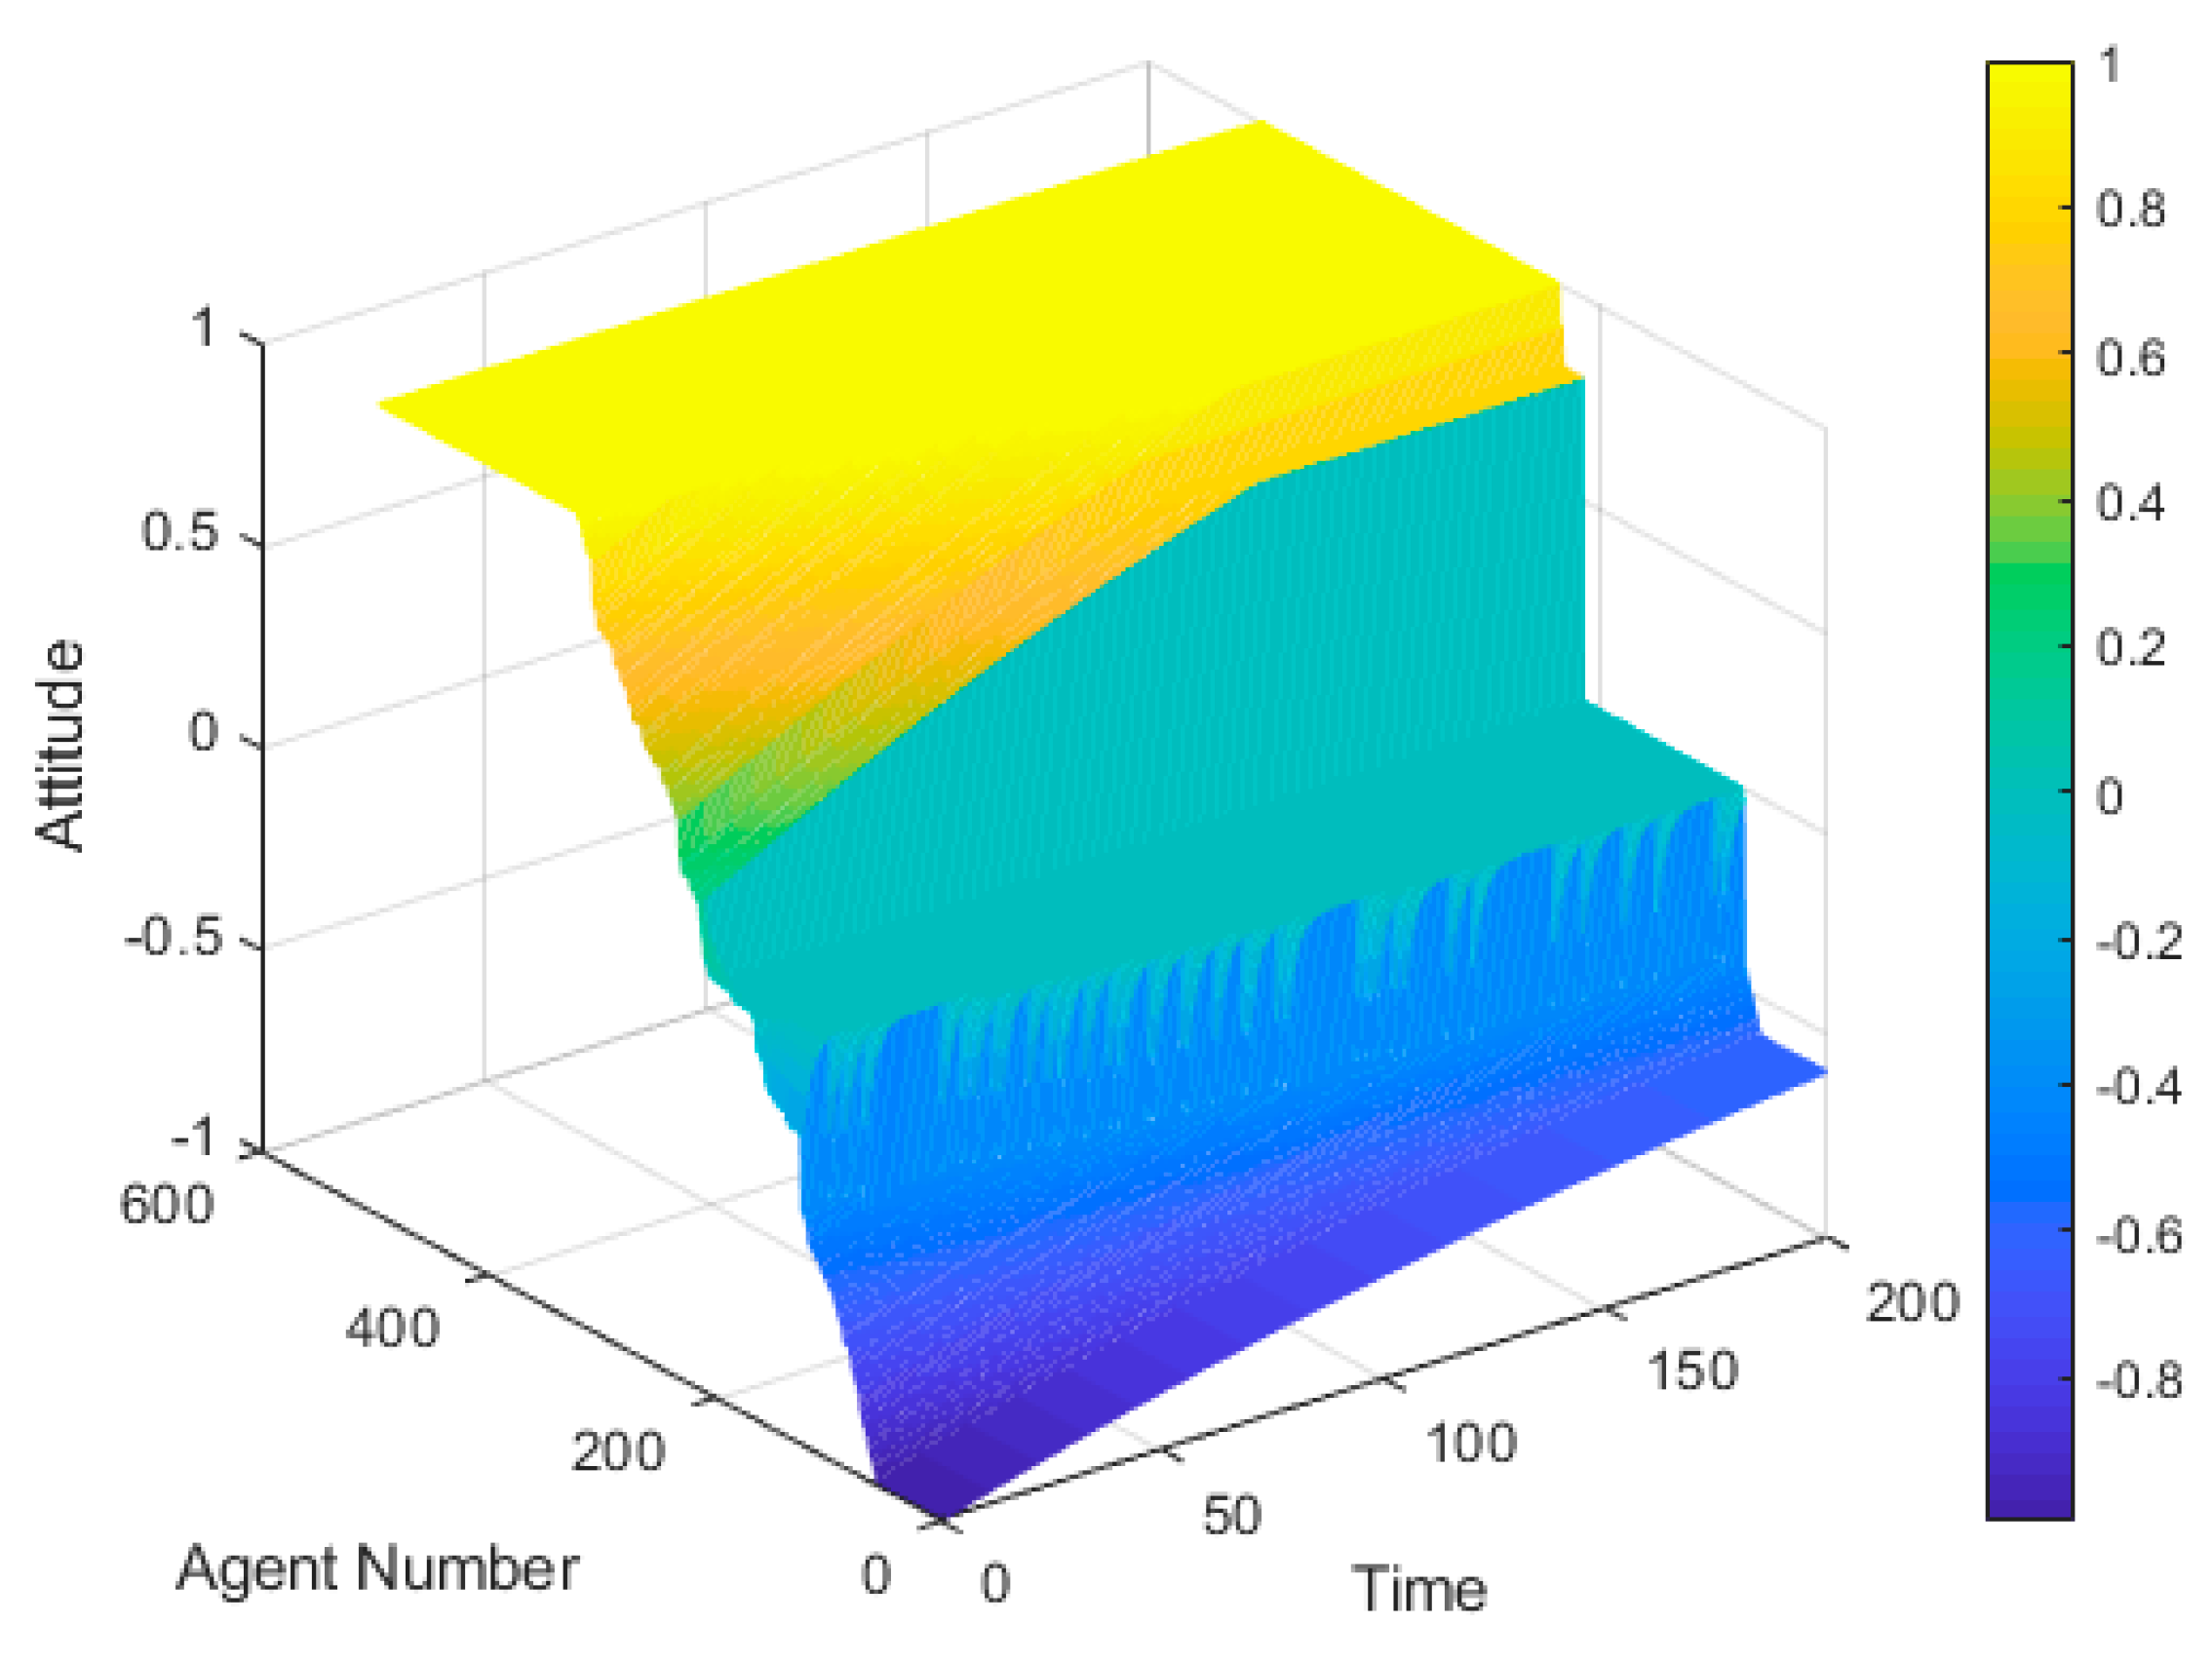
4.2.1. The Influence of Initial Cognitive Heterogeneity

When facing a hot event and no communication with any other individuals, an individual will have an initial opinion. At this time, the attitude of agent i is only related to himself and is not affected by others. In order to find out what kinds of attitudes individuals hold at the initial time are more likely to polarize, we simulated 500 network nodes (netizens or individuals) and assumed that under the initial conditions, the positive attitude node had a slight advantage. The average attitude T(0) = 0.01 of all individuals in the network is at the initial time; the specific evolution of public opinion and the distribution of attitudes at each time are shown in Figure 11 and Figure 12. The network used in the simulation was fully connection network, and the other parameters were set as follows: n = 500, Yi~U(0,1), μ = 0.2,d1 = 0.2, and d2 = 0.70.
As can be seen from Figure 11 and Figure 12, the attitudes are relatively scattered at the initial time. With the evolution of public opinion, two opposing camps of positive and negative polarizations are formed, and there are always a few individuals with neutral attitude.
To observe this change more clearly, a three dimensional graph of the change in attitudes is plotted on X axis, Y axis, and Z axis for time, individual number, and each individual’s attitude, as shown in Figure 13:
As can be seen from Figure 13, in the evolution of public opinion, there are significant differences in the evolution of individuals with different initial attitudes in the network, and there is a fault phenomenon. So we divided the 500 nodes into 10 groups according to the magnitude of the initial attitude value xi, and observed the evolution of the viewpoints of 10 groups of individuals representing different initial attitudes in the experiment. The results are shown in Figure 14:
Figure 14a–j respectively, shows the change of attitudes of the 500 individuals at the initial time under the following conditions: 1 < xi < −0.8, 0.8 < xi < −0.6, −0.6 < xi < −0.4, −0.4 < xi < −0.2, −0.2 < xi < 0, 0 < xi < 0.2, 0.2 < xi < 0.4, 0.4 < xi < 0.6, 0.6 < xi < 0.8, and 0.8 < xi < 1. Figure 14a–d is a set of four data indicating the initial time attitude value xi < −0.2. In the evolution of public opinion, they are accompanied by polarization phenomena, all of which are transformed into negative polarization, and according to Figure 14a–d sequence, the occurrence time of polarization phenomenon decreases in turn, indicating that the individuals whose attitude value is close to the polarization value at the initial time are more likely to be polarized and the individuals whose polarization degree is weaker will be induced toward a pole in the public opinion evolution. Figure 14g–j is a set of four data indicating the initial time attitude value xi > 0.2, similar to the negative polarity, and the time for the positive polarization of Figure 14g–j is also reduced in turn. Figure 14e,f shows that the individuals do not have strong polarization at the initial time. The individual attitude values in Figure 14e are gradually divided into two parts as the public opinion evolves; that is, one part finally forms negative polarization, the other continues to be neutral. Figure 14f means one part form positive polarization and others maintain neutrality, and the existence of these neutral individuals is essential for intervening in the polarization process.
In order to avoid the contingency of the experimental results, the data were regenerated here for experiments. As the average attitude value of the data in Figure 11, Figure 12, Figure 13 and Figure 14 is close to the neutral state (T(0) = 0.01) at the initial time, so in the following experiment, we set the initial social average attitude value T(0) = 0.40 for comparison, and the results are shown in Figure 15 and Figure 16:
Figure 15 shows the changes of all individuals’ attitudes in the network at T(0) = 0.40, while Figure 16a–j respectively, shows the change of the 500 individuals’ attitudes at the initial time under the following conditions: −1 < xi < −0.8, 0.8 < xi < −0.6, −0.6 < xi < −0.4, −0.4 < xi < −0.2, −0.2<xi<0, 0<xi<0.2, 0.2 < xi < 0.4, 0.4 < xi < 0.6, 0.6 < xi < 0.8, and 0.8 < xi < 1. Comparing Figure 15 and Figure 16 with Figure 13 and Figure 14, it can be seen that there is a clear difference between the evolutionary processes of public opinion in the network when the attitude tends to be clear and unclear at the initial time.
As can be seen from Figure 15 and Figure 16, the positive attitude is dominant in the whole network, and almost all the individuals except a few neutral ones make their attitudes towards positive change due to the social average attitude value T(0) = 0.4 at the initial time. Figure 16a–e shows individuals with negative attitudes at the initial time generally move towards the positive direction, but do not change at all when the attitude value approaches to the neutral value of 0. This shows that the positive or negative direction of the attitude value is crucial at the initial time. When the individual in the network trusts a directional opinion, this opinion may be changed after being persuaded by others until it becomes neutral, but it is very hard to get this individual to trust the opposite. In reality, if people believe preconceived misinformation before the truth is revealed, it is not easy for them to believe the truth, which is why many widespread rumors continue to spread steadily. Figure 16f–j shows an individual’s positive attitude value at the initial time. Except for Figure 16f, the individuals shown in the other graphs reach positive polarization after many interactions. In the Figure 16f, it shows when an individual’s attitude value at the initial time is 0 < xi < 0.2, which, by comparison, is similar to the individual’s attitude value at the initial time is −0.2 < xi < 0, shown in Figure 16e in evolution. The individuals with attitudes close to neutral values at the initial time show a completely neutral attitude after many interactions (the attitude value is 0), indicating that if we need to prevent polarization by artificial intervention, then the existence of these neutral individuals is crucial.
As can be seen from Figure 13, Figure 14, Figure 15 and Figure 16, even if the public’s opinion is scattered at the initial time, polarization still occurs. Moreover, the individuals with different attitude values at the initial time do have heterogeneity. The changes in the evolution of public opinion will be different as well. If the social average attitude value T(0) in the network is nearly neutral at the initial time, it will help form a two-way polarization. But, if one attitudinal tendency is dominant at the initial time, then the other non-dominant attitudinal tendency will not produce polarization and unidirectional polarization will result after many rounds of evolution.

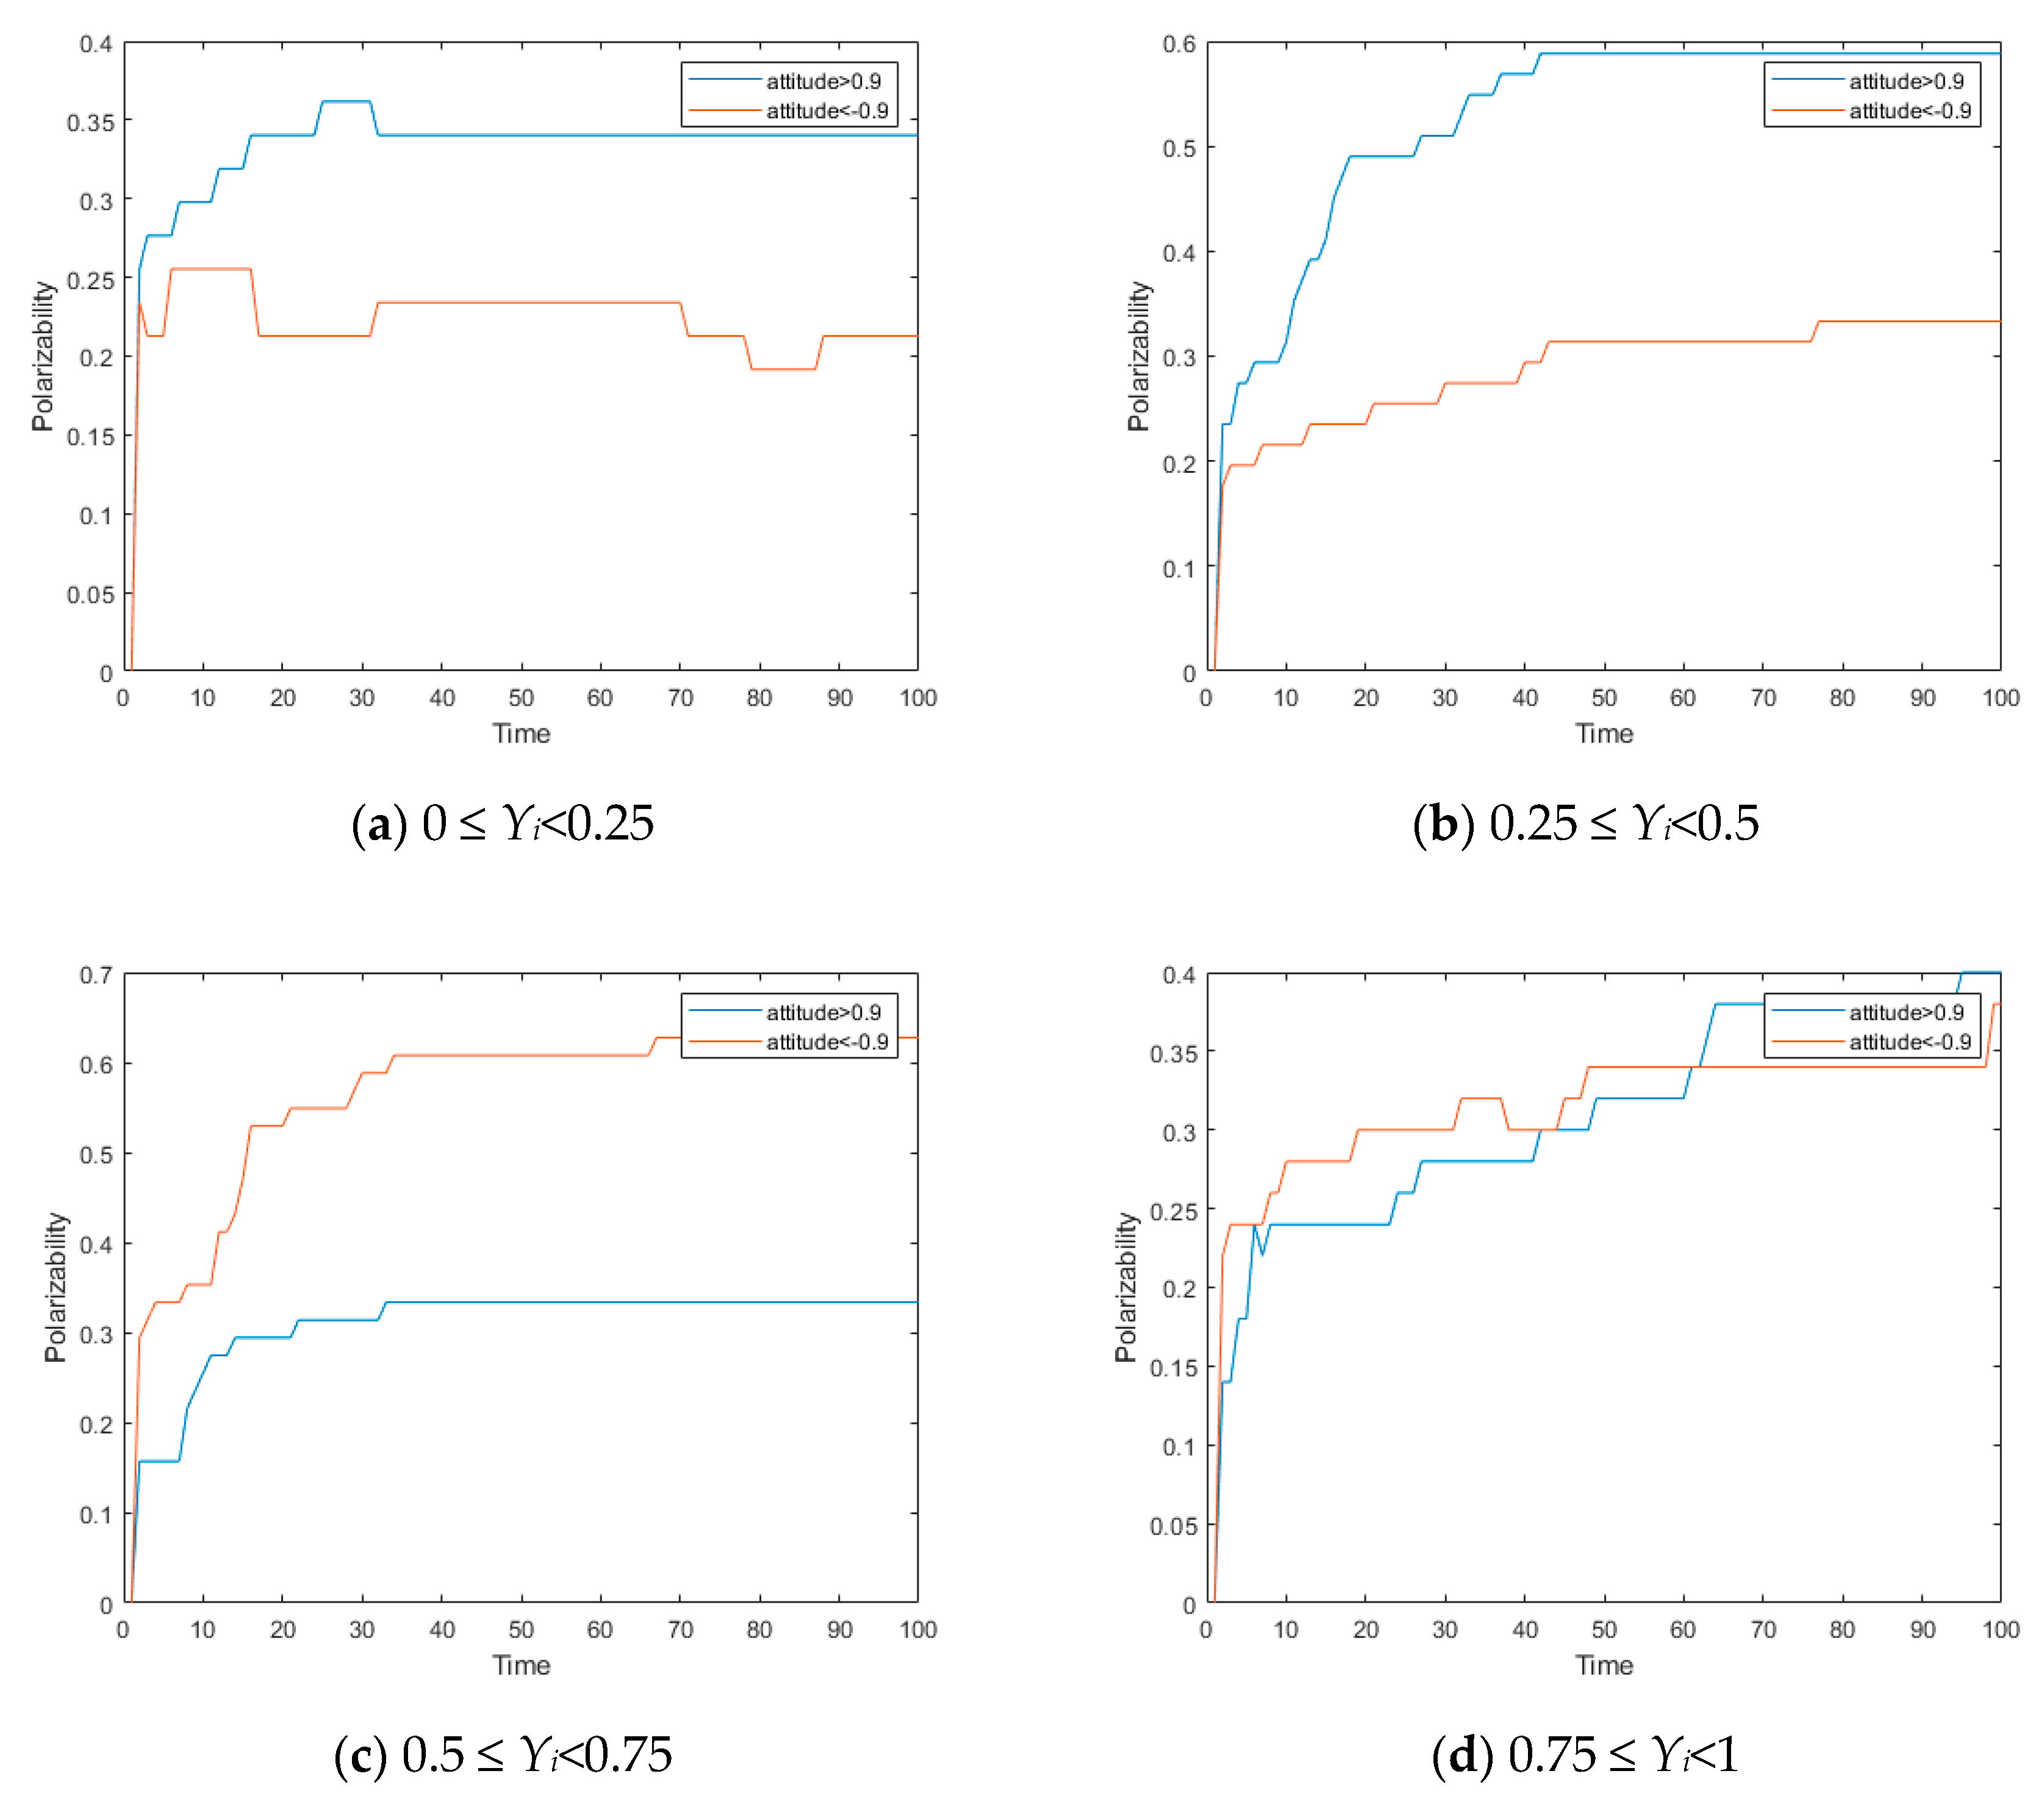
4.2.2. The Different Conformity Influences of Heterogeneous Individuals

In Section 4.1, we proposed that the network polarization is inversely related to the inherent confidence of the important parameter Yi in the dynamic conformity function ζi(t), and that each individual participating in the interaction is heterogeneous and has different inherent confidence. In this section, we simulate a network with 500 nodes, and set the social average attitude value T(0) = 0 at the initial time. It was assumed that in the simulation experiment, that the value of each individual’s intrinsic self-confidence was Yi~U(0,1). The polarization probability of the network public opinion evolution is shown in Figure 17. The network used in the simulation was a fully connected network, and the other parameters were set as follows: n = 500, Yi = 0.3, μ = 0.6, d1 = 0.20, and d2 = 0.70.
As can be seen from Figure 17, the 500simulated individuals reached polarization at time 50, with a positive polarization being 40% and a slightly lesser negative polarization of 35%. The number of 0 ≤ Yi < 0.25, 0.25 ≤ Yi < 0.5, 0.5 ≤ Yi < 0.75, and 0.75 ≤ Yi < 1 accounts for 25% of the total amount. Figure 18a–d indicates the polarization probability of these four groups of individuals in the evolution.
As can be seen from Figure 18, the individuals whose intrinsic self-confidence Yis were 0 ≤ Yi < 0.25, 0.25 ≤ Yi < 0.5, 0.5 ≤ Yi < 0.75, and 0.75 ≤ Yi < 1 had different times of reaching polarization, and the proportion of the final polarizations were different in this simulation. Additionally, according to the different values of Yi, there is a certain regularity. According to Figure 17, the proportion of negative polarization is greater than that of positive polarization at initial stage (time < 15), and is reversed by positive polarization at time = 15, and thereafter, the proportion of the positive polarization of individuals becomes slightly greater than that of negative polarization. In Figure 18, the case where the positive polarization is greater than the negative polarization is only shown in Figure 18a,b indicating that individuals with different inherent self-confidence in network evolution have different positive and negative tendencies, and individuals with high inherent self-confidence are more likely to have a negative attitude. In addition, according to Figure 18a–c, the polarization rate formed in the network’s evolution increases with the increase of inherent self-confidence, indicating that when the individual has a small inherent self-confidence, his conformity is larger, and the polarization rate finally formed is larger. However, the polarization probability decreases when the inherent confidence increases to a certain threshold, as shown in Figure 18c,d.
According to the above experiments and analysis, heterogeneity exists in the intrinsic self-confidence parameter of the conformity function, and different intrinsic self-confidence leads to different individual conformity, while the individuals with very low conformity and very high conformity are less probable than others to form extreme values. In addition, there is a limited range in which the probability for an individual to arrive an extreme value increases, along with the reduction of conformity.

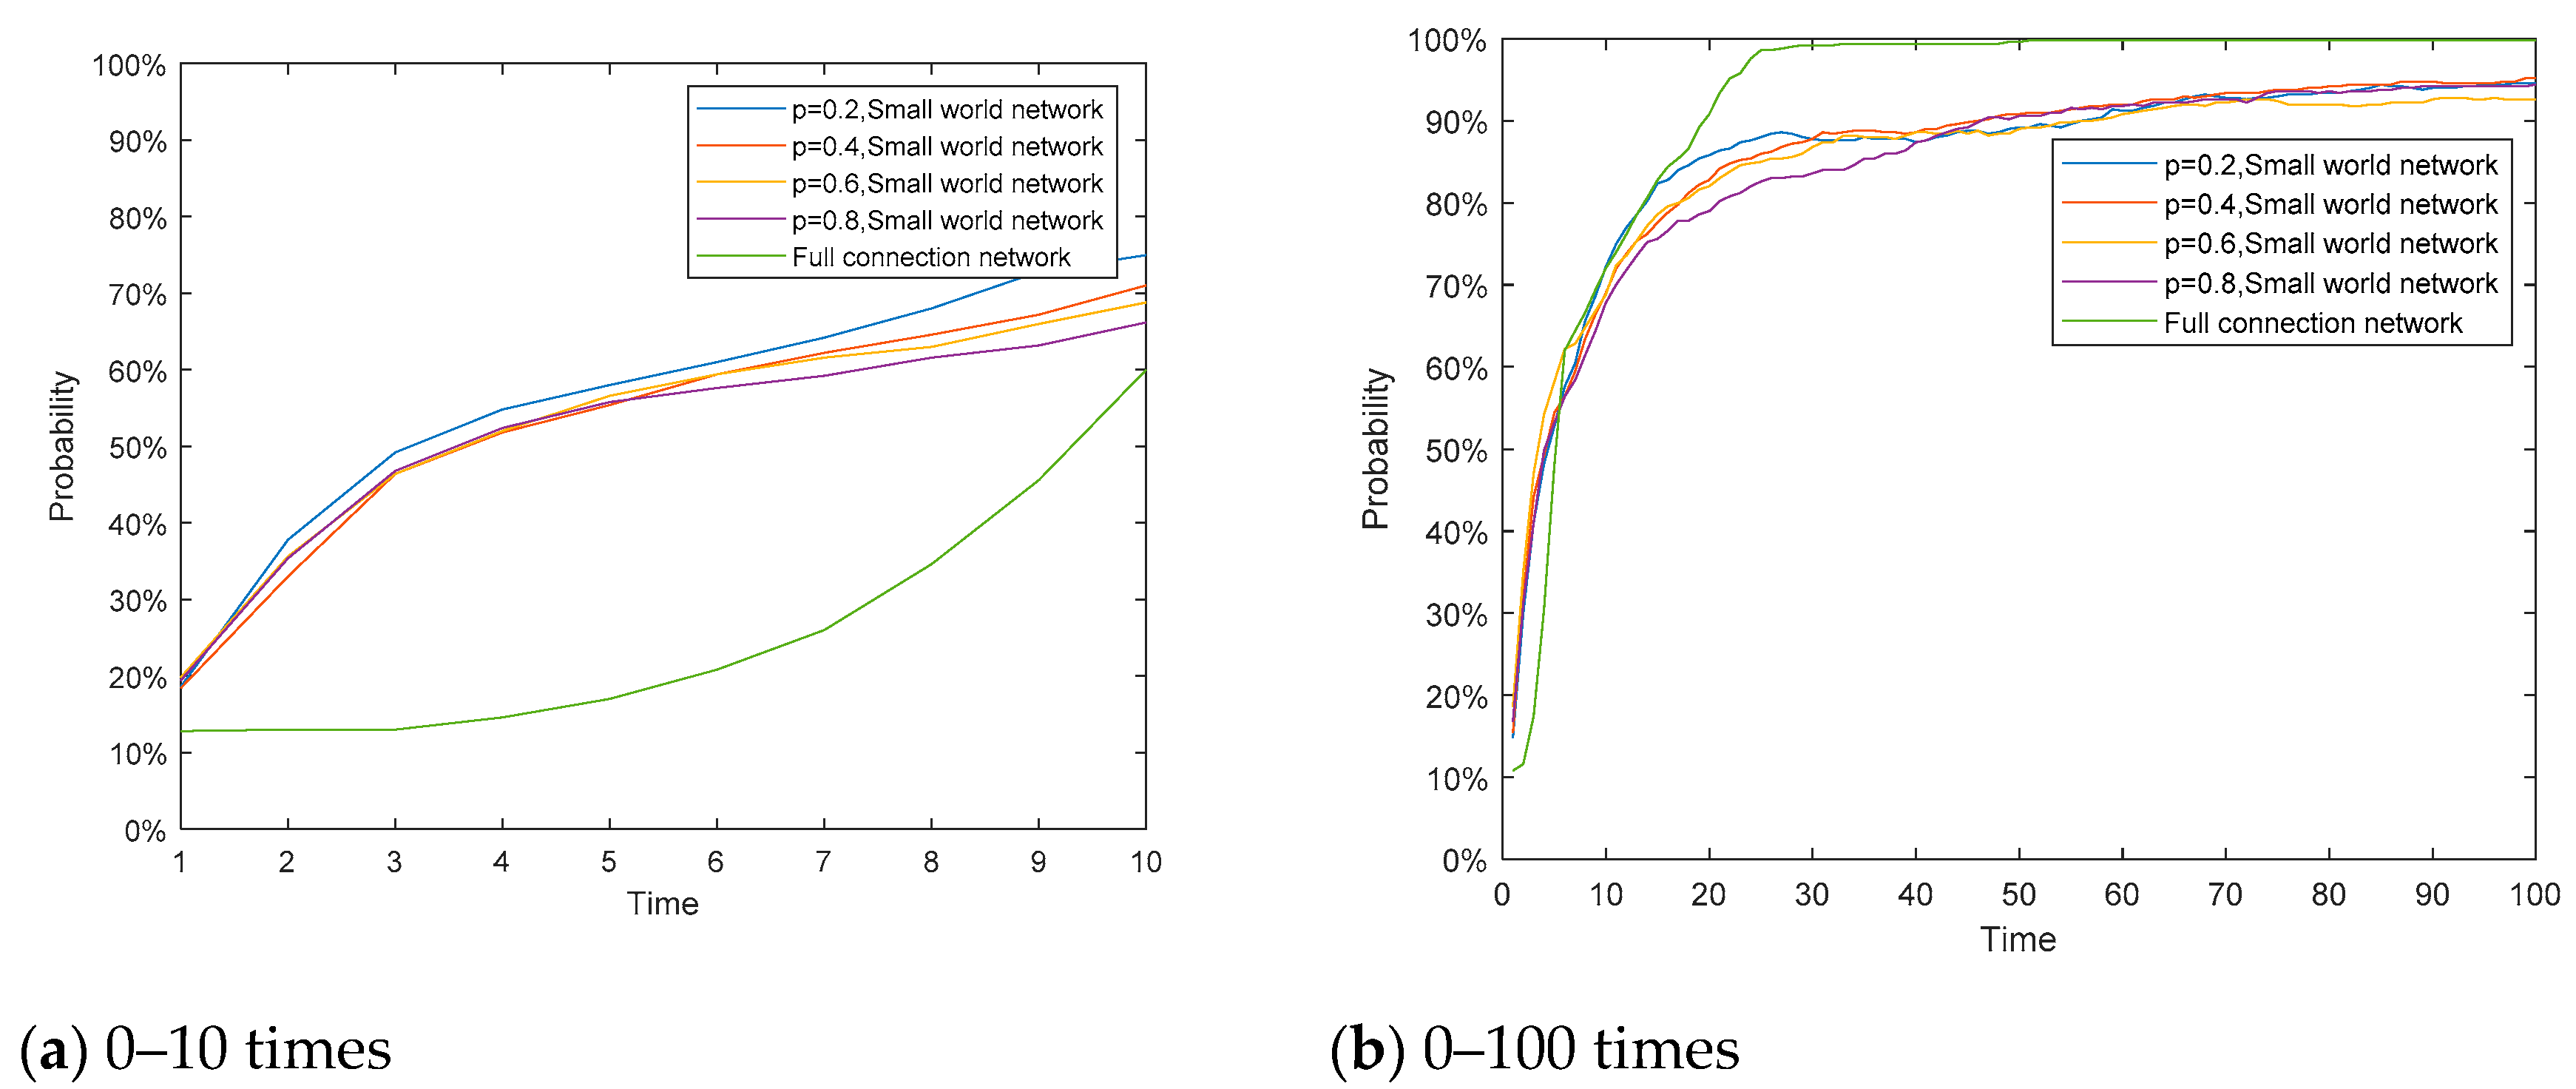
4.3. The Influence of Network Structure

The network polarization model proposed in this article depends to a large extent on the network topology. The Watts-Strogatz model [39] can obtain a small world network with the same number of nodes, the same number of edges, and the same average, but different clustering coefficients and average path lengths, by adjusting the probability p of reconnection between nodes. Therefore, this section uses the Watts-Strogatz model to generate four small world networks with different clustering coefficients and different average paths, but the same average degree.
Figure 19 is a connection diagram of network nodes for four different p values with n = 50 and an average degree equal to 10. Table 1 shows the four small world networks for simulation comparison analysis, and the different statistical properties of a fully connected network. Figure 20 reflects the degree of distribution of the four networks. The proportion of polarized individuals whose attitude values of the four networks at different times is greater than 0.9 or less than −0.9 is shown in Figure 21. The other parameters were set as follows: n = 500, Yi = 0.6, μ = 0.05, d1 = 0.20, and d2 = 0.70.
It can be seen from the Figure 21 that the increase of network agglomeration helps improve the polarization degree of public opinion. When the network agglomeration increases, the individuals in the network are more closely connected and the probability of interaction is higher, so the polarization degree will increase. However, it can be clearly seen that the change in polarization probability under the small world network is significantly different from that in the fully connected network. In the fully connected network, the polarizability changes slowly at the initial moment, but as time goes on, the polarizability increases significantly at a certain time, and full network polarization is achieved after enough time.
To avoid contingency, based on the extended BA algorithm given by Goh et al. [40], we reconstructed the BA scale-free network with different network characteristics by adjusting the parameters and re-simulating. The characteristics of the network generated by the BA model are shown in Table 2, and the proportion of polarized individuals whose attitude values of the four networks at different times was greater than 0.9 or less than −0.9 is shown in Figure 22. The other parameters were set as follows: n = 500, Yi = 0.6, μ = 0.1, d1 = 0.20, and d2 = 0.80.
As shown in Figure 22, we reached a similar conclusion by comparing the polarization probabilities of four groups of networks constructed using the BA algorithm. The increase of network agglomeration helps increase the probability of polarization of public opinion.

5. Real Case Study and Analysis

This section illustrates the polarization phenomenon in the spread of public opinion by selecting the typical case named “Mimeng Event”.
In the early morning of 29 January 2019, the famous emotional columnist “Mimeng team” published an article titled “A Death of A Top Student From A Poor Family,” which told the story of a so-called top student in the college entrance examination from a poor family, who was unwilling to collude with others, but fought hard and died atypically. The article quickly exploded on WeChat, with 100,000 retweets, and peaked with 140,000 searches for creator Mimeng, while the user-based social media platform-Sina Weibo reached 220 million views on the topic. But soon the article was questioned for its authenticity and suspected of fabricating a story, tears were deliberately evoked to cause a negative public opinion storm, which caused a large number of Internet users to engage.
In order to analyze the evolution of individual public opinion in the discussion of the “Mimeng Event,” we used the keyword “Mimeng” to extract 5000 comments and the number of “likes” under each comment. We then applied the Python Snow NLP for natural language processing to get the quantified emotional value. Although the amount of data acquired was not large, according to the theory of six-degree segmentation in interpersonal relationships [41], the statistical results of these user data can still largely reflect the generalities of user behavior on Weibo. Since the number of views was far greater than the amount of discussion under the topic of Sina Weibo, in order to more accurately restore the attitude value of most people, we calculated the attitude value of the number of “likes” as the attitude of the Weibo Post by default. The form of the crawl field is as shown in Figure 23:
The data collected were analyzed, and the comment data within 96 h after the event were intercepted. Since the time distribution of the crawling field was relatively close, the comments from 0:00 on 1 February to 23:59 on 4 February were quantified and arranged in chronological order to produce a graph of network evolution and polarization probability, as shown in Figure 24 and Figure 25:
As can be seen from Figure 24, time at 0 represents 0:00 on 1 February 2019 when the attitudes of netizens were scattered and various. However, with the evolution of public opinion, the netizen’s attitudes gradually split into two poles: those who supported Mimeng thought that the article “A Death of A Top Student From A Poor Family” was still readable, although fabricated; but more netizens felt that Mimeng fabricated the story and spread her anxiety, which has a bad influence; and others remained neutral.
The simulation experiment is carried out on the event according to the public opinion polarization model proposed in this article. As the “Mimeng Event” is closely related to the life of the major netizens, many netizens had their own applicable experiences, so the conformity was low, meaningthe intrinsic self-confidence Yi = 0.4. Because the “Mimeng Event” itself was negative, the social average attitude value T(0) = −0.2 was set at the initial time; the initial polarization rates were set to be ρ(0) = 1.2, d1 = 0.18, and d2 = 0.70. In this simulation, 500 nodes were selected. In the experiment, the network aggregation was set to be 0.33392, which is closer to the Sina Weibo’s characteristic, with an average degree of 118. The selection of relevant parameters was based on the actual situation, giving them a certain practical reference value. The results are shown in Figure 26, Figure 27 and Figure 28.
According to the Figure 24, Figure 25, Figure 26, Figure 27 and Figure 28, although there is still a gap between the simulation and the real data, the changes of overall public opinion are basically the same, and the proportion of the polarized individuals is relatively similar, indicating that it has a certain practical value. As shown in Figure 24, since the multiple redundant data which are crawled from the network are obtained after deleting the useless information, the attitude change of each individual cannot be specified, and the attitude trend of all individuals in the network can only be judged in time. Figure 26 illustrates the dynamic changes for each particular individual netizen. Therefore, Figure 24 is a scatter plot, and Figure 26 is a line graph.
To verify the practical value of the model proposed in this article, the J-A model and the static conformity model were applied to simulate the experiment under the same parameters. The results are shown in Figure 29, Figure 30, Figure 31, Figure 32, Figure 33 and Figure 34.
As is shown in Figure 29, Figure 30 and Figure 31, the J-A model can polarize public opinion very quickly. When time = 15, all individuals in the network have achieved polarization effects, and there are no other attitude values in the network except the positive and negative polarized attitudes. In fact, in such a typical case as the “Mimeng Event,” individuals have a high degree of self-confidence in their own opinions, a relatively low tendency to conform to the crowd, and a very limited impact on the interaction of ideas between individuals. Therefore, in the evolution of public opinion until the netizens’ attention to the event completely disappears, the proportion of positive and negative polarization will only increase compared with the initial time, and cannot be fully polarized. When the static conformity was adopted, according to Figure 32, Figure 33 and Figure 34, the attitude values of the individual netizens in the network remained almost unchanged, which is obviously inconsistent with the facts. Therefore, the model proposed in this article is more practical for the hot events with low conformity and scattered initial attitudes.

6. Conclusions

In order to study the mechanism of public opinion polarization in the network, this article proposes a new public opinion polarization model based on the idea of the J-A model, introducing a dynamic conformity function and individual heterogeneity, and analyzing the influences of dynamic conformity and heterogeneity on public opinion polarization.
The following conclusions were obtained through experimental simulation:
(1)
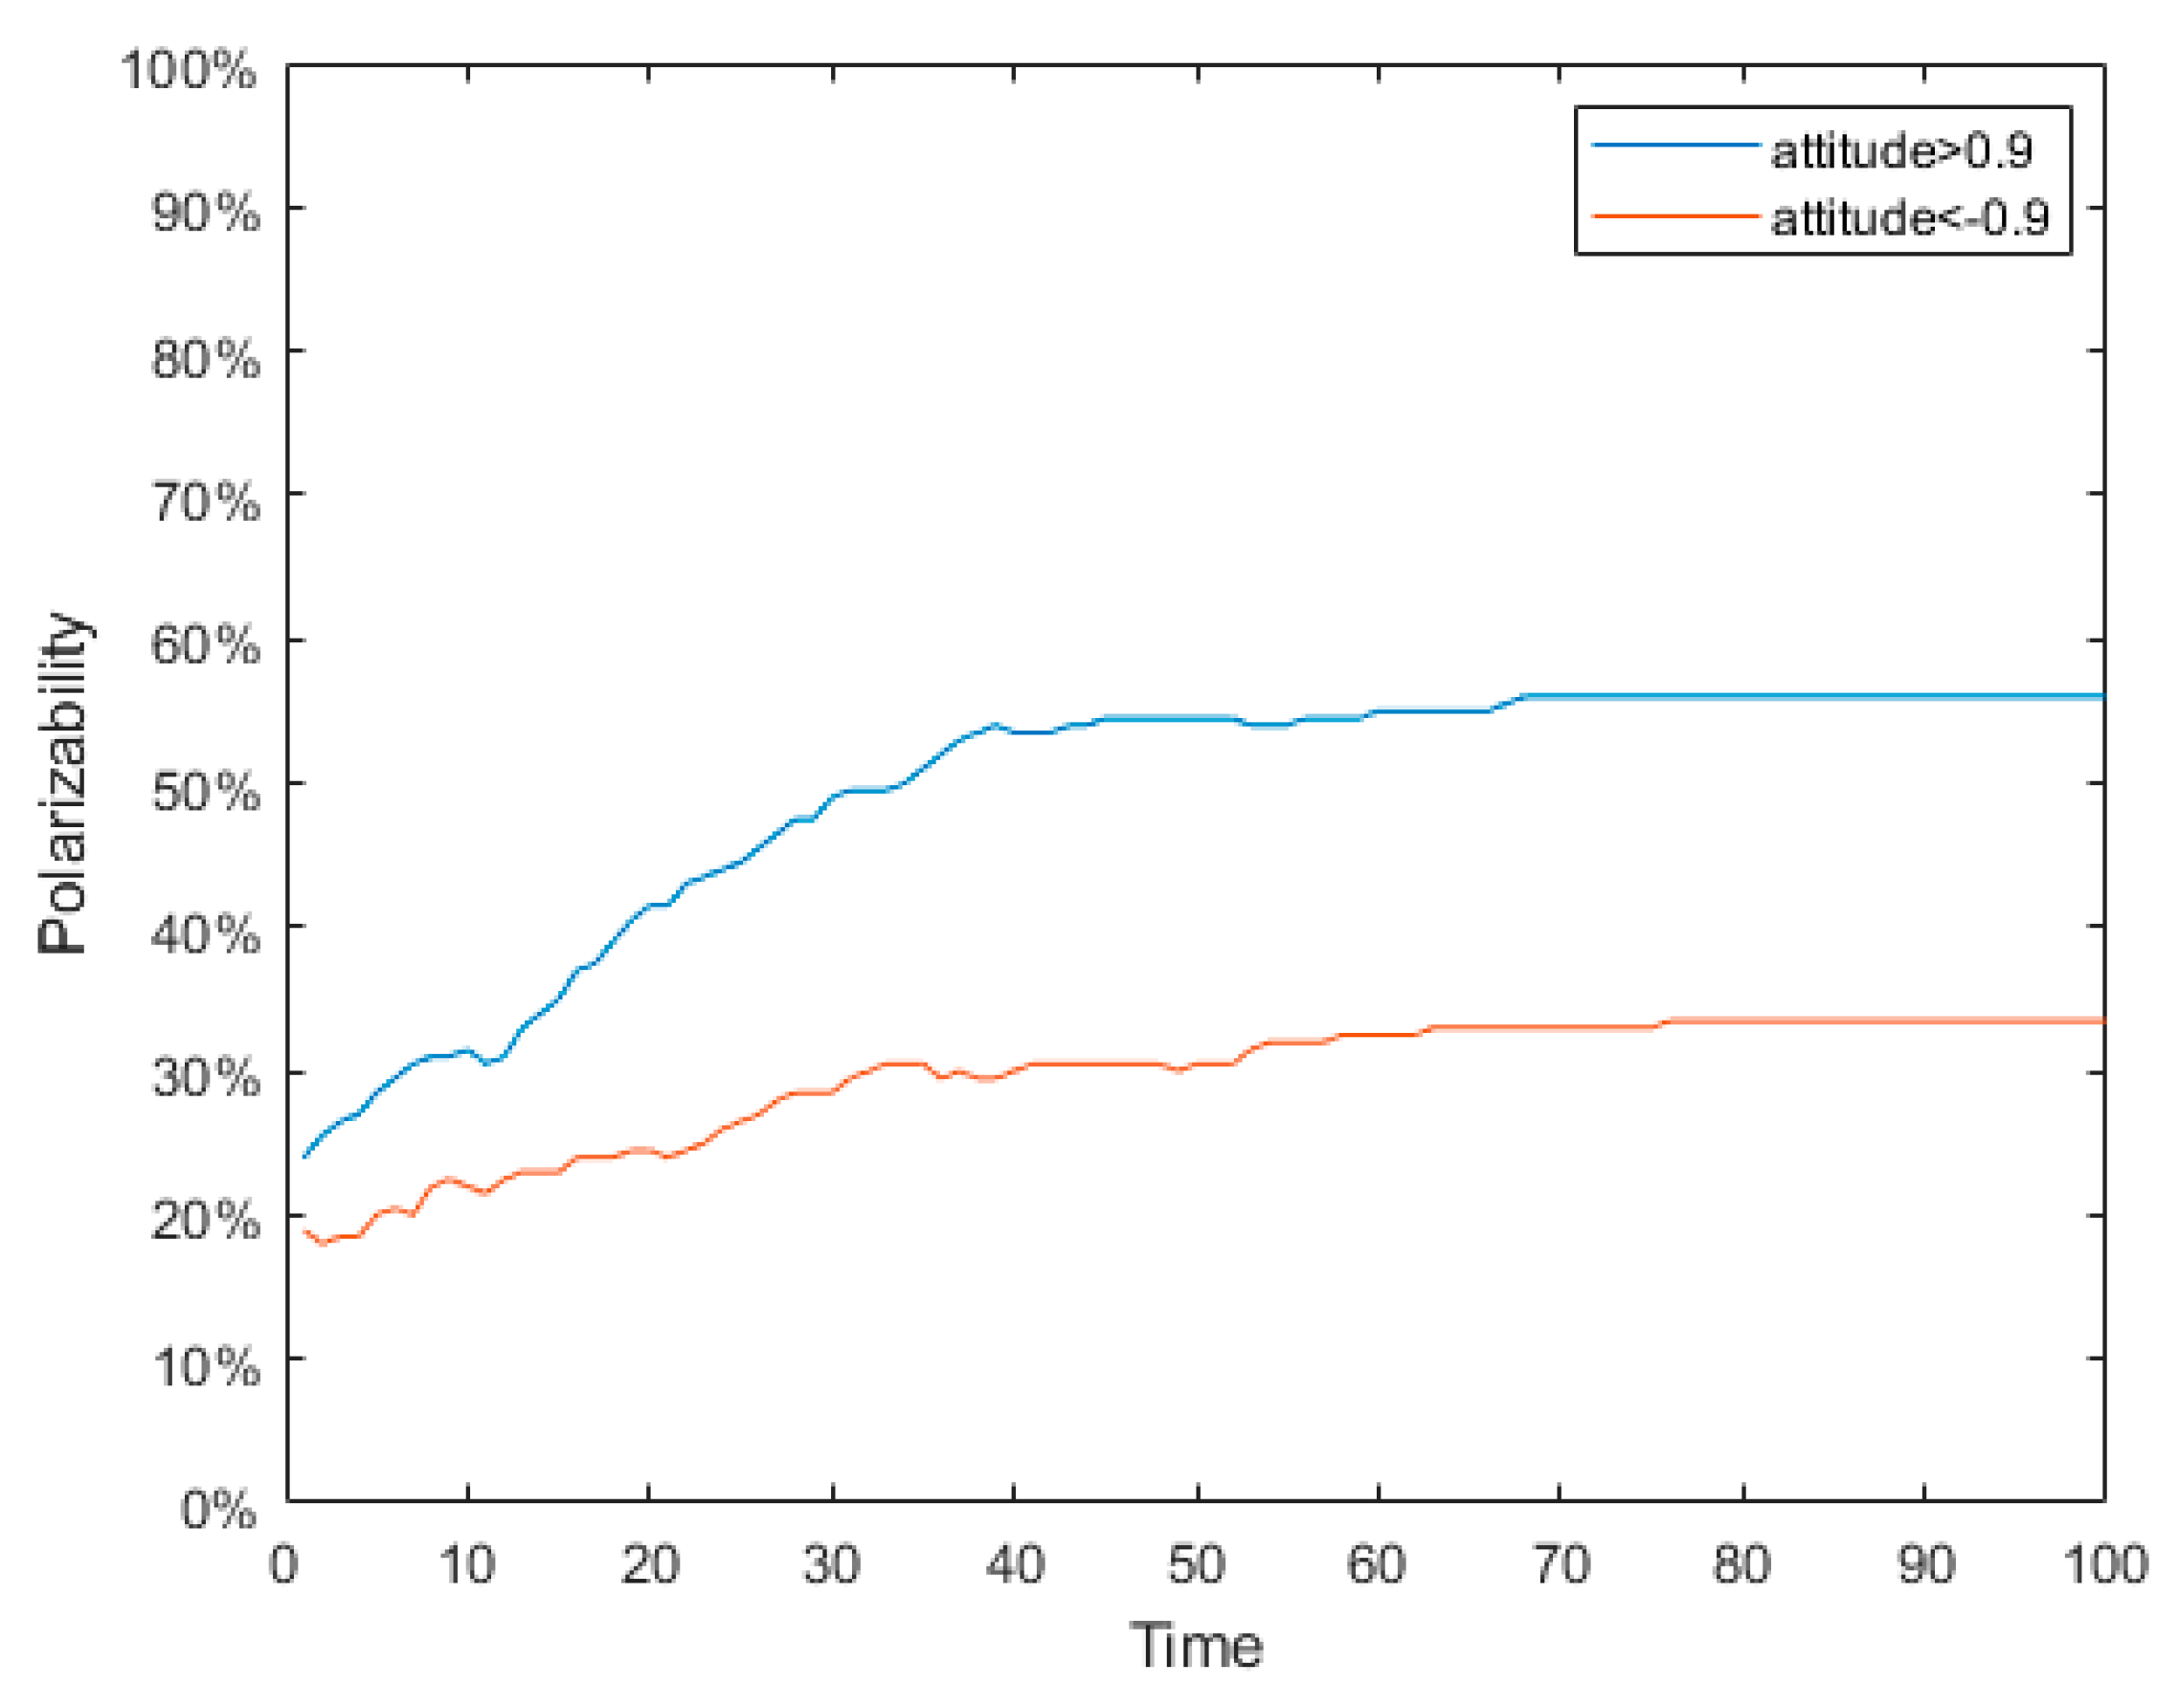
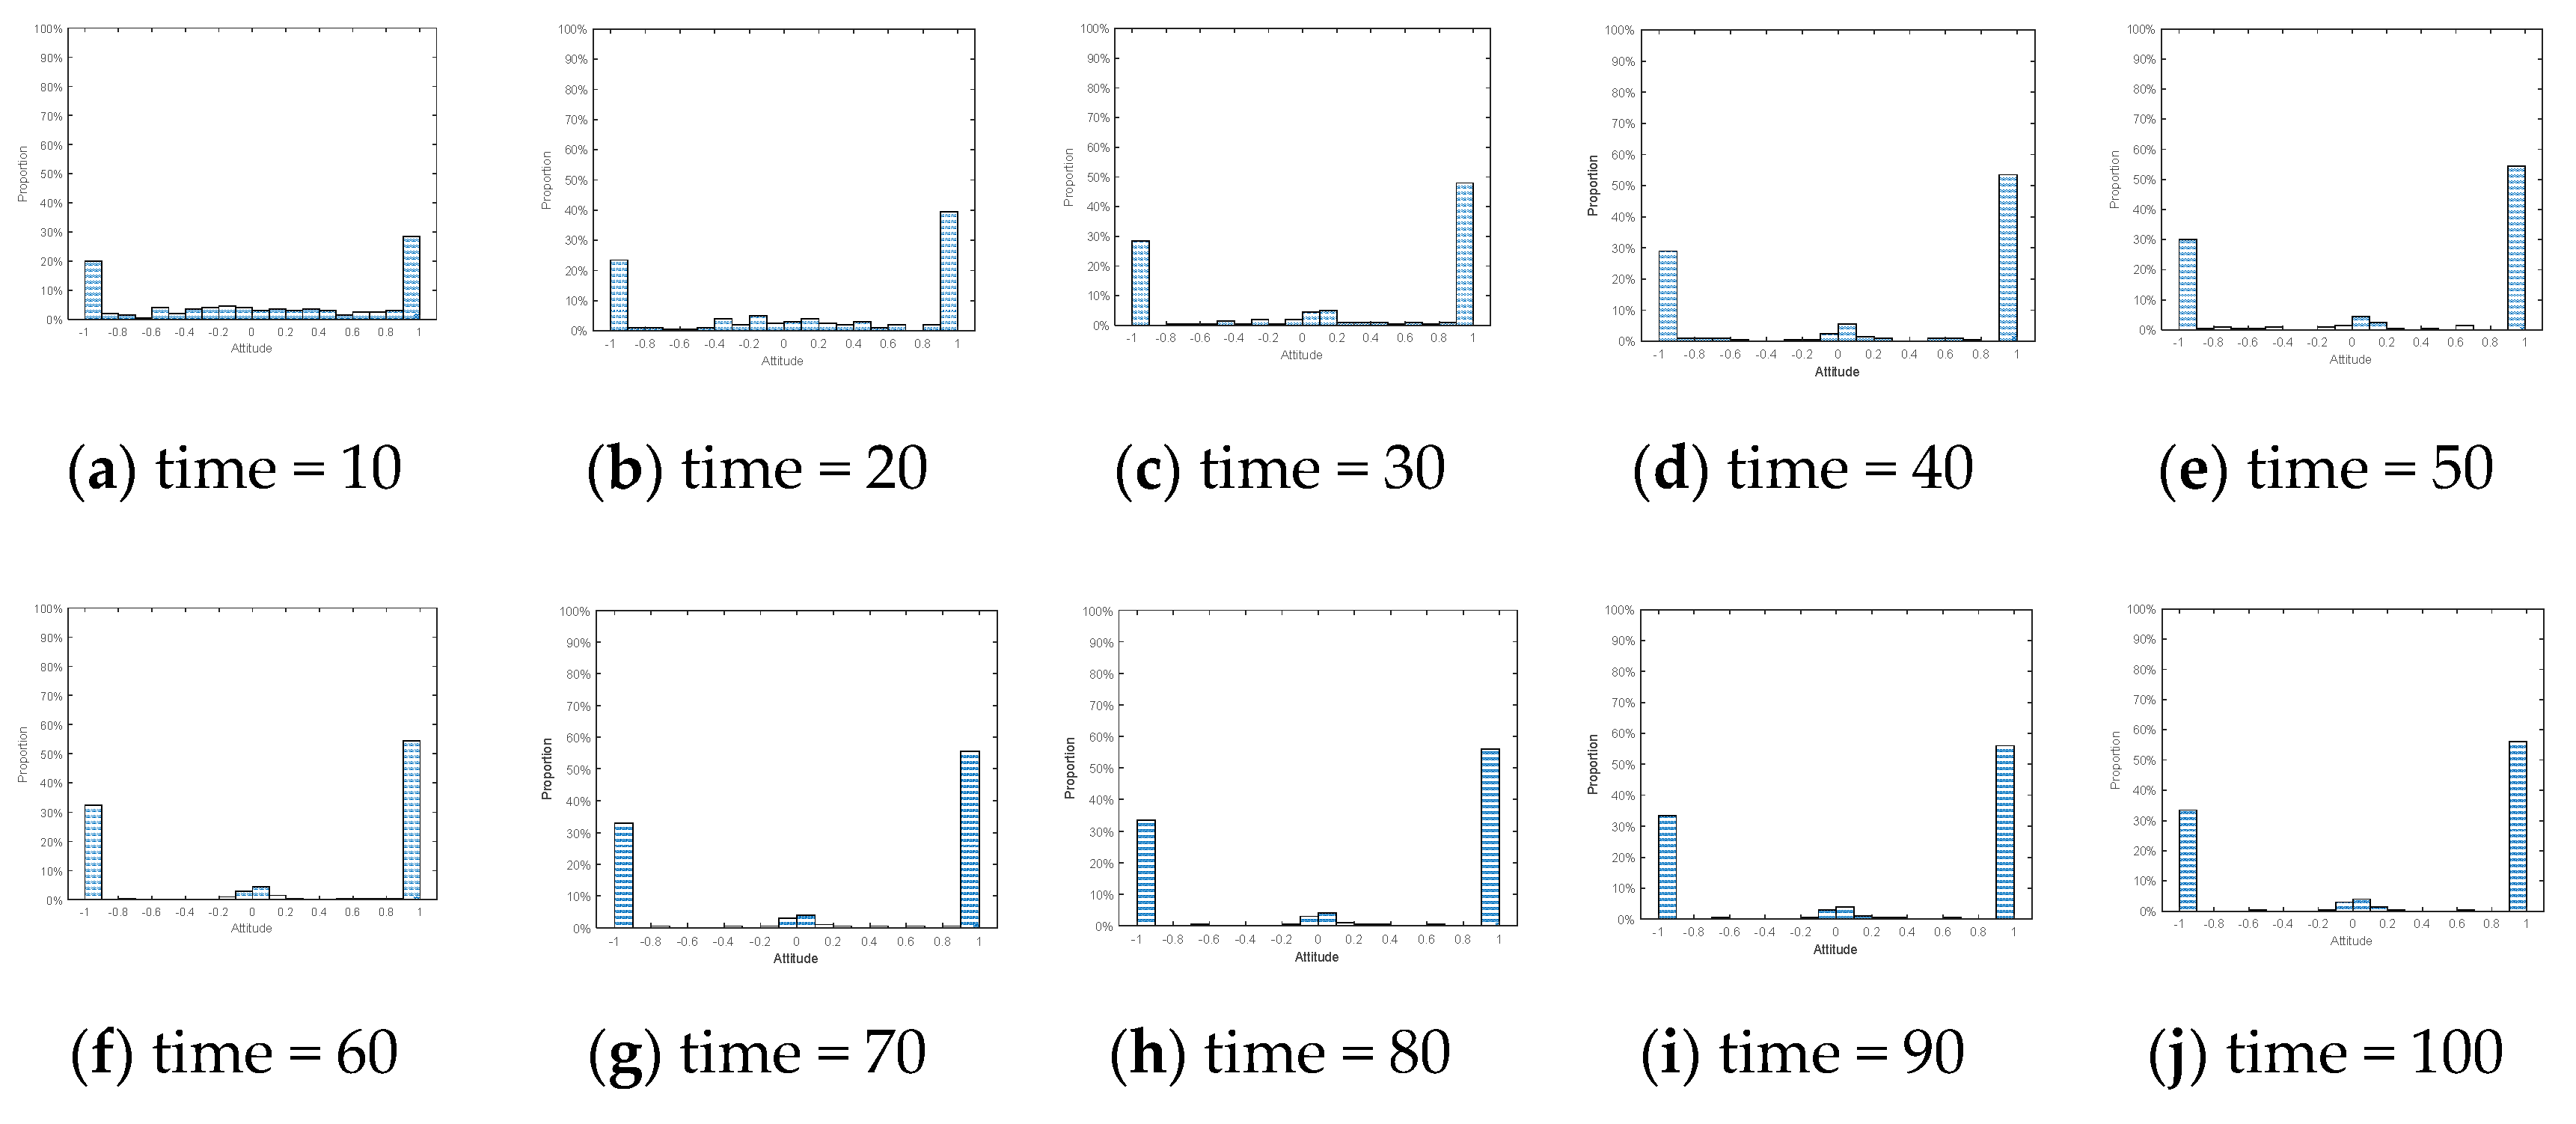
When one extreme attitude dominates in the network, the individual with the other extreme attitude will gradually change his attitude and then become neutral through enough interactions.
(2)
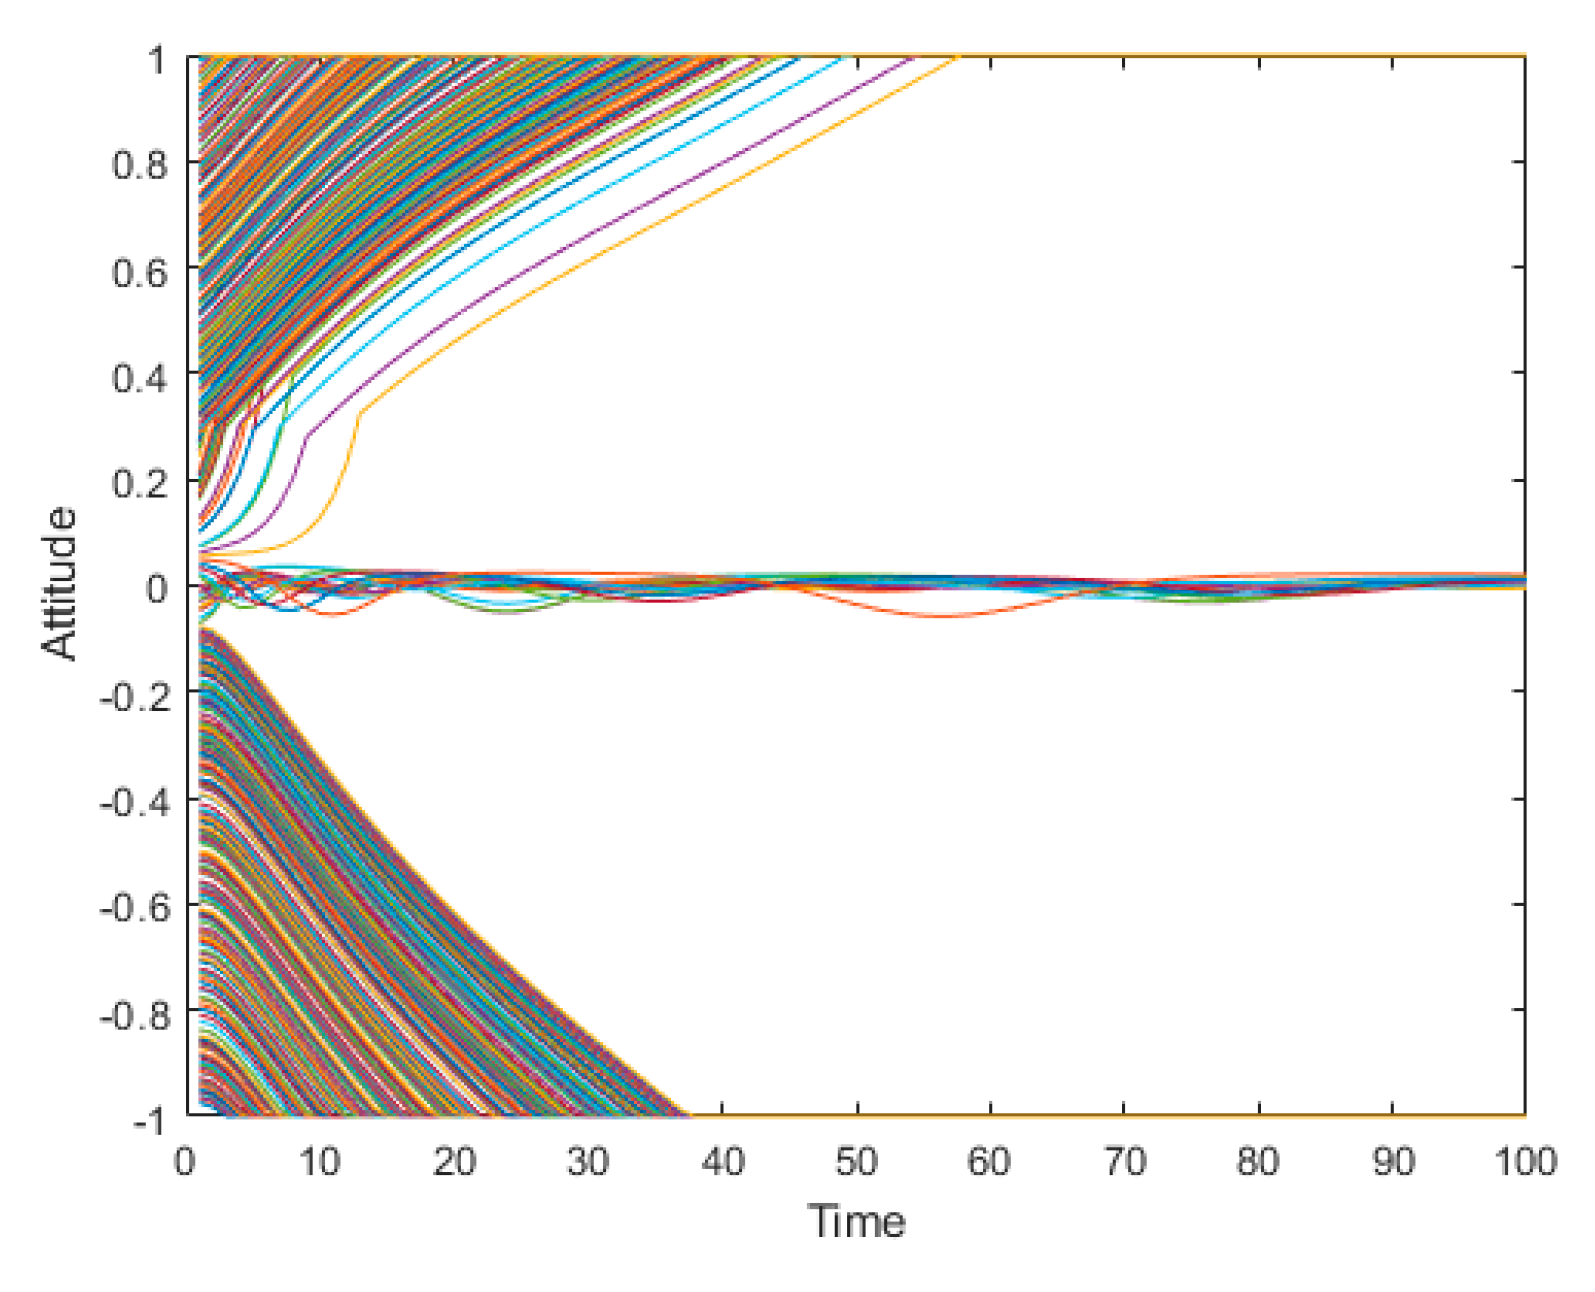
The degree of individual attitude change is limited in the evolution of the network, and it is difficult for individuals who have one directional attitude at the initial time to change into another opposite attitude through interactions.
(3)
Different individuals have different conformability and individuals with low conformability are likely to form polarization phenomena within a certain threshold.
(4)
Through comparisons with the J-A model and the static conformity model, the model proposed in this article was demonstrated to be more valuable in theory and application.
However, some shortcomings still existing in the article should be studied in future:
(1)
Combined with the real case, it can be seen that the spread of hot events in the network is a dynamically changing process, and the number of netizens participating in the discussion increases gradually along with the spread of hot events, but decreases gradually with a reduction of the popularity of hot events. Therefore, it is necessary to study apolarization phenomenon in dynamic networks by considering the increase and decrease of network nodes (netizens). In addition, another important research focus is to understand the feedback loop amongthe two.
(2)
Due to the virtual nature of the network, it is difficult for netizens to distinguish the inductive information. In addition, with continuous disclosure of the truth, the reversal of public opinion occurs. Therefore, it is necessary to study the influence of public opinion’s reversal upon polarization.
(3)
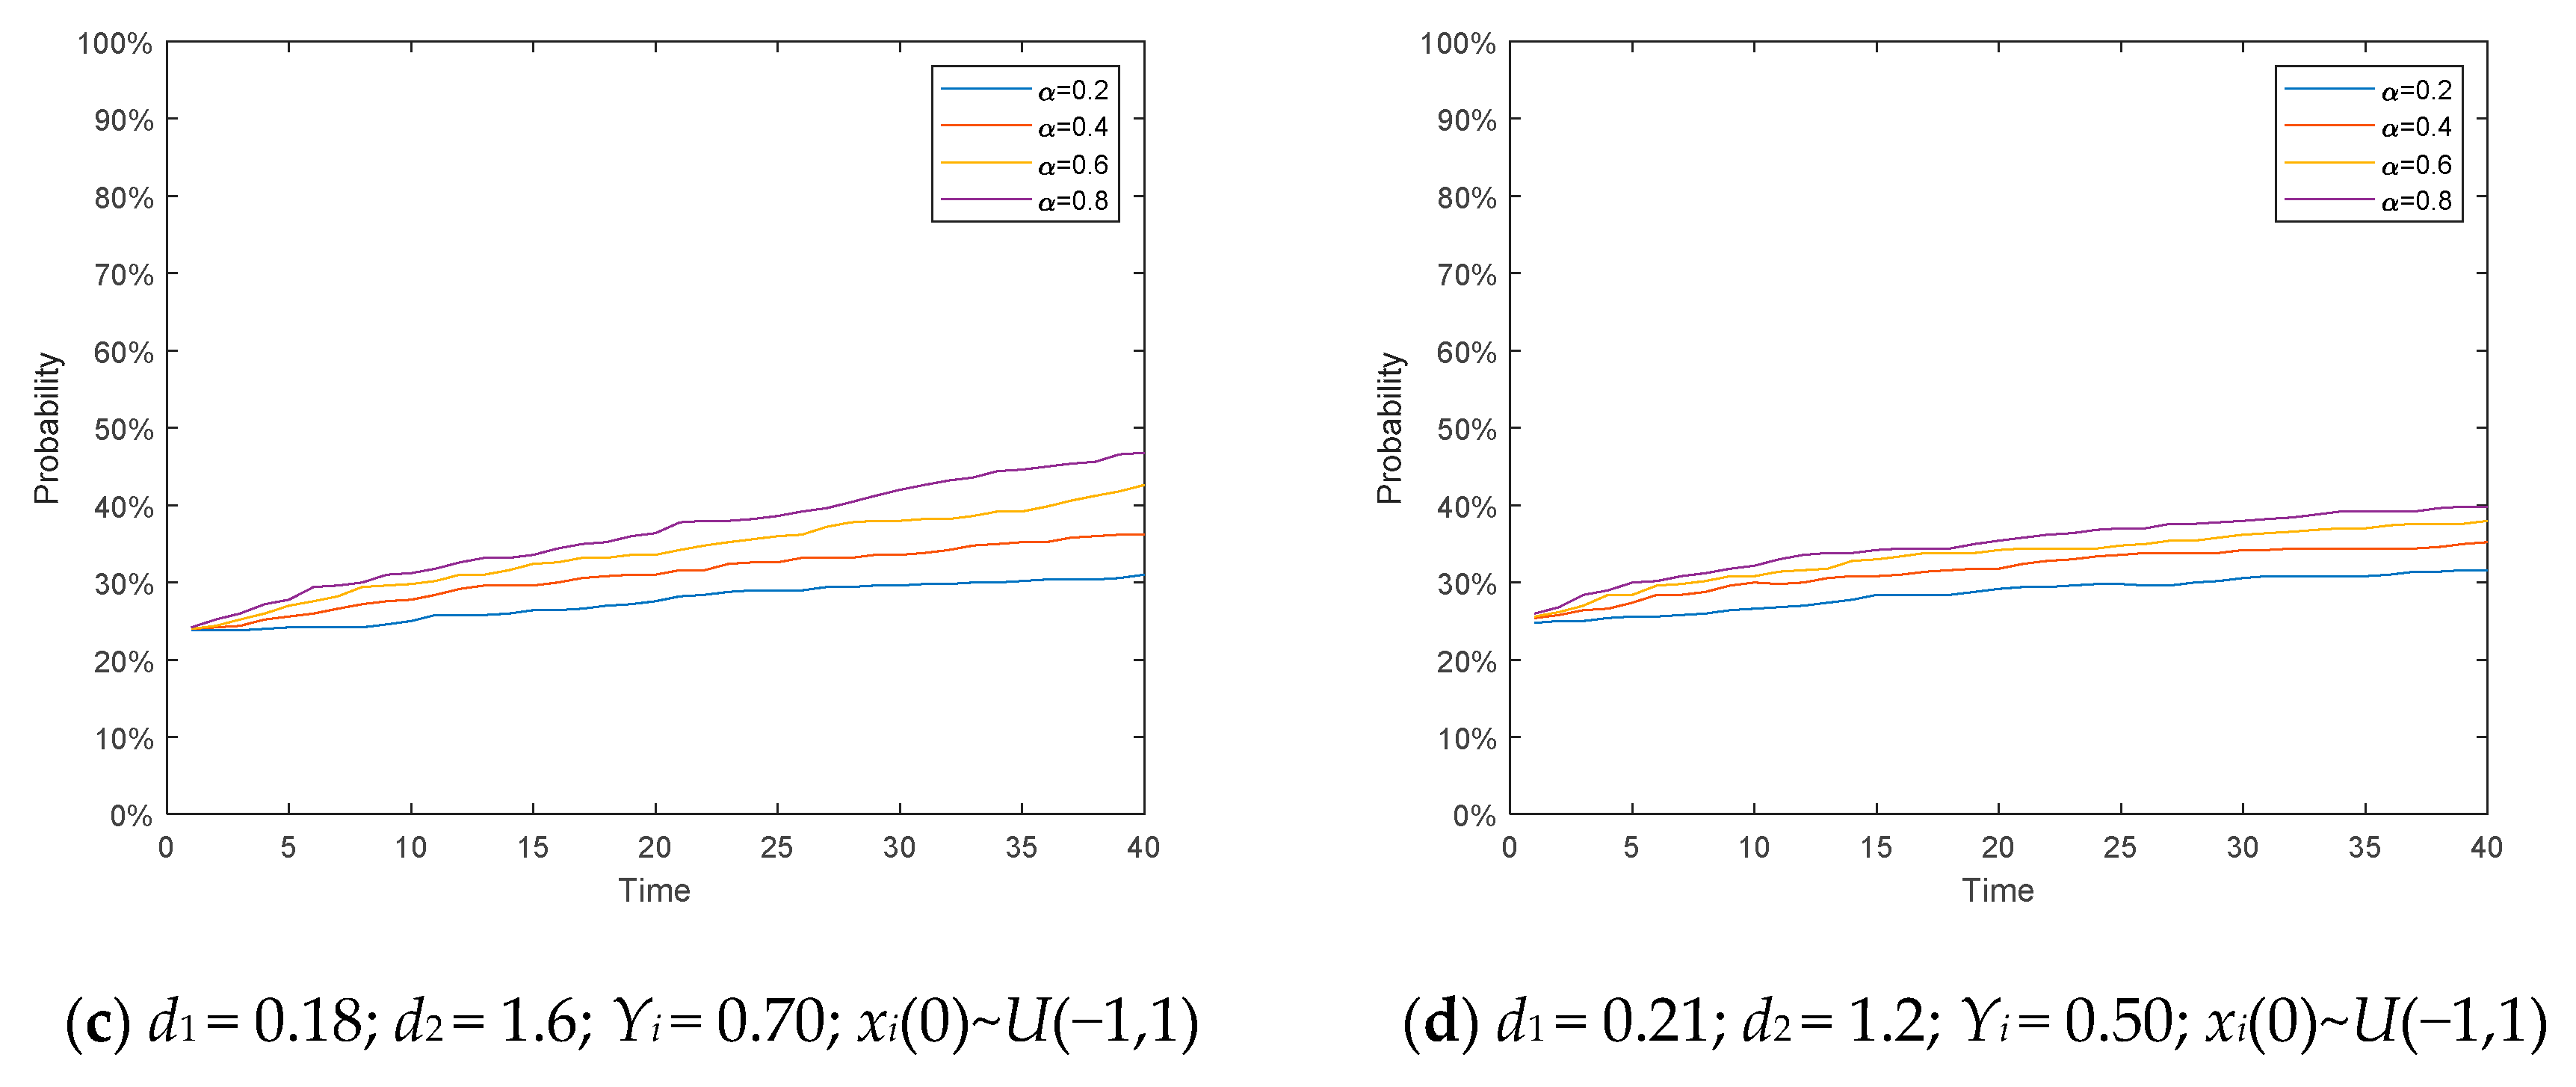
This article concludes that the probability of public opinion’s polarization is related to individual conformity, the social influence parameter, and the intrinsic self-confidence parameter. However, for the parameters mentioned above, this article only discussed them specifically. In fact, the polarization phenomenon of public opinion is composed of many factors and interactions, so the compositional effects of these factors should be discussed in future.

Author Contributions

T.C. described the proposed framework and wrote the whole manuscript; Q.L. implemented the simulation experiments; J.Y., G.C. and G.L. revised the manuscript; all authors read and approved the final manuscript.

Funding

This research is supported by the National Natural Science Fund Project of China (grant number 71401156), the Ministry of education of Humanities and Social Science project of China (grant number 18YJA630012), the Zhejiang Provincial Natural Science Foundation of China (number LY18G010001), the Presidential Incentive Award in the University of North Georgia (number 1103 and number 1105), Hubei Key Laboratory of Mechanical Transmission and Manufacturing Engineering (2017A08), and the Contemporary Business and Trade Research Center and Center for Collaborative Innovation Studies of Modern Business of Zhejiang Gongshang University of China (grant number 14SMXY05YB).

Conflicts of Interest

The authors declare that they have no competing interests.

References

  1. Allcott, H.; Gentzkow, M. Social media and fake news in the 2016 election. J. Econ. Perspect. 2017, 31, 211–235. [Google Scholar] [CrossRef]
  2. Kusmartsev, F.V.; KürtenKarl, E. Physics of the mind: Opinion dynamics and decision making processes based on a binary network model. Int. J. Mod. Phys. B 2008, 22, 4482–4494. [Google Scholar] [CrossRef]
  3. Parsegov, S.E.; Proskurnikov, A.V.; Tempo, R.; Friedkin, N.E. Novel multidimensional models of opinion dynamics in social networks. IEEE Trans. Autom. Control 2017, 62, 2270–2285. [Google Scholar] [CrossRef]
  4. Sunstein, C.R. Neither Hayek nor Habermas. Public Choice 2008, 134, 87–95. [Google Scholar] [CrossRef]
  5. Urrutia-Mosquera, J.; Lopez-Ospina, H.; Sabatini, F.; Rasse, A. Tolerance to diversity and residential segregation. An adaptation of the Schelling segregation model with three social groups. EURE Rev. Latinoam. Estud. Urbano Reg. 2017, 43, 5–24. [Google Scholar]
  6. Dhar, S.; Gor, B.; Banerjee, D.; Krishnan, S.; Dorai, V.K.; Jones, L.; Kabad, K.; Naik, L.R.; Legha, S.S.; Pande, M. Differences in nativity, age and gender may impact health behavior and perspectives among Asian Indians. Ethn. Health 2019, 24, 484–494. [Google Scholar] [CrossRef]
  7. Abeles, A.T.; Howe, L.C.; Krosnick, J.A.; Maclnnis, B. Perception of public opinion on global warming and the role of opinion deviance. J. Environ. Psychol. 2019, 63, 118–129. [Google Scholar] [CrossRef]
  8. Zhang, K.P. Encountering dissimilar views in deliberation: Political knowledge, attitude strength, and opinion change. Political Psychol. 2019, 40, 315–333. [Google Scholar] [CrossRef]
  9. Qiu, J.T.; Lin, Z.X.; Shuai, Q.H. Investigating the opinions distribution in the controversy on social media. Inf. Sci. 2019, 489, 274–288. [Google Scholar] [CrossRef]
  10. Lewandowsky, S.; Pilditch, T.D.; Madsen, J.K.; Oreskes, N.; Risbey, J.S. Influence and seepage: An evidence-resistant minority can affect public opinion and scientific belief formation. Cognition 2019, 188, 124–139. [Google Scholar] [CrossRef] [Green Version]
  11. Bode, L.; Vraga, E.K. See something, say something: Correction of global health misinformation on social media. Health Commun. 2018, 33, 1131–1140. [Google Scholar] [CrossRef] [PubMed]
  12. Chan, M.; Jones, C.R.; Jamieson, K.H.; Albarracin, D. Debunking: A meta-analysis of the psychological efficacy of messages countering misinformation. Psychol. Sci. 2017, 28, 1531–1546. [Google Scholar] [CrossRef] [PubMed]
  13. Hamilton, R.W.; Schlosser, A.; Chen, Y.J. Who’s driving this conversation? Systematic biases in the content of online consumer discussions. J. Mark. Res. 2017, 54, 540–555. [Google Scholar] [CrossRef]
  14. Colliander, J. This is fake news: Investigating the role of conformity to other users’ views when commenting on and spreading disinformation in social media. Comput. Hum. Behav. 2019, 97, 202–215. [Google Scholar] [CrossRef]
  15. Chen, T.; Shi, J.; Yang, J.; Li, G. Enhancing network cluster synchronization capability based on artificial immune algorithm. Hum. Cent. Comput. Inf. Sci. 2019, 9, 13. [Google Scholar] [CrossRef]
  16. Kleiner, T.M. Public opinion polarisation and protest behaviour. Eur. J. Political Res. 2018, 57, 941–962. [Google Scholar] [CrossRef]
  17. Dandekar, P.; Goel, A.; Lee, D.T. Biased assimilation, homophily, and the dynamics of polarization. Proc. Natl. Acad. Sci. USA 2013, 110, 5791–5796. [Google Scholar] [CrossRef] [Green Version]
  18. Etesami, S.R.; Basar, T. Game-theoretic analysis of the Hegselmann-Krause model for opinion dynamics in finite dimensions. IEEE Trans. Autom. Control 2014, 60, 1886–1897. [Google Scholar] [CrossRef]
  19. Li, L.; Scaglione, A.; Swami, A.; Zhao, Q. Consensus, polarization and clustering of opinions in social networks. IEEE J. Sel. Areas Commun. 2013, 31, 1072–1083. [Google Scholar] [CrossRef]
  20. Leon-Medini, F.J. Endogenous changes in public opinion dynamics. J. Artif. Soc. Soc. Simul. 2019, 22, 4. [Google Scholar] [CrossRef]
  21. Fu, G. Opinion dynamics of modified Hegselmann-Krause model in a group-based population with heterogeneous bounded confidence. Phys. A: Stat. Mech. Its Appl. 2015, 419, 558–565. [Google Scholar] [CrossRef]
  22. Ising, E. Beitrag zur Theoriedes Ferromagnetismus. Z. Für Phys. 1925, 31, 253–258. [Google Scholar] [CrossRef]
  23. Clifford, P.; Sudbury, A. A model for spatial conflict. Biometrika 1973, 60, 581–588. [Google Scholar] [CrossRef]
  24. Holly, R.A.; Liggett, T.M. Ergodic Theorems for weakly interacting infinite systems and the voter model. Ann. Probab. 1975, 3, 633–643. [Google Scholar] [CrossRef]
  25. Mcguire, M.C.; Olson, M. The Economics of Autocracy and Majority Rule: The Invisible Hand and the Use of Force. Res. Inst. Econ. 1996, 34, 72–96. [Google Scholar]
  26. Sznajd, W.K.; Sznajd, J. Opinion evolution inclosed community. Int. J. Model Phys. C 2000, 11, 1157–1165. [Google Scholar] [CrossRef]
  27. Deffiiant, G.; Neau, D.; Amblard, F.; Weisbuch, G. Mixing beliefs among interacting agents. Adv. Complex Syst. 2000, 3, 87–98. [Google Scholar] [CrossRef]
  28. Deffuant, G.; Amblard, F.; Weisbuch, G.; Faure, T. How can extremism prevail? A study based on the relative agreement interaction model. J. Artif. Soc. Soc. Simul. 2002, 5, 4. [Google Scholar]
  29. Hegselmann, R.; Krause, U. Opinions dynamics and bounded confidence: Models, analysis and simulation. J. Artif. Soc. Soc. Simul. 2002, 5, 96–104. [Google Scholar]
  30. Jager, W.; Amblard, F. Uniformity, bipolarization and pluriformity captured as generic stylized behavior with an agent-based simulation model of attitude change. Comput. Math. Organ. Theory 2005, 10, 295–303. [Google Scholar] [CrossRef]
  31. Sîrbu, A.; Pedreschi, D.; Giannotti, F.; Kertész, J. Algorithmic bias amplifies opinion fragmentation and polarization: A bounded confidence model. PLoS ONE 2019, 14, e0213246. [Google Scholar] [CrossRef] [PubMed]
  32. Li, J.; Xiao, R. Agent-based modelling approach for multidimensional opinion polarization in collective behaviour. J. Artif. Soc. Soc. Simul. 2017, 20, 14. [Google Scholar] [CrossRef]
  33. Andreas, F.; Michael, M.; Thomas, F.; Edmund, C.B.; Guillaume, D.; Sylvie, H.; Jan, L. Models of Social Influence: Towards the Next Frontiers. J. Artif. Soc. Soc. Simul. 2017, 20, 12. [Google Scholar]
  34. Liou, Y.H.; Daly, A.J. The lead igniter: A longitudinal examination of influence and energy through networks, efficacy, and climate. Educ. Adm. Q. 2019, 55, 363–403. [Google Scholar] [CrossRef]
  35. Chu, K.H.; Majmundar, A.; Allem, J.P.; Soto, D.W.; Cruz, T.B.; Unger, J.B. Tobacco use behaviors, attitudes, and demographic characteristics of tobacco opinion leaders and their followers: Twitter analysis. J. Med. Internet Res. 2019, 21, 1–7. [Google Scholar] [CrossRef]
  36. Wu, T.Y.; Atkin, D.J. To comment or not to comment: Examining the influences of anonymity and social support on one’s willingness to express in online news discussions. New Media Soc. 2018, 20, 4512–4532. [Google Scholar] [CrossRef]
  37. Granovetter, M.S. The strength of weak ties. Am. J. Sociol. 1973, 78, 1360–1380. [Google Scholar] [CrossRef]
  38. Giulietti, C.; Wahba, J.; Zenou, Y. Strong versus weak ties in migration. Eur. Econ. Rev. 2018, 104, 111–137. [Google Scholar] [CrossRef] [Green Version]
  39. Watts, D.J.; Strogatz, S.H. Collective dynamics of ‘small-world’networks. Nature 1998, 393, 440. [Google Scholar] [CrossRef]
  40. Goh, K.I.; Kahng, B.; Kim, D. Universal behavior of load distribution in scale-free networks. Phys. Rev. Lett. 2001, 87, 278701. [Google Scholar] [CrossRef]
  41. Travers, J.; Milgram, S. Experimental study of the small world problem. Sociometry 1969, 32, 425–443. [Google Scholar] [CrossRef]
Figure 1. Schematic diagram of Monte Carlo simulation based on multi-agent.
Mathematics 07 00917 g001
Figure 2. Evolutiongraph of public opinion under static conformity.
Mathematics 07 00917 g002
Figure 3. Polarization probability graph under static conformity.
Mathematics 07 00917 g003
Figure 4. Column graph of attitude distribution at different times under static conformity.
Mathematics 07 00917 g004
Figure 5. Evolution of public opinion under dynamic conformity.
Mathematics 07 00917 g005
Figure 6. Polarization probability graph under dynamic conformity.
Mathematics 07 00917 g006
Figure 7. Column graph of attitude distribution at different times under dynamic conformity.
Mathematics 07 00917 g007
Figure 8. Polarization probability under different intrinsic self-confidence Yi.
Mathematics 07 00917 g008
Figure 9. Polarizabilitygraph under different μ.
Mathematics 07 00917 g009
Figure 10. Polarization map under the influence of different parameters.
Mathematics 07 00917 g010aMathematics 07 00917 g010b
Figure 11. The evolution of public opinion with 500 network nodes.
Mathematics 07 00917 g011
Figure 12. Histogram of attitude distribution at different times.
Mathematics 07 00917 g012
Figure 13. A three-dimensional graph of individual attitude evolution with 500 network nodes.
Mathematics 07 00917 g013
Figure 14. A three-dimensional graph of the attitude evolution of individuals with different initial values.
Mathematics 07 00917 g014aMathematics 07 00917 g014b
Figure 15. A three-dimensional graph of individual attitude evolution with 500 network nodes.
Mathematics 07 00917 g015
Figure 16. A three-dimensional graph of the attitude evolution of individuals with different initial values.
Mathematics 07 00917 g016aMathematics 07 00917 g016b
Figure 17. All individual polarization probability graph.
Mathematics 07 00917 g017
Figure 18. Individual polarization probability with different intrinsic confidence yi.
Mathematics 07 00917 g018
Figure 19. Four network connection schematics.
Mathematics 07 00917 g019
Figure 20. Degree distribution map.
Mathematics 07 00917 g020
Figure 21. Polarization probabilities at different times in small world networks with different characteristics and a fully connected network.
Mathematics 07 00917 g021
Figure 22. Polarization probability under four different clustering coefficients of Barabasi-Albert (BA) networks.
Mathematics 07 00917 g022
Figure 23. “Mimeng Event” crawling field content.
Mathematics 07 00917 g023
Figure 24. The evolution of public opinion in the “Mimeng Event”.
Mathematics 07 00917 g024
Figure 25. Polarization probability in “Mimeng Event”.
Mathematics 07 00917 g025
Figure 26. Simulationgraph of public opinion evolution in the “Mimeng Event”.
Mathematics 07 00917 g026
Figure 27. Simulation graph of polarization probability in the “Mimeng Event”.
Mathematics 07 00917 g027
Figure 28. Column graph of attitude distribution at different times.
Mathematics 07 00917 g028aMathematics 07 00917 g028b
Figure 29. Publicopinion evolution simulation graph of the J-A model in the “Mimeng Event”.
Mathematics 07 00917 g029
Figure 30. Simulation graph of polarization probability of the J-A model in the “Mimeng Event”.
Mathematics 07 00917 g030
Figure 31. Column graph of attitude distribution at different times of J-A model.
Mathematics 07 00917 g031
Figure 32. The simulation graph of the static conformity model for public opinion’s evolution in the “Mimeng Event”.
Mathematics 07 00917 g032
Figure 33. Polarization simulation graph of the static conformity model in the “Mimeng Event”.
Mathematics 07 00917 g033
Figure 34. Column graph of attitude distribution at different times in the static conformity model.
Mathematics 07 00917 g034aMathematics 07 00917 g034b
Table 1. Descriptionof network structure.
Network TypeNumber of EdgesAverage Path LengthClustering CoefficientAverage DegreeReconnection Probability
Small World network25003.47310.3541100.2
Small World network25003.130.16133100.4
Small World network25002.98530.059089100.6
Small World network25002.94880.025154100.8
Fully connected network124,75011499
Table 2. Description of network structure.
Serial NumberNumber of EdgesClustering CoefficientAverage Degree
147110.09259718.842
290010.1271436.002
320,0410.2192980.162
433,7230.3151134.89

