Abstract
Optimal lot sizing is the primary tool applied by lean practitioners to reduce inconsistency in the manufacturing system to cut down inventories, which are often considered as a type of waste in the lean culture. Managers attempt to consider environmental impacts of the manufacturing system and find ways to reduce these effects while making efforts to achieve environmental protection. From a sustainability standpoint, carbon emissions are the major source of environmental contamination and degradation. In this context, this research provides an economic production quantity model with uncertain demand and process information in a multistage manufacturing process. This imperfect manufacturing process produces defective products at an uncertain rate, and is reworked to convert them into perfect quality products and reduce wastages. To control this uncertainty in the manufacturing process, the decomposition principle and the signed distance method of fuzzy theory are applied. The manufacturing process is analyzed with regard to environmental concerns, and a sustainable lot size is obtained through an interactive Weighted Fuzzy Goal Programming (WFGP) approach for the simultaneous achievement of economic and environmental sustainability. An experimental study is performed to verify the practical implication of the model, and results are evaluated through a sensitivity analysis. Important managerial insights and graphical illustrations are provided to elaborate the model.
1. Introduction
When analyzing any industry on a global scale, presently, it is identified that the rapidly growing competitions in the global markets and frequently increasing raw material costs have led the manufacturing industries to adopt lean manufacturing policies. Taiichi Ohno, an engineer in Toyota recognized as a master of lean philosophy, provided the basis of various lean manufacturing techniques. His focused policies involved labor empowerment, inventories reduction, productivity improvement, and waste minimization. In this way, Toyota managed to accommodate frequent changes in market demands by applying a made-to-order strategy. Currently, almost all types of manufacturing industries have adopted lean culture in an appropriate proportion to minimize resource utilization, improve process reliability, enhance employee skills, and minimize system costs to achieve the ultimate goal of remaining noticeable in the sturdy market competition.
Productivity improvement is among the top application of lean culture due to its tangible and operative benefits to a manufacturing business. In order to focus on productivity improvement in a manufacturing industry, four strategic pillars of lean are simultaneously applied, namely; Poka-yoke, 5S, visual controls, and Kanban [1]. Poka-yoke is a fool-proof system, which prevents the occurrence of a mistake or defect [2]. 5S is a five-phase program of each phase starting with an alphabet “S”; (a) sort, (b) set in order, (c) shine, (d) standardize, and (e) sustain. 5S ensures workplace safety, waste minimization, and improved plant efficiency [3]. Posters, diagrammatic presentations, pictures, color codes, and symbols are effective visual tools for productivity improvement of the manufacturing facility [4]. Kanban is a production control tool for optimum utilization of the workforce capacity in order to achieve just-in-time (JIT) production [5].
With the formation of lean culture, a cleaner production approach is mandatory to reduce the environmental impacts of the manufacturing industries, which are combinedly termed as lean-green strategies. This task can be efficiently performed by applying waste control policies. According to a project carried out by Fresner [6], a cleaner production approach has the potential to minimize 0.5%–1.5% of the system cost by eradicating nonvalue added activities. Similarly, Ozturk et al. [7] analyzed implementation of 22 different environmental protection working techniques and achieved a significant reduction in resource utilization, while achieving comparable plant efficiency and product quality. They identified that the contribution of motivated decision-makers and leaders is mandatory to achieve desired results. Otherwise, lean-green strategies provide little to no benefit to the manufacturing process.
In order to attain economic sustainability, managers attempt to decide the optimal lot size for the manufacturing process. Since the first development of Economic Production Quantity (EPQ) model by Taft [8], a broad number of researchers have studied and extended the model to various real-life production scenarios. The elementary shortcoming of the basic EPQ model is the non-consideration of process imperfections. None of the real-world manufacturing processes are perfect in nature. Hence, they produce defective products due to their “out-of-control” states. Therefore, many researchers have extended the model by considering defective proportions in the manufacturing systems. Some researchers have considered a constant defective rate, whereas various others have studied a random defective rate in their production models. In addition, to convert defective products into perfect quality products by incurring additional reworking cost, several researchers have devised rework opportunity.
Sarkar et al. [9] determined the optimal reliability of a manufacturing process with random imperfection using control theory. Chiu et al. [10] developed a production model with the aim of reducing suppliers’ carrying cost by considering random imperfections in the production process. Sarkar et al. [11] provided a production model with a random defective rate and provided optimal strategies for setup cost reduction and process improvement of the system. Tayyab and Sarkar [12] considered random defective proportion following beta distribution function in a manufacturing process and obtained the optimal lot size through the analytical optimization technique. Kim and Sarkar [13] further considered random imperfections in their production model and provided optimal investment policies for process improvement in a manufacturing process. They found that the spread of randomness in defective proportion data has a direct effect on the system cost.
In most of the scenarios, determining precise distribution function of the product demand and the random defective rate is not possible. In these situations, managers need to apply fuzzy theory, which can grasp the uncertainty involved in demand and the defective proportion information of the system. Zadeh introduced fuzzy theory in 1978 to handle the uncertain conditions, after which various researchers utilized the fuzzy approach to solve production models with imprecise parametric values. Chang [14] considered product demand and defective proportion as a fuzzy number in a single-stage manufacturing process and found that the uncertainty in defective proportion can be better dealt with using fuzzy theory on a cost of additional expenditure in the process. Priyan and Manivannan [15] considered defective proportion as a fuzzy number, along with inspection errors, in a manufacturing process and provided optimal delivery policies for the vendor-buyer integrated system in a supply chain.
Along with economic policies of the manufacturing processes, various other researchers have considered environmental policies to reduce detrimental impacts of the manufacturing systems on the outer environment. For this, carbon emission reduction is measured as an environment-friendly policy. Efforts are made through lot size adjustment, process improvement, better recourse utilization, and renewable energy consumption to reduce the carbon emissions of the system. Zeballos et al. [16], Sarkar et al. [17], and Xu et al. [18] considered the effects of carbon emissions in their production models and provided optimal production policies for the development of a sustainable manufacturing process. Our research work also considers carbon emission as an indicator of environmental influence of the manufacturing process analyzed in this study. Variable carbon emissions are considered during each operational activity of the manufacturing process, and the optimal lot size of the system is determined, which reduces the adverse environmental effects of the process.
The current focus of researchers is toward combinedly targeting operational and environmental scopes of the production environment through the integration of lean manufacturing and green manufacturing strategies [19]. Adopting lean practices provides green benefits, and further green policies often pave paths for lean benefits [20]. Diaz-Elsayed et al. [21] found that the collective implementation of lean and green practices has significantly reduced the production cost up to 10.80% in an automotive manufacturing firm, which is evidently a noticeable realization of implementing lean-green policies together. Recently, Thanki and Thakkar [22] developed a value-value load diagram (VVLD) tool to access the operational (lean) as well as environmental (green) performance of the organizations in combination with each other. This approach evaluates the lean-green performance of the firm established on various factors including resource utilization, value addition, and various others.
The above considerations promote the simultaneous implementation of lean and green policies to improve economic, as well as environmental, sustainability of the manufacturing industries. In view of the extensive association among lean and green practices and their combined benefits, this research work studied the simultaneous implementation of lean-green policy. Economic sustainability is aimed toward the implementation of the lean manufacturing strategy and economic lot size is obtained to attain the minimum cost of the system. Then, environmental sustainability is focused on the implementation of the green policy, considering emissions at each activity of the complete production system and the optimal lot size for minimal environmental impacts is achieved. A sustainable lot size is then obtained through the combined implementation of lean and green policies to improve eco-environmental performance of the multistage production system.
Most of the researchers have provided production models for a single-stage process, whereas almost all the products are manufactured through multistage manufacturing systems. Few researchers have studied multistage production processes. Among these researchers, Jaber and Khan [23] analyzed effects of learning and forgetting in multistage production process. Tayyab and Sarkar [12] developed a multistage lean manufacturing model by considering random imperfections at each stage of the system to obtain the optimal lot size through the analytical optimization technique. They found that the lean culture implementation has great potential to improve the economic sustainability of the multistage production process. Recently, Kim and Sarkar [13] provided optimum investment policies for setup cost reduction at all the process stages in an imperfect multistage production process. Their results showed that the reduction in imperfect production stabilizes the manufacturing process. Figure 1 shows a general flow of a multistage manufacturing process.
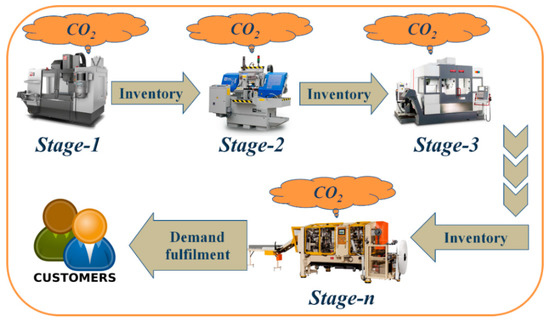
Figure 1.
General flow of a multistage manufacturing process.
Literature review indicates that there exists a significant research gap in the field of the multistage manufacturing process, specifically under uncertain process conditions. Therefore, this research work extends the study of Tayyab and Sarkar [12] by taking initiative to consider highly uncertain product demand and defective proportion at all stages of the multistage manufacturing process. A Triangular Fuzzy Number (TFN) represents the product demand and the defective proportion at each manufacturing stage. The decomposition principle and signed distance method [14] of the fuzzy theory are applied to handle this uncertainty and de-fuzz the fuzzy objective function of the developed model. As this is a multi-objective multistage manufacturing model with conflicting objectives of cost-minimization and carbon emissions minimization, both the analytical optimization technique and the metaheuristic approach are applied to solve the model. The aspiration level of each objective function is determined by the individual solution of each objective function, then the Weighted Fuzzy Goal Programing (WFGP) model is developed for linearization of the multi-objective model, which is solved through the metaheuristic approach.
Structure of the paper is as follows: Section 2 provides problem definition, assumptions, and mathematical model of this research; Section 3 provides solution methodology of the model. Numerical experiment, results analysis and important managerial insights are provided in Section 4. Finally, Section 5 presents concluding remarks and future research opportunities related to the proposed model.
2. Model Formulation
This section provides problem definition, notation, assumptions, and the mathematical model of the proposed imperfect multistage lean manufacturing process under an uncertain environment.
2.1. Problem Definition
An imperfect multistage manufacturing process is studied in this paper. A single type of item is produced through an n-stage manufacturing process [12]. Due to out-of-control process conditions, imperfect quality items are produced, along with the perfect quality items at a highly uncertain rate [14]. A rework opportunity is allowed to convert these imperfect items to perfect quality items at additional reworking cost. To handle the uncertain information regarding product demand and the imperfect production proportion at each manufacturing stage, product demand and the imperfect proportion of the production are taken as TFN. The decomposition principle and signed distance method of fuzzy theory are applied to grasp the situation [14]. Customer demand is met at the final production stage [12]. Each stage emits a certain quantity of carbon emissions to the outer environment during the manufacturing process. The manufacturing system makes an effort to implement the lean philosophy of waste minimization and environmental protection by adopting the lean-green approach.
Two objectives of the model are to minimize the system cost and carbon emissions of the system. A multi-objective model for the simultaneous minimization of these two conflicting objectives (economic and environmental) is developed. To convert the multi-objective model into a single-objective model, WFGP is applied with a single objective of improving satisfaction levels of each objective function. The model is solved by an interior point metaheuristic approach and results are analyzed to illustrate the robustness and practical applicability of the proposed model.
2.2. Assumptions
For model formulation, the below assumptions are considered:
- The model considers that a single type of item is produced in a multistage manufacturing process consisting of n number of stages.
- In today’s competitive market environment, product demand information cannot be estimated with accuracy. Therefore, this research work considers highly uncertain product demand, which is taken as a TFN (for instance, see Chang [14]).
- Manufacturing companies keep their production rates higher than the demand rate to avoid shortages in the system. Therefore, this study considers that the production rate of each manufacturing stage is constant with the condition and shortages are not allowed.
- In the long run production process, the system moves to an “out-of-control” state and produces defective products, along with good quality products. This defective proportion may not be constant throughout nor follow specific probability distribution. Thus, this research work considers an uncertain defective proportion at each stage of the multistage production system and treats it as a TFN.
- Production cost of the manufacturing system consists of various components. This study considers costs of energy, labor, and inspection costs at each manufacturing stage as the components of production cost.
- Inter-stage material transfer cost and time are trivial in the multistage production systems. Therefore, this study considers that the inter-stage material transfer cost and time are negligible.
2.3. Mathematical Model
This section develops a multi-objective model for the proposed lean-green manufacturing system with aforementioned notation and assumptions. Figure 2 presents the inventory behavior of stage-j.
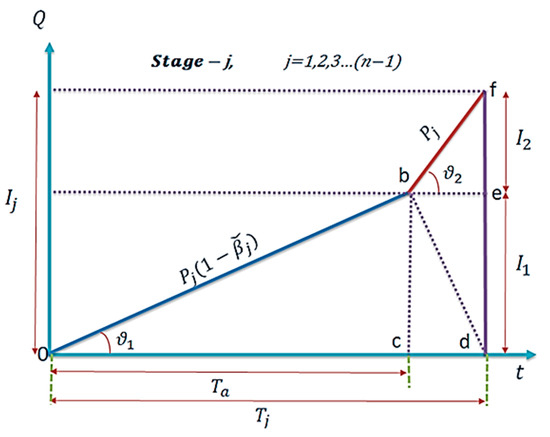
Figure 2.
Inventory behavior of stage-j (reference: Tayyab and Sarkar [12]).
Manufacturing stage-j starts with zero inventory and achieves maximum inventory in time where is uncertain defective proportion at stage-j.
Regular production is carried out during , and reworking of defective items is performed during the interval . Average inventory of stage-j is computed as below.
which provides
Figure 3 shows inventory behavior of the final production stage (stage-n). Regular production, along with demand fulfilment, is carried out during , reworking of defective items is performed from , and pure consumption occurs during the interval . Cycle time of stage-n is obtained as , and the total time of the complete manufacturing system is simply computed as
From Figure 3, total inventory of manufacturing stage-n is obtained as
From above, the average inventory of finished items in the system is obtained as
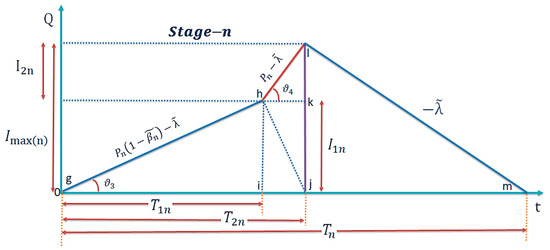
Figure 3.
Inventory behavior of stage-n (reference: Tayyab and Sarkar [12]).
2.3.1. Objective Function Formulation with Constant Demand and Imperfect Proportion
To obtain a sustainable lot size, this paper proposes a multi-objective production model for an imperfect multistage lean manufacturing system. Multi-objectives contain economic objective for cost minimization, and an environmental objective for emissions reduction to develop a lean-green manufacturing system.
Cost Minimization Objective
The cost minimization objective of the proposed multi-objective production model with constant demand rate and defective proportion is formulated in Equation (4). The first part of the objective function depicts the setup cost of the system. The second term shows the order processing cost and reworking cost of the system. The final term in the objective function represents the inventory carrying cost of finished items in the system.
Emissions Minimization Objective
minimization objective of the proposed multi-objective production model in fuzzy form is formulated in Equation (5). The first part of the objective function depicts emissions during setup of the system. The second term shows emissions during the order processing and the reworking of the defective items in the system. The final term in the objective function represents emissions during inventory carrying of finished items in the system.
2.3.2. Objective Function Formulation with Fuzzy Demand and Imperfect Proportion
This model considers defective proportion at each stage of the manufacturing process as highly uncertain. Thus, an uncertainty control approach is required to handle this vagueness in system information. Fuzzy theory is most suitable for such type of operating conditions under uncertain environment [14]. Therefore, defective proportion is taken as a TFN, and the decomposition principle, along with the signed distance approach, are applied to convert the fuzzy objective functions into their equivalent crisp forms. For the fuzzy set defined on with is a TFN with a membership function
According to decomposition principle, of is for where and . Then the signed distance of to is determined as .
Using the aforementioned uncertainty control approach, uncertainty in product demand and the defective proportion data for both objective functions is handled as below.
Fuzzy Membership Function Development
For the product demand of the manufacturing process represented by a fuzzy set defined on with is a TFN with a membership function
On the similar scale, for the defective proportion at each stage of the manufacturing process represented by a fuzzy set defined on with is a TFN with a membership function
Fuzzification
Fuzzified form of cost minimization objective and minimization objective are developed as below.
and
Defuzzification
Defuzzification is the conversion of the fuzzy linguistic variable to its equivalent crisp form for further computations of the objective functions. This research work has used the signed distance method of defuzzification for uncertain objective functions of the model.
For TFN, the signed distance of to is determined as
and the signed distance of to is obtained as
Putting this in the fuzzy objective functions defuzzify them in their equivalent crisp form as below.
and
In order to verify that the attends minimum value in the interval , one can simply apply analytical technique. As is a minimization objective with production quantity as a decision variable, thus, principle minor must be positive. From necessary conditions, .
From sufficient conditions, it is verified that
which proves that is strictly convex in . Hence, has a minimum value in the interval .
Similarly, it can be proved that attends the minimum value in the interval as the following: is a minimization objective with production quantity as a decision variable. Thus, the principle minor must be positive. From necessary conditions, .
From sufficient conditions, it is verified that
which proves that is strictly convex in . Hence, has a minimum value in the interval .
3. Solution Procedure
Goal programming (GP) is a well-known method of solving multi-objective optimization problems. There are several variants of GP used under different conditions. WFGP is proven to outperform in the scenario of an uncertain environment [12,20]. In this method, decision-makers decide the aspiration level and maximum acceptable level of each objective, which is then converted into a fuzzy membership function and the satisfaction level of each objective is determined. Then, the satisfaction level of each objective is maximized according to the predetermined importance criteria provided by the decision-makers. This research work applies WFGP to solve the proposed multi-objective nonlinear programing model.
Solution steps for the proposed multi-objective multi-stage lean manufacturing model are provided below.
1. Determineextreme solutions
Each objective function is solved separately to obtain target (aspiration) level of the function. Then maximum acceptable level of each objective function is determined by keeping aspiration level of other objective as an equality constraint, and a pay-off table (POF) is developed.
2. Develop Fuzzy membership function (FMF)
Fuzzy membership function for satisfaction level (TFN) of each objective is developed in this step by using aspiration level and maximum acceptable level of each objective determined in the previous step.
where and are the extreme solutions of objective function .
3. Develop WFGP model
WFGP is an interactive technique which requires expert human intervention to assign priority weights to each objective function in accordance with the decision-maker’s choice. Thus, the decision-makers determine importance weight for satisfaction level of each objective function k. WFGP model is then developed as below, which is in turn solved through a metaheuristic approach.
4. Experimental Analysis
To illustrate the practical implication of the developed multi-objective production model, a numerical experiment is carried out for a five-stage lean-green manufacturing process with the appropriate data set.
4.1. Numerical Data
Table 1 shows the numerical data (see Notation for units of parameters), modified from Tayyab and Sarkar [12] and Sarkar and Mahapatra [24].

Table 1.
Data for numerical experiment.
4.2. Numerical Solution Procedure
Multi-objective WFGP model is solved with the given data set (Table 1) in the following steps:
Step 1. Find positive extreme solution of each objective function by solving them separately and record the values (Table 2) as their respective aspiration levels (where and for the model with constant demand and imperfect proportion).
Table 2.
Aspiration levels of model objectives.
Step 2. Find negative extreme solution of each objective function by taking the aspiration level of each objective as an equality constraint for second objective and record the values (Table 3) as the form of a pay-off table (POT).
Table 3.
Payoff table for multi-objectives.
Step 3. Develop fuzzy membership functions of the satisfaction level for each objective as below (for instance, regarding model with fuzzy parameters).
and
Step 4. Decide the importance weight for each objective function and develop a WFGP model as below.
Step 5. Obtain optimal tradeoff solutions of the single-objective model developed in Step 4 through a heuristic approach.
4.3. Computational Results
As the developed WFGP model is a nonlinear maximization problem, a heuristic approach is required to solve the model. Therefore, interior point optimization is applied using MATLAB R2015a with system specifications of 4GB RAM and 1.80 GHz processor speed, and the optimal solution for the model with uncertain information is achieved in 11.54 s. Table 4 and Figure 4 show the optimal tradeoff values of the conflicting objective functions. Table 5 shows the optimal values of decision variables in the multi-objective optimization model.
Table 4.
Optimal results of multi-objectives.
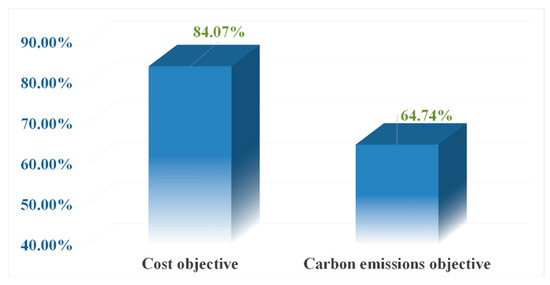
Figure 4.
Optimal satisfaction levels for the model with uncertain information.
Table 5.
Optimal decision variable values.
4.4. Result Analysis and Discussion
Results indicate a considerate tradeoff between conflicting objectives of the proposed model. Table 4 verifies that the optimal values of the objective functions lie within the acceptable limits, as defined in the POT. One can observe that the optimal cost of the model with constant demand and imperfect proportion is less than the model with fuzzy demand and imperfect proportion. This variation is due to the fact that the model with fuzzy parameters is handling a wide range of scattered information by the addition of a certain cost.
4.4.1. Satisfaction Level Achievement
Results indicate that the proposed fuzzy model has successfully achieved 84.07% satisfaction level for cost objective and 64.74% satisfaction level for emissions objective as computed below.
and
One can compute the contribution of an achieved satisfaction level of each conflicting objective in the proposed multi-objective lean-green multistage manufacturing model as which indicates that the contribution of and are 56.49% and 43.51%, respectively (Figure 5) in the overall performance of the proposed multi-objective multistage lean-green manufacturing system.
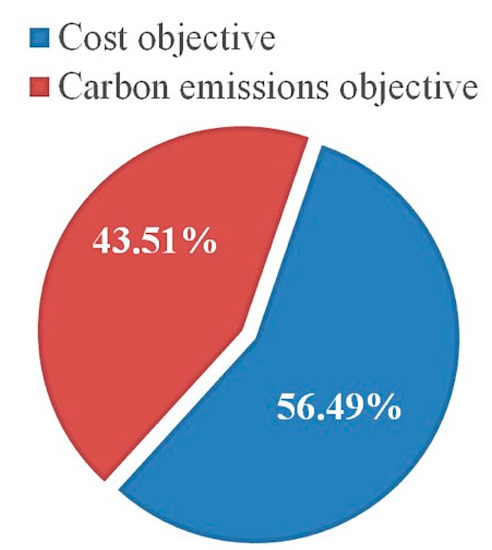
Figure 5.
Contribution of satisfaction levels for the model with uncertain information.
4.4.2. Effect of Uncertain Environment
Proposed model is analyzed for different instances of uncertain process information by varying values of fuzzy deviational variables and their effect is studied. Table 6 shows the optimal tradeoff among model objectives for below levels of uncertainty in the imperfect production proportion of the manufacturing system.
Table 6.
Effect of uncertain information on optimal results.
It can be observed from Table 6 that the uncertainty in information bears a significant degree of impact on the optimal trade-off value of each objective function in the model.
4.4.3. Sensitivity Analysis
The effects of various cost and emission parameters on optimal results of the multi-objective function of the model with uncertain demand and imperfect proportion are studied by varying their values from −50% to +50%, as shown in Table 7.
Table 7.
Sensitivity analysis for important parameters of numerical experiment.
Sensitivity analysis of the model shows that the production cost and corresponding emissions of the manufacturing system create the highest impact on the total cost and emissions of the system, respectively. A 50% decrease in the production cost of the system reduces 45.29% of the system cost, and vice versa. Similarly, a 50% decrease in emissions of the system during production reduces 42.64% emissions of the system, and vice versa. Variations in the setup cost and inventory carrying cost have a trivial impact on the system cost. Similar behavior is shown by the variations in emissions of the system during the order setup and inventory carrying process. Figure 6 and Figure 7 show the effect of variations in various key parameters on the cost and emissions minimization objective as a whole.
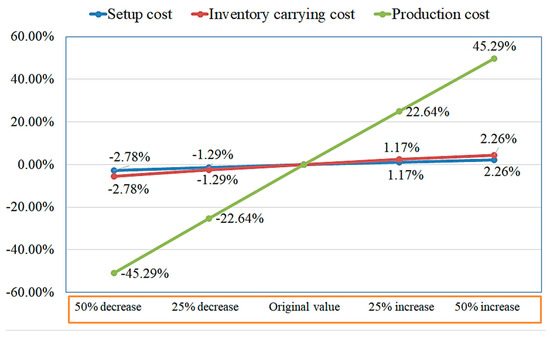
Figure 6.
Sensitivity analysis of cost objective for the model with uncertain information.
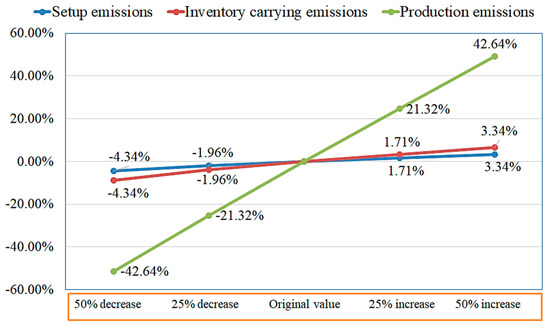
Figure 7.
Sensitivity analysis of CO2 emissions objective for the model with uncertain information.
4.5. Managerial Insights
Analysis of the results verify that the proposed model has provided a practical approach to achieve optimal production policy for imperfect multistage lean manufacturing system. Below managerial insights are inferred from the model analysis:
Insight 1. The proposed study provides a handy tool to the managers and decision-makers of the imperfect manufacturing process to transform it into lean-green manufacturing system by reducing excessive inventories and emissions of the complete multistage manufacturing process. This improves the effectiveness of the system decisions to attain economic as well as environmental sustainability.
Insight 2. Uncertainty control analysis indicates that the proposed model is significantly capable of handling high uncertainty in the parametric information by implementing WFGP approach. Model has achieved reasonable satisfaction levels of the conflicting objective functions under high uncertainty. Thus, managers can conclude best possible tradeoffs among corporate objectives through implementation of this study and can compute sustainable lot size for a sustainable manufacturing process.
Insight 3. Sensitivity analysis of the system confirms that the impact of setup cost and inventory carrying cost is same on the total cost of the system. Thus, managers must wisely decide about making efforts to reduce setup cost or carrying cost first. This can be done by implementing lean strategies including SMED (single minute exchange of dyes) and FIFO (first-in-first-out) approaches for cutting down setup cost and inventory carrying costs, respectively.
5. Conclusions
This research work provides an optimal production policy for uncertain process information in a multistage lean manufacturing process. Market demand information of the product is uncertain in nature. Imperfect manufacturing process produces defective products at an uncertain rate, which are reworked to convert them into perfect quality products and reduce wastages. To control this uncertainty in the market demand and manufacturing process, the decomposition principle and the signed distance method of fuzzy theory are applied. The manufacturing process is analyzed for its environmental concerns, and a sustainable lot size is obtained through metaheuristic approach for simultaneous achievement of economic as well as environmental sustainability. The WFGP approach is applied to handle the multi-objective model with conflicting objectives for cost and reductions of the system. An experimental study is performed to verify the practical implication of the model, and results are evaluated through an uncertainty control analysis and sensitivity analysis of the important parameters.
Experimental results verify that the proposed model provides a real-world approach to achieve the optimal production policy for an imperfect multistage lean manufacturing system by achieving an 84.07% satisfaction level for the cost-minimization objective and 64.74% satisfaction level for the emissions objective function. Imperative managerial insights are inferred from the analysis of the optimal results, which indicate the robustness of the proposed model and its applicability in the real-world lean-green manufacturing processes. The proposed study can be extended in several directions. Consideration of controllable production rate of the manufacturing system [25,26,27] can be the immediate possible extensions. Other potential extensions may include planned backlogging [28,29], partial backlogging [30,31,32], trade credit policies [33,34], random defective rate [35,36], product deterioration [37], and constrained manufacturing environment [38] in the production system.
Author Contributions
Conceptualization, M.T. and B.S.; Methodology, M.T.; Software, M.T.; Validation, B.S.; Formal analysis, M.T.; Investigation, M.T.; Resources, M.T. and B.S.; Data curation, M.T.; Writing—original draft preparation, M.T.; Writing—review and editing, M.U. and B.S.; Visualization, M.T., M.U. and B.S.; Supervision, B.S.
Funding
This research received no external funding.
Conflicts of Interest
The authors declare no conflict of interest.
Nomenclature
| Indices | |
| number of production stages, | |
| number of production stages, | |
| number of model objectives, | |
| Decision variables | |
| optimal lot size to achieve minimum system cost (items) | |
| optimal lot size to achieve minimum carbon emissions (items) | |
| optimal lot size to achieve economic and environmental sustainability (items) | |
| Parameters | |
| production rate of manufacturing stage- (items/year) | |
| customer demand (items/year) (fuzzy number) | |
| imperfect production proportion at stage- (fuzzy number) | |
| setup cost of manufacturing stage- ($/setup) | |
| production cost at manufacturing stage- ($/item) | |
| inventory carrying cost of finished items ($/item/year) | |
| emissions during setup at stage- (units/setup) | |
| emissions during product manufacturing at stage- (units/item) | |
| emissions during inventory carrying of finished items (units/item/year) | |
| average inventory of stage- (items per unit time) | |
| total cost of the system ($/unit time) | |
| total emissions of the system (units/unit time) | |
| importance weight of objective- for WFGP model | |
| satisfaction level of objective- | |
| fuzzy deviational variables | |
Abbreviations
Below abbreviations are used for the development of this model.
| WFGP | Weighted fuzzy goal programming |
| EPQ | Economic production quantity |
| TFN | Triangular fuzzy number |
| TC | Total cost |
| TE | Total Emissions |
| POF | Pay-off table |
| FMF | Fuzzy membership function |
References
- Hodge, G.L.; Goforth Ross, K.; Joines, J.A.; Thoney, K. Adapting lean manufacturing principles to the textile industry. Prod. Plan. Control 2011, 22, 237–247. [Google Scholar] [CrossRef]
- Fisher, M. Process improvement by poka-yoke. Work Study 1999, 48, 264–266. [Google Scholar] [CrossRef]
- McNamara, P. Psychological factors affecting the sustainability of 5S lean. Int. J. Lean Enterp. Res. 2014, 1, 94–111. [Google Scholar] [CrossRef]
- Bilalis, N.; Scroubelos, G.; Antoniadis, A.; Emiris, D.; Koulouriotis, D. Visual factory: Basic principles and the ‘zoning’ approach. Int. J. Prod. Res. 2002, 40, 3575–3588. [Google Scholar] [CrossRef]
- Sugimori, Y.; Kusunoki, K.; Cho, F.; Uchikawa, S. Toyota production system and kanban system materialization of just-in-time and respect-for-human system. Int. J. Prod. Res. 1977, 15, 553–564. [Google Scholar] [CrossRef]
- Fresner, J. Starting continuous improvement with a cleaner production assessment in an Austrian textile mill. J. Clean. Prod. 1998, 6, 85–91. [Google Scholar] [CrossRef]
- Ozturk, E.; Koseoglu, H.; Karaboyaci, M.; Yigit, N.O.; Yetis, U.; Kitis, M. Sustainable textile production: Cleaner production assessment/eco-efficiency analysis study in a textile mill. J. Clean. Prod. 2016, 138, 248–263. [Google Scholar] [CrossRef]
- Taft, E.W. The most economical production lot. Iron Age 1918, 101, 1410–1412. [Google Scholar]
- Sarkar, B.; Sana, S.S.; Chaudhuri, K. An imperfect production process for time varying demand with inflation and time value of money—An EMQ model. Expert Syst. Appl. 2011, 38, 13543–13548. [Google Scholar] [CrossRef]
- Chiu, S.W.; Chiu, Y.S.; Yang, J.C. Combining an alternative multi-delivery policy into economic production lot size problem with partial rework. Expert Syst. Appl. 2012, 39, 2578–2583. [Google Scholar] [CrossRef]
- Sarkar, B.; Chaudhuri, K.; Moon, I. Manufacturing setup cost reduction and quality improvement for the distribution free continuous-review inventory model with a service level constraint. J. Manuf. Syst. 2015, 34, 74–82. [Google Scholar] [CrossRef]
- Tayyab, M.; Sarkar, B. Optimal batch quantity in a cleaner multi-stage lean production system with random defective rate. J. Clean. Prod. 2016, 139, 922–934. [Google Scholar] [CrossRef]
- Kim, M.S.; Sarkar, B. Multi-stage cleaner production process with quality improvement and lead time dependent ordering cost. J. Clean. Prod. 2017, 144, 572–590. [Google Scholar] [CrossRef]
- Chang, H.C. An application of fuzzy sets theory to the EOQ model with imperfect quality items. Comput. Oper. Res. 2004, 31, 2079–2092. [Google Scholar] [CrossRef]
- Priyan, S.; Manivannan, P. Optimal inventory modeling of supply chain system involving quality inspection errors and fuzzy defective rate. OPSEARCH 2017, 54, 21–43. [Google Scholar] [CrossRef]
- Zeballos, L.J.; Méndez, C.A.; Barbosa-Povoa, A.P.; Novais, A.Q. Multi-period design and planning of closed-loop supply chains with uncertain supply and demand. Comput. Chem. Eng. 2014, 66, 151–164. [Google Scholar] [CrossRef]
- Sarkar, B.; Ganguly, B.; Sarkar, M.; Pareek, S. Effect of variable transportation and carbon emission in a three-echelon supply chain model. Transport. Res. Part E Logist. Transp. Rev. 2016, 91, 112–128. [Google Scholar] [CrossRef]
- Xu, Z.; Pokharel, S.; Elomri, A.; Mutlu, F. Emission policies and their analysis for the design of hybrid and dedicated closed-loop supply chains. J. Clean. Prod. 2017, 142, 4152–4168. [Google Scholar] [CrossRef]
- Gandhi, N.S.; Thanki, S.J.; Thakkar, J.J. Ranking of drivers for integrated lean-green manufacturing for Indian manufacturing SMEs. J. Clean. Prod. 2018, 171, 675–689. [Google Scholar] [CrossRef]
- Galeazzo, A.; Furlan, A.; Vinelli, A. Lean and green in action: Interdependencies and performance of pollution prevention projects. J. Clean. Prod. 2014, 85, 191–200. [Google Scholar] [CrossRef]
- Diaz-Elsayed, N.; Jondral, A.; Greinacher, S.; Dornfeld, D.; Lanza, G. Assessment of lean and green strategies by simulation of manufacturing systems in discrete production environments. CIRP Ann. Manuf. Technol. 2013, 62, 475–478. [Google Scholar] [CrossRef]
- Thanki, S.; Thakkar, J. Value-value load diagram: A graphical tool for lean-green performance assessment. Prod. Plan. Control 2016, 27, 1280–1297. [Google Scholar] [CrossRef]
- Jaber, M.Y.; Khan, M. Managing yield by lot splitting in a serial production line with learning, rework and scrap. Int. J. Prod. Econ. 2010, 124, 32–39. [Google Scholar] [CrossRef]
- Sarkar, B.; Mahapatra, A.S. Periodic review fuzzy inventory model with variable lead time and fuzzy demand. Int. Trans. Oper. Res. 2017, 24, 1197–1227. [Google Scholar] [CrossRef]
- Sarkar, B. An inventory model with reliability in an imperfect production process. Appl. Math. Comput. 2012, 218, 4881–4891. [Google Scholar] [CrossRef]
- Sarkar, B.; Sana, S.S.; Chaudhuri, K. Optimal reliability, production lotsize and safety stock: An economic manufacturing quantity model. Int. J. Manag. Sci. Eng. Manag. 2010, 5, 192–202. [Google Scholar] [CrossRef]
- Shin, D.; Guchhait, R.; Sarkar, B.; Mittal, M. Controllable lead time, service level constraint, and transportation discounts in a continuous review inventory model. RAIRO Oper. Res. 2016, 50, 921–934. [Google Scholar] [CrossRef]
- Sarkar, B.; Moon, I. Improved quality, setup cost reduction, and variable backorder costs in an imperfect production process. Int. J. Prod. Econ. 2014, 155, 204–213. [Google Scholar] [CrossRef]
- Sarkar, B.; Ahmed, W.; Kim, N. Joint effects of variable carbon emission cost and multi-delay-in-payments under single-setup-multiple-delivery policy in a global sustainable supply chain. J. Clean. Prod. 2018, 185, 421–445. [Google Scholar] [CrossRef]
- Sarkar, B.; Cárdenas-Barrón, L.E.; Sarkar, M.; Singgih, M.L. An economic production quantity model with random defective rate, rework process and backorders for a single stage production system. J. Manuf. Syst. 2014, 33, 423–435. [Google Scholar] [CrossRef]
- Sarkar, B.; Sarkar, S. An improved inventory model with partial backlogging, time varying deterioration and stock-dependent demand. Econ. Model. 2013, 30, 924–932. [Google Scholar] [CrossRef]
- Sarkar, B. A production-inventory model with probabilistic deterioration in two-echelon supply chain management. Appl. Math. Model. 2013, 37, 3138–3151. [Google Scholar] [CrossRef]
- Sarkar, B.; Sana, S.S.; Chaudhuri, K. An inventory model with finite replenishment rate, trade credit policy and price-discount offer. J. Ind. Eng. 2013, 1–18. [Google Scholar] [CrossRef]
- Cárdenas-barrón, L.E.; Sarkar, B.; Treviño-Garza, G. Easy and improved algorithms to joint determination of the replenishment lot size and number of shipments for an EPQ model with rework. Math. Comput. Appl. 2013, 18, 132–138. [Google Scholar] [CrossRef]
- Kang, C.W.; Ullah, M.; Sarkar, B.; Hussain, I.; Akhtar, R. Impact of random defective rate on lot size focusing work-in-process inventory in manufacturing system. Int. J. Prod. Res. 2017, 55, 1748–1766. [Google Scholar] [CrossRef]
- Ahmed, W.; Sarkar, B. Impact of carbon emissions in a sustainable supply chain management for a second generation biofuel. J. Clean. Prod. 2018, 186, 807–820. [Google Scholar] [CrossRef]
- Sarkar, B. An EOQ model with delay in payments and time varying deterioration rate. Math. Comput. Model. 2012, 55, 367–377. [Google Scholar] [CrossRef]
- Sarkar, M.; Sarkar, B.; Iqbal, M. Effect of Energy and Failure Rate in a Multi-Item Smart Production System. Energies 2018, 11, 2958. [Google Scholar] [CrossRef]
© 2018 by the authors. Licensee MDPI, Basel, Switzerland. This article is an open access article distributed under the terms and conditions of the Creative Commons Attribution (CC BY) license (http://creativecommons.org/licenses/by/4.0/).