Article

Effect of Time-Varying Factors on Optimal Combination of Quality Inspectors for Offline Inspection Station

by
Muhammad Babar Ramzan
1,
Shehreyar Mohsin Qureshi
2,
Sonia Irshad Mari
3,
Muhammad Saad Memon
3,
Mandeep Mittal
4,*,
Muhammad Imran
5 and
Muhammad Waqas Iqbal
6
1
Department of Garment Manufacturing, National Textile University, Faisalabad 37610, Pakistan
2
Department of Industrial and Manufacturing Engineering, NED University of Engineering and Technology, Karachi 75270, Pakistan
3
Department of Industrial Engineering and Management, Mehran University of Engineering and Technology, Jamshoro 76062, Pakistan
4
Department of Mathematics, Amity Institute of Applied Science, Amity University, Noida 201313, India
5
Department of Industrial and Management Engineering, Hanyang University, Seoul 15588, Korea
6
Department of Industrial Engineering, Hongik University, Seoul 04066, Korea
*
Author to whom correspondence should be addressed.
Mathematics 2019, 7(1), 51; https://doi.org/10.3390/math7010051
Submission received: 29 November 2018 / Revised: 24 December 2018 / Accepted: 29 December 2018 / Published: 7 January 2019

Abstract

:
With advanced manufacturing technology, organizations like to cut their operational cost and improve product quality, yet the importance of human labor is still alive in some manufacturing industries. The performance of human-based systems depends much on the skill of labor that varies person to person within available manpower. Much work has been done on human resource and management, however, allocation of manpower based on their skill yet not investigated. For this purpose, this study considered offline inspection system where inspection is performed by the human labor of varying skill levels. A multi-objective optimization model is proposed based on Time-Varying factors; inspection skill, operation time and learning behavior. Min-max goal programming technique was used to determine the efficient combination of inspectors of each skill level at different time intervals of a running order. The optimized results ensured the achievement of all objectives of inspection station: the cost associated with inspectors, outgoing quality and inspected quantity. The obtained results proved that inspection performance of inspectors improves significantly with learning and revision of allocation of inspectors with the proposed model ensure better utilization of available manpower, maintain good quality and reduce cost as well.

1. Introduction

Human labor and factors associated are one of the main engineering disciplines and play a vital role in maintaining good quality, manufacturing cost and productivity. Although researchers are working on automation and hybrid systems, however, the importance of human labor is not limited yet. One of the important advantage, of human labor over automation, is their decision-making ability. These type of abilities in human labor improves as skill level and experience increases. Organizations always want to utilize their manpower efficiently according to their capacity, yet there is a lack of studies that evaluate the human labor based on their skills. The present study has been conducted to fill this study gap by considering the skill level, operation time and learning behavior of human labor. For this purpose, a human-based quality control system is considered where most of the processes are carried out by human labor. Quality Control (QC) is an important part of quality management system that consists of monitoring activities along with quality planning, quality assurance and quality improvement [1]. The main objective of QC is to maintain the good level of quality by mitigating the root causes of defective products [2]. Inspection is the main activity of QC that is performed to decide the product’s conformance and non-conformance at different stages of manufacturing [3]. The process of inspection is investigated here to highlight the importance of inspection skill and inspection time in a manufacturing environment where learning affects significantly. Inspection can either be online or offline where online inspect the product during the process and offline inspect the product after the completion of the process [4,5]. Although online inspection has been considered as an economical method, however sometimes it is not feasible. Thus inspection process has to be done offline on finished or semi-finished products [
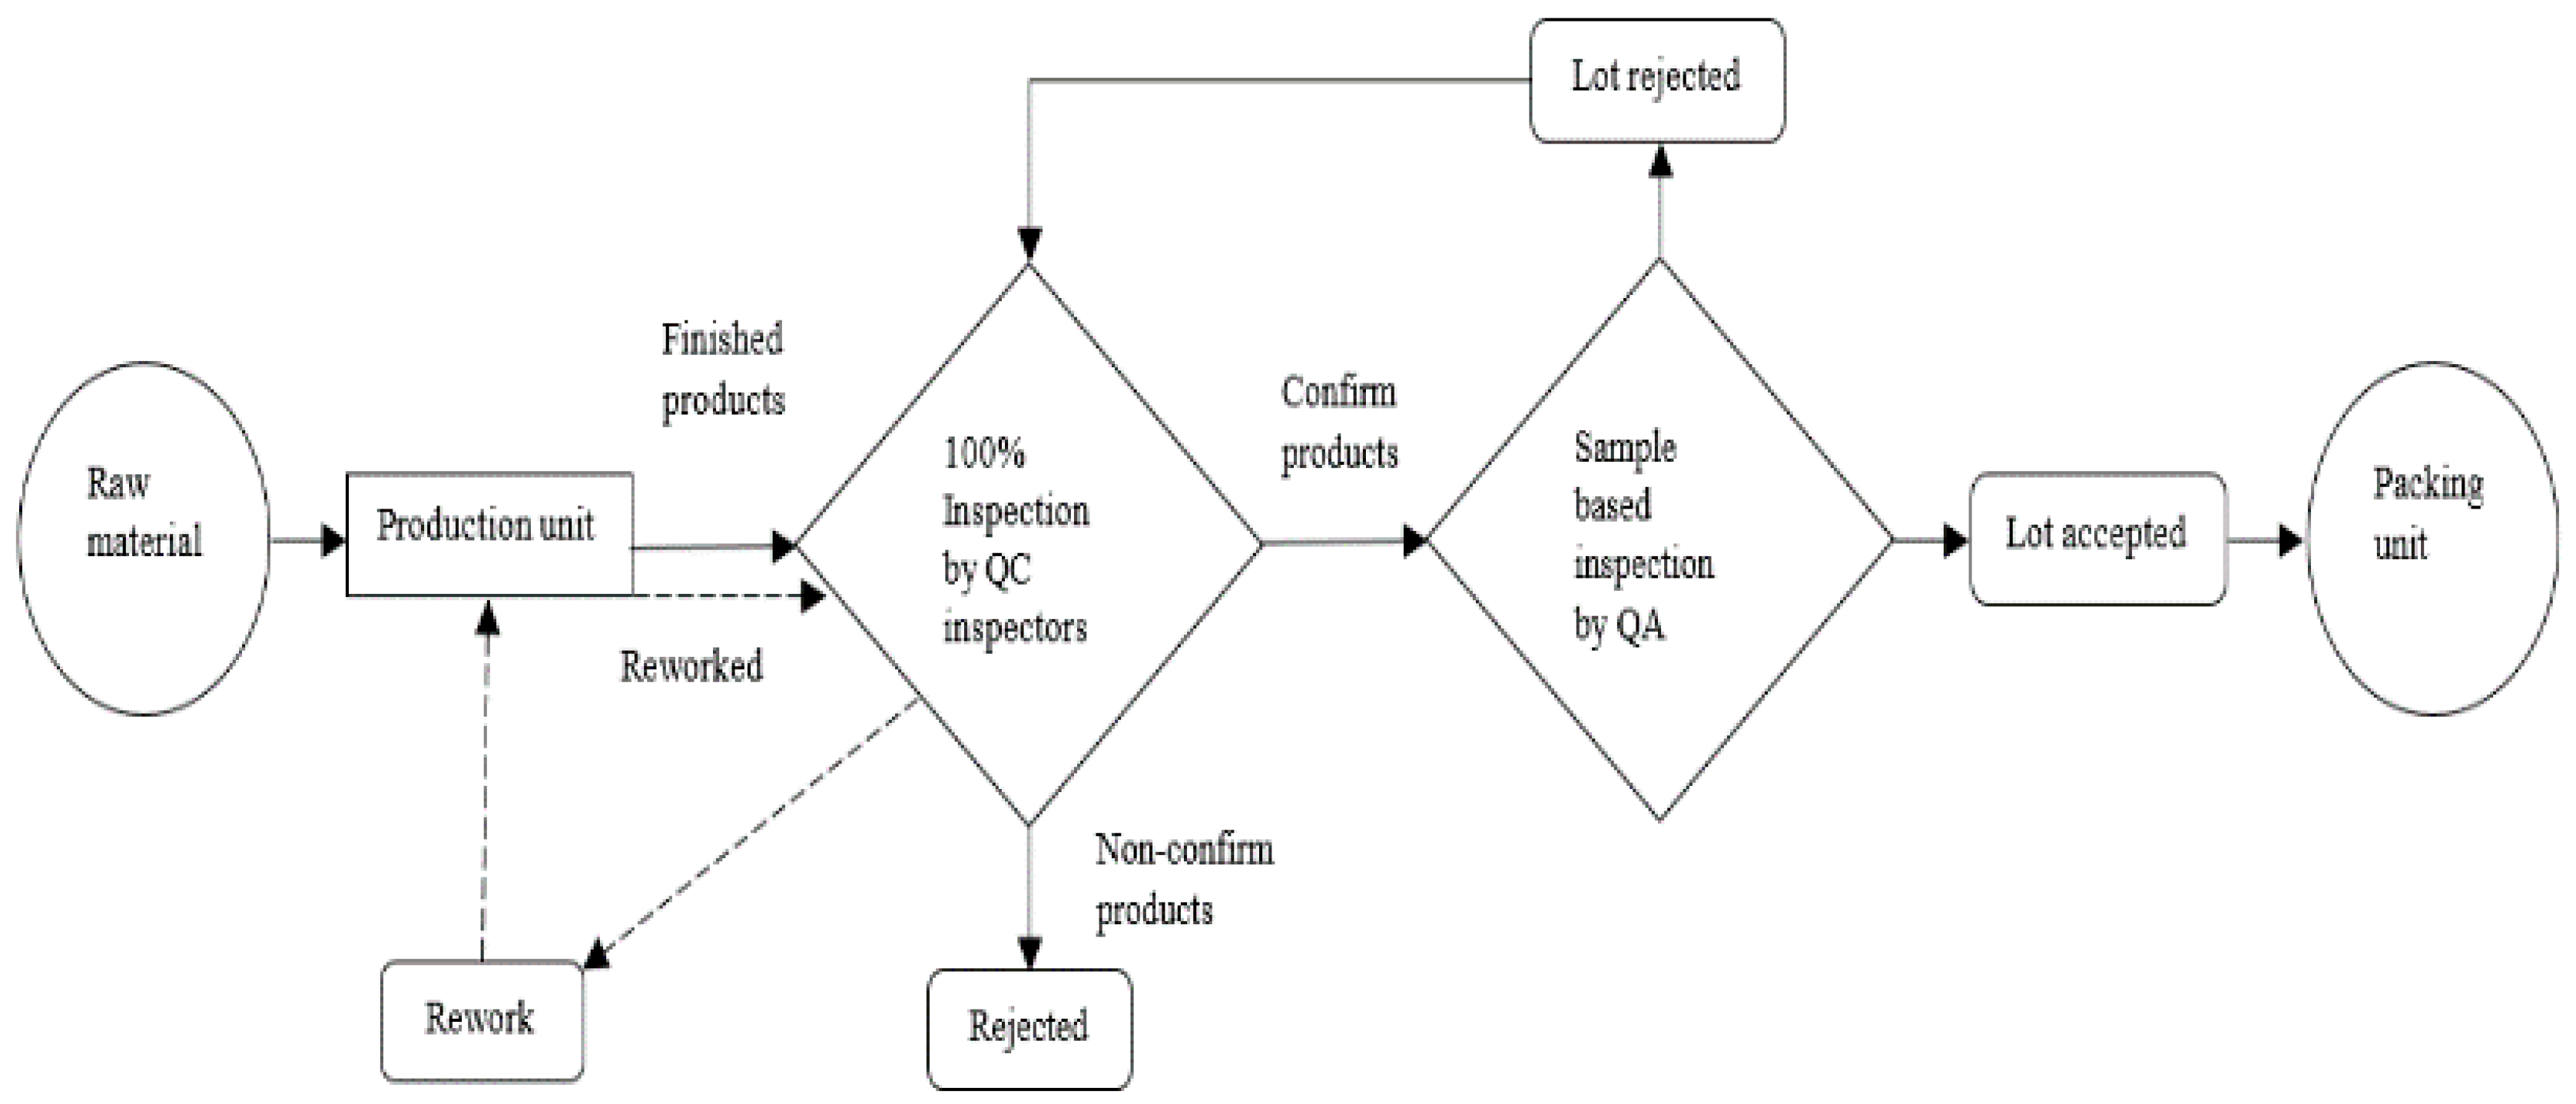
6]. This paper also considered offline station where 100% inspection is done by human labor.
In human based manufacturing setups, learning behavior imparts significant enhancements in the performance of labor and their skill improves with the passage of time. Researchers believed that any organization that learns faster will have a competitive advantage in the future. However, this learning varies person to person within an organization and help to classify the available manpower into their respective skill levels. Six types of learning have been identified and one of them is learning by doing like inspection process performed by human labor. While planning for the new order, allocation of manpower is done once, that is, before the start of order and same labor is used until the completion of the job. However, in the actual scenario, human labor learns from their experience and improve their performance with the passage of time. Thus, they will be able to do more work with better efficiency because of their improved skills. In this situation, the organization must revise the allocation of labor that may bring advantages like better utilization of available manpower, achievement of inspection targets, reduce cost and maintain good quality. Recently, the optimal number of quality inspectors have been determined to minimize cost [7,8]. However, the effect of Time-Varying factors, like learning behavior, on an efficient combination of inspectors is not considered yet. This study has kept this factor in contact and the process of inspection is investigated here to determine the optimal number of quality inspectors for inspection station over different time periods.

2. Literature Review

In past, plenty of work has been done on offline inspection to reduce the overall cost, increase company profit and improve product quality. These objectives have been achieved by giving due consideration to inspection policies, inspection systems and optimization of process target values. One of the pioneering work in developing inspection policy was done by Herer and Raz [9] to reduce the inspection cost using dynamic programming. The similar objective was also achieved by calculating optimal lot size and expected number of inspections [10]. After that plenty of work has been conducted to improve the effectiveness of inspection policy. Anily and Grosfeld-Nir [11] determined inspection policy and lot size for a single production run. Further investigation was done with two-time parameters and multiple productions run with rigid demand. Wang and Meng [12] developed a joint optimization model to determine the total cost function. Their model was compared with three policies like no inspection, full inspection and disregard the first s (DTF-s) items policies by a numerical example. Avinadav and Perlman [13] studied such process to minimize the cost by determining the optimal inspection interval. Sarkar and Saren [14] developed an inspection policy for an imperfect manufacturing system that has inspection error and warranty cost to reduce the inspection cost.
Other inspection strategies have also been developed that includes inspection disposition (ID) policy and inspection disposition and rework (IDR) policy. Raz, et al. [15] developed the first ID policy to minimize the cost function by solving the problem of economic optimization. After that their ID policy was extensively studied by other researchers with the consideration of different assumptions [16,17,18,19,20,21].
Continues sampling plan (CSP) is also a pioneering method of inspection in which 100% inspection and sampling inspection is alternatively conducted [22]. The basic sampling plan known as CSP-1 was developed by Dodge [23] to monitor the average outgoing quality level (AOQL). After that many modifications have been incorporated in the procedure of original CSP-1 by considering different assumptions [24,25,26,27,28,29,30].
The studies have also been conducted to optimize the process parameters by many investigators of quality control. After the pioneering work done by Springer [31], number of studies have been conducted to minimize the expected cost. Earlier a process target model (PTM) was proposed to optimize a single objective for three different types of screening problems [32]. Their aim was to cancel out the effect of error in inspection through the conception of cut off points that helped to divide the products into grade one, grade two and scrap. Duffuaa, et al. [33] proposed another PTM to increase the profit by assuming the independent characteristics of quality for a two-stage process. This PTM was also modified using acceptance sampling by Duffuaa, et al. [34] to achieve the same objectives. Recently, Multi-Objective Optimization (MOO) problem has been explored to find out the value of process parameters: income, profit and product uniformity [35,36,37]. The pioneer work on MOO was done considering 100% inspection policy to optimize the objective functions and Pareto optimal points were ranked by proposing an algorithm [36]. Their MOO model further reviewed by considering the sampling inspection however similar results were attained [37]. A further improvement was done considering two types of inspection errors because inspection system may be error-prone. After comparing the results of revised and previous models, it was concluded that inspection errors have a major effect on profit and uniformity. This study also worked on MOO and considered three important parameters to measure the performance of human labor while performing inspection process.
The philosophy of learning behavior is not only to improve the productivity but also look for other aspects that support the process of learning. That’s why a number of studies have found a relationship with quality control techniques and learning which was summarized by Jaber [38]. This combination of learning and quality control was first suggested by Koulamas [39] to evaluate the effect of product design on quality and cost. Teng and Thompson [40] worked on the learning behavior of workers and assessed that how it affects the quality and cost of the product. Similarly, Franceschini and Galetto [41] reduced the non-confirming quantity in production plant by improving the skill of workers. Jaber and Guiffrida [42] worked on wright’s learning curve [43] and proposed a quality learning curve (QLC) for a process that generates defects and required rework also. Further, this QLC was investigated by relaxing its different assumptions. Like Jaber and Guiffrida [44] assumed that an imperfect process can be interrupted to maintain quality and improved system’s performance. Similarly, Jaber and Khan [45] further relaxed two assumptions and considered scrap after production along with a rework of a lot. They concluded that optimal performance improves with learning and deteriorates when learning in rework becomes faster. It is observed that quantity and cost of production have a direct link with quality and this subject will have particular interest when combined with learning behavior. A number of researchers have been investigating errors in screening, however, the relationship between quality and screening need to be studied further Jaber [38]. This study has considered learning behavior in the proposed model and its effect on inspection performance of inspectors.
Despite the above-mentioned literature, the researchers have investigated this research area with respect to the application of new trends, techniques and methodologies in the human labor selection and job assignment. It includes artificial intelligence, genetic algorithm, goal programming, fuzzy logic, data mining and data envelopment analysis [46,47,48,49]. In a human based production environment, assigning the job to workers according to their competence is an important step to keep overall cost in control and maintain production efficiency. A fuzzy logic interface method has been proposed to assign and verify production jobs to human labor. The proposed method has been applied to a discrete manufacturing system to reduce the cost due to human errors [46]. Similarly, a synchronized job assignment model has been proposed to overcome the problem of human performance due to deviation in skill level and fluctuation of cycle time. A multi-objective simulation integrated hybrid genetic algorithm was used as a job assignment model such that it promotes teamwork and overcome the effect of varying skill level [49]. However, there is a lack of studies in which such new trends have been applied in human-based inspection system. This study has also addressed this gap by applying multi-objective goal programming to the offline inspection station.
Table 1 has summarized the span of work done on offline inspection. It indicates that how different researchers have contributed to the field under study and compare them with the present study. Despite much work, human-based inspection system has not been studied yet considering the effect of learning on the performance of labor with different skill levels. The present study has focused this gap to contribute to the current literature and investigated that how learning behavior of different inspectors affect the inspection performance and total manpower required for inspection station. The MOO model has been presented here that can determine the group of inspectors having different skill levels such that all objectives of inspection station are achieved.
This study also incorporates the effect of learning behavior on inspection skill of human labor in terms of quality, cost and quantity. The proposed model is able to determine the optimal values of inspectors at different time periods and compares that how the requirement of manpower varies from time to time due to learning.

3. Model Formulation

3.1. Definition of Research Problem

Figure 1 indicates the movement of input material through production unit and inspection stations to complete the manufacturing process that is assumed to be an imperfect process. The output products transfer to an offline inspection station for two-step inspection processes: 100% inspection followed by sampling inspection. The first inspection station has J number of inspectors that perform the process of 100% inspection. They have varying skill levels which are defined based on their quantity inspected per day and errors in inspection per day. Each inspector classifies the output products either confirming or non-conforming. A batch of conforming products, having fixed quantity N, is then presented for sampling inspection. On the other hand, non-conforming products can either be reworked or rejected.
A person with high inspection skill performs the Sampling inspection. The quantity n is randomly selected as a sample size from the presented batch/lot and the number of defective items d are separated. The value of d is compared with the threshold value c to make the final decision of lot acceptance or lot rejection. The decision will be to accept the lot if dc however lot will be rejected if d > c. The accepted lot is moved to the next process yet the rejected lot is returned to the same inspector for re-inspect. Defective items are separated from the rejected lot and exchanged with the conforming items to complete the batch for second sampling inspection. In order to calculate the quantity inspected per day and inspection cost per day of each inspector, number of accepted lots are used. Similarly, the value of outgoing quality is determined by the number of defectives items found. The value of Outgoing quality, accepted quantity and inspection cost depend on the number of inspectors and their skill levels that vary with the passage of time depending upon their learning behavior and experience.

3.2. Model Notations and Abbreviations

Model Notations

Sets
jtype of inspectors where, j = Low skill, Medium skill and High skill
llow skill l = 1, 2, 3, …, L
mmedium skill m = 1, 2, 3, …, M
hhigh skill h = 1, 2, 3, …, H
Parameters
Nlot/batch size
nsample size
ITjinspection time per unit taken by jth inspector
Vcost of inspection ($/min)
MImaximum allowable quality inspector
STstandard time of inspection of particular product
TVCTtarget of total cost for inspection station
AOQTtarget of outgoing quality for inspection station
TIQTtarget of accepted quantity for inspection station
Input variables
djnumber of defective items present in sample size n inspected of jth inspector
bjlearning rate of jth inspector
d 1 ± deviational variables for cost of inspectors
d 2 ± deviational variables for outgoing quality
d 3 ± deviational variables for accepted quantity
OQjaverage outgoing quality of jth quality inspectors
IQjinspected quantity by jth quality inspectors
VCjvariable cost of jth quality inspectors
Decision variables
NIjnumber of jth type of skilled labor

3.3. Outgoing Quality

Maintaining an acceptable level of Outgoing Quality (OQ) is one of the main objectives and its dependents on the skill of quality inspectors. The value of OQ can be measured by sample-based inspection process by determining the number of defectives present in inspected quantity. Let quantity Q of finished products move from the manufacturing unit to the offline station where 100% inspection is done. If Qj is the total quantity inspected by each inspector j and pj is the probability of separating the non-conforming (NC) products from confirming (C) products than the value of NC and C can be calculated as:
N C j =   p j × Q j
C j   =   ( 1 p j ) × Q j
The quantity NCj can either be sent for rework or rejected. Rework quantity (RWj) and rejected quantity (REj) can be calculated by the following equations:
R W j = α j × N C j   = α j × ( p j × Q j )
R E j = ( 1 α j ) × N C j   = ( 1 α j ) × ( p j × Q j )
where αj is the probability of rework-able quantity. Similarly, the conforming quantity is moved for the process of sampling inspection as a lot/batch of size N. The following equation can be used to determine the value of OQ,
O Q   =   n o   o f   d e f e c t i v e   i t e m s S a m p l e   s i z e
O Q j   =   d j n j   j
where d shows number of defects present in sample size n. Since, this study has focused on learning behavior of quality inspectors along with their skill and inspection time. Thus, with the passage of time, quality inspectors will make less inspection error that will improve their individual OQ as well as of inspection station. A similar concept of reduction in defective percentage was also addressed by Jaber and Guiffrida [44], keeping in view the wright’s learning curve. Their suggested formula is used here:
O Q ( w )   =   O Q s   ×   w b
where OQs is the initial value, b is the learning rate and OQ(w) is the value of outgoing quality level at wth week. Similarly, the value of OQ for any inspector j can be calculated as:
O Q j ( w ) =   O Q s   ×   w b j   j
where bj is the learning rate of inspector j. This study is investigating the human labor of J types of skill levels, thus Average Outgoing Quality (AOQ) can be calculated as:
A O Q ( w ) = j = 1 J O Q j ( w ) j N I j   j
A O Q ( w ) = O Q l ( w ) +   O Q m ( w ) +   O Q h ( w ) j N I j
A O Q ( w ) = N I L ( O Q s ,   l   ×   w b l ) +   N I M ( O Q s ,   m   ×   w b m ) +   N I H ( O Q s ,   h   ×   w b h ) j N I j
where bl, bm, bh indicate the learning rate of inspector with low, medium and high inspection skill respectively. Finally, the value of AOQ for j type of quality inspectors is calculated by Equation.
A O Q =   j = 1 J N I j ( O Q s ,   j   ×   w b j ) j N I j   j

3.4. Inspection Quantity

The second objective is to achieve the target of total inspection quantity to avoid any bottleneck and skill of quality inspector play a key role in this regard. Inspected quantity IQ is a quantity accepted by lot sampling process and is calculated for each inspector according to his inspection time. Quantity inspected by a jth inspector can be calculated as:
I Q =   T i m e   a v a i l a b l e I n s p e c t i o n   t i m e
I Q j =   T A I T j   j
where ITj is the inspection time taken by the jth quality inspector to inspect one item. With the passage of time, the efficiency of each quality inspector improves and inspected quantity increases because of reduction in inspection time due to learning. To calculate the improvement in inspection time, concept of wright’s learning curve [43] is used that suggests the exponential relationship between man hour and cumulative production.
I T ( w )   =   I T s   ×   w b
where ITs is the initial value of inspection time, b is the learning rate and IT(w) is the inspection time at wth week. Similarly, the value of ITj and IQj for a jth inspector can be calculated as:
I T j ( w ) =   I T s   ×   w b j   j
I Q j ( w ) =   T A I T j ( w )   =   T A I T s ,   j   ×   w b j   j
where bj is the learning rate of the jth quality inspector. Total inspected quantity TIQ of the offline station will include all J types of inspectors.
T I Q ( w ) = j = 1 J I Q j ( w )   j
T I Q ( w ) = I Q l ( w ) +   I Q m ( w ) +   I Q h ( w )
T I Q ( w ) = N I l ( T A I T s ,   l   ×   w b l )   + N I m ( T A I T s , m × w b m ) +   N I h ( T A I T s , h × w b h )
Total inspected quantity by J type of quality inspectors can be calculated by the following equation:
T I Q ( w ) = j = 1 J N I j ( T A I T s , j   ×   w b j )

3.5. Inspection Cost

Total inspection cost consists fixed cost (setup, inspection material, salaried workers etc.) and variable cost that is related to human labor. Since this study is investigating the skill of inspectors that vary with experience and learning of human labor, thus change in inspected quantity of inspector will also vary the related cost. This study is focusing more on the cost of quality inspectors that will be further used to optimize the total variable cost associated with all quality inspectors. By using inspected quantity IQj, the VCj can be calculated on the basis of time earned TEj for the jth quality inspector.
V C j   = T E j ×   V
T E j   = I Q j × S T
Thus
V C j   = ( I Q j × S T ) ×   V   j
where ST is the standard time of inspection of a particular product and V is the cost of inspection ($/min). As described earlier, a decrease in IT is observed based on the learning behavior of quality inspector that increase the IQ. Thus, the value of VCj for jth inspector at any stage w will be calculated as:
V C j ( w ) =   ( T A I T j ( w ) ) × S T ×   V
V C j ( w ) =   ( T A I T s ,   j   ×   w b j ) × S T ×   V
Total Variable Cost (TVC) of offline station that has J type of inspectors, will be calculated by as:
T V C ( w ) =   j = 1 J V C j ( w )   j
T V C ( w ) =   j = 1 J ( T A I T s ,   j   ×   w b j ) × S T ×   V
T V C ( w ) =   V C l ( w ) +   V C m ( w ) +   V C h ( w )
T V C ( w ) = { N I l ( T A I T s ,   l × w b l ) × S T × V } + {   N I m ( T A I T s , m × w b m ) × S T × V } + { N I h ( T A I T s , h × w b h ) × S T × V }
T V C ( w ) = { N I l ( T A I T s ,   l × w b l ) + N I m ( T A I T s , m × w b m ) + N I h ( T A I T s , h × w b h ) } × S T ×   V
Finally, the total variable cost of all J type of inspectors can be calculated by:
T V C   = { j = 1 J N I j ( T A I T s ,   j   ×   w b j ) } × S T × V

3.6. Objective Functions

The optimal values of decision variables are obtained using goal programming (GP) which is a type of multi-objective decision making and is widely used by many authors where more than one objective has to be achieved. The proposed model is also multi-objective that optimizes three objectives as mentioned below.
To keep the total cost per day TVC of all inspectors less than the target value of cost TVCT.
Z 1 = { j = 1 J N I j ( T A I T s ,   j   ×   w b j ) } × S T × V
To keep the quality level of inspection.
Z 2 = j = 1 J N I j ( T A I T s , j   ×   w b j )
To meet the daily target of inspection quantity.
Z 3 =   j = 1 J N I j ( O Q s ,   j   ×   w b j ) j N I j
In order to achieve these three objectives, the best combination of inspectors with respect to their skill levels need to be determined. GP variant, Min-max or Chebyshev GP, is used to determine the optimum decision variables by satisfying all the objective functions. In Chebyshev GP, the unwanted deviation for three goals was normalized. Percentage normalization was used in which each deviation is divided by target value of its respective objective. The objective function minimizes the worst or maximal deviation (λ) from amongst the set of three goals [66]. The GP formulation can be presented as follows:
M i n i m i z e   Z = λ
Subject to
d 1 + T V C T   λ
d 2 + A O Q T   λ
d 3 T I Q T   λ
{ j = 1 J N I j ( T A I T s ,   j   ×   w b j ) } × S T × V + d 1 d 1 + = T V C T
j = 1 J N I j ( O Q s ,   j   w b j ) j N I j +   d 2   d 2 +   = A O Q T
j = 1 J N I j ( T A I T s , j × w b j ) + d 3 d 3 +   =   T I Q T
j N I j M I   N I j 0
d t ,   d t +     0   t     { 1 , 2 , 3 }

4. Results and Discussion

The application of the proposed model is described here with the help of an example from garment manufacturing unit and an offline station is selected where the inspection of finished products is performed by human labor. The product selected for this study is a short sleeve polo shirt and the completion of the order will take 120 days. Since this study has incorporated the concept of learning and inspection skill of human labor will improve with the passage of time. This study has considered three skill levels, that is, low, medium and high, along with the three performance measures of inspection including cost, quality and quantity. Figure 2 indicates how these performance measures vary for three different skill levels.
At the start of order, the difference between three types of inspectors is not significant. However, the learning behavior varies person to person, that’s why some inspectors learn quickly and improve their overall skill as compared to others. To achieve the objectives of the inspection station, an efficient combination of inspectors must be maintained that utilize the available manpower according to their skill levels. Thus, the requirement of manpower with respect to the skill levels will vary until we complete the order. That’s why data were collected (Figure 2) for three different stages, that is, at the completion of 4th week (stage A), at the completion of 8th week (stage B) and at the completion of the 12th week (stage C). Keeping this scenario in view, data are collected for the selected product after the completion of each month and summarized in Table 2.
In order to analyze the data in Table 2, an Optimization software, that is, Lingo 15.0, was applied by keeping the following system configuration: Intel® Core™ i7-7500U CPU @ 2.70 GHz Intel, 8.00 GB of RAM. Min-max GP method was used to calculate the optimal values of decision variables that also gave the optimized results of objective functions. The obtained results are summarized in Table 3 for all three stages and analysis can be divided into two parts: analysis of decision variable and analysis of objective function.
The decision variable analysis shows the optimum number of inspectors with their respective skill levels for each stage. These results ensure that all the objectives (cost, quantity and quality) have been achieved. Since the study incorporated learning behavior in this proposed model, thus the value of incoming quantity also vary along with the skill of inspectors as the order progress. At the early stage, when required targets of objective functions were low and the performance of inspectors of each skill level was also at the initial stage. The optimal combination that can achieve all targets of inspection station requires more inspectors with high inspection skill in comparison to low and medium. This is the confirmation of the fact that if an offline station consists of low skill inspectors mainly as compared to medium or high skill inspectors, the cost of inspection station may be low but the target of inspection quantity and quality level will be difficult to maintain for offline station. Therefore, the organization like to maintain an inspection station that consists of the best combination of inspectors to achieve all targets simultaneously.
As the order progress, the skill of each quality inspectors improved so as the incoming quantity which changed the targets of inspection station as well. Thus, at the second stage, the optimal results were obtained to satisfy the revised targets. However, this time, a combination of inspectors is changed and more medium skill inspectors are included. It is because of the fact that learning improves the performance of all inspectors and then the inspection station was able to achieve targets with less utilization of high skill labor. Similarly, at the last stage, the optimal combination consists of more low and medium skill quality inspectors to fulfill the revised targets. It is because of the fact that skill of both low and medium skill inspectors was improved enough meet the demands and less contribution was required from high skill inspectors.
In a labor-intensive industrial setup like garment manufacturing, where the process of inspection is mainly performed by human labor, the presence of manpower with varying skill levels develops an environment that encourages the labor to compete with each other. Such a scenario provides them an opportunity to learn quickly that improve the level of their inspection skill at a faster rate. However, product type can significantly affect the rate of improvement in inspection skill. In case of a simple or basic garment, human labor can learn the things quickly because these products consist of fewer parts, a smaller number of operations or characteristics/features that a human inspector needs to inspect. On the other hand, this learning ability not only reduce but vary from person to person as the type of product moves to slightly complex, complicated or highly fashioned garments. This is because of the fact that these have more parts, increased number of operations and tough characteristics/features that an inspector need to inspect with concentration. Such products can affect the level of inspection skill of human labor that ultimately increases the inspection costs and decrease the outgoing quality. Similarly, the required manpower also changes with respect to product type to fulfill the requirements of the inspection station.
Analysis of the objective function, on the other hand, demonstrates the variance between the target values and the actual values of each goal at different stages, where underachieved values defined as d and overachieved value as d+. Min-max GP method provided optimum results of decision variables such that the set target of each objective function is attained. Even though underachieved and overachieved values are also there for different objective functions but all these deviational values do not violate the given conditions. Like in Table 3, overachieved value of the inspection quantity (d+) are 83, 138 and 28 for stage A, B and C respectively. However, it is still according to the constraints given in Section 3.6. Inspection quantity per day should not be less than the set target but presented results gave over achieved value, which is a positive side of the results. Similarly in Table 3, underachieved values of variable cost (d) are 48, 17 and 189 for stage A, B and C respectively. Since the constraint of the proposed model is to retain this variable cost low as much as possible so, these underachieved values also fulfill the already mentioned constraints.
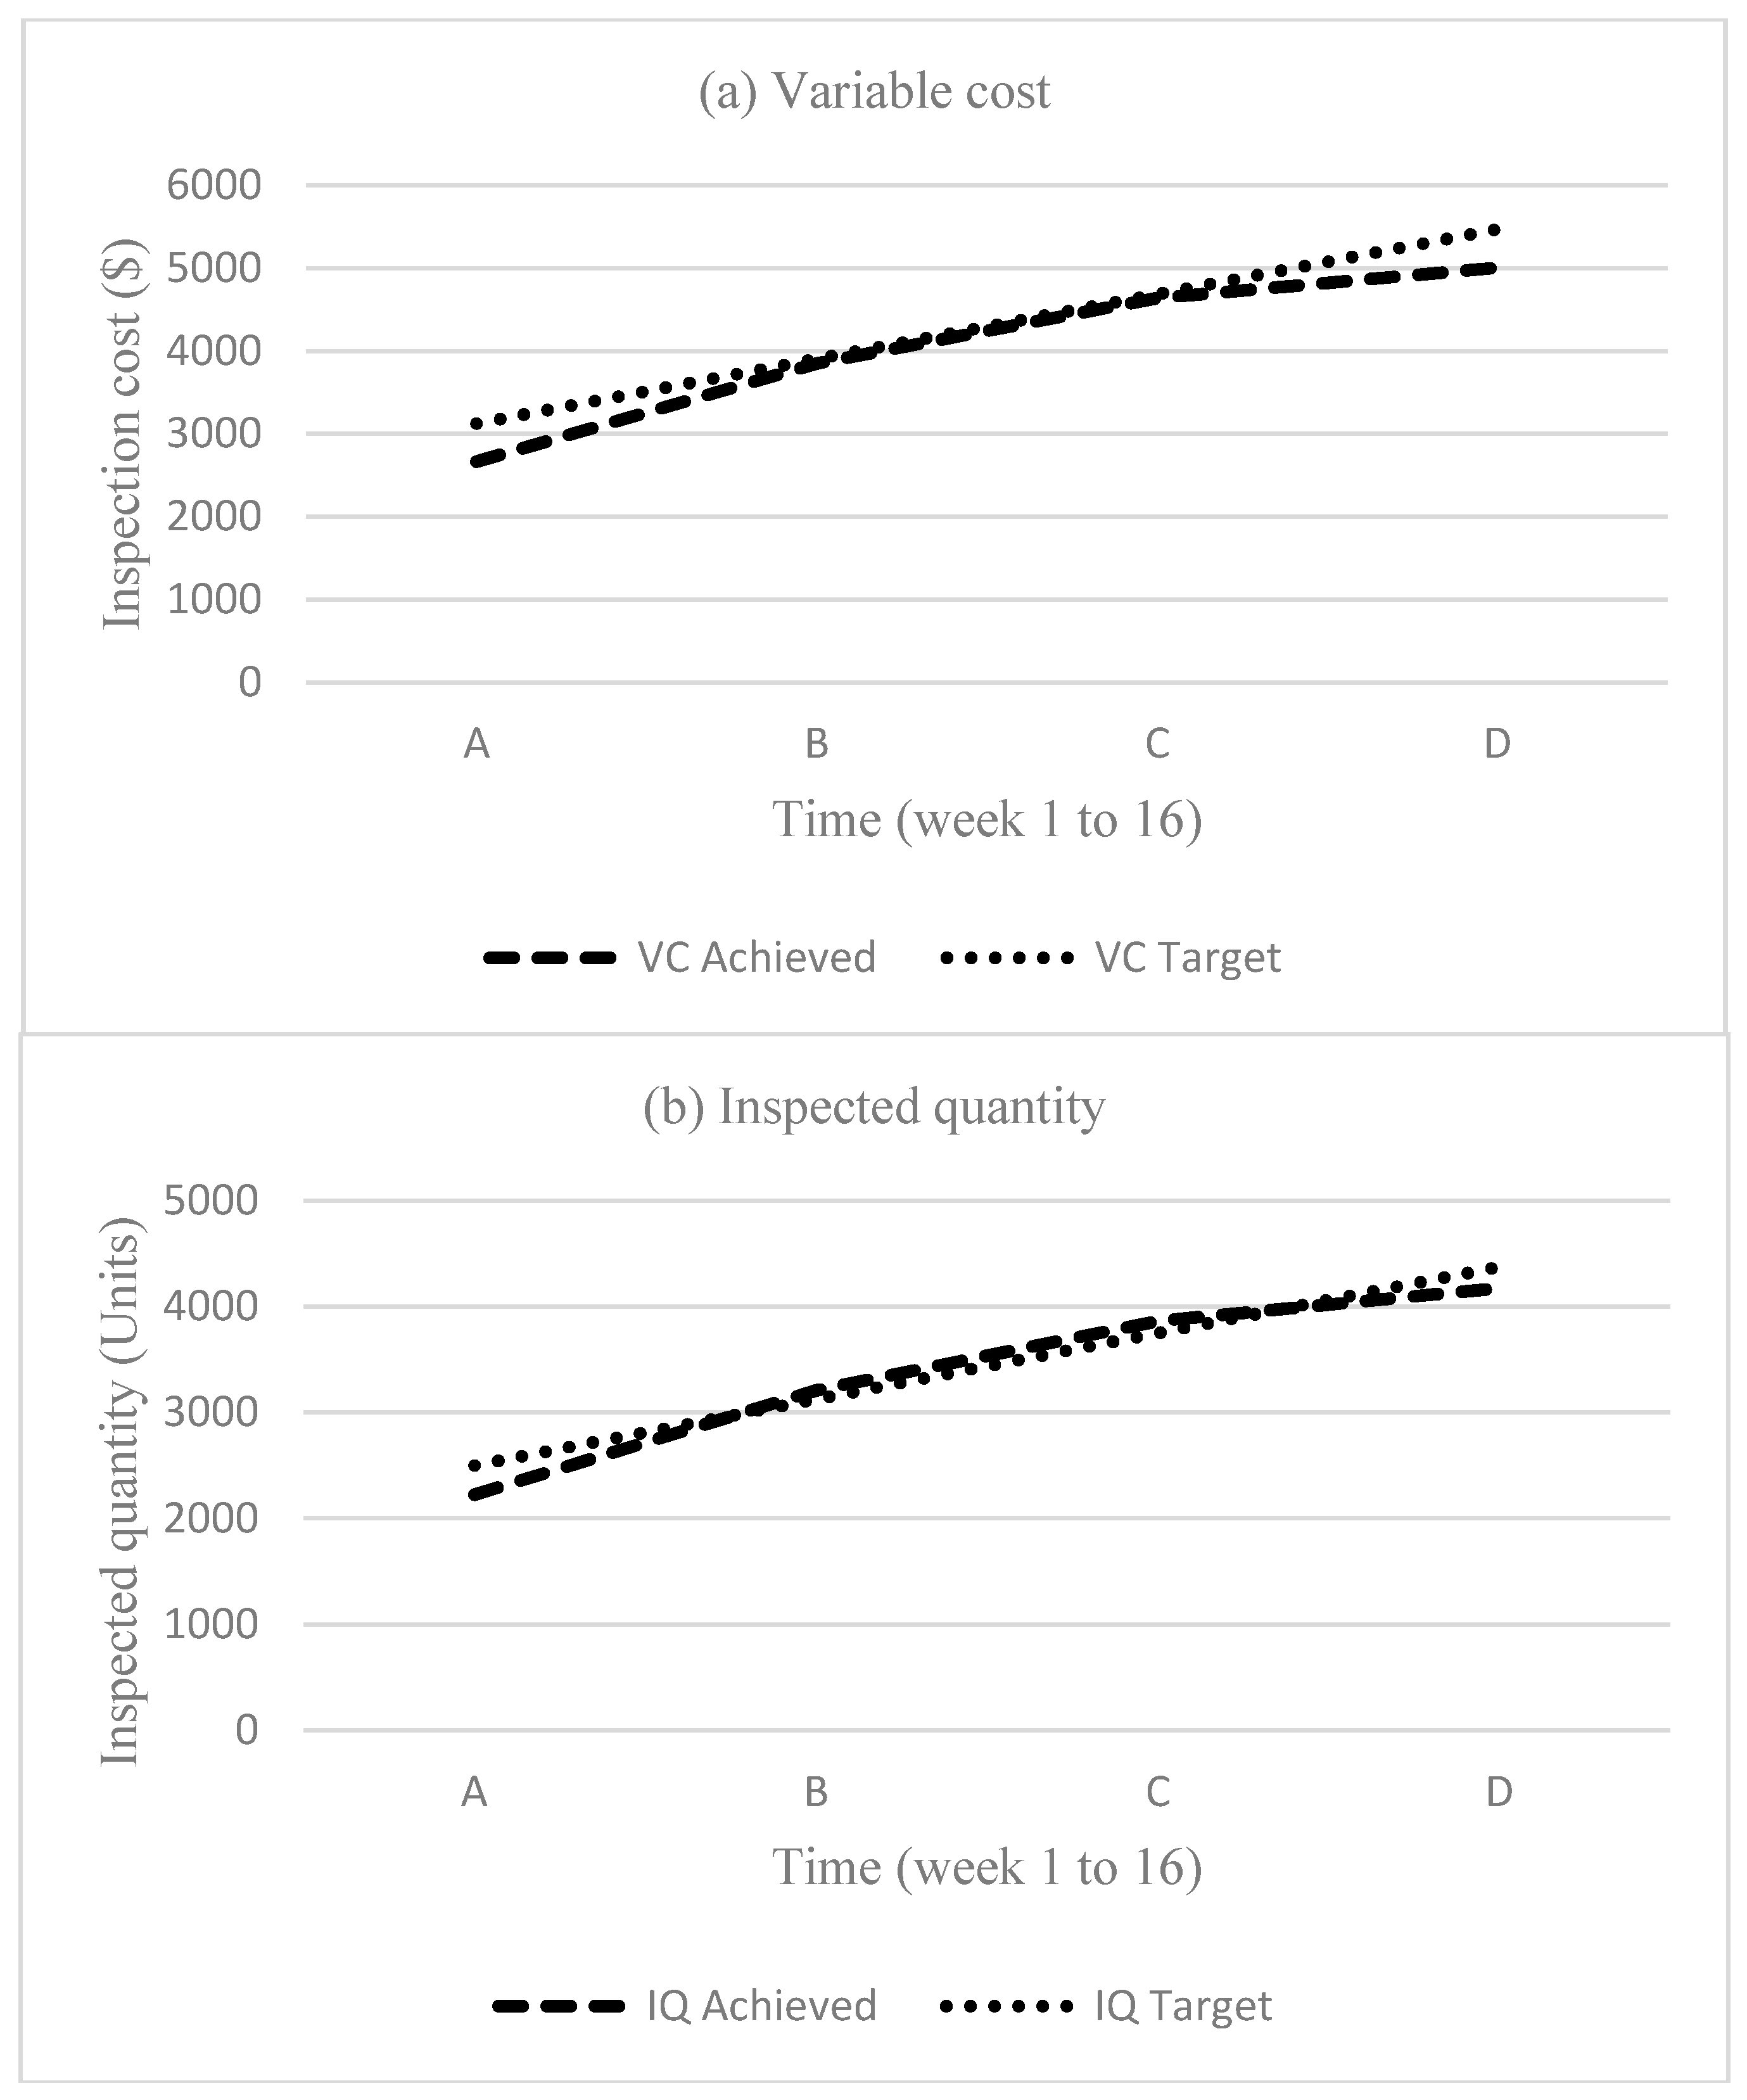
In actual scenario, organization/managers allocate manpower only once, that is, at the start of the order and do not change till the completion of the order. This situation is not in favor of organizations as they are not using their labor according to their capacity. It may cause different problems like bottleneck and poor outgoing quality. Figure 3 demonstrates this fact, where the group of inspectors with their respective skill level is kept same for a full order. Variation in achieved values and targets values was evaluated. For this purpose optimal combination obtained at stage A (Table 3) is used here. It highlights not only the importance of skill of inspectors and learning but also explains that why it is important to revise the allocation of manpower at the periodical interval.
It is evident from the Figure 3 that the combination of inspectors of different skill levels could not achieve the targets throughout the order even though learning is also considered. Especially, outgoing quality is not kept under control due to the high percentage of inspection error. On the other hand, inspected quantity hit the targets on some stages but underachieved as well that creates a bottleneck. Such a situation will increase the workload on inspectors, increase the chance of overtime and affect the quality of product also due to work in progress. However, in the actual scenario, the performance of labor is not the same and they improve with time due to learning and experience. Thus, revision of optimal combination of inspectors at different intervals will not only save cost and improve quality but also avoid overtime and utilize the manpower of organization efficiently. In this way, the organization will be able to use their high skill labor for inspection of complex products where more skilled labor is required. This study also provides a way how to imply the available labor and get work from them according to their skill capacity. Also, such systems provide competitive environments that will help the employee to improve their skills. However, further work must be done to explore the ways that increase the learning process and also provide some bases to establish the pay/salary scale for employees based on their improvement with time.

5. Conclusions

In this study, multi-objective optimization model is developed to utilize the manpower efficiently and assign them job according to their capacity. For this purpose, offline inspection system is considered where inspection is performed by the manpower of varying skill levels. A multi-objective optimization model is proposed based on inspection skill, operation time, learning behavior. Min-max goal programming technique was used to determine the efficient combination of inspectors of each skill level at different time intervals of running order. The optimized results ensured that all the objectives of offline inspection station are attained that contains: the cost associated with inspectors, outgoing quality and inspected quantity. The results proved that the performance of inspectors improves significantly with learning and allocation of inspectors should be revised after regular interval keeping in view the improvement in their skill levels. For this purpose, the proposed model is helpful for organizations to ensure better utilization of available manpower, maintain good quality and reduce cost as well. Moreover, this study provides the basis to the researchers to further explore this research area for its practical application in the human-based manufacturing system. Such studies can be used to develop specific software for the assessment of human labor and job assignment. Also, this study has considered the offline inspection, while future work should also be done on online inspection.

Author Contributions

The contribution of the respective authors are as follows: M.B.R. conducted the complete study with main contribution in conceptualization and original draft preparation under the supervision of M.M. While S.I.M. and M.S.M. contributed in developing and defining the methodology, formal analysis, and validation. S.M.Q. conducted the process of revision and editing. Lastly, M.I. and M.W.I. jointly contributed in applying the optimization software and data collection from the relevant industry.

Funding

This research received no external funding.

Conflicts of Interest

The authors declare no conflict of interest.

References

  1. Purushothama, B. A Practical Guide on Quality Management in Spinning; Woodhead Publishing: Delhi, India, 2011. [Google Scholar]
  2. Babu, V.R. Industrial Engineering in Apparel Production; Woodhead Publisher: Delhi, India, 2012. [Google Scholar]
  3. Ullah, M.; Kang, C.; Qureshi, A.S.M. A Study of Inventory Models for Imperfect Manufacturing setup Considering Work-in-Process Inventory. J. Soc. Korea Ind. Syst. Eng. 2014, 37, 231–238. [Google Scholar] [CrossRef]
  4. Tirkel, I.; Rabinowitz, G. Modeling cost benefit analysis of inspection in a production line. Int. J. Prod. Econ. 2014, 147, 38–45. [Google Scholar] [CrossRef]
  5. Tirkel, I.; Rabinowitz, G. The relationship between yield and flow time in a production system under inspection. Int. J. Prod. Res. 2012, 50, 3686–3697. [Google Scholar] [CrossRef]
  6. Tzimerman, A.; Herer, Y.T. Off-line inspections under inspection errors. IiE Trans. 2009, 41, 626–641. [Google Scholar] [CrossRef]
  7. Ramzan, M.B.; Kang, C.W. Minimization of inspection cost by determining the optimal number of quality inspectors in the garment industry. Indian J. Fibre Text. Res. 2016, 41, 346–350. [Google Scholar]
  8. Kang, C.W.; Ramzan, M.B.; Sarkar, B.; Imran, M. Effect of inspection performance in smart manufacturing system based on human quality control system. Int. J. Adv. Manuf. Technol. 2018, 94, 4351–4364. [Google Scholar] [CrossRef]
  9. Herer, Y.T.; Raz, T. Optimal parallel inspection for finding the first nonconforming unit in a batch—An information theoretic approach. Manag. Sci. 2000, 46, 845–857. [Google Scholar] [CrossRef]
  10. Grosfeld-Nir, A.; Gerchak, Y.; He, Q.-M. Manufacturing to order with random yield and costly inspection. Oper. Res. 2000, 48, 761–767. [Google Scholar] [CrossRef]
  11. Anily, S.; Grosfeld-Nir, A. An optimal lot-sizing and offline inspection policy in the case of nonrigid demand. Oper. Res. 2006, 54, 311–323. [Google Scholar] [CrossRef]
  12. Wang, C.-H.; Meng, F.-C. Optimal lot size and offline inspection policy. Comput. Math. Appl. 2009, 58, 1921–1929. [Google Scholar] [CrossRef] [Green Version]
  13. Avinadav, T.; Perlman, Y. Economic design of offline inspections for a batch production process. Int. J. Prod. Res. 2013, 51, 3372–3384. [Google Scholar] [CrossRef]
  14. Sarkar, B.; Saren, S. Product inspection policy for an imperfect production system with inspection errors and warranty cost. Eur. J. Oper. Res. 2016, 248, 263–271. [Google Scholar] [CrossRef]
  15. Raz, T.; Herer, Y.T.; Grosfeld-Nir, A. Economic optimization of off-line inspection. IiE Trans. 2000, 32, 205–217. [Google Scholar] [CrossRef]
  16. Finkelshtein, A.; Herer, Y.T.; Raz, T.; Ben-Gal, I. Economic optimization of off-line inspection in a process subject to failure and recovery. IiE Trans. 2005, 37, 995–1009. [Google Scholar] [CrossRef]
  17. Wang, C.-H. Economic off-line quality control strategy with two types of inspection errors. Eur. J. Oper. Res. 2007, 179, 132–147. [Google Scholar] [CrossRef]
  18. Wang, C.-H.; Hung, C.-C. An offline inspection and disposition model incorporating discrete Weibull distribution and manufacturing variation. J. Oper. Res. Soc. Japan 2008, 51, 155–165. [Google Scholar] [CrossRef]
  19. Bendavid, I.; Herer, Y.T. Economic optimization of off-line inspection in a process that also produces non-conforming units when in control and conforming units when out of control. Eur. J. Oper. Res. 2009, 195, 139–155. [Google Scholar] [CrossRef]
  20. Wang, W.-Y.; Sheu, S.-H.; Chen, Y.-C.; Horng, D.-J. Economic optimization of off-line inspection with rework consideration. Eur. J. Oper. Res. 2009, 194, 807–813. [Google Scholar] [CrossRef]
  21. Tsai, W.; Wang, C.-H. Economic optimization for an off-line inspection, disposition and rework model. Comput. Ind. Eng. 2011, 61, 891–896. [Google Scholar] [CrossRef]
  22. Montgomery, D.C. Introduction to Statistical Process Control, 6th ed.; John Wiley & Sons, Inc.: Hoboken, NJ, USA, 2009. [Google Scholar]
  23. Dodge, H.F. A sampling inspection plan for continuous production. Ann. Math. Stat. 1943, 14, 264–279. [Google Scholar] [CrossRef]
  24. Chen, C.-H.; Chou, C.-Y. Design of a CSP-1 plan based on regret-balanced criterion. J. Appl. Stat. 2000, 27, 697–701. [Google Scholar] [CrossRef]
  25. Govindaraju, K.; Kandasamy, C. Design of generalized CSP-C continuous sampling plan. J. Appl. Stat. 2000, 27, 829–841. [Google Scholar] [CrossRef]
  26. Richard Cassady, C.; Maillart, L.M.; Rehmert, I.J.; Nachlas, J.A. Demonstrating Deming’s kp rule using an economic model of the CSP-1. Qual. Eng. 2000, 12, 327–334. [Google Scholar] [CrossRef]
  27. Chen, C.-H.; Chou, C.-Y. Economic design of continuous sampling plan under linear inspection cost. J. Appl. Stat. 2002, 29, 1003–1009. [Google Scholar] [CrossRef]
  28. Yu, H.-F.; Yu, W.-C.; Wu, W.P. A mixed inspection policy for CSP-1 and precise inspection under inspection errors and return cost. Comput. Ind. Eng. 2009, 57, 652–659. [Google Scholar] [CrossRef]
  29. Yu, H.-F.; Yu, W.-C. A Joint Inspection Policy between CSP-1 and Precise Inspection for Non-repairable Products under Inspection Errors and Return Cost. J. Qual. 2011, 18, 61–73. [Google Scholar]
  30. Galindo-Pacheco, G.M.; Paternina-Arboleda, C.D.; Barbosa-Correa, R.A.; Llinás-Solano, H. Non-linear programming model for cost minimisation in a supply chain, including non-quality and inspection costs. Int. J. Oper. Res. 2012, 14, 301–323. [Google Scholar] [CrossRef]
  31. Springer, C. A method for determining the most economic position of a process mean. Ind. Qual. Control 1951, 8, 36–39. [Google Scholar]
  32. Duffuaa, S.O.; Siddiqui, A.W. Process targeting with multi-class screening and measurement error. Int. J. Prod. Res. 2003, 41, 1373–1391. [Google Scholar] [CrossRef]
  33. Duffuaa, S.O.; Al-Turki, U.M.; Kolus, A.A. A process targeting model for a product with two dependent quality characteristics using 100% inspection. Int. J. Prod. Res. 2009, 47, 1039–1053. [Google Scholar] [CrossRef]
  34. Duffuaa, S.; Al-Turki, U.; Kolus, A. Process-targeting model for a product with two dependent quality characteristics using acceptance sampling plans. Int. J. Prod. Res. 2009, 47, 4031–4046. [Google Scholar] [CrossRef]
  35. Duffuaa, S.O.; El-Ga’aly, A. Impact of inspection errors on the formulation of a multi-objective optimization process targeting model under inspection sampling plan. Comput. Ind. Eng. 2015, 80, 254–260. [Google Scholar] [CrossRef]
  36. Duffuaa, S.O.; El-Ga’aly, A. A multi-objective mathematical optimization model for process targeting using 100% inspection policy. Appl. Math. Model. 2013, 37, 1545–1552. [Google Scholar] [CrossRef]
  37. Duffuaa, S.O.; El-Ga’aly, A. A multi-objective optimization model for process targeting using sampling plans. Comput. Ind. Eng. 2013, 64, 309–317. [Google Scholar] [CrossRef]
  38. Jaber, M.Y. Learning Curves: Theory, Models, and Applications; CRC Press: Boca Raton, FL, USA, 2016. [Google Scholar]
  39. Koulamas, C. Quality improvement through product redesign and the learning curve. Omega 1992, 20, 161–168. [Google Scholar] [CrossRef]
  40. Teng, J.-T.; Thompson, G.L. Optimal strategies for general price-quality decision models of new products with learning production costs. Eur. J. Oper. Res. 1996, 93, 476–489. [Google Scholar] [CrossRef]
  41. Franceschini, F.; Galetto, M. Asymptotic defectiveness of manufacturing plants: An estimate based on process learning curves. Int. J. Prod. Res. 2002, 40, 537–545. [Google Scholar] [CrossRef] [Green Version]
  42. Jaber, M.Y.; Guiffrida, A.L. Learning curves for processes generating defects requiring reworks. Eur. J. Oper. Res. 2004, 159, 663–672. [Google Scholar] [CrossRef]
  43. Wright, T.P. Factors affecting the cost of airplanes. J. Aeronaut. sci. 1936, 3, 122–128. [Google Scholar] [CrossRef]
  44. Jaber, M.Y.; Guiffrida, A.L. Learning curves for imperfect production processes with reworks and process restoration interruptions. Eur. J. Oper. Res. 2008, 189, 93–104. [Google Scholar] [CrossRef]
  45. Jaber, M.Y.; Khan, M. Managing yield by lot splitting in a serial production line with learning, rework and scrap. Int. J. Prod. Econ. 2010, 124, 32–39. [Google Scholar] [CrossRef]
  46. Kłosowski, G.; Gola, A.; Świć, A. Application of fuzzy logic in assigning workers to production tasks. In Proceedings of the 13th International Conference Distributed Computing and Artificial Intelligence, Sevilla, Spain, 1–3 June 2016; pp. 505–513. [Google Scholar]
  47. Kuo, Y.-H.; Kusiak, A. From data to big data in production research: The past and future trends. Int. J. Prod. Res. 2018, 1–26. [Google Scholar] [CrossRef]
  48. Jasiulewicz-Kaczmarek, M.; Saniuk, A. Human factor in sustainable manufacturing. In International Conference on Universal Access in Human-Computer Interaction; Springer: Cham, Switzerland, 2015; pp. 444–455. [Google Scholar]
  49. Muhammad Imran, C.W.K. A Synchronized Job Assignment Model for Manual Assembly Lines Using Multi-Objective Simulation Integrated Hybrid Genetic Algorithm (MO-SHGA). J. Korean Soc. Ind. Syst. Eng. 2017, 40, 211–220. [Google Scholar] [CrossRef]
  50. Duffuaa, S.; Khan, M. Impact of inspection errors on the performance measures of a general repeat inspection plan. Int. J. Prod. Res. 2005, 43, 4945–4967. [Google Scholar] [CrossRef]
  51. Elshafei, M.; Khan, M.; Duffuaa, S. Repeat inspection planning using dynamic programming. Int. J. Prod. Res. 2006, 44, 257–270. [Google Scholar] [CrossRef]
  52. Duffuaa, S.O.; Khan, M. A general repeat inspection plan for dependent multicharacteristic critical components. Eur. J. Oper. Res. 2008, 191, 374–385. [Google Scholar] [CrossRef]
  53. Colledani, M.; Tolio, T. Performance evaluation of production systems monitored by statistical process control and off-line inspections. Int. J. Prod. Econ. 2009, 120, 348–367. [Google Scholar] [CrossRef]
  54. Vaghefi, A.; Sarhangian, V. Contribution of simulation to the optimization of inspection plans for multi-stage manufacturing systems. Comput. Ind. Eng. 2009, 57, 1226–1234. [Google Scholar] [CrossRef]
  55. Khan, M.; Jaber, M.; Wahab, M. Economic order quantity model for items with imperfect quality with learning in inspection. Int. J. Prod. Econ. 2010, 124, 87–96. [Google Scholar] [CrossRef]
  56. Yang, M. Minimization of Inspection Cost in an Inspection System Considering the Effect of Lot Formation on AOQ. Int. J. Manag. Sci. 2010, 16, 119–135. [Google Scholar]
  57. Khan, M.; Jaber, M.Y.; Bonney, M. An economic order quantity (EOQ) for items with imperfect quality and inspection errors. Int. J. Prod. Econ. 2011, 133, 113–118. [Google Scholar] [CrossRef]
  58. Khan, M.; Jaber, M.; Guiffrida, A. The effect of human factors on the performance of a two level supply chain. Int. J. Prod. Res. 2012, 50, 517–533. [Google Scholar] [CrossRef]
  59. Avinadav, T.; Sarne, D. Sequencing counts: A combined approach for sequencing and selecting costly unreliable off-line inspections. Comput. Oper. Res. 2012, 39, 2488–2499. [Google Scholar] [CrossRef]
  60. Bouslah, B.; Gharbi, A.; Pellerin, R. Joint production and quality control of unreliable batch manufacturing systems with rectifying inspection. Int. J. Prod. Res. 2014, 52, 4103–4117. [Google Scholar] [CrossRef]
  61. Khan, M.; Jaber, M.Y.; Ahmad, A.-R. An integrated supply chain model with errors in quality inspection and learning in production. Omega 2014, 42, 16–24. [Google Scholar] [CrossRef]
  62. Liu, N.-C.; Liu, W.-C. The effects of quality management practices on employees’ well-being. Total Qual. Manag. Bus. Excell. 2014. [Google Scholar] [CrossRef]
  63. Aslam, M.; Wu, C.-W.; Azam, M.; Jun, C.-H. Mixed acceptance sampling plans for product inspection using process capability index. Qual. Eng. 2014, 26, 450–459. [Google Scholar] [CrossRef]
  64. Yang, M.H.; Cho, J.H. Minimisation of inspection and rework cost in a BLU factory considering imperfect inspection. Int. J. Prod. Res. 2014, 52, 384–396. [Google Scholar] [CrossRef]
  65. Mohammadi, M.; Siadat, A.; Dantan, J.-Y.; Tavakkoli-Moghaddam, R. Mathematical modelling of a robust inspection process plan: Taguchi and Monte Carlo methods. Int. J. Prod. Res. 2015, 53, 2202–2224. [Google Scholar] [CrossRef]
  66. Jones, D.; Tamiz, M. Practical Goal Programming; Springer: Berlin, Germany, 2010; Volume 141. [Google Scholar]
Figure 1. Flowchart of production unit and inspection stations of a manufacturing system.
Mathematics 07 00051 g001
Figure 2. Influence of learning behavior on inspection performance of different inspectors.
Mathematics 07 00051 g002
Figure 3. Evaluation of objective functions with the same combination of inspectors.
Mathematics 07 00051 g003aMathematics 07 00051 g003b
Table 1. Summary of contribution made by previous studies.
AuthorsInspectionLearning BehaviorStudy Objective
StrategyErrorCostTimeSkill
Jaber and Guiffrida [42] Proposed quality learning curve
Finkelshtein, Herer, Raz and Ben-Gal [16]Sampling Optimal ID policy
Duffuaa and Khan [50]100% Repeat inspection plan to measures the performance
Anily and Grosfeld-Nir [11]Both Optimal inspection policy
Elshafei, et al. [51]100% Optimal inspection sequence for repeat inspection plan
Wang [17]Sampling Optimal ID policy
Duffuaa and Khan [52]Both Optimal inspection cycles
Wang and Hung [18]Sampling Optimal ID policy
Jaber and Guiffrida [44] Proposed QLC by relaxing assumptions
Wang and Meng [12]Both Optimal inspection policy
Colledani and Tolio [53]Sampling Analytical method of evaluation
Tzimerman and Herer [6]Sampling Optimal inspection policy
Bendavid and Herer [19]Sampling Optimal ID policy
Vaghefi and Sarhangian [54]Sampling Optimal inspection policy
Wang, Sheu, Chen and Horng [20]Sampling Optimal ID policy
Yu, Yu and Wu [28]Both Optimal inspection policy
Khan, et al. [55]100% Economic order quantity with learning in production
Jaber and Khan [45] Proposed QLC by relaxing assumptions
Yang [56]Both Optimization of K- stage inspection system
Khan, et al. [57]100% Economic order quantity
Tsai and Wang [21]Sampling Optimal IDR Policy
Yu and Yu [29]Both Optimal inspection policy
Khan, et al. [58]100% Effect on human factors on cost of supply chain
Avinadav and Sarne [59]Both Selection of inspection systems
Avinadav and Perlman [13]Sampling Optimal inspection interval
Duffuaa and El-Ga’aly [36]100% Maximization of income, profit, product uniformity
Duffuaa and El-Ga’aly [37]Sampling Maximization of income, profit, product uniformity
Bouslah, et al. [60]Sampling Joint production control and economic sampling plan
Khan, et al. [61]100% Integrated supply chain model
Liu and Liu [62]Sampling Resubmitted sampling scheme
Aslam, et al. [63]Sampling Mixed acceptance sampling plan
Yang and Cho [64]100% Optimal inspection cycles
Mohammadi, et al. [65]Sampling Effective robust inspection planning
Duffuaa and El-Ga’aly [35]Sampling Maximization of income, profit, product uniformity
Sarkar and Saren [14]Sampling Product inspection policy
Ramzan and Kang [7]Both MOO model to determine inspectors of different skills
Jaber [38] A review of studies linking quality with learning
Kang, Ramzan, Sarkar and Imran [8]Both MOO model to determine inspectors for different products
This paperBothMOO model to determine optimal quality inspectors
Table 2. Input data for short sleeve polo shirt.
NotationAt Stage AAt Stage BAt Stage C
ST (mins)0.960.960.96
OQT0.070.060.05
OQ0.120.100.08
OQm0.070.050.04
OQh0.040.030.02
TCT ($)390046905470
Cl ($)222247263
Cm ($)374440483
Ch ($)516645692
TIQT (Units)312537504375
IQl (Units)185206219
IQm (Units)311366403
IQh (Units)430537577
V ($/min)1.251.251.25
MI (Units)121212
Table 3. Optimized results of decision variables and objective functions for different stages.
Decision VariablesValuesObjectivesTargetDeviation Variables
SetAchievedd+d
Stage A
Low skill3Inspection cost ($)39003852048
Medium skill3Outgoing quality0.070.0700
High skill4Inspected quantity (Units)31253208830
Stage B
Low skill3Inspection cost ($)46884671017
Medium skill6Outgoing quality0.060.0600
High skill2Inspected quantity (Units)375038881380
Stage C
Low skill4Inspection cost ($)546952800189
Medium skill5Outgoing quality0.050.0500
High skill2Inspected quantity (Units)43754403280

