Article

QR-FOLDA: A Fast Orthogonal Linear Discriminant Analysis Based on QR Decomposition

1
School of Computer Science and Engineering, Chongqing University of Science and Technology, Chongqing 401331, China
2
State Key Laboratory of Mechanical Transmission for Advanced Equipment, College of Mechanical and Vehicle Engineering, Chongqing University, Chongqing 400044, China
*
Author to whom correspondence should be addressed.
Mathematics 2026, 14(6), 933; https://doi.org/10.3390/math14060933
Submission received: 7 December 2025 / Revised: 26 February 2026 / Accepted: 4 March 2026 / Published: 10 March 2026
(This article belongs to the Section E1: Mathematics and Computer Science)

Abstract

Orthogonal Linear Discriminant Analysis (OLDA) has been widely studied for dimensionality reduction, as the orthogonality constraints on its projection matrix enable more effective elimination of redundant features compared to conventional Linear Discriminant Analysis (LDA). However, most existing methods for solving OLDA rely on iterative optimization to sequentially construct orthogonal components, incurring massive repeated high-cost matrix operations and thus leading to substantial computational inefficiency. To address this limitation, we propose QR decomposition-based Fast OLDA (QR-FOLDA), a method built upon a theoretical result (Theorem 1) established in this work: the optimal solutions of LDA remain valid under any full-rank linear transformation. By leveraging this property, QR-FOLDA applies QR decomposition directly to the optimal LDA solution, thereby enforcing orthogonality while avoiding the repeated high-cost matrix operations typically involved in iterative optimization procedures. Experimental evaluations conducted on nine real-world datasets across various domains show that QR-FOLDA not only achieves substantial improvements in computational efficiency compared to existing OLDA methods but also delivers superior classification performance. These findings position QR-FOLDA as a theoretically sound and practically efficient solution for orthogonal discriminant analysis.

1. Introduction

With the rapid advancement of artificial intelligence and sensor technologies, the acquisition and storage of large-scale, high-dimensional data have become increasingly feasible [1]. While such data offer substantial informational richness and potential [2,3], they also pose significant technical challenges, including the curse of dimensionality and increased computational complexity [4,5,6]. As a result, dimensionality reduction techniques, capable of extracting essential features while eliminating redundant information, have emerged as indispensable tools for the effective analysis and processing of high-dimensional data [7,8,9].
Dimensionality reduction techniques primarily fall into two categories: feature selection and feature extraction [10,11]. Feature selection preserves the physical meaning of original features, thereby offering greater interpretability [11,12]. However, this approach inevitably incurs information loss due to feature elimination. In contrast, feature extraction employs data transformation to retain maximal information content, typically yielding superior downstream task performance compared to feature selection [13]. Linear Discriminant Analysis (LDA) is a classical feature extraction technique [14] that aims to maximize intra-class compactness and inter-class separation by finding an optimal projection or transformation matrix. Due to its generalized assumptions, intuitive model, and demonstrated performance improvements, LDA has been widely applied in data analysis, pattern recognition, and related fields [15,16,17].
However, due to the non-orthogonality of the projection matrix in LDA [18,19,20], it fails to effectively eliminate redundant features during data transformation [21,22]. Therefore, researchers have proposed Orthogonal LDA (OLDA), which enforces orthogonality constraints on projection vectors to mitigate feature redundancy and enhance downstream model performance. For instance, Nanni et al. [23] employed a stepwise iterative strategy to enforce mutual orthogonality among the projection vectors in LDA. In [24], a Regularized Fisher’s Linear Discriminant (RFLD) method was introduced, which integrates orthogonality constraints and utilizes eigen decomposition to iteratively eliminate the information contained in previously computed vectors, thereby ensuring orthogonality in subsequent projections. To further improve the computational efficiency of RFLD, Ye et al. proposed the Fast OLDA (FOLDA) algorithm [25], which replaces eigen decomposition with spectral regression to rapidly generate orthogonal projection vectors in RFLD. Furthermore, Ref. [26] reformulated the Rayleigh quotient of LDA into a difference-based optimization problem under the maximum margin criteria, enabling the efficient computation of orthogonal projection vectors. Chu et al. developed a new and fast OLDA (NFOLDA) algorithm that requires neither eigenvalue decomposition nor matrix inversion, solving the problem through several QR factorizations [27].
A critical review of prior studies shows that existing OLDA methods rely on iterative frameworks to sequentially construct orthogonal components, which inevitably introduce a large number of repetitive and computationally expensive matrix operations. To address this limitation, we propose a QR decomposition-based Fast Orthogonal Linear Discriminant Analysis (QR-FOLDA) algorithm that obtains the OLDA solution in a single step by applying QR decomposition to the optimal solution of classical LDA. This approach is grounded in a theoretical result established in this work (Theorem 1 in Section 3), which demonstrates an intrinsic property of LDA: its optimal solution remains valid for the original problem after a linear transformation. By exploiting this property, QR-FOLDA computes orthogonal projection vectors without iterative optimization, thereby significantly reducing computational cost while maintaining strong discriminative performance.
The main contributions and innovations of this work are as follows:
(1)
Unlike existing OLDA methods that construct orthogonal components sequentially during the optimization process, the proposed approach establishes a theoretical relationship between LDA solutions and leverages this relationship to obtain the OLDA solution indirectly. This represents a substantial departure from the conventional OLDA solution paradigm.
(2)
A theoretical result (Theorem 1) is established and rigorously proven that an LDA solution remains valid under any linear transformation. This result enables the proposed method to orthogonalize the LDA solution via QR decomposition, thereby obtaining the OLDA solution without iterative construction.
(3)
Experimental results demonstrate that QR-FOLDA consistently outperforms existing OLDA algorithms by delivering lower computational costs and higher classification accuracy. These results not only confirm the method’s theoretical soundness but also establish it as a practically robust solution for real-world dimensionality reduction tasks.

2. Related Works

In this section, several representative OLDA solution methods, such as Maximum Margin Criterion (MMC) [26], RFLD [24], fast OLDA (FOLDA) [25] and NFOLDA [27], are introduced. Before presenting these algorithms, however, a brief overview of OLDA is first provided.

2.1. OLDA

OLDA seeks to identify a set of orthogonal projection vectors that simultaneously enhance intra-class compactness and inter-class separation of data samples [23]. The objective function can be formulated as
max W T r ( W T S b W ) T r ( W T S w W ) s . t . W T W = I
where S w = l = 1 c i = 1 n l ( x i μ l ) ( x i μ l ) T and S b = l = 1 c n l ( μ l μ ) ( μ l μ ) T denote the intra- and inter- class scatter matrices, respectively, c means the number of classes, n l represents the number of l-th class samples, μ l is the l-th class center, μ indicates the center of samples.

2.2. Maximum Margin Criterion (MMC)

The Maximum Margin Criterion (MMC) [26] reformulates the objective function of OLDA through a different reconstruction, with the transformed objective function expressed as
max W T W = I T r ( W T X ¯ M X ¯ T W W T X ¯ X ¯ T W )
where X ¯ denotes the centered data matrix of X , M = d i a g [ M ( 1 ) , M ( 2 ) , , M ( c ) ] is an n × n block-diagonal matrix, each submatrix M ( l ) is an n l × n l matrix with all elements equal to 1 / n l .
The projection vectors W correspond to the set of eigenvectors associated with the top m largest eigenvalues of the matrix X ¯ M X ¯ T X ¯ X ¯ T . It is of importance to note that while MMC does not suffer from singularity issues, it shares the same limitation as classical LDA (namely, the dimensionality of the most discriminative projection vectors is constrained to c 1 ).

2.3. RFLD

To obtain the orthogonal projection vectors of LDA, the Regularized Fisher’s Linear Discriminant (RFLD) [24] reformulates the OLDA objective function based on the graph embedding framework. The modified objective function is given as
W = arg max t r ( W T X M X T W ) t r ( W T X X T W )
where n represents the total number of samples.
During the computation of orthogonal vectors, the method adopts an iterative approach to determine the orthogonal projection vectors. Throughout the optimization process of Equation (3), each newly generated feature vector must consistently satisfy the following constraints
w k = arg max w T X ( k ) M X ( k ) T w w T X ( k ) X ( k ) T w s . t . w k T w 1 = w k T w 2 = = w k T w k 1 = 0
where X ( k ) = X W ( k 1 ) W ( k 1 ) T X represents the updated sample matrix, which eliminates residual information captured by previously computed orthogonal projection vectors.
To enforce orthogonality between w k and prior projection vectors, RFLD combines the constraints with the generalized eigenvalue problem X ( k ) M X ( k ) T w = λ X ( k ) X ( k ) T w . This leads to the following augmented system: C ( k ) w = λ B ( k ) w , where B ( k ) = ( X ( k ) M X ( k ) T , w 1 , , w k 1 ) T ( d + k 1 ) × d and C ( k ) = ( X ( k ) X ( k ) T , 0 , , 0 ) T ( d + k 1 ) × d .
Given that B k is full rank, the solution w k corresponds to the eigenvector associated with the largest eigenvalue of B k T C w = λ B k T B k w .

2.4. FOLDA

Building upon the conceptual framework of RFLD, Reference [25] proposed the Fast Orthogonal Linear Discriminant Analysis (FOLDA) algorithm, which maintains the same objective function as RFLD (Equation (3)). However, FOLDA introduces a more computationally efficient approach by employing spectral regression (SR) to compute individual projection vectors, in contrast to the singular value decomposition (SVD) method used in RFLD. This methodological advancement substantially improves computational efficiency while preserving the theoretical soundness of the algorithm.

2.5. NFOLDA

In [27], the authors proposed a new method for fast solving OLDA, named NFOLDA. This approach effectively avoids eigenvalue decomposition and matrix inversion. Through rigorous mathematical proofs, it achieves the solution with several QR factorizations. The specific procedure is as follows:
  • Compute the economic QR factorization of X as X = U 1 R , where U 1 is column orthogonal and R = [ R 1   R 2   R 3 ] .
  • Compute [ R 2   R 3 ] = Q 1 R 1 , 1 0 0 R 1 , 2 R 2 , 2 0 , where Q1 is a column orthogonal matrix, R 1 , 1 and R 2 , 2 are of full row rank, and γ = r a n k [ R 2   R 3 ] .
  • Compute Q R ( R 1 , 2 R 2 , 2 R 2 , 2 T ) = V P 0 , where V R γ × γ is orthogonal.
  • Obtain W ^ = U 1 Q 1 ( : , 1 : γ ) V ( : , λ + 1 m : γ ) , where m indicates the number of dimensions after reduction.

3. Methodology

3.1. Proposed Method (QR Decomposition-Based FOLDA)

To address the dimensionality bottleneck and computational complexity associated with conventional orthogonal linear discriminant analysis (OLDA) in high-dimensional data processing, this paper proposes an efficient OLDA solution method. The proposed approach first leverages the intrinsic relationships among LDA solutions (the optimal solution of LDA remains valid under a linear transformation) and then applies QR matrix decomposition to derive the OLDA projection matrix for orthogonal data transformation. In contrast to computation-intensive methods such as RFLD, the proposed method substantially reduces computational time while improving algorithmic efficiency and practical applicability.
To efficiently compute the orthogonal LDA projection matrix W , the objective function of orthogonal LDA can be reformulated as follows:
max W T r W T S w W 1 W T S b W s . t . W T W = I
It should be particularly noted that the within-class scatter matrix S w is assumed to be positive definite. If the input data satisfy S w = 0 , a situation commonly encountered in high-dimensional or small-sample-size scenarios, a regularization strategy is adopted by replacing S w with a stabilized matrix S w + δ I , where δ 0 is a small regularization parameter (In this study, δ is set to 10−6). This modification ensures that the resulting within-class scatter matrix becomes positive definite, thereby allowing the Fisher discriminant objective to be formulated as a generalized eigenvalue problem derived from the maximization of a generalized Rayleigh quotient.
First, consider the unconstrained trace optimization problem of Equation (5).
max W T r W T S w W 1 W T S b W
Assuming W ^ is the optimal solution to Equation (6), and utilizing the property that similar matrices have equal traces, we derive the following:
T r W ^ T S w W ^ 1 W ^ T S b W ^ = T r Q T W ^ T S w W ^ Q 1 Q T W ^ T S b W ^ Q
where Q is an arbitrary invertible matrix of size m × m .
From Equation (7), it follows that the unconstrained problem defined in Equation (6) possesses the following property. If W ^ is an optimal solution to Equation (6), then W ^ Q is also an optimal solution for any invertible matrix Q. To formally establish this property and facilitate the determination of the optimal solution, we first present Theorem 1 along with its proof.
Theorem 1.
Let V d × m be the matrix consisting of the generalized eigenvectors corresponding to the largest m eigenvalues of the matrix pair ( S b , S w ). Q is an arbitrary invertible matrix of dimension m × m . Then, the matrix V Q also constitutes an optimal solution to Equation (6).
Proof. 
By applying an identity transformation to both sides of the equation, we derive the following
T r W T S w W 1 W T S b W = T r W T S w W 1 2 W T S b W W T S w W 1 2 = T r V T S b V
where V = W W T S w W 1 2 .
Here, it clearly holds that V T S w V = I . Consequently, the unconstrained problem (Equation (6)) can be reformulated as
m a x V T S w V = I T r V T S b V
The solution to Equation (9) is derived using the method of Lagrange multipliers. The corresponding Lagrangian function is formulated as follows
L V , λ = T r V T S b V T r λ V T S w V I
To obtain the optimal solution of Equation (9), the parameters λ and V must be determined such that the constraint V T S w V = I is satisfied and the partial derivative of Equation (10) with respect to V equals zero. Assuming λ is a symmetric matrix, it can be decomposed as λ = U Λ U T , where Λ is the eigenvalue matrix of λ and U is the corresponding eigenvector matrix. Taking the partial derivative of Equation (10) with respect to V and setting it to zero yields:
L V , λ V = 2 S b V 2 S w V λ = 0 λ = U Λ U T S b V = S w V U Λ U T
where U can be absorbed through a right-orthogonal transformation of V without altering the optimization problem or its solution space. Therefore, Equation (11) can be rewritten as
S b V = S w V Λ S w 1 S b V = V Λ
Since S w is symmetric and positive definite, the generalized eigenvectors V in Equation (12) can be chosen and normalized to be S w -orthonormal so that V T S w V = I . Thus, when the Lagrange coefficient λ = Λ and V consists of the generalized eigenvectors of the matrix pair ( S b , S w ), both the constraint V T S w V = I and L V , λ / V = 0 remain valid. Consequently, the solution to Equation (9) reduces to solving the generalized eigenvalue decomposition in Equation (12), where V comprises the generalized eigenvectors corresponding to the largest m eigenvalues of the matrix pair ( S b , S w ). Therefore, V is the optimal solution to the unconstrained problem defined in Equation (6).
Thus, based on the properties of the unconstrained problem and the relation V = W W T S w W 1 2 , it follows that for any invertible m × m matrix Q , V Q remains an optimal solution to the unconstrained problem (Equation (6)). □
Now consider solving the constrained problem (Equation (5)) subject to W T W = I .
From Theorem 1, the optimal solution to the unconstrained problem is V Q d × m . Applying QR decomposition to V Q yields
Q R V Q = W ^ R
where W ^ d × m is the orthogonal matrix from the QR decomposition (satisfying W T W = I ), R m × m is the upper triangular matrix.
By Theorem 1 and the properties of the unconstrained problem, W ^ is the optimal solution to the constrained problem defined in Equation (5).
The pseudo code of the proposed algorithm is as follows (Algorithm 1, proposed method).
Algorithm 1. Proposed Method (QR-FOLDA)
Input: dataset X N × d , label of dataset Y, penalty factors δ(=10−6), dimension after mapping (m).
Begin
   Calculate μ l and μ ;
   Calculate S w and S b according to S w = l = 1 c i = 1 n l ( x i μ l ) ( x i μ l ) T and S b = l = 1 c n l ( μ l μ ) ( μ l μ ) T ;
   If S w = 0
    S w = S w + δ I ;
   End if
   V is solved by the generalized eigenvalue problem of classical LDA;
   Generate a random invertible matrix Q;
   Apply a QR decomposition to VQ, yielding W R = Q R ( V Q ) .
End
Output: the orthogonal projection matrix W d × m .

3.2. Computational Complexity Analysis

Although numerous methods have been proposed for solving orthogonal LDA, notable differences in computational efficiency persist among them in practical applications. Accordingly, this section presents a theoretical analysis and comparison of the computational efficiency of representative approaches.
MMC: The method directly computes the eigenvectors corresponding to the largest m eigenvalues of the matrix X ¯ M X ¯ T X ¯ X ¯ T . This requires first calculating the matrices X ¯ M X ¯ T and X ¯ X ¯ T with time complexities of O n 2 d + n d 2 and O n d 2 respectively, followed by computing the top m eigenvectors of X ¯ M X ¯ T X ¯ X ¯ T with a complexity of O m d 2 . Consequently, the main computational complexity of MMC is O n 2 d + 2 n + m d 2 .
RFLD: RFLD involves two main computational steps. First, solving for the initial projection vector w 1 requires addressing the generalized eigenvalue problem X ¯ M X ¯ T w = λ X X ¯ T , with a computational complexity of O n 2 d + n d 2 + d 3 . Second, computing subsequent vectors w k (k ≥ 2) involves solving the generalized eigenvalue problem B k T C k w = λ B k T B k w , where matrices B k and C k both have dimensions d + k 1 × d . The computation of the generalized eigenvalue problem requires first calculating matrices B k and C k , corresponding to X ¯ k M X ¯ k T and X ¯ k X ¯ k T respectively, with a time complexity of O d n 2 + n d 2 . Subsequent computation of B k T C k and B k T B k incurs O d + k 1 d 2 operations, followed by solving for w k (analogous to w 1 ) with O d 2 + d 3 complexity. Consequently, the total computational complexity for each w k becomes O n 2 d + n + d + k d 2 + d 3 . The combined time complexity for obtaining projection vectors w 2 , w 3 , , w m amounts to O ( 1 2 m 2 + 2 m n ) d 2 + m d 3 . Thus, the main computational complexity of RFLD is O m n 2 d + 1 2 m 2 + 2 m n d 2 + m d 3 .
FOLDA: Similar to RFLD, the solution process of FOLDA also consists of two main steps. The first step solves for the initial projection vector w 1 by optimizing the regression problem w 1 = arg min w X ¯ T w a 2 , which has a computational complexity of O n s , where s represents the average number of non-zero features per sample in X ¯ . The second step computes subsequent vectors w k through three operations: QR decomposition of W k 1 with O k 1 2 d complexity, solving the least squares regression problem z k = a r g m i n G k 1 z a k 2 with O n d 2 , and finally calculating W k = Q k 1 C z k with o d 2 . The combined complexity for each w k is approximately O k 1 2 d + n + 1 d 2 + n e . Similar to RFLD, all preceding k 1 projection vectors must be computed to obtain z k . The total complexity for deriving the m-dimensional subspace is O 1 2 m 2 d + m 1 n d 2 + m 1 n e . Consequently, the main computational complexity of FOLDA is O 1 2 m 2 d + m n d 2 .
NFOLDA: From the related works section, the NFOLDA solution primarily involves four steps. The combined computational complexity of steps 1 and 2 is O ( 4 n 2 d + 4 n 3 + 4 n γ 2 + 4 3 γ 3 ) , where γ = r a n k [ R 2   R 3 ] m i n ( n , d ) . The step 3 has a complexity of O ( 2 n γ 2 + 8 3 γ 3 ) and the computational complexity of step 4 is O ( 2 n d 2 + 2 n d γ ) . Therefore, the overall computational complexity of NFOLDA can be approximated as O ( 4 n 3 + 4 γ 3 + 4 n 2 m + 2 n m 2 + 6 n γ 2 + 2 n m γ ) . It is important to note that the stated complexity omits certain lower-order operations. For a more precise and detailed analysis, please refer to reference [27].
QR-FOLDA: The computational complexity analysis of the QR-FOLDA algorithm involves three key components. First, the computational complexity for calculating both the within-class scatter matrix S w and between-class scatter matrix S b is O n d 2 . Therefore, the total time complexity for computing S b and S w is O 2 n d 2 . Second, solving the generalized eigenvectors of the matrix pair ( S b , S w ) has a complexity of O d 3 . Finally, generating a random invertible matrix Q incurs a time complexity of O m 2 , while both computing VQ and performing QR decomposition on VQ have a complexity of O d m 2 . Thus, the main time complexity of QR-FOLDA is O 2 m 2 d + 2 n d 2 + d 3 .
Based on the above analysis, it can be concluded that QR-FOLDA achieves a computational complexity comparable to that of MMC ( O n 2 d + 2 n + m d 2 ), while overcoming its inherent limitation of reducing the feature dimension to at most c − 1. Compared with RFLD ( O m n 2 d + 1 2 m 2 + 2 m n d 2 + m d 3 ), FOLDA ( O 1 2 m 2 d + m n d 2 ), and NFOLDA ( O ( 4 n 3 + 4 γ 3 + 4 n 2 m + 2 n m 2 + 6 n γ 2 + 2 n m γ ) ), the proposed approach demonstrates significantly lower time complexity, highlighting its improved efficiency in solving OLDA and greater potential for handling large-scale datasets. Another noteworthy observation is that, although QR-FOLDA introduces an additional computational cost of O 2 m 2 d compared with conventional LDA ( O 2 n d 2 + d 3 ), this overhead is generally negligible in high-dimensional regimes where m d . More importantly, the projection matrix derived by QR-FOLDA is orthogonal, which enhances the discriminative power of the extracted features. As a result, the proposed method is more effective in capturing inter-class differences while preserving intra-class compactness than classic LDA.

4. Experimental Results

4.1. Experimental Environment

All experiments are conducted on a desktop computer with Microsoft Windows 10 operating system (64-bit) with a 13th Gen Intel® Core™ i5-13500H (Intel Corporation, Santa Clara, CA, USA) of 2.60 GHz, and a RAM of 32 GB. The experiments are conducted with PyCharm compiler, and the main dependencies include Python 3. 12.3, Pytorch 2.8.0, torchvision 0.23.0 and Scikit-learn 1.7.1.

4.2. Experimental Data

To evaluate the effectiveness of QR-FOLDA, comparative experiments are conducted on nine publicly available datasets of varying sizes across different domains. These datasets (Dry Bean [28], MEU-Mobile KSD [29], USPS [30], MNIST [30], Person Classification Gait Data [31], DARWIN [32], IOSLET [33], Toxicity [34], and Gene expression cancer RNA-Seq [35]) are all freely accessible from UCI Machine Learning Repository (website: https://archive.ics.uci.edu/, accessed on 8 May 2025).
Dry Bean [28]: This dataset contains 13,611 dry bean images from seven different bean varieties. Twelve size-related features and four shape-related features are extracted from each image to facilitate bean classification.
MEU-Mobile KSD [29]: Collected using a Nexus 7 device (Asus, Taipei, Taiwan), this dataset consists of 2856 keystroke sensor records from 56 participants (51 records per participant). A total of 71 metric features is extracted from each record for user identification or touch behavior analysis.
USPS [30]: Provided by the U.S. Postal Service, this dataset contains 9298 grayscale images of handwritten digits (0–9), each sized at 16 × 16 pixels. It is widely used in handwritten digit recognition tasks, especially for zip code identification on envelopes.
MNIST [30]: A classic handwritten digit recognition dataset created by the U.S. National Institute of Standards and Technology, comprising 70,000 images (28 × 28 pixels) across 10 digit classes. For consistency with USPS, the images are downsampled to match its resolution.
Person Classification Gait Data [31]: This dataset includes 48 gait sequences from 16 volunteers (7 females and 9 males, with three sequences per person). A total of 321 features—including basic and transient gait parameters—are extracted from each sequence for person identification.
DARWIN [32]: The dataset consists of handwriting data from 174 individuals. A total of 451 nonlinear features associated with Alzheimer’s disease are extracted to differentiate between patients and healthy controls.
ISOLET [33]: Comprising 7797 valid audio recordings collected from 150 subjects (each pronouncing 26 English letters twice), the dataset provides 617 acoustic features per sample for letter classification.
Toxicity [34]: This dataset contains 1203 molecular descriptors for 171 chemical compounds, including 56 toxic and 115 non-toxic substances. It is used for biochemical toxicity prediction.
Gene expression cancer RNA-Seq [35]: As part of the RNA-Seq PANCAN dataset, this dataset includes gene expression profiles from 801 randomly selected patients across five cancer types: breast cancer, clear cell kidney carcinoma, colon adenocarcinoma, lung adenocarcinoma, and prostate adenocarcinoma.
A summary of the datasets is provided in Table 1.

4.3. Experimental Results and Analysis

To validate the effectiveness of the proposed algorithm, three sets of experiments are respectively conducted to evaluate its performance in terms of classification performance, computational efficiency (time consumption analysis) and sensitivity to parameter variations.

4.3.1. Classification Performance

To evaluate the classification performance of the proposed algorithm, the hold-out method is employed, in which each dataset is randomly shuffled and split into training and testing sets at a ratio of 7:3. Furthermore, several representative algorithms for solving OLDA projection vectors are selected as comparative approaches. These include RFLD, MMC, and FOLDA. In addition, LDA is adopted as a baseline to evaluate the effectiveness of orthogonal projection vectors in enhancing discriminative capability.
Additionally, parameter settings also play a crucial role in the experimental procedure. Similar to the proposed method, all comparative algorithms contain only a single parameter—the reduced dimensionality m. To ensure fair evaluation, the parameter optimization is performed across different search ranges, determined by the original dimensionality of each dataset. The detailed settings are summarized in Table 2. It is worth noting that in Table 2, the triplet (a, b, f) represents the starting dimension a, the step size b, and the ending dimension f in the parameter search process.
It should be noted that to mitigate the influence of randomness on performance evaluation (measured by classification accuracy), each experiment is independently repeated ten times. Moreover, to assess whether the performance differences between the proposed method and baseline algorithms are statistically significant, significance analysis is conducted based on the ten experimental results (with a significance level of α = 0.05 ; results significantly different from the proposed method are underlined). The statistical results are summarized in Table 3.
As shown in Table 3, several key observations can be made regarding the performance of the proposed method. (i) QR-FOLDA achieves the highest classification accuracy on the majority of datasets (5 out of 9), and in most of these cases (32 out of 45), the improvement is statistically significant compared to the competing methods. This highlights the superior classification capability of the proposed approach under various data conditions. (ii) Although the proposed method does not yield the top accuracy on four datasets, it consistently ranks among the top performers—specifically, second on the USPS, ISOLET and MEU-Mobile KSD datasets, and third on the Toxicity dataset. Notably, on USPS and ISOLET, there is no statistically significant difference between the proposed method and the best-performing alternatives (RFLD for USPS and LDA for ISOLET, respectively), indicating that the proposed method achieves competitive performance even in these scenarios. (iii) QR-FOLDA also exhibits the lowest standard deviation in classification accuracy on nearly half of the datasets (4 out of 9), demonstrating its strong robustness and stability across diverse data distributions. Collectively, these findings affirm that the proposed method serves as a highly effective and stable dimensionality reduction technique compared to its competitors. Moreover, an additional interesting finding is that orthogonal LDA-based methods (RFLD, MMC, FOLDA, QR-FOLDA) outperform classical LDA in more than half of the cases (29 out of 45), suggesting that orthogonal transformations are generally more capable of capturing discriminative structures within the data compared to their non-orthogonal counterparts.
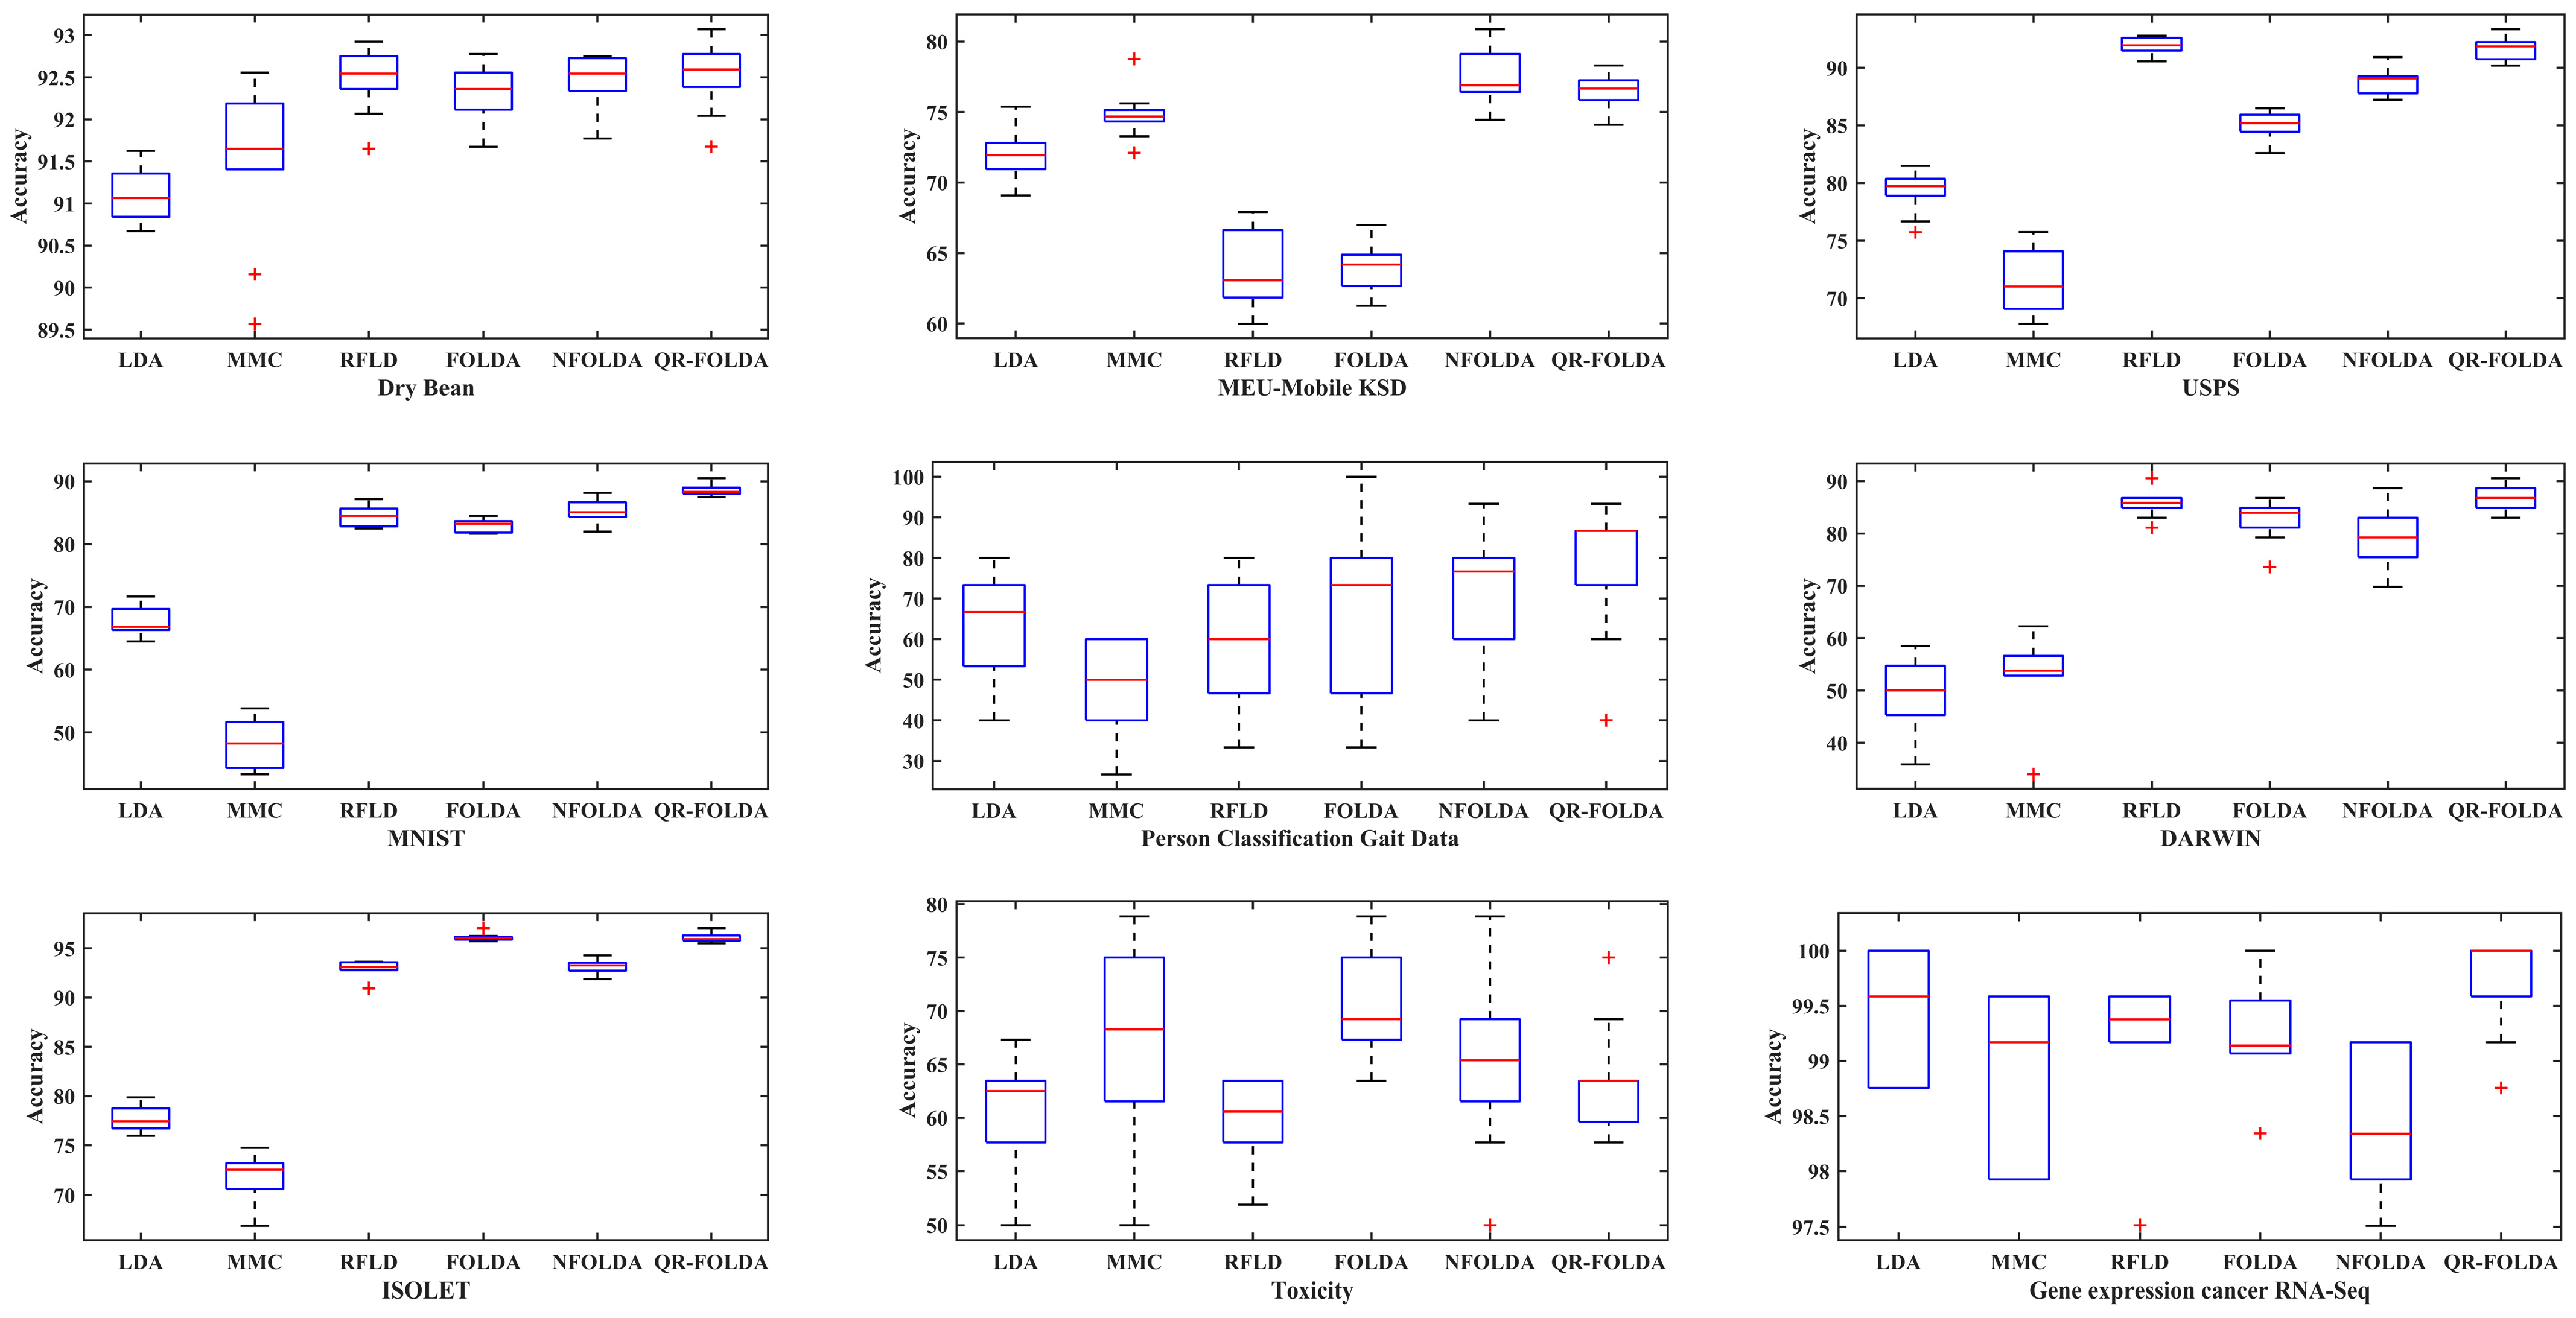
To provide an intuitive illustration of the classification stability of the proposed method, boxplots depicting the classification accuracies of different algorithms across various datasets are presented in Figure 1. As shown, the proposed method yields relatively compact accuracy distributions across multiple runs on each dataset, suggesting its strong robustness and consistency in classification performance.

4.3.2. Time Consumption Analysis

To assess the computational efficiency of the proposed algorithm, this section presents a comparative analysis of the time consumption across different methods. It is worth noting that both classical LDA and MMC are constrained to reduce the data dimensionality to at most c − 1, where c denotes the number of classes. Consequently, experiments are conducted on datasets with a relatively large number of classes—specifically, ISOLET and MEU-Mobile KSD. To ensure a fair comparison, the target dimensionality for all methods is uniformly set to c − 1, resulting in reduced dimensions of 25 for ISOLET and 55 for MEU-Mobile KSD. In addition, all reported runtime measurements include only the computation of the orthogonal projection (mapping) matrix. Operations unrelated to the algorithm itself, such as data preprocessing and classifier training, are excluded. The corresponding time consumption results for each algorithm are summarized in Table 4.
As shown in Table 4, the time consumption of the algorithms follows the trend: LDA < MMC ≈ QR-FOLDA < NFOLDA < FOLDA < RFLD. Notably, QR-FOLDA requires substantially less computational time than RFLD, FOLDA and NFOLDA, while incurring only a slight increase in runtime compared to LDA and MMC. The additional computational cost compared to LDA primarily stems from the subsequent QR decomposition step. Compared with MMC, which involves only a single eigenvalue decomposition, the proposed method performs two matrix factorization steps, leading to slightly increased time consumption. Nevertheless, QR-FOLDA successfully addresses the dimensionality constraint inherent in MMC, thereby enabling significantly enhanced classification performance in many cases.

4.3.3. Parameter Analysis

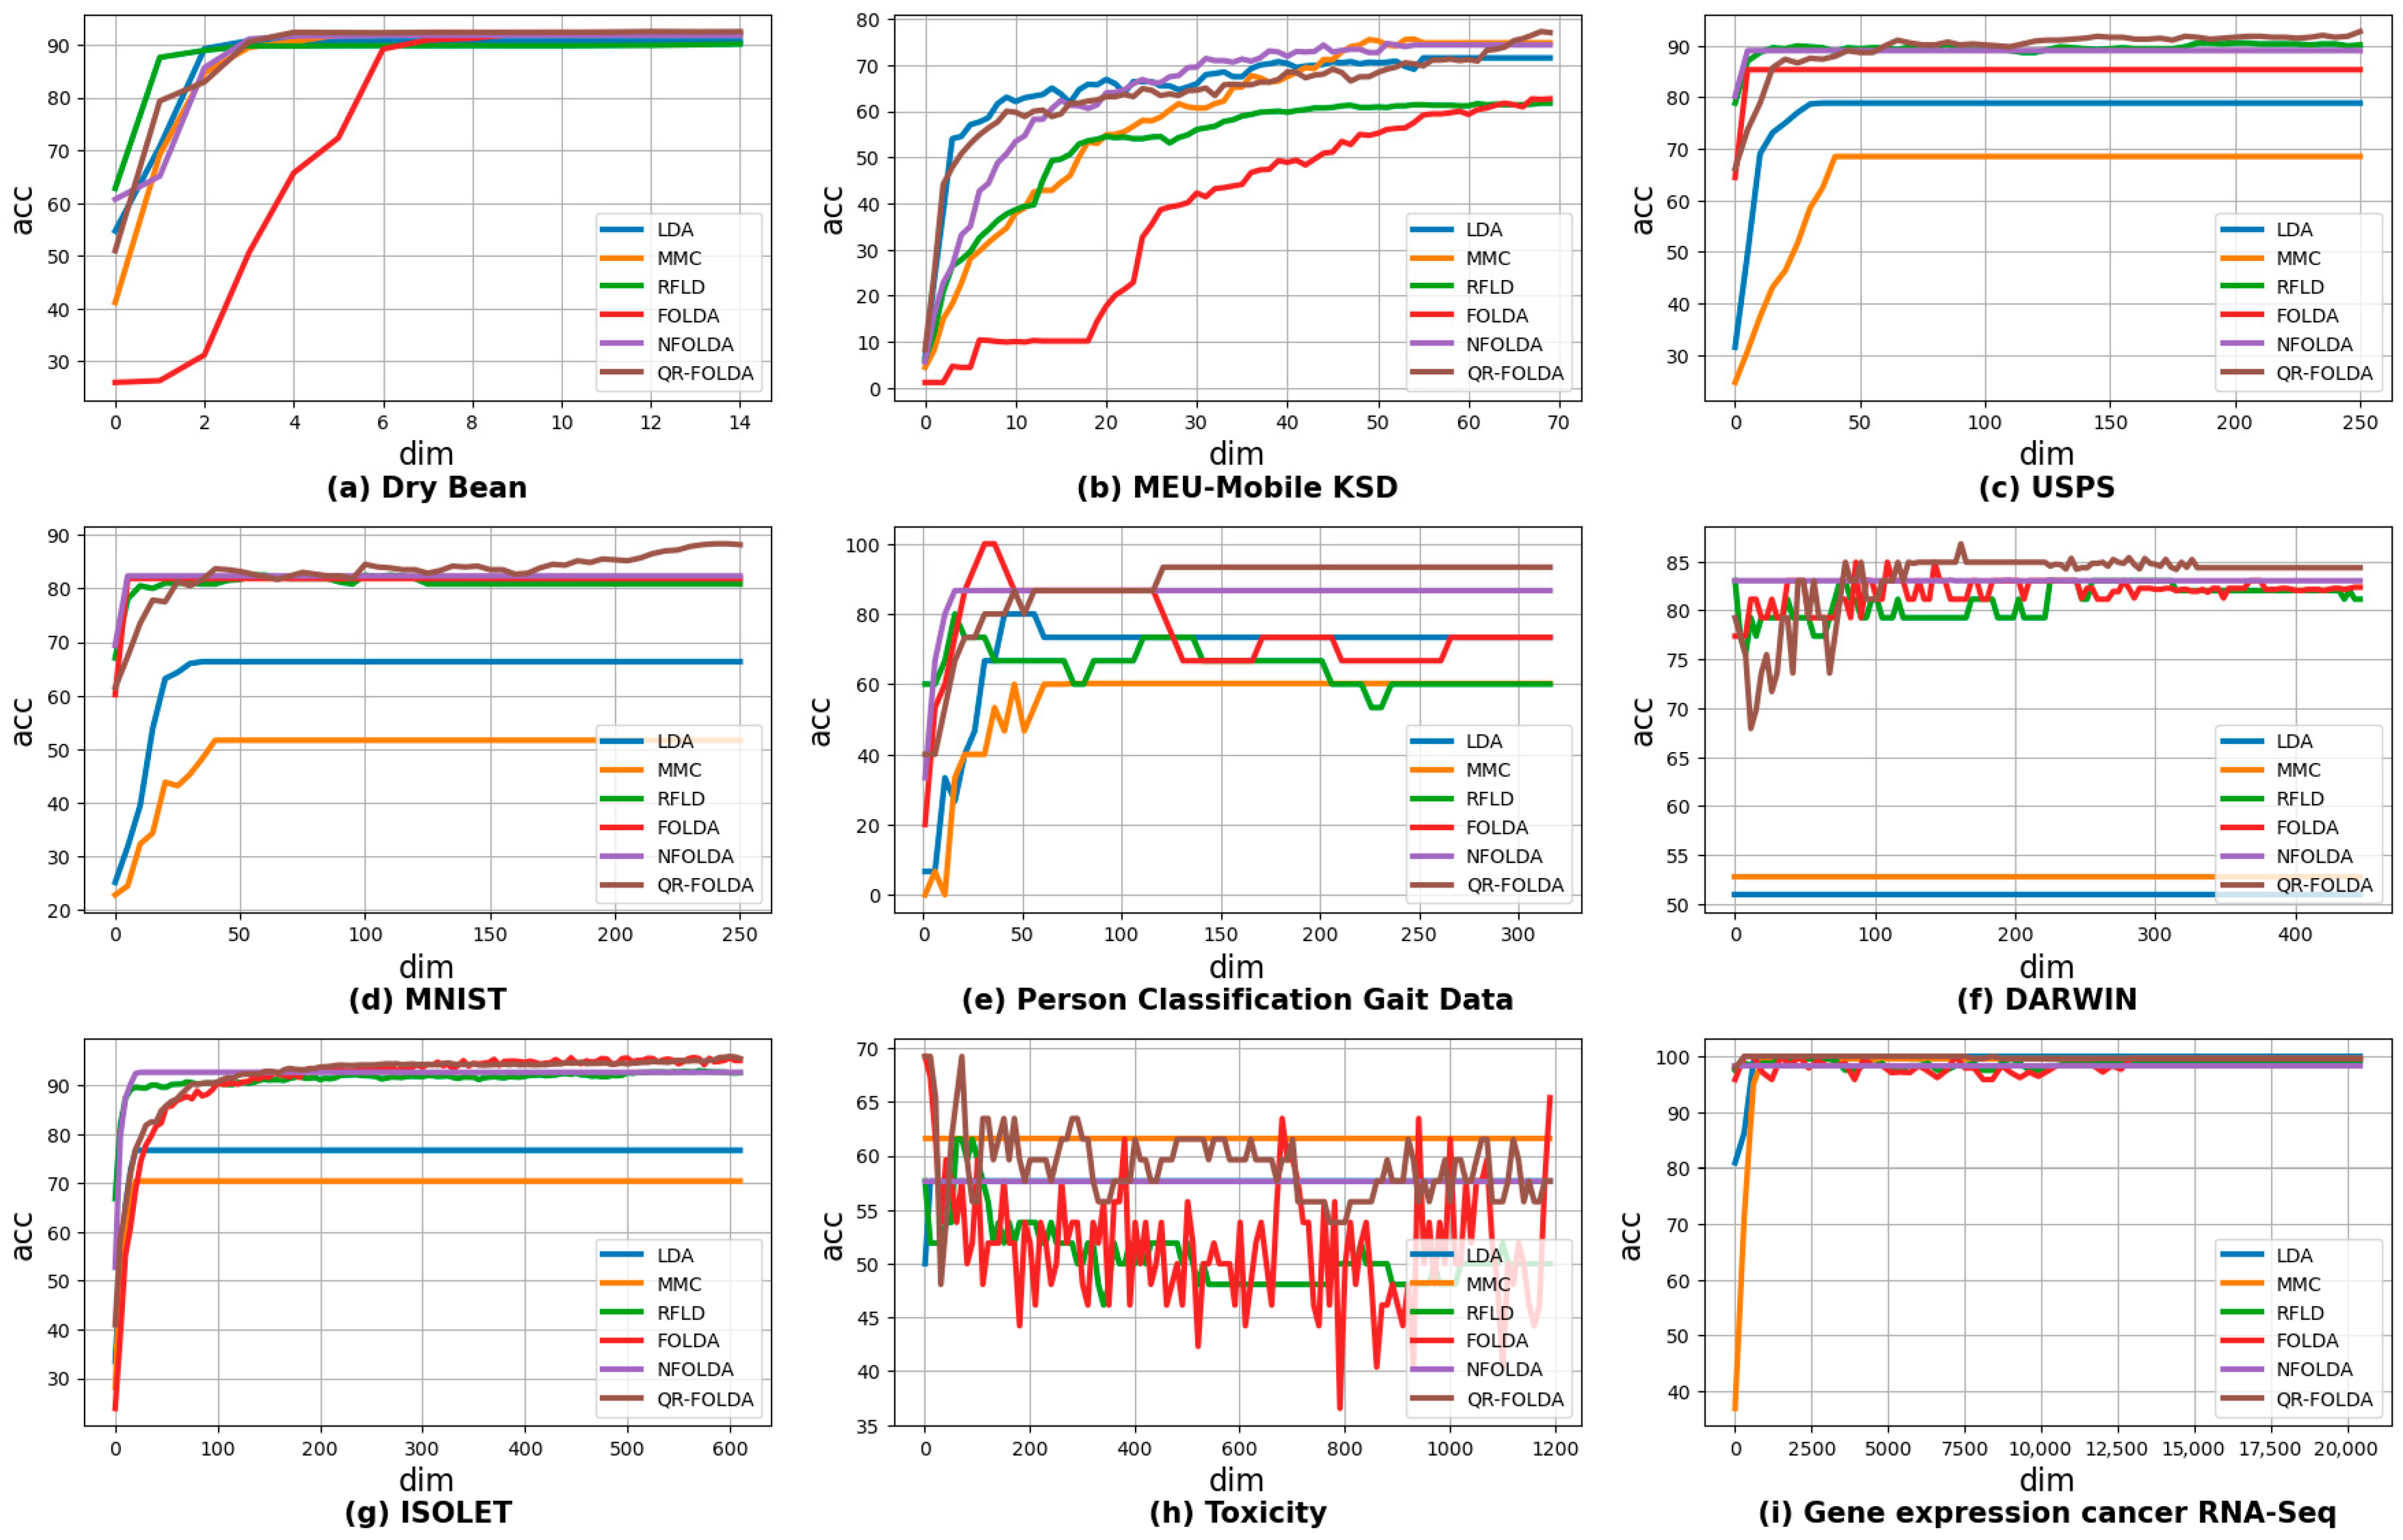
Beyond efficiency and accuracy, the parameter sensitivity of the algorithm remains a noteworthy issue that warrants further discussion. Therefore, we investigate the impact of the dimensionality parameter (dim) on the classification accuracy (acc) of each algorithm. The results are depicted in Figure 2. It is worth noting that, since LDA and MMC are inherently constrained to a maximum of c − 1 dimensions (where c denotes the number of classes), their performance beyond this limit is represented by their accuracy at c − 1. Furthermore, the dimensionality step size is set to 1 to enable a more fine-grained analysis of convergence behavior of each algorithm.
As shown in Figure 2a,c,e–g,i, the proposed method, similar to other compared algorithms, exhibits a pattern wherein classification accuracy initially increases and then reaches a plateau. Notably, this convergence trend typically occurs when the reduced dimensionality reaches approximately 20% of the original data dimension, suggesting that the proposed method achieves rapid convergence on these datasets. In contrast, Figure 2b,d illustrate that the proposed method continues to exhibit performance gains as dimensionality increases, whereas the baseline methods have already converged or stabilized at earlier stages. This observation indicates that the proposed algorithm is more effective at capturing highly discriminative features, particularly in higher-dimensional spaces, compared to its counterparts.
Another noteworthy observation from Figure 2 is that the proposed QR-FOLDA method consistently achieves optimal classification performance at relatively higher dimensionalities. To further evaluate the practical efficiency of each algorithm, Table 5 summarizes the time consumption of all methods at their respective optimal dimensions, i.e., when each yields peak classification accuracy.
It can be seen from Table 5 that, although the proposed method requires the highest optimal dimensionality among the compared algorithms, its computational cost still follows the pattern: LDA < MMC ≈ QR-FOLDA < NFOLDA < FOLDA < RFLD, owing to its efficient computational framework. This result suggests that the increased dimensionality has a limited impact on the overall runtime of the proposed algorithm.

5. Conclusions and Further Study

This study introduces a novel orthogonal linear discriminant analysis algorithm, termed QR-FOLDA, to overcome the computational inefficiencies inherent in existing OLDA methods. The approach is grounded in a theoretically established property of classical LDA that any optimal LDA solution remains valid under full-rank linear transformations. By leveraging this property, QR-FOLDA applies QR decomposition to transform the optimal LDA projection into an orthogonal solution without iterative optimization. Extensive experiments on nine publicly available datasets across diverse domains and data scales show that QR-FOLDA consistently delivers substantial reductions in computational cost while achieving classification accuracy on par with, or superior to, existing OLDA algorithms. These results show QR-FOLDA as not only a theoretically grounded contribution but also a practically robust and scalable solution for dimensionality reduction.
Despite these promising results, classification performance on high-dimensional dense data remains an area for improvement. In particular, on the ISOLET dataset (617 features), the method’s advantage over FOLDA is marginal (95.62% vs. 95.32%), while on the Toxicity dataset (1203 features) it falls significantly short of the best result (63.65% vs. 70.57%). This limitation is largely attributed to an inherent drawback of QR decomposition, where numerical precision issues can lead to rapid error accumulation in high-dimensional, non-sparse matrices. Future research could address this numerical stability issue to improve accuracy on such challenging datasets. Meanwhile, the proposed method can further incorporate fast matrix multiplication techniques to improve computational efficiency. For example, replacing the standard QR decomposition with an economic QR factorization [27,36,37] could further reduce the computational cost.

Author Contributions

Y.L.: contributed to conceptualization, methodology, validation, formal analysis, drafted manuscript, review and editing, funding acquisition; Q.Y., Y.D. and Y.R. contributed to data curation, methodology, conceptualization, software, analysis, investigation, resource, visualization, drafted and critically revised manuscript; B.W.: contributed to analysis, validation, visualization, critically revised manuscript; M.Z.: contributed to conceptualization, funding acquisition, analysis, methodology, supervision and critically revised manuscript. All authors have read and agreed to the published version of the manuscript.

Funding

This work was supported in part by the General Program of National Natural Science Foundation of Chongqing under Grant cstb2023nscq-msx0968 and cstb2022nscq-msx1575, in part by Chongqing University of Science and Technology Research Funding Projects under Grant No. CKRC2022020 and CKRC2022019.

Data Availability Statement

These datasets are all available at UCI Machine Learning Repository (https://archive.ics.uci.edu/, accessed on 8 May 2025).

Acknowledgments

The authors thank the editor and the anonymous reviewers for their constructive comments and suggestions, which have significantly improved the quality of this manuscript. We also acknowledge the individuals and institutions that provided data support for this study. The authors further thank Huihua Cao, a native English speaker, for her assistance with language editing.

Conflicts of Interest

The authors declare no conflicts of interest.

Abbreviations

The following abbreviations and symbols are used in this manuscript:
OLDAOrthogonal Linear Discriminant Analysis
LDALinear Discriminant Analysis
QR-FOLDAQR Decomposition-based Fast OLDA
RFLDRegularized Fisher’s Linear Discriminant
FOLDAFast OLDA
NFOLDANew and Fast OLDA
MMCMaximum Margin Criterion
Symbols
W projection matrix
S b interclass scatter matrix
Mblock-diagonal matrix
Iidentity matrix
cnumber of classes
μ l l-th class center
ntotal number of samples
dnumber of dimensions
Xdata matrix
S w intraclass scatter matrix
U, R, Vprocess matrix
Qinvertible m × m matrix
n l number of l-th class samples
μ center of samples
mnumber of dimensions after reduction
δregularization parameter

References

  1. Tian, Z.; Li, J.; Liu, L.; Wu, H.; Hu, X.; Xie, M.; Zhu, Y.; Chen, X.; Ou-Yang, W. Machine learning-assisted self-powered intelligent sensing systems based on triboelectricity. Nano Energy 2023, 113, 108559. [Google Scholar] [CrossRef] [Scilit]
  2. Saikh, T.; Rasool, T.; Verma, P. Machine intelligence and medical cyber-physical system architectures for smart healthcare: Taxonomy, challenges, opportunities, and possible solutions. Artif. Intell. Med. 2023, 146, 102692. [Google Scholar] [CrossRef] [Scilit] [PubMed]
  3. Divya, S.; Panda, S.; Hajra, S.; Jeyaraj, R.; Paul, A.; Park, S.H.; Kim, H.J.; Oh, T.H. Smart data processing for energy harvesting systems using artificial intelligence. Nano Energy 2023, 106, 108084. [Google Scholar] [CrossRef] [Scilit]
  4. Salerno, S.; Li, Y. High-dimensional survival analysis: Methods and applications. Annu. Rev. Stat. Its Appl. 2023, 10, 25–49. [Google Scholar] [CrossRef] [Scilit]
  5. Fei, L.; Li, T.; Ding, W. Dempster–Shafer theory-based information fusion for natural disaster emergency management: A systematic literature review. Inf. Fusion 2024, 112, 102585. [Google Scholar] [CrossRef] [Scilit]
  6. Zhu, Y.; Li, W.; Li, T. A hybrid artificial immune optimization for high-dimensional feature selection. Knowl.-Based Syst. 2023, 260, 110111. [Google Scholar] [CrossRef] [Scilit]
  7. Li, H.; Cui, J.; Zhang, X.; Han, Y.; Cao, L. Dimensionality reduction and classification of hyperspectral remote sensing image feature extraction. Remote Sens. 2022, 14, 4579. [Google Scholar] [CrossRef] [Scilit]
  8. Soleimani-Babakamali, M.H.; Soleimani-Babakamali, R.; Sarlo, R.; Farghally, M.F.; Lourentzou, I. On the effectiveness of dimensionality reduction for unsupervised structural health monitoring anomaly detection. Mech. Syst. Signal Process. 2023, 187, 109910. [Google Scholar] [CrossRef] [Scilit]
  9. Buchaiah, S.; Shakya, P. Bearing fault diagnosis and prognosis using data fusion based feature extraction and feature selection. Measurement 2022, 188, 110506. [Google Scholar] [CrossRef] [Scilit]
  10. Moslemi, A.; Jamshidi, M. Unsupervised feature selection using sparse manifold learning: Auto-encoder approach. Inf. Process. Manag. 2025, 62, 103923. [Google Scholar] [CrossRef] [Scilit]
  11. Assadi, H.N.; Kyanfar, F.; Saberi-Movahed, F.; Salemi, A. Bilinear Self-Representation for Unsupervised Feature Selection with Structure Learning. Neurocomputing 2025, 625, 129557. [Google Scholar] [CrossRef] [Scilit]
  12. Moslemi, A.; Shaygani, A. Subspace learning via Hessian regularized latent representation learning with l2,0-norm constraint: Unsupervised feature selection. Int. J. Mach. Learn. Cybern. 2024, 15, 5361–5380. [Google Scholar] [CrossRef] [Scilit]
  13. Liu, Y.; Li, Y.; Tan, X.; Zhang, Y. Local discriminant preservation projection embedded ensemble learning based dimensionality reduction of speech data of Parkinson’s disease. Biomed. Signal Process. Control 2021, 63, 102165. [Google Scholar] [CrossRef] [Scilit]
  14. Han, X.; Chen, B.; Cao, W.; Chen, H.; Li, H. Modular exponentiation masked template attack method based on linear discriminant analysis. Acta Electron. Sin. 2023, 51, 3024–3032. [Google Scholar]
  15. Yu, D.; Xiang, B. Discovering topics and trends in the field of artificial intelligence: Using LDA topic modeling. Expert Syst. Appl. 2023, 225, 120114. [Google Scholar] [CrossRef] [Scilit]
  16. Mei, H.; Peng, J.; Wang, T.; Zhou, T.; Zhao, H.; Zhang, T.; Yang, Z. Overcoming the limits of cross-sensitivity: Pattern recognition methods for chemiresistive gas sensor array. Nano-Micro Lett. 2024, 16, 269. [Google Scholar] [CrossRef] [Scilit]
  17. Yu, D.; Fang, A.; Xu, Z. Topic research in fuzzy domain: Based on LDA topic modelling. Inf. Sci. 2023, 648, 119600. [Google Scholar] [CrossRef] [Scilit]
  18. Liu, J.; Xu, H.; Peng, X.; Wang, J.; He, C. Reliable composite fault diagnosis of hydraulic systems based on linear discriminant analysis and multi-output hybrid kernel extreme learning machine. Reliab. Eng. Syst. Saf. 2023, 234, 109178. [Google Scholar] [CrossRef] [Scilit]
  19. Li, S.; Zhang, H.; Ma, R.; Zhou, J.; Wen, J.; Zhang, B. Linear discriminant analysis with generalized kernel constraint for robust image classification. Pattern Recognit. 2023, 136, 109196. [Google Scholar] [CrossRef] [Scilit]
  20. Xue, K.; Yang, J.; Yao, F. Optimal linear discriminant analysis for high-dimensional functional data. J. Am. Stat. Assoc. 2024, 119, 1055–1064. [Google Scholar] [CrossRef] [Scilit]
  21. Wang, K.; Cao, Z.; Wang, D.; Sun, Q.; Yuan, X.; Wang, Y.; Liu, C. Mani-fold-constrained trace ratio optimization for non-stationary process performance monitoring. J. Process Control. 2023, 129, 103058. [Google Scholar] [CrossRef] [Scilit]
  22. Ke, H.; Chen, D.; Yao, Q.; Tang, Y.; Wu, J.; Monaghan, J.; Sowman, P.; McAlpine, D. Deep factor learning for accurate brain neuroimaging data analysis on discrimination for structural MRI and functional MRI. IEEE/ACM Trans. Comput. Biol. Bioinform. 2023, 21, 582–595. [Google Scholar] [CrossRef] [Scilit]
  23. Nanni, L.; Lumini, A. Orthogonal linear discriminant analysis and feature selection for micro-array data classification. Expert Syst. Appl. 2010, 37, 7132–7137. [Google Scholar] [CrossRef] [Scilit]
  24. Xiang, C.; Fan, X.A.; Lee, T.H. Face recognition using recursive fisher linear discriminant. IEEE Trans. Image Process. 2006, 15, 2097–2105. [Google Scholar] [CrossRef] [Scilit] [PubMed]
  25. Ye, Q.; Ye, N.; Yin, T. Fast orthogonal linear discriminant analysis with application to image classification. Neurocomputing 2015, 158, 216–224. [Google Scholar] [CrossRef] [Scilit]
  26. Li, H.; Jiang, T.; Zhang, K. Efficient and robust feature extraction by maximum margin criterion. IEEE Trans. Neural Netw. Learn. Syst. 2006, 17, 157–165. [Google Scholar] [CrossRef] [Scilit]
  27. Chu, D.; Goh, S.T. A New and Fast Orthogonal Linear Discriminant Analysis on Undersampled Problems. SIAM J. Sci. Comput. 2010, 32, 2274–2297. [Google Scholar] [CrossRef] [Scilit]
  28. Koklu, M.; Özkan, I.A. Multiclass classification of dry beans using computer vision and machine learning techniques. Comput. Electron. Agric. 2020, 174, 105507. [Google Scholar] [CrossRef] [Scilit]
  29. UCI Machine Learning Repository. MEU-Mobile KSD. Available online: https://archive.ics.uci.edu/dataset/399/meu+mobile+ksd (accessed on 13 May 2016).
  30. Pulakurthi, P.R.; Dianat, S.A.; Rabbani, M.; You, S.; Rao, R.M. Unsupervised domain adaptation using feature aligned maximum classifier discrepancy. In Proceedings of the Applications of Machine Learning 2022, San Diego, CA, USA, 21–26 August 2022. [Google Scholar]
  31. UCI Machine Learning Repository. Person Classification Gait Data. Available online: https://archive.ics.uci.edu/dataset/561/person+classification+gait+data (accessed on 1 March 2020).
  32. Cilia, N.D.; Gregorio, G.D.; Stefano, C.D.; Fontanella, F.; Marcelli, A.; Parziale, A. Diagnosing Alzheimer’s disease from on-line handwriting: A novel dataset and performance benchmarking. Eng. Appl. Artif. Intell. 2022, 111, 104822. [Google Scholar] [CrossRef] [Scilit]
  33. Fanty, M.A.; Cole, R.A. Spoken Letter Recognition. In Proceedings of the Workshop on Speech and Natural Language, Hidden Valley, PA, USA, 24–27 June 1990. [Google Scholar]
  34. Gul, S.; Rahim, F.; Isin, S.; Yilmaz, F.; Ozturk, N.; Turkay, M.; Kavakli, I.H. Structure-based design and classifications of small molecules regulating the circadian rhythm period. Sci. Rep. 2021, 11, 18510. [Google Scholar] [CrossRef] [Scilit] [PubMed]
  35. UCI Machine Learning Repository. Gene Expression Cancer RNA-Seq. Available online: https://archive.ics.uci.edu/dataset/401/gene+expression+cancer+rna+seq (accessed on 8 June 2016).
  36. Naseri, N.; Eftekhari, M.; Saberi-Movahed, F.; Radjabalipour, M.; Belanche, L.A. A similarity measure based on subspace distance for spectral clustering. Neurocomputing 2025, 620, 129187. [Google Scholar] [CrossRef] [Scilit]
  37. Respondek, J.S. Fast Matrix Multiplication with Applications; Studies in Big Data; Springer Nature: Cham, Switzerland, 2025; Volume 166. [Google Scholar]
Figure 1. Boxplots of classification accuracies for different algorithms.
Mathematics 14 00933 g001
Figure 2. The performance trend of the algorithm as a function of dimensionality.
Mathematics 14 00933 g002
Table 1. Basic information of the dataset used in this study.
DatasetSample SizeNumber of FeaturesClassesApplication DomainType of Data
Dry Bean13,611167Image RecognitionLegume Images
MEU-Mobile KSD28567156Identity RecognitionPressure Sensor Data
USPS929825610Handwriting RecognitionHandwriting Recognition
MNIST70,00025610Handwriting RecognitionHandwriting Recognition
Person Classification Gait Data4832116Behavior Analysis/Identity RecognitionGait Images
DARWIN1744512Medicine and HealthcareMedicine and Healthcare
ISOLET779761726Speech RecognitionAudio Recordings
Toxicity17112032Toxic Substance IdentificationText
Gene expression cancer RNA-Seq80120,5315Tumor Gene ExpressionTumor Gene Expression
Table 2. Parameter settings of each algorithm on different datasets.
DatasetLDAMMCRFLDFOLDANFOLDAQR-FOLDA
Dry Bean(1, 1, 6)(1, 1, 6)(1, 1, 15)(1, 1, 15)(1, 1, 15)(1, 1, 15)
MEU-Mobile KSD(1, 1, 55)(1, 1, 55)(1, 1, 70)(1, 1, 70)(1, 1, 70)(1, 1, 70)
USPS(1, 1, 9)(1, 1, 9)(5, 5, 255)(5, 5, 255)(5, 5, 255)(5, 5, 255)
MNIST(1, 1, 9)(1, 1, 9)(5, 5, 255)(5, 5, 255)(5, 5, 255)(5, 5, 255)
Person Classification Gait Data(1, 1, 15)(1, 1, 15)(5, 5, 320)(5, 5, 320)(5, 5, 320)(5, 5, 320)
DARWIN(1, 1, 1)(1, 1, 1)(5, 5, 450)(5, 5, 450)(5, 5, 450)(5, 5, 450)
ISOLET(5, 5, 25)(5, 5, 25)(5, 5, 616)(5, 5, 616)(5, 5, 616)(5, 5, 616)
Toxicity(1, 1, 1)(1, 1, 1)(5, 10, 1195)(5, 10, 1195)(5, 10, 1195)(5, 10, 1195)
Gene expression cancer RNA-Seq(1, 1, 4)(1, 1, 4)(5, 300, 20,405)(5, 300, 20,405)(5, 300, 20,405)(5, 300, 20,405)
Table 3. Statistical results of classification performance across different algorithms (Mean ± Standard Deviation).
DatasetLDAMMCRFLDFOLDANFOLDAQR-FOLDA
Dry Bean91.11 ± 0.3191.52 ± 0.9892.48 ± 0.3892.26 ± 0.3392.46 ± 0.3292.50 ± 0.41
MEU-Mobile KSD72.13 ± 1.7774.80 ± 1.7163.79 ± 2.6062.91 ± 2.6477.25 ± 2.0076.26 ± 1.31
USPS79.25 ± 1.8271.50 ± 2.8191.89 ± 0.7084.91 ± 1.2688.78 ± 1.0991.67 ± 1.01
MNIST67.73 ± 2.5048.20 ± 3.9584.72 ± 1.7183.10 ± 1.0585.07 ± 1.9188.65 ± 1.01
Person Classification Gait Data64.00 ± 13.7747.33 ± 13.5059.33 ± 16.1669.33 ± 22.0470.67 ± 16.6978.67 ± 16.87
DARWIN49.25 ± 7.2053.58 ± 7.6686.04 ± 2.9882.64 ± 4.0579.06 ± 6.1386.98 ± 2.25
ISOLET96.01 ± 0.5693.35 ± 0.5393.62 ± 0.6495.32 ± 0.5093.12 ± 0.7195.62 ± 0.58
Toxicity61.35 ± 5.1667.69 ± 8.9659.62 ± 3.8570.57 ± 5.3764.81 ± 7.9163.65 ± 5.08
Gene expression cancer RNA-Seq99.58 ± 0.5199.17 ± 0.7299.06 ± 0.6699.17 ± 0.7498.38 ± 0.6199.83 ± 0.37
Note: Values in bold indicate the best. Values underlined indicate a significant difference between the method and the proposed algorithm.
Table 4. Time consumption statistics of different algorithms (in seconds).
DatasetsLDAMMCRFLDFOLDANFOLDAQR-FOLDA
ISOLET0.2060.32619.11110.4783.5910.345
MEU-Mobile KSD0.0060.0070.7840.5340.1120.008
Table 5. Computational Time of Algorithms at Optimal Dimensionality (Dimension, Time: seconds).
DatasetLDAMMCRFLDFOLDANFOLDAQR-FOLDA
Dry Bean5, 0.0046, 0.00514, 0.09915, 0.0526, 0.01115, 0.006
MEU-Mobile KSD48, 0.00654, 0.00763, 0.17269, 0.68252, 0.01370, 0.009
USPS9, 0.0239, 0.029151, 2.377143, 0.60410, 0.134229, 0.062
MNIST8, 0.0279, 0.033155, 2.912191, 0.64710, 0.129252, 0.055
Person Classification Gait Data13, 0.02612, 0.02317, 1.67932, 0.11515, 0.109207, 0.049
DARWIN1, 0.0371, 0.04947, 2.01480, 0.6715, 0.161251, 0.084
ISOLET13, 0.2042, 0.16514, 5.0177, 8.5515, 2.27716, 0.219
Toxicity1, 0.0081, 0.010136, 2.228297, 0.99235, 0.348168, 0.012
gene expression cancer RNA-Seq4, 8.8894, 8.943793, 178.177775, 19.989305, 12.76806, 9.578
Disclaimer/Publisher’s Note: The statements, opinions and data contained in all publications are solely those of the individual author(s) and contributor(s) and not of MDPI and/or the editor(s). MDPI and/or the editor(s) disclaim responsibility for any injury to people or property resulting from any ideas, methods, instructions or products referred to in the content.