Article

Win-Win or Laissez-Faire? Benchmarking Sovereign ESG Efficiency in OECD Countries Using Two-Stage DEA

1
Department of Electronic Engineering, Southern Taiwan University of Science and Technology, Tainan 71005, Taiwan
2
Department of Finance, National Yunlin University of Science and Technology, Douliu 64002, Taiwan
3
Department of Finance, Ling Tung University of Science and Technology, Taichung 408020, Taiwan
4
Department of Information Management, National Yunlin University of Science and Technology, Douliu 64002, Taiwan
5
Department of Electrical and Computer Engineering, Iowa State University, 2520 Osborn Drive, Ames, IA 50011, USA
*
Author to whom correspondence should be addressed.
Mathematics 2026, 14(6), 1042; https://doi.org/10.3390/math14061042
Submission received: 13 February 2026 / Revised: 15 March 2026 / Accepted: 17 March 2026 / Published: 19 March 2026

Abstract

While Environmental, Social, and Governance (ESG) criteria are extensively utilized for corporate evaluation, empirical evidence regarding sovereign ESG efficiency remains scarce. Existing national sustainability indices often fail to account for how effectively a nation translates its economic resources into ESG outcomes. This study proposes a two-stage Data Envelopment Analysis (DEA) framework to evaluate the efficiency of 38 OECD countries in 2020. The national production process is decomposed into two sequential phases: (1) Economic Efficiency, transforming resource inputs (labor and energy) into intermediate economic outputs (GDP and trade openness), and (2) ESG Transformation Efficiency, converting those intermediate outputs into a composite ESG score. A novel quartile-based classification scheme is further applied to categorize countries into strategic groups for benchmarking. Empirical results reveal significant heterogeneity across the OECD. Estonia, Iceland, and Latvia emerge as “Win–Win” benchmarks, demonstrating high efficiency in both economic production and ESG transformation. Conversely, the United States is classified as a “Laissez-faire” member, exhibiting low performance in both stages relative to its capacity. Additionally, second-stage regression analysis indicates that while higher income is negatively associated with ESG transformation efficiency, government effectiveness acts as a significant positive driver. This research contributes a transparent, reproducible framework for sovereign ESG analytics that relates outcomes directly to economic capacity. It provides policymakers with an interpretable benchmarking tool to identify national sustainability gaps and facilitates actionable insights for enhancing public-sector effectiveness in achieving ESG goals.
MSC:
90B50; 90C90; 91B76

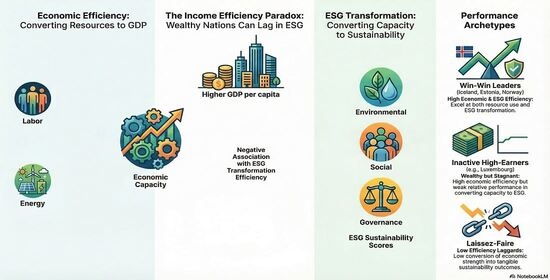
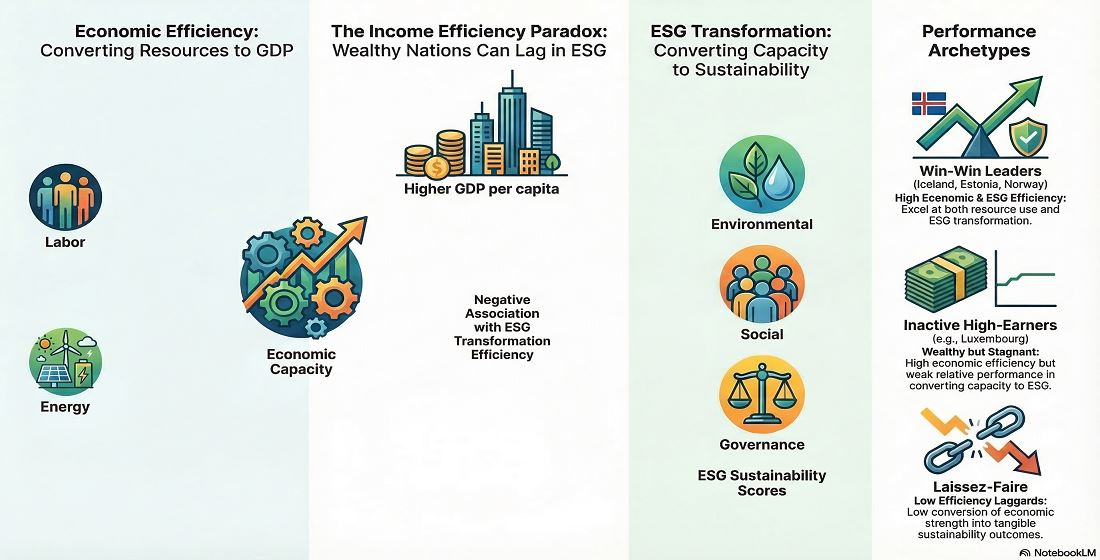
Graphical Abstract

1. Introduction

With the intensification of climate change, ecological degradation, and greenhouse gas emissions, the concept of sustainable development has gradually gained acceptance among investors and policymakers. During the 1960s and 1970s, a series of environmental and social crises in the United States and Europe led to the emergence of Corporate Social Responsibility (CSR). Over time, CSR evolved into the broader framework of Environmental, Social, and Governance (ESG), which emphasizes not only financial performance but also non-financial impacts. This transition has shifted corporate objectives from pure profit maximization toward broader social value creation.
As green investment becomes increasingly favored in capital markets, evaluating ESG performance and incorporating ESG information into investment decisions have become critical concerns for governments, firms, and financial institutions. ESG measurement involves multiple dimensions and indicators; therefore, constructing a scientific and comprehensive ESG evaluation system is essential.
At the international level, global climate initiatives have further reinforced the importance of ESG. At the 26th United Nations Climate Change Conference (COP26), more than 40 countries signed the Glasgow Breakthroughs initiative, committing governments, businesses, and cities to collaborative actions in energy, transportation, agriculture, and steel industries to combat climate change. The Glasgow Financial Alliance for Net Zero (GFANZ) introduced sustainable finance principles aimed at facilitating global decarbonization. Subsequent conferences, including COP27 and COP28, established climate loss-and-damage funds to assist developing countries affected by climate disasters, highlighting the increasing integration of sustainability and economic policy.
ESG indicators provide a systematic framework for assessing sustainability and ethical impacts, covering issues such as carbon footprints, resource management, labor practices, and corporate governance. While ESG standards were initially designed to evaluate corporate behavior, their application has gradually expanded to national and regional levels. Sovereign ESG assessment encompasses broader aspects, including public policies, regulations, infrastructure, and socio-cultural conditions.
In recent years, Environmental, Social, and Governance (ESG) performance has become a central framework for evaluating sustainability outcomes beyond purely economic growth. ESG metrics are increasingly used by investors and policymakers to assess environmental risk exposure, social resilience, and the institutional capacity required for credible long-term transitions [1,2]. At the country level, ESG outcomes can be interpreted as a composite signal of (i) environmental quality and climate governance, (ii) social development and human capital, and (iii) governance quality and regulatory effectiveness—factors that jointly influence sustainable competitiveness and the credibility of transition pathways [3,4].
However, cross-country comparisons based only on ESG levels may be misleading because countries face heterogeneous resource endowments and structural constraints. Efficiency analysis provides a complementary perspective by evaluating how effectively a country transforms inputs (e.g., population, labor, and energy use) into desirable outcomes, relative to a best-practice frontier [5]. In this sense, efficiency scores offer an interpretable benchmark: they highlight peer comparisons, identify underperforming dimensions, and support policy learning without requiring a single parametric production function [6].
Moreover, sustainability outcomes often emerge through linked stages rather than a single black-box process. Economic capacity is commonly viewed as an intermediate enabling condition: economic efficiency and openness can expand fiscal and technological capacity, which may in turn support governance reforms and sustainability investments reflected in ESG outcomes [7,8,9]. A network (two-stage) efficiency framework is therefore conceptually aligned with the transition process, because it distinguishes the upstream stage of economic performance from the downstream stage of transforming intermediate conditions into sustainability outcomes [10,11].
Despite the growing importance of ESG, measuring how effectively nations utilize their economic resources to improve ESG outcomes remains a complex challenge. Efficiency, in this context, refers to a country’s ability to maximize ESG achievements given its available resources. Understanding ESG efficiency is crucial for promoting sustainable development, enhancing competitiveness, attracting investment, and improving long-term economic resilience.
The Organization for Economic Co-operation and Development (OECD), composed of 38 member countries, aims to promote economic growth, employment, and sustainability. Although OECD countries generally demonstrate advanced economic development, their ESG performance varies considerably. Some members appear less proactive in enhancing sustainability outcomes. Investigating these differences provides insights into barriers, challenges, and potential policy solutions.
Previous studies have shown that ESG practices can enhance firm value and reduce operational risks. However, research at the macroeconomic or sovereign level remains scarce. While several institutions have developed national sustainability indices, no universally accepted framework exists for sovereign ESG evaluation. Consequently, empirical studies on sovereign ESG efficiency are still in their early stages.
To address this gap, this study employs a two-stage Data Envelopment Analysis (DEA) approach. DEA is a non-parametric method that constructs an efficient frontier using observed data without assuming a specific production function. Efficiency scores range from 0 to 1, where a score of 1 indicates optimal efficiency. The two-stage DEA model allows us to evaluate both economic efficiency and ESG efficiency sequentially, providing a comprehensive assessment of how countries transform economic capacity into sustainable outcomes.
This paper addresses the following research questions:
RQ1. 
How efficiently do OECD countries convert resource inputs into economic outputs, and economic outputs into ESG outcomes, in a two-stage production process?
RQ2. 
Which distinct country profiles emerge when combining Stage 1 and Stage 2 efficiencies (e.g., win–win, inactive, laissez-faire), and what do these profiles imply for policy learning?
Accordingly, this paper makes two main contributions. First, it provides a two-stage sovereign ESG efficiency assessment that separates economic efficiency from ESG transformation efficiency. Second, it proposes an interpretable, quartile-based country classification that translates DEA results into actionable benchmarking insights for policymakers and stakeholders. Beyond applying an existing two-stage DEA template, we (i) operationalize a fully transparent sovereign ESG output using only publicly accessible World Bank indicators and an explicitly documented aggregation procedure, (ii) adopt a VRS, output-oriented second-stage formulation that aligns with the policy question of “how much ESG can be achieved given economic capacity”, and (iii) add robustness and inferential components (sensitivity checks, outlier checks, and bootstrap intervals) to address well-known DEA concerns about frontier sensitivity and sampling variation. These elements together advance the reproducibility and interpretability of sovereign ESG efficiency benchmarking.
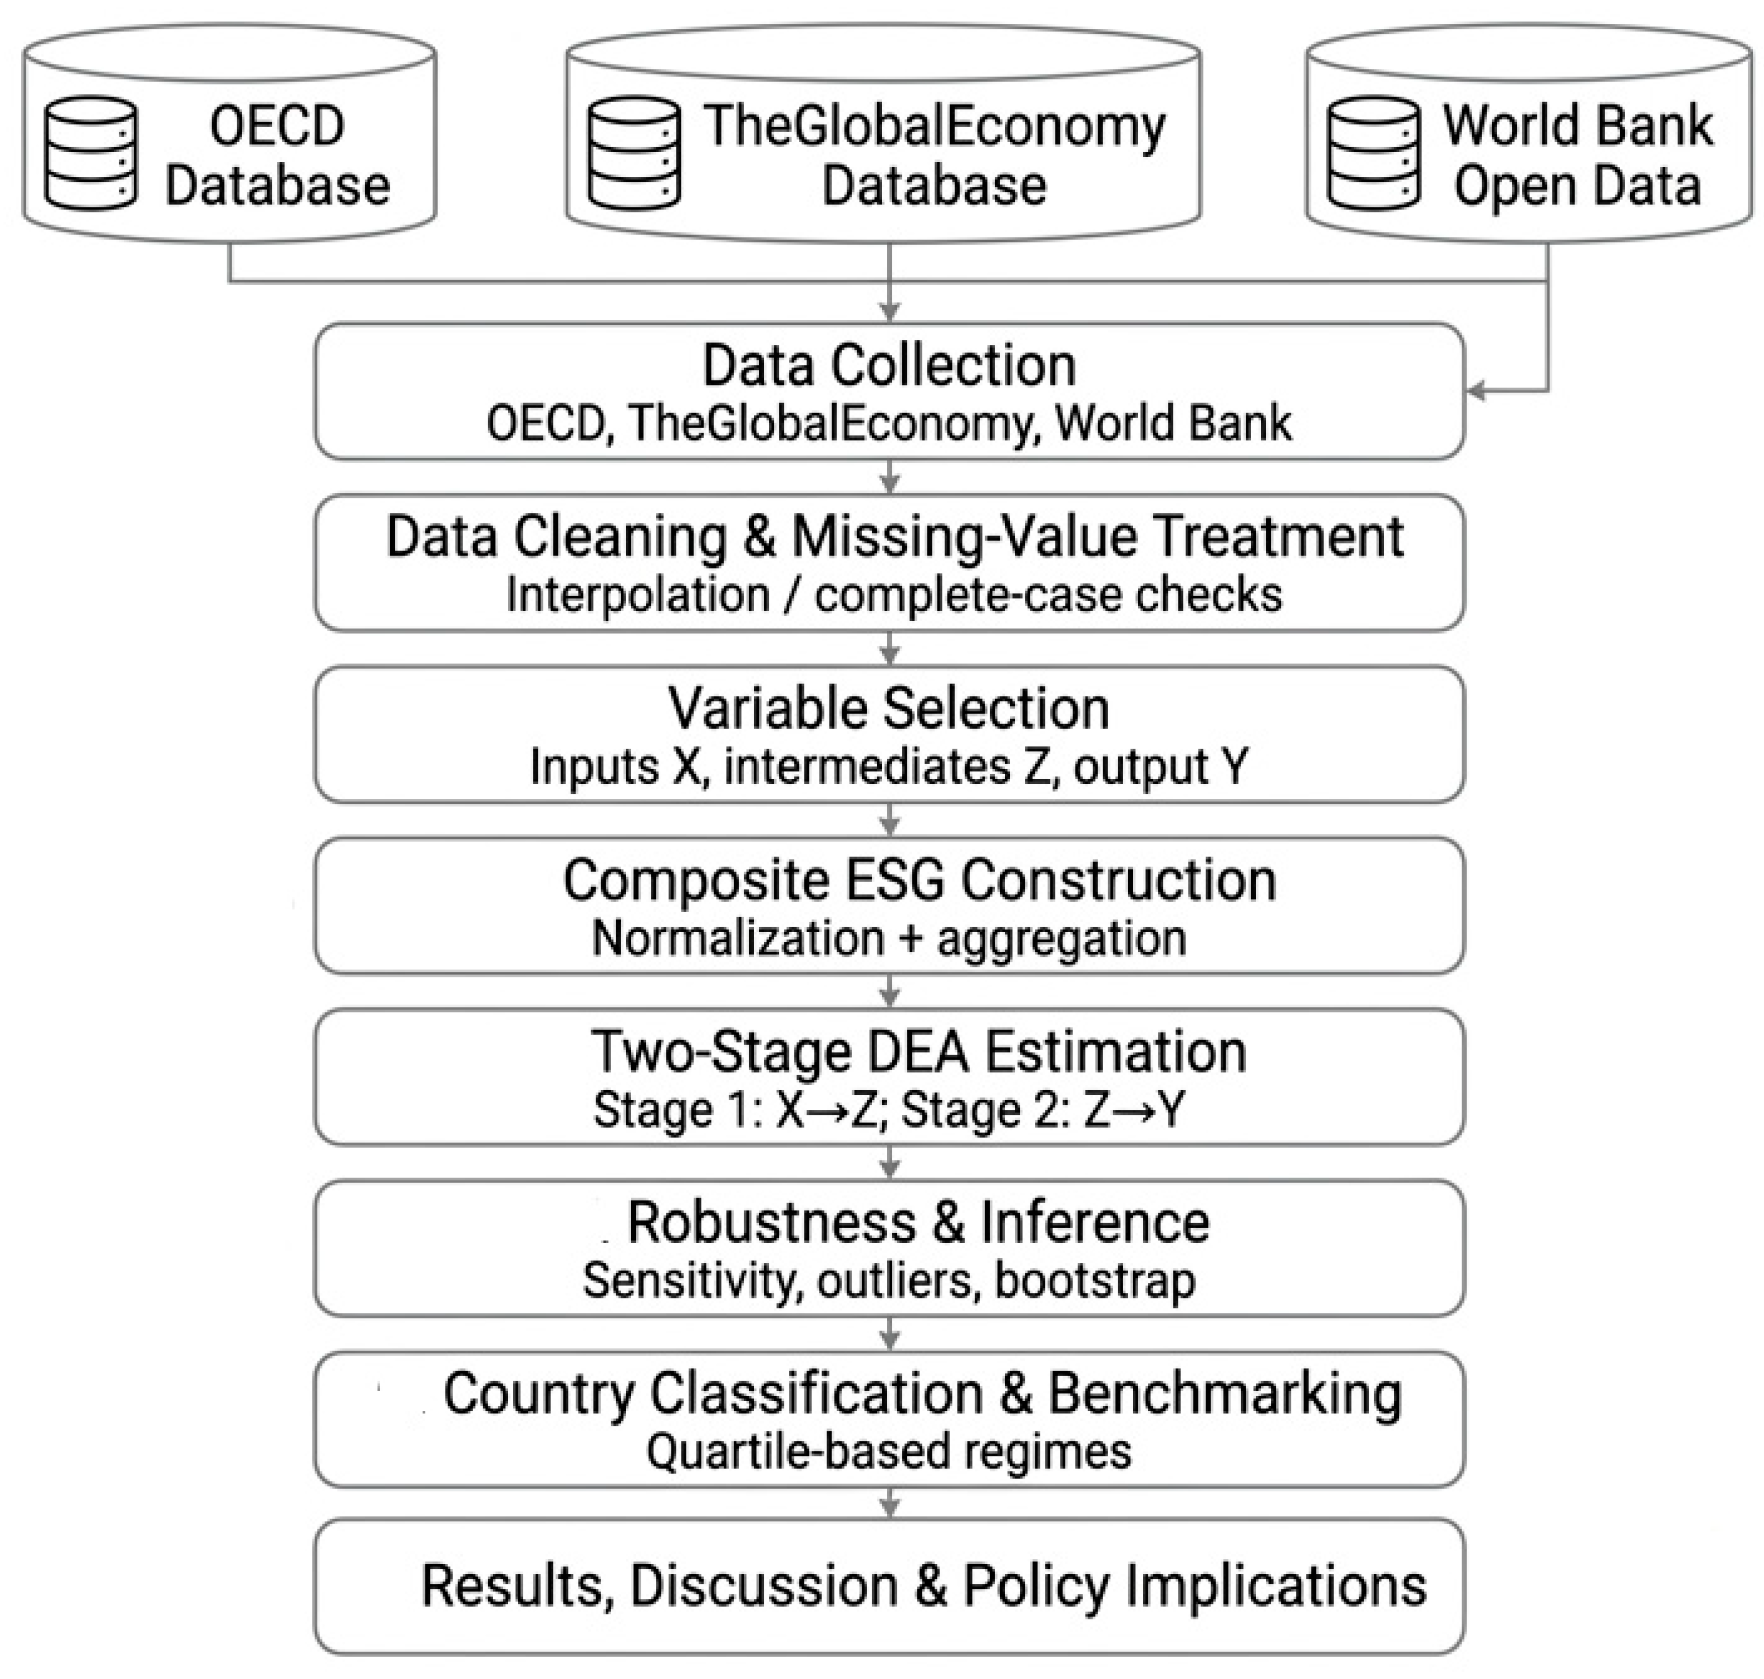
By conducting this analysis, the study identifies leading and lagging countries in ESG efficiency, offering actionable insights for policymakers and investors. The results also contribute empirical evidence to the academic literature on the relationship between ESG performance and economic efficiency. The research process of this study is shown in Figure 1.
The remainder of this paper is organized as follows. Section 2 reviews relevant literature on ESG and efficiency analysis. Section 3 presents the research methodology and data. Section 4 reports empirical results and discussions. Finally, Section 5 concludes the study and offers policy implications and suggestions for future research.

2. Literature Review

2.1. Conceptual Foundations and Evolution of ESG

Environmental, Social, and Governance (ESG) is a comprehensive framework used to evaluate the sustainability performance of firms, institutions, and investment portfolios across environmental protection, social responsibility, and governance quality. The concept of ESG originated from Corporate Social Responsibility (CSR), which emphasizes the ethical obligations of corporations toward society and the environment.
With the growing global emphasis on sustainable development and responsible investment, CSR principles have gradually been incorporated into financial decision-making and business operations. Over time, the ESG framework emerged as a more systematic and measurable approach that integrates non-financial risks and opportunities into investment analysis. Compared with CSR, ESG provides quantifiable indicators that enable investors and stakeholders to assess sustainability performance more objectively.
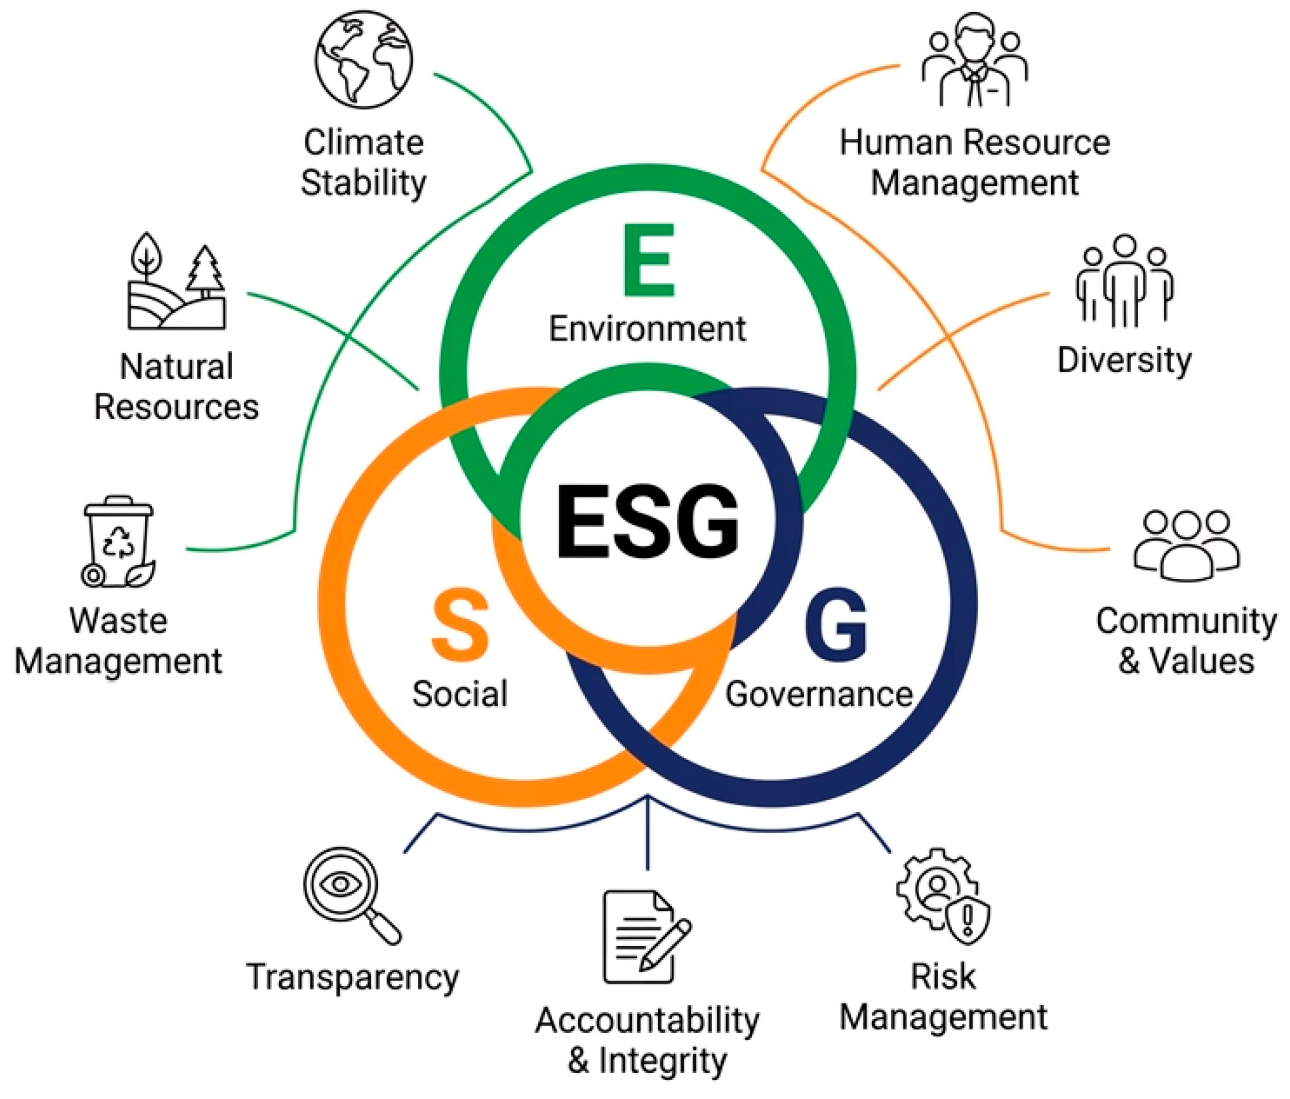
Specifically, the environmental dimension (E) focuses on firms’ impacts on natural ecosystems, including energy consumption, greenhouse gas emissions, resource utilization, and waste management. The social dimension (S) evaluates contributions to human welfare and social equity, such as labor rights, human rights, community engagement, education, and public health. The governance dimension (G) addresses corporate governance structures and processes, including board composition, shareholder protection, transparency, risk control, and ethical standards.
In recent years, ESG investment has become a dominant trend in global capital markets (Figure 2). Institutional investors, asset management companies, and financial institutions increasingly incorporate ESG criteria into portfolio construction and risk assessment. As a result, ESG has evolved from voluntary ethical consideration into a core component of modern financial systems, promoting a transition toward more sustainable and responsible economic development.
A recurring methodological issue in ESG research is aggregation: composite indices require normalization and weighting, yet there is no universal agreement on how to assign weights to environmental, social, and governance dimensions [12,13]. Equal weighting is transparent and reproducible but may be simplistic if dimensions differ in importance across contexts [13]. To address this, prior work commonly applies sensitivity analysis (alternative fixed weights) or data-driven weighting such as principal component analysis (PCA) to test whether substantive conclusions are robust to index construction choices [14,15]. This motivates reporting robustness checks alongside any baseline composite ESG measure.
DEA has been widely applied in sustainability contexts to benchmark environmental and eco-efficiency performance, including cases where desirable outputs (e.g., economic production) are jointly produced with undesirable outputs (e.g., emissions) [16,17]. This literature demonstrates that frontier-based benchmarking can support comparative evaluation of green performance and identify potential improvement without imposing restrictive functional forms [16]. At the same time, sustainability studies increasingly recognize that institutional and governance factors can shape efficiency outcomes, motivating second-stage analysis to relate efficiency scores to policy, institutional, and structural determinants [18,19].
Standard DEA treats the production process as a single stage, which can obscure the role of intermediate variables and chained mechanisms. Network DEA extends the traditional framework by explicitly modeling intermediate products linking sub-processes, improving interpretability when a system operates through sequential stages [10,11]. Empirical work has used network DEA to study multi-step processes such as production–innovation–environment chains and other staged transformations [10,20]. This methodological line supports using a two-stage structure when the research question concerns not only overall performance, but also which stage is constraining progress.

2.2. The Relationship Between ESG and Economic Efficiency

The relationship between ESG performance and economic efficiency is generally considered bidirectional and mutually reinforcing. Existing literature suggests that improvements in ESG practices can enhance economic outcomes, while stronger economic performance can provide resources necessary for sustainability initiatives.
From the perspective of ESG influencing economic efficiency, three primary mechanisms are frequently discussed. First, strong ESG performance reduces market uncertainty and information asymmetry, thereby enhancing market efficiency. By increasing transparency and credibility, ESG practices help build trust between investors and stakeholders, which lowers financing costs and attracts responsible capital.
Second, effective ESG implementation facilitates more efficient allocation of resources. Both market and non-market mechanisms can channel capital toward more productive and innovative sectors, encouraging technological advancement and sustainable growth. Third, ESG-related policies—including infrastructure development, education investment, and property rights protection—help mitigate social and environmental risks, thereby enhancing long-term economic stability.
Conversely, economic efficiency can also positively influence ESG performance through several channels. Economically efficient countries typically maintain higher investment rates, promote technological innovation, and develop cleaner production technologies. Innovations such as renewable energy systems, smart grids, hydrogen technologies, and bioenergy solutions contribute to environmental protection and sustainability improvements.
Moreover, higher employment and income levels enhance social inclusion and equity, which are crucial components of the social dimension of ESG. Improved living standards also increase public awareness of environmental protection and governance quality. Peter et al. [21] demonstrates that higher levels of economic development are associated with greater public investment in education, healthcare, and infrastructure, which further strengthens sustainability outcomes. Leogrande and Costantiello [22] find that economic efficiency has a significant positive impact on ESG efficiency.
Overall, the existing literature, as shown in Table 1, supports the view that ESG and economic efficiency are complementary rather than conflicting objectives. Countries capable of achieving both tend to exhibit stronger long-term competitiveness and resilience.

2.3. Sovereign ESG Evaluation Methods

While ESG assessment was initially developed at the corporate level, researchers and institutions have increasingly extended the concept to sovereign or national contexts. Sovereign ESG scores measure a country’s overall performance in environmental sustainability, social development, and governance quality.
According to Jiang et al. [29] sovereign ESG indices provide investors with a more comprehensive risk assessment framework by evaluating a nation’s environmental policies, social conditions, and governance structures. These assessments typically follow several systematic steps.
First, data collection involves gathering information from multiple sources, including government reports, international organizations (such as the United Nations, World Bank, and International Monetary Fund), non-governmental organizations, academic studies, and media reports. The collected data covers a wide range of indicators across environmental, social, and governance dimensions.
Second, indicators are selected to represent each ESG dimension. Environmental indicators may include greenhouse gas emissions, renewable energy usage, resource management, and biodiversity protection. Social indicators often measure education access, healthcare coverage, poverty rates, and income inequality. Governance indicators typically evaluate government effectiveness, corruption control, rule of law, regulatory quality, and political stability.
Third, normalization procedures are applied to standardize variables with different units and scales. Common techniques include Z-score standardization and min–max normalization. Fourth, weights are assigned to each indicator according to their relative importance, which may be determined through expert judgment, statistical methods, or multi-criteria decision analysis.
Finally, standardized indicators are aggregated into composite scores to generate environmental, social, governance, and overall ESG ratings. These scores allow cross-country comparisons and help identify strengths and weaknesses in national sustainability performance.
Despite growing interest, sovereign ESG evaluation still lacks a universally accepted framework. Differences in indicator selection, weighting schemes, and methodologies across institutions lead to inconsistent results. Consequently, further empirical research is necessary to develop more objective and robust evaluation methods.
Recent policy and market research emphasizes that sovereign ESG measurement is still evolving, with meaningful differences across data providers and potential income-related biases. For example, the IMF reviews the post-2021 sovereign ESG landscape and highlights cross-provider dispersion, methodological opacity, and the challenge of separating sustainability signals from income effects.
In parallel, the World Bank has expanded and continuously updated its Sovereign ESG Data Portal, which curates a large set of country-level ESG indicators and provides tools such as income adjustment, peer comparison, and quadrant analysis for cross-country benchmarking. These developments support the need for transparent, reproducible sovereign ESG analytics, and motivate efficiency-based approaches that explicitly relate outcomes to resources or capacity.
Two implications follow from the recent sovereign ESG measurement literature. First, because ESG metrics may embed income effects, an efficiency framework that conditions ESG outcomes on economic capacity (e.g., GDP and trade openness) can provide a complementary “performance relative to resources” perspective. Second, given provider dispersion and data uncertainty, DEA applications increasingly emphasize robustness via sensitivity checks, statistical inference (e.g., bootstrap), and robust DEA variants that account for data perturbations.

2.4. Data Envelopment Analysis

Data Envelopment Analysis (DEA) is grounded in mathematical linear programming theory and serves as a powerful decision-making tool for evaluating the relative efficiency of decision-making units (DMUs). It is particularly suitable for performance assessment when multiple inputs and outputs are involved. DEA estimates an empirical production frontier based on observed data and measures the efficiency of each DMU relative to this frontier.
Unlike traditional parametric approaches, DEA does not require the specification of a predefined production function. Instead, it constructs a piecewise linear frontier directly from the data, allowing for objective and flexible efficiency evaluation.
DEA was first proposed by Charnes, Cooper, and Rhodes [32]. Let
X i j ,   i = 1 , , m Y r j , r = 1 , , s j = 1 , , n E k C C R = m a x r = 1 s u r Y r k / i = 1 m v i X i k s . t .   r = 1 s u r Y r j i = 1 m v i X i j 1 ,       j = 1 , , m u r ,   v i ε   r = 1 , , s , i = 1 , , m
E k C C R denotes the efficiency score of DMU k.
The variables u 1 and v i represent the multipliers associated with the rth output and the ith input, respectively. The symbol ε is a small non-Archimedean positive number introduced to prevent zero weights.
Subsequently, Charnes and Cooper [33] proposed a transformation to prevent each DMU from assigning zero weights to unfavorable input or output factors. Specifically, the original model was reformulated as a fractional linear programming problem and then converted into the following equivalent linear programming model:
E k C C R = m a x r = 1 s u r Y r k s . t .   i = 1 m v i X i k = 1 r = 1 s u r Y r j i = 1 m v i X i j 0 ,   j = 1 , , n u r ,   v i ε ,   r = 1 , , s ,   i = 1 , , m .
DEA offers several advantages. First, it accommodates multiple inputs and outputs simultaneously, making it suitable for multidimensional performance evaluation. Second, it avoids subjective assignment of weights by determining them endogenously. Third, it relies on actual observed data, providing objective assessments. Consequently, DEA has been widely applied in various fields, including education, healthcare, transportation, finance, and public policy.
However, DEA also has limitations. Results are sensitive to data quality and sample size, and the method does not provide statistical inference tests. Additionally, when the number of DMUs is small relative to the number of variables, DEA may overestimate efficiency.
DEA models can be categorized into input-oriented and output-oriented approaches. Input-oriented models minimize resource usage while maintaining output levels, whereas output-oriented models maximize outputs given fixed inputs. Both approaches are widely used depending on research objectives.

2.5. Studies Related to DEA Applications

DEA has been extensively applied across diverse research domains. Kaffash et al. [34] reviewed DEA applications in insurance companies and found a significant increase in usage after 2010. Sarraf and Nejad [35] employed DEA combined with Grey Relational Analysis to evaluate the efficiency of water supply companies in Iran.
In the manufacturing sector, Zhu et al. [36] integrated DEA with machine learning techniques to handle large datasets and assess corporate efficiency. Nong [37] applied DEA to analyze retail efficiency in Vietnam’s fashion industry.
Within transportation research, Mahmoudi [38] concluded that DEA is one of the most useful tools for evaluating transportation systems, particularly in sustainability contexts. Forouzandeh et al. [39] combined DEA with simulation software to assess bus route performance. In strategic and innovation studies, Luo et al. [40] used DEA and the Malmquist productivity index to evaluate green technological innovation efficiency.
Regarding ESG-related research, Zhou et al. [41] examined how firm-level ESG practices affect macroeconomic performance. Pham et al. [31] found a positive relationship between ESG scores and firm performance in the transportation industry. Cheng et al. [30] applied a two-stage DEA approach to evaluate how resource allocation efficiency translates into both ESG and financial outcomes.
Despite these advances, studies applying DEA to evaluate sovereign ESG efficiency remain scarce. This gap highlights the necessity of adopting DEA frameworks to assess how effectively countries transform economic resources into sustainability outcomes—an issue that the present study seeks to address. Table 2 shown studies related to data envelopment analysis.

3. Methodology

3.1. Data Sources

This study compiles cross-country data from multiple international databases to construct a comprehensive dataset for evaluating the economic and ESG efficiency of OECD member countries. Specifically, the data are obtained from three major sources: the OECD Database, The Global Economy database, and the World Bank Open Data platform.
First, the OECD Database provides a wide range of economic, demographic, and labor-related indicators for OECD member countries. This database contains over 80,000 statistical series covering economic performance, labor markets, education, health, energy, and social welfare. Variables such as population, labor force, and Gross Domestic Product (GDP) are retrieved from this source.
Second, The Global Economy database offers macroeconomic and energy-related statistics for countries worldwide. It includes more than 4000 indicators presented in time-series format, enabling cross-country comparisons. In this study, variables such as gasoline consumption, coal consumption, electricity usage, and trade openness are collected from this database.
Third, the World Bank Open Data platform provides comprehensive sustainability and governance indicators. ESG-related measures are constructed based on environmental, social, and governance statistics published by the World Bank. These indicators are widely recognized and frequently used in sovereign sustainability research.
While more recent data exists for select countries, utilizing post-2020 data would result in a significant reduction in sample size due to missing values in key ESG indicators. Therefore, we restricted our analysis to 2020 to maintain a balanced dataset covering the full spectrum of OECD nations. This tradeoff prioritizes cross-country comparability and model validity over temporal recency.

3.2. Input–Output Variables

This study determines the DEA input and output variables based on an extensive literature review. Prior studies suggest that GDP is generated through the consumption of labor, capital, and energy resources [42]. Therefore, the transformation of resources into economic output and subsequently into ESG outcomes can be naturally modeled using a two-stage production structure.
Following the logic of resource utilization, the first stage evaluates economic efficiency, where energy and labor inputs generate economic outputs. The second stage evaluates ESG efficiency, where economic outcomes are further transformed into sustainability performance. The selected variables and its citations are summarized in Table 3.

Construction of the Composite ESG Output

Because DEA results depend critically on the definition of outputs, we explicitly document how the composite ESG score (the final output in Stage 2) is constructed from World Bank data.
Normalization. For each underlying indicator, we apply min–max normalization within the OECD sample to map values to a 0–100 scale. For “lower-is-better” indicators (e.g., emissions, PM2.5, unemployment), we reverse the normalized values so that higher scores consistently indicate better performance.
Aggregation and weights. We compute each pillar score (E, S, G) as the unweighted average of its normalized indicators. The composite ESG score is then calculated as the unweighted average of the three pillar scores:
E S G k = E k + S k + G k / 3 .
This equal-weight specification prioritizes transparency and avoids embedding subjective preferences into the scoring scheme; it also makes the DEA output reproducible from publicly available sources.
Missing data treatment. If an indicator value is missing for a country in 2020, we impute it using linear interpolation based on the closest available years in the World Bank time series. If interpolation is not possible due to insufficient data, we exclude that indicator for that country when computing the pillar average and record the missingness rate.

3.3. Two-Stage DEA

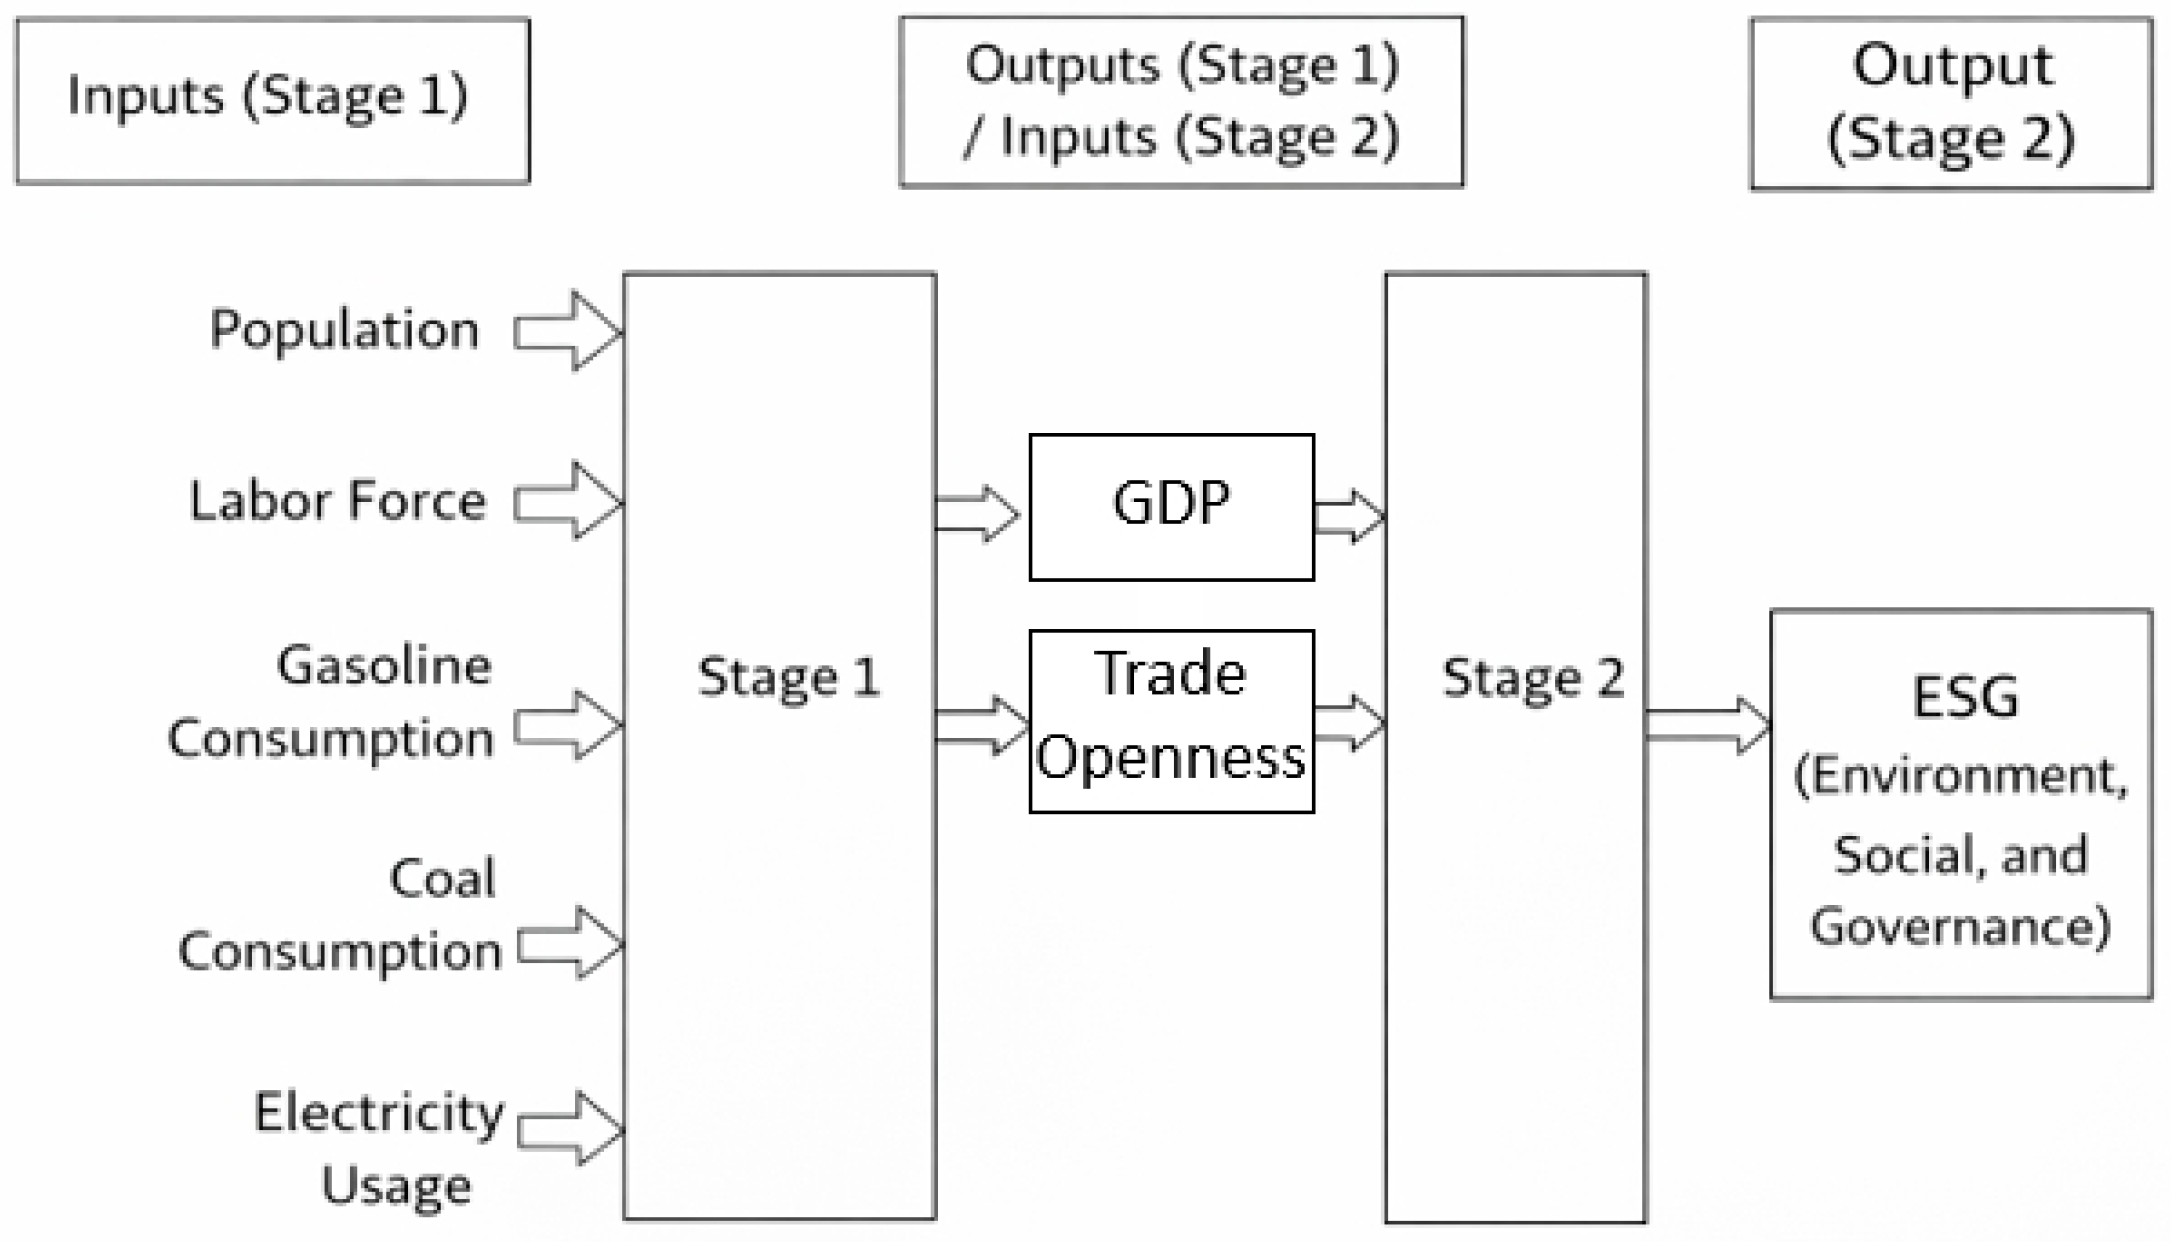
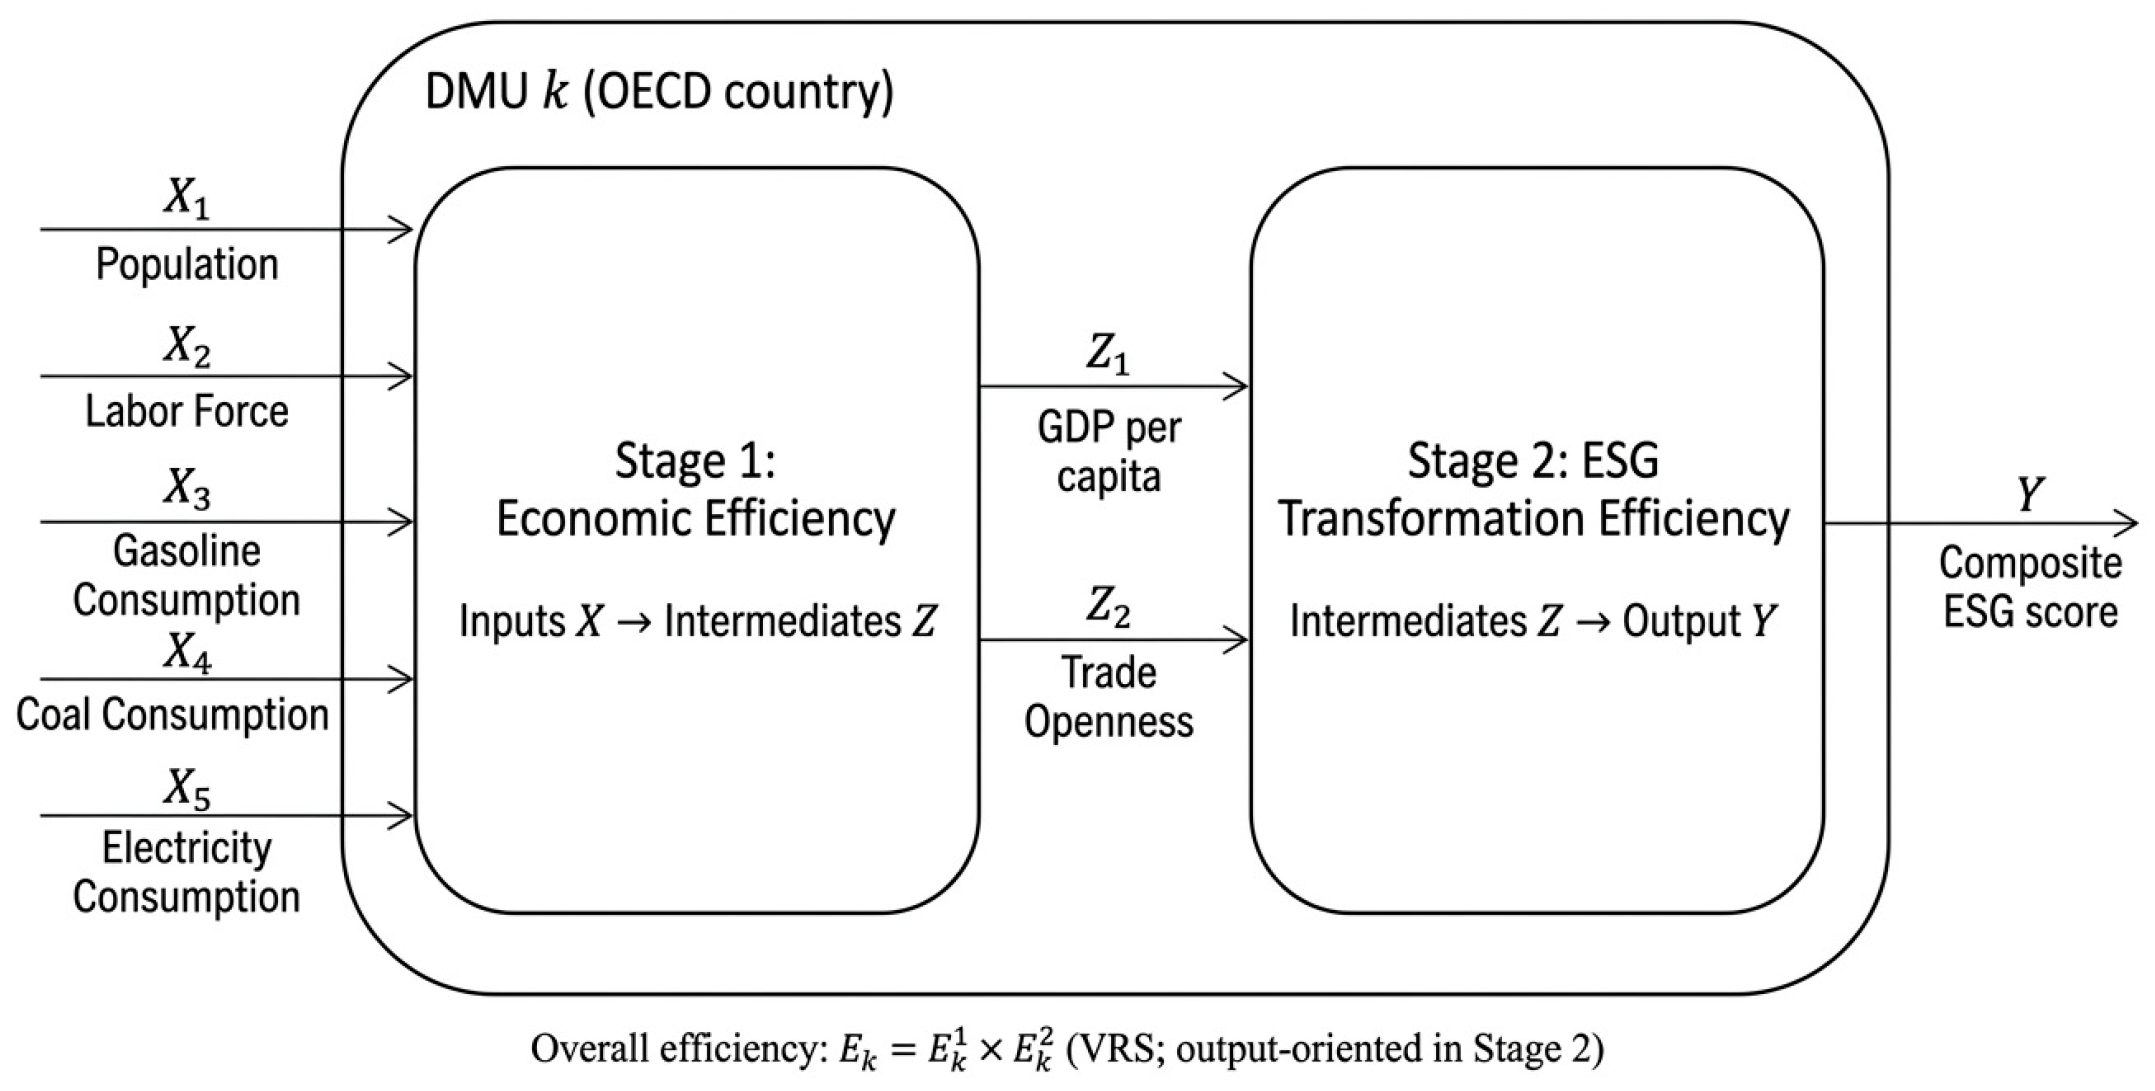
This study adopts the two-stage Data Envelopment Analysis (DEA) model proposed by Kao and Hwang [50] as the efficiency evaluation method. The overall production process is assumed to consist of two sequential sub-processes, as illustrated in Figure 3.
To make countries with very different economic scales comparable, this study adopts a variable return to scale (VRS) assumption. In Stage 2, we emphasize an output-oriented perspective: given a country’s economic outputs (GDP and trade openness), we assess how much ESG outcome can be achieved relative to the best performers.
The entire system utilizes m inputs, denoted as X i k for i = 1 , , 5 , and produces one final output, denoted as Y r k (the composite ESG score). Unlike the traditional single-stage production framework, the production structure in this study is composed of two interconnected stages.
Let Z p k , p = 1 , 2 represent the intermediate products. These intermediate products serve as the outputs of the first stage and simultaneously act as the inputs to the second stage, thereby linking the two sub-processes.
Based on this structure, the efficiency of the first stage E k 1 and the efficiency of the second stage E k 2 are evaluated separately. The corresponding mathematical formulations for these two stage efficiencies are presented as follows:
E k 1 = m a x p = 1 2 w p Z p k / i = 1 5 v i X i k s . t .     p = 1 2 w p Z p j / i = 1 5 v i X i j 1 ,   j = 1 , , 38 , w p , v i ε ,   p = 1 , 2     i = 1 , , 5 ,
E k 2 = m a x u r Y r k p = 1 2 w p Z p k s . t .   u r Y r j p = 1 2 w p Z p j 1 ,   j = 1 , , 38 , u r , w p ε ,   p = 1 , 2 .
The two stage-specific models are conceptually similar to the original model (1), in that their efficiency scores are calculated independently. However, to integrate these two sub-processes into a unified framework, an additional model is required to explicitly describe the serial linkage between the overall production system and the two interconnected stages.
Considering DMU k, let u r * , v i * , and w p * denote the optimal multipliers selected by DMU k. These multipliers are used to evaluate their overall efficiency E k , as well as the stage-specific efficiencies E k 1 and E k 2 . The corresponding formulations for the overall efficiency and the efficiencies of the two sub-processes are defined as follows:
E k = u r * Y r k i = 1 5 v i * X i k E k 1 =   p = 1 2 w p * Z p k / i = 1 5 v i * X i k 1 , E k 2 = u r * Y r k p = 1 2 w p * Z p k
The overall efficiency is defined as the product of the efficiencies of the two sub-processes.
E k = E k 1 × E k 2
Based on this concept, the overall efficiency E k is formulated by explicitly incorporating the serial relationship between the two sub-processes, and the ratio constraints of both stages are integrated into the unified model.
E k = m a x u r Y r k i = 1 5 v i X i k
s . t .     u r Y r j i = 1 5 v i X i j 1 ,   j = 1 , , 38 ,
p = 1 2 w p Z p j / i = 1 5 v i X i j 1 ,   j = 1 , , 38 ,
u r Y r j p = 1 2 w p Z p j 1 ,   j = 1 , , 38 ,
u r , v i , w p ε ,   i = 1 , , 5 ;   p = 1 , 2 .
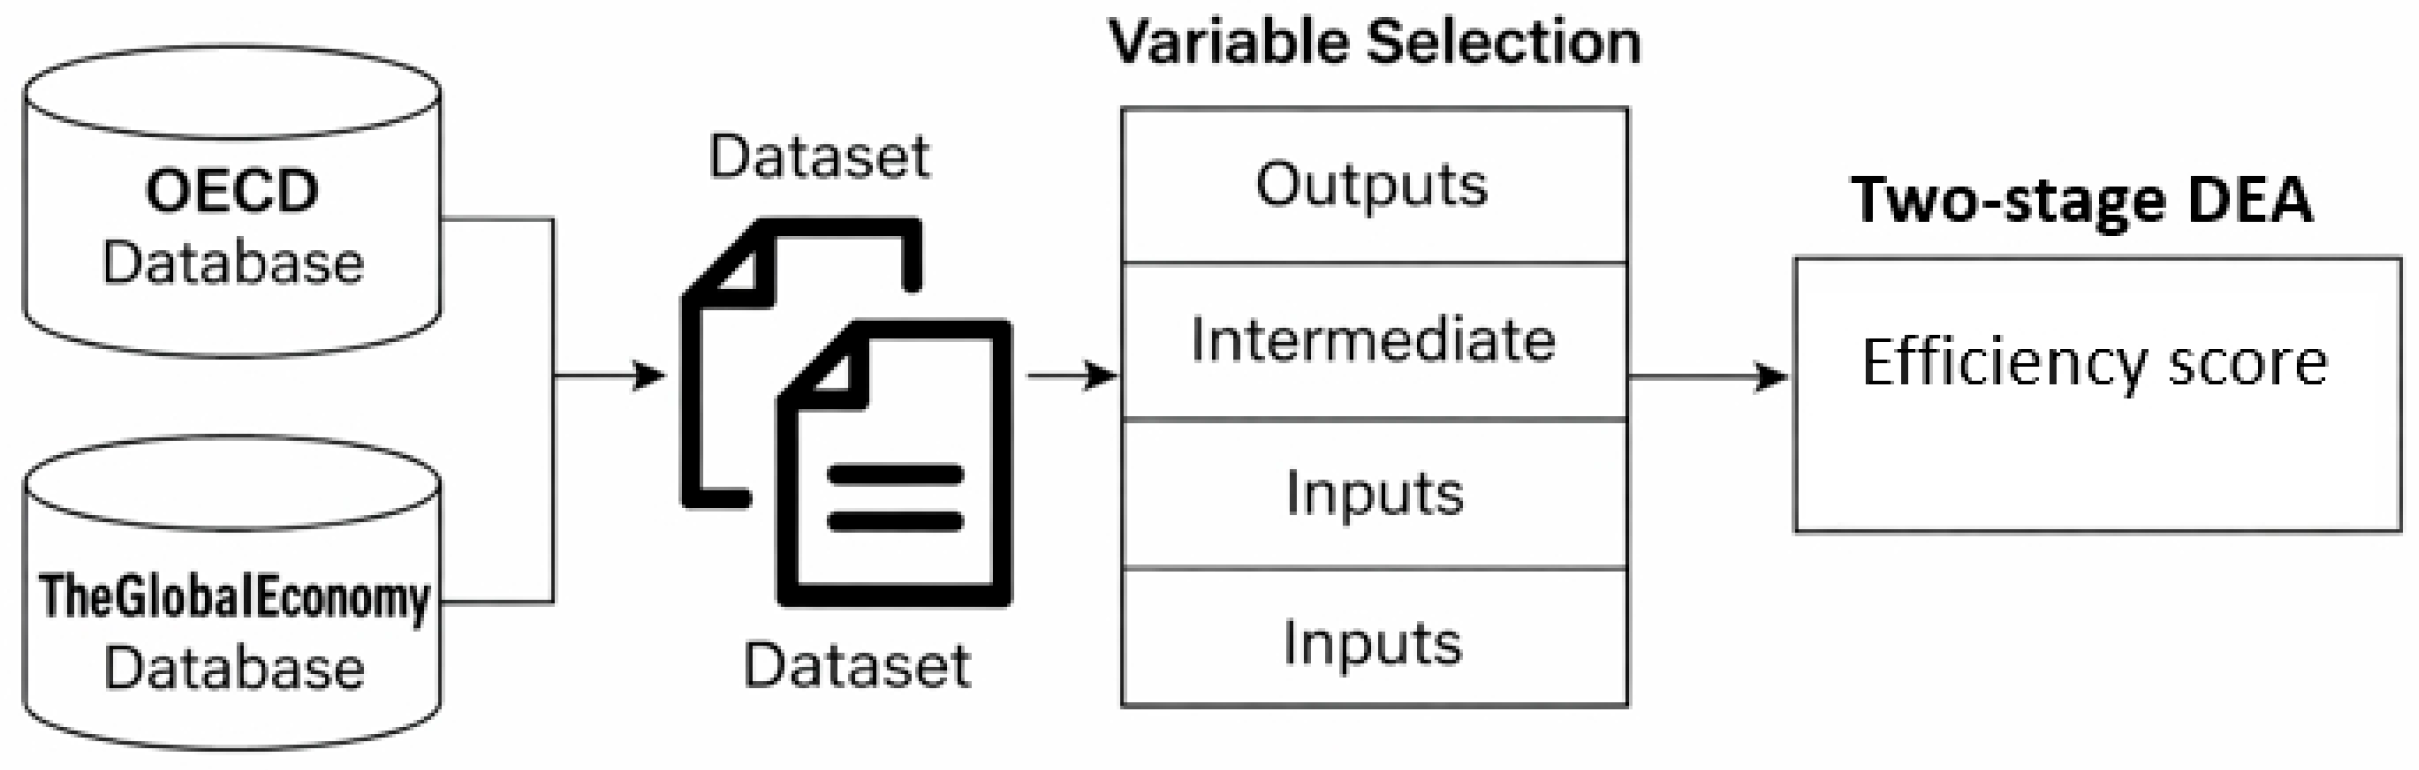
This study applies a two-stage Data Envelopment Analysis (DEA) framework to evaluate the ESG efficiency of OECD member countries. The analytical structure of the two-stage DEA model is illustrated in Figure 4.
To construct the research dataset, variables collected from the OECD, World Bank, and The Global Economy databases are integrated. Based on an extensive literature review, appropriate input and output variables are selected for both the first and second stages of the analysis. Missing values are addressed using linear interpolation implemented in SPSS 25, following Chen et al. [46]. It is important to note that global data reporting has experienced delays following the COVID-19 pandemic. Consequently, 2020 serves as the most recent and reliable benchmark for a synchronized comparison of sovereign efficiency. We employ this dataset to demonstrate the applicability of the proposed two-stage DEA framework, which can be readily updated as more recent comprehensive data becomes available.

3.4. Research Framework

According to Krausmann et al. [51], the twentieth century was characterized by unprecedented growth in both population and the global economy. Over the past one hundred years, the world population increased fourfold to approximately 6.4 billion, while global GDP expanded by more than twenty times. Similarly, Kitov [52] compared GDP growth rates with demographic trends and found that the age distribution of the population exerts a stronger influence on GDP growth than certain macroeconomic trends.
Mohsen [53], using the Granger causality test, further demonstrated the existence of bidirectional short-run causal relationships among trade openness, GDP, and population. Collectively, these findings highlight the critical role of demographic factors in shaping economic performance.
Based on the above arguments, this study proposes the following relationship:
  • Impact of Population and Labor Input on Economic Efficiency
According to the OECD definition, the labor force comprises employed individuals and those actively seeking employment; employment creation directly contributes to GDP and stimulates aggregate demand through the multiplier effect [42]. Bryant et al. [54] indicates that labor force participation helps narrow income gaps, while Majid [55] and Madanizadeh and Pilvar [56] confirm that trade openness significantly influences economic growth and unemployment rate fluctuations. This study builds upon these findings to explore the decisive role of population and labor participation in economic performance.
2.
Causal Relationship Between Energy Input and Economic Efficiency
Labor participation positively affects economic efficiency, and energy consumption exhibits a long-term correlation with GDP [57]. Nayan et al. [58] identified a unidirectional causal relationship between the two. Furthermore, research by Odhiambo [59] and Osei-Assibey Bonsu and Wang [60] reveals complex bidirectional relationships among trade openness, energy consumption, and income. Qi et al. [61] further demonstrates that energy’s contribution to growth is highly dependent on trade, particularly in countries with lower economic efficiency.
3.
GDP Input as a Driver for ESG Outputs
Energy and economic outputs are closely linked, and ESG strategies are vital for sustainable development. Analysis by Prima and Akbar [62] shows that natural resources, ESG efficiency, and economic efficiency are interconnected. Empirically, Leogrande and Costantiello [22] point out that economic growth (GDP) provides the necessary resources to support environmental protection and social responsibility, thereby exerting a significantly positive effect on ESG efficiency.
4.
Promotion of ESG Efficiency Through Trade Openness
Trade openness serves as a key indicator of economic vitality. Siti Nurazira et al. [63] found that trade openness promotes the globalization of environmental standards, driving innovation and enhancing ESG efficiency. Similarly, Santander et al. [64] confirmed a significant correlation between trade openness and ESG performance, suggesting that policy formulation should consider the comprehensive impacts of trade on environmental and social welfare.
5.
Two-Stage Efficiency Analysis Framework
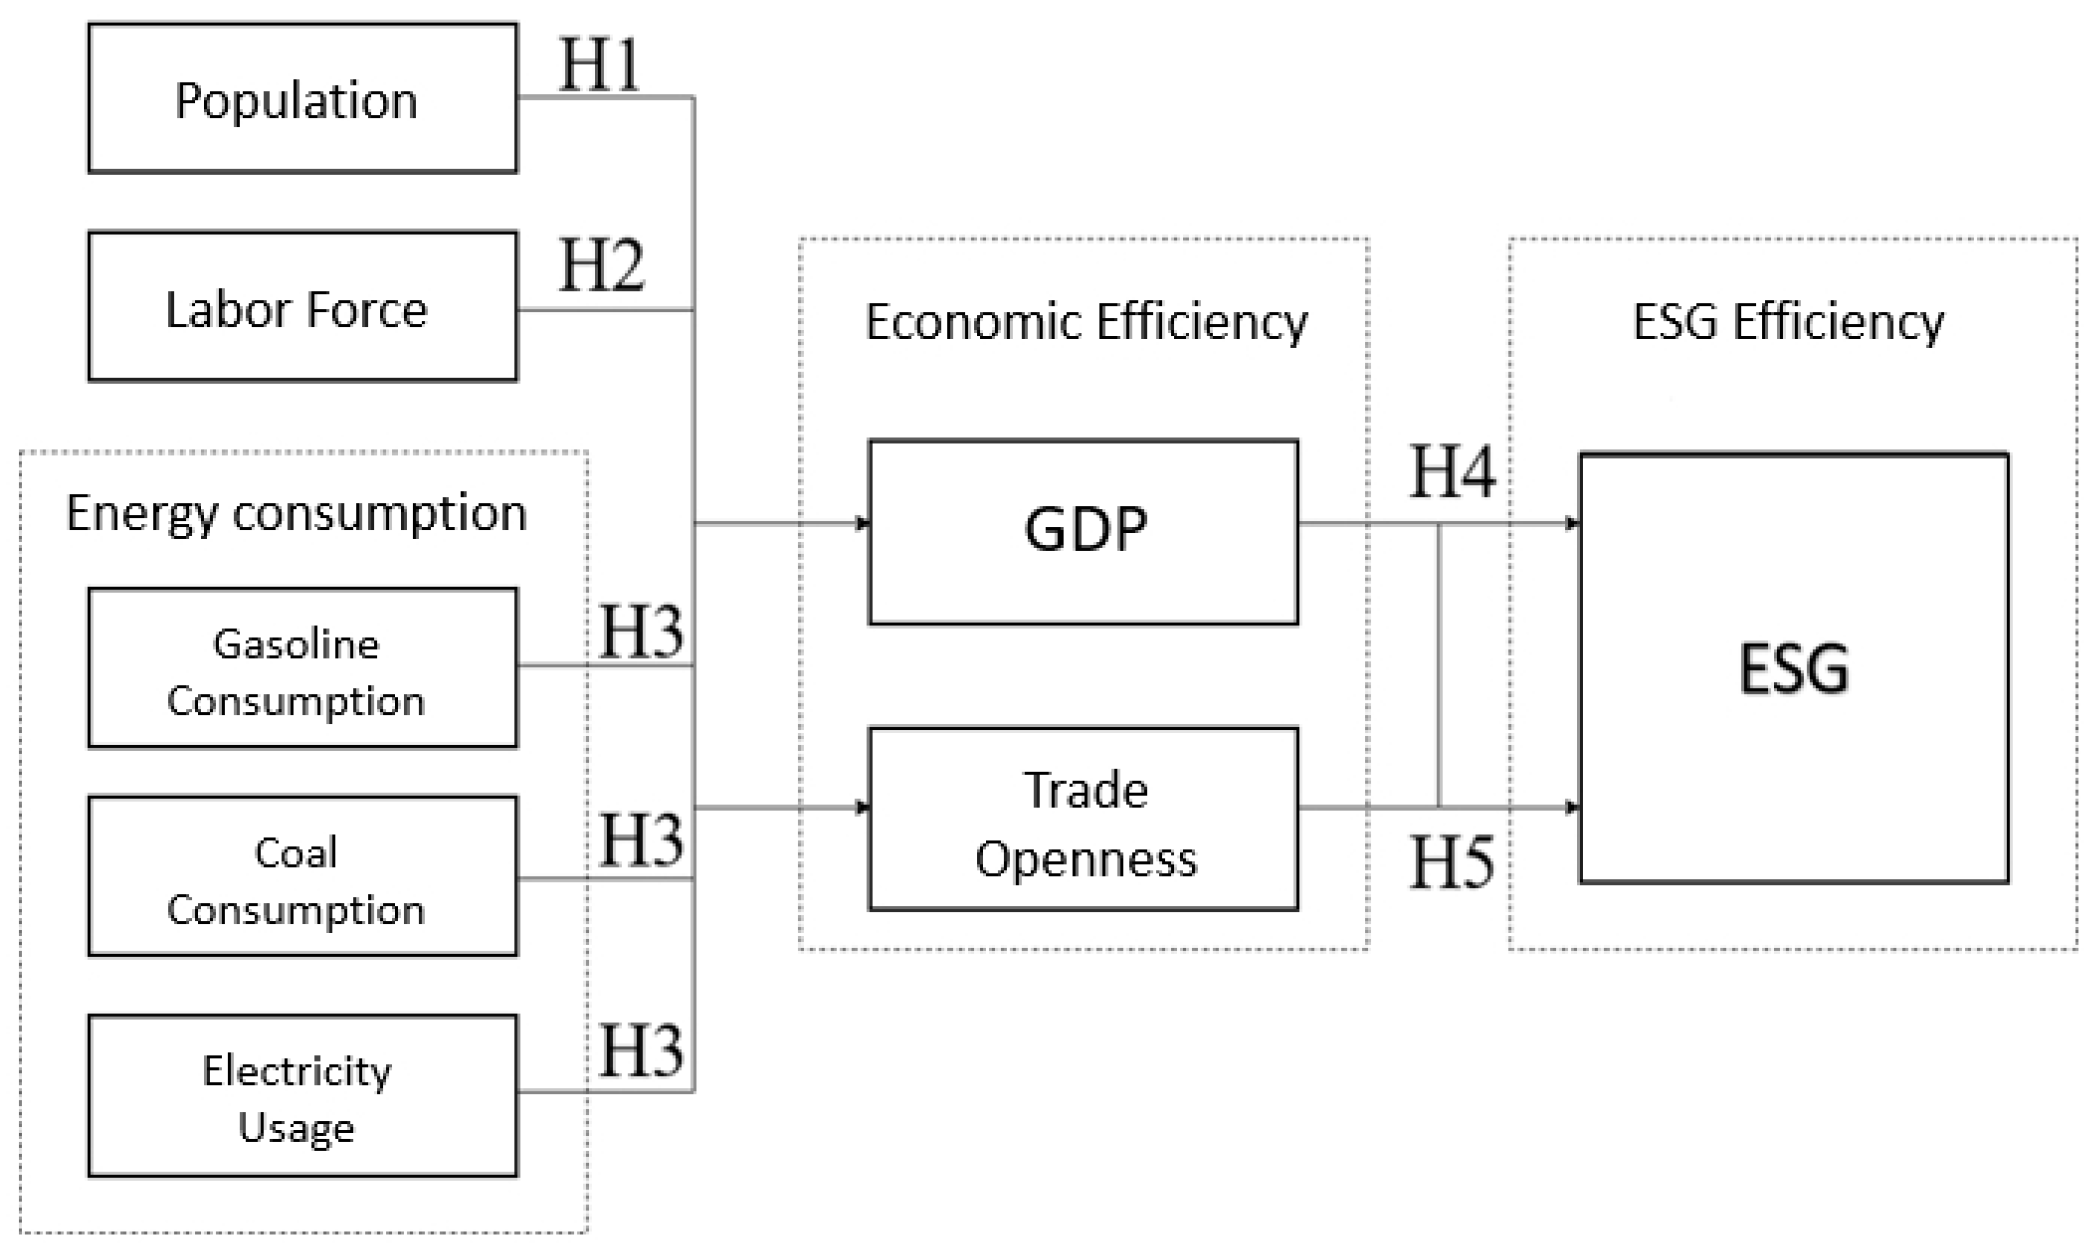
The first stage of this study analyzes how OECD countries enhance economic efficiency through population, labor, and energy inputs (resulting in GDP growth and increased tax revenue). However, growth should not come at the expense of sustainability; thus, Leogrande and Costantiello [22] emphasize that countries with higher economic efficiency should exhibit higher ESG scores. The second stage focuses on ESG efficiency analysis, exploring how robust ESG performance assists in risk management and attracts responsible investment for long-term success
This study develops a two-stage network model linking economic efficiency and ESG efficiency. Population, labor force, and energy consumption are combined with GDP and trade openness to measure economic efficiency in the first stage. The outputs of the first stage are also used as inputs for the second stage. Thus, GDP and trade openness serve as inputs to generate ESG scores, representing ESG efficiency in the second stage. Figure 5 shows the research dimensions of the two-stage DEA model, and Figure 6 presents the two-stage DEA framework.
The composite ESG output (Y) is constructed by applying min–max normalization to the E, S, and G pillars and aggregating them using equal weights. This baseline approach is transparent and easy to replicate, but it is admittedly simplified because it assumes identical importance across ESG dimensions. To assess whether our results are sensitive to this assumption, we conduct a robust check using PCA-based weights derived from the first principal component of the standardized E/S/G pillars. The PCA weights are highly balanced (wE = 0.3329), (wS = 0.3357), (wG = 0.3314)), and the resulting PCA-weighted ESG ranking is identical to the equal-weight ranking (Spearman (\rho = 1.000)); detailed results are reported in Appendix B.
Moreover, because Stage 2 uses GDP per capita as an intermediate input (Z1) while ESG is the output (Y), ESG outcomes may partly embed income-related capacity (e.g., institutional quality, fiscal space, and reporting capability), create potential endogeneity or overlap information with (Z1). Therefore, the estimated Stage 2 “ESG transformation efficiency” should be interpreted as a benchmarking measure under observed conditions rather than a causal effect. As an additional robustness check, we also evaluated an income-adjusted ESG measure and show that the main conclusions remain qualitatively unchanged (Appendix B).

4. Empirical Results and Discussion

4.1. Results of the Two-Stage DEA Efficiency Analysis

This study adopts LINGO 20 as the software development tool. The input and output variables are presented in Table 3 at Section 3.2. The descriptive statistics of the input and output variables are summarized in Table 4.
Because overall efficiency is defined as the product of the two stage efficiencies, a country must perform well in both stages to achieve superior sustainability performance. High economic efficiency alone does not guarantee strong ESG outcomes, and vice versa.
The empirical results reveal substantial heterogeneity across OECD countries, suggesting that resource utilization and sustainability transformation capacities differ significantly among nations. The results of the two-stage DEA efficiency analysis are shown in Appendix A, Table A2. We will discuss the four countries with the highest overall efficiency as follows.
Estonia (EST) is a high-income economy in Europe. Regarding ESG performance, Estonia has achieved favorable outcomes in environmental protection, particularly in the use of renewable energy. The country has continuously made efforts to reduce carbon emissions and promote renewable energy development. For example, Estonia has vigorously developed wind power and biomass energy to reduce its dependence on fossil fuels. In the social dimension, Estonia also performs well, investing substantial resources in human rights, education, and public health. Its achievements in digital education and internet accessibility are especially notable, making Estonia a model digital society. In terms of governance, Estonia is known for its efficient governance structure and low levels of corruption. In 2020, Estonia ranked highly in Transparency International’s Corruption Perceptions Index, demonstrating its outstanding performance in combating corruption and promoting transparency.
Estonia’s strong performance in both economic efficiency and ESG efficiency can mainly be attributed to the following reasons:
  • Estonia’s energy industry traditionally relied on oil shale and petroleum. However, with technological progress and policy support, Estonia has gradually shifted toward cleaner energy sources such as natural gas and renewable energy. This transition allows Estonia to maintain economic growth while reducing greenhouse gas emissions.
  • Estonia has a well-developed public transportation system, and residents widely accept non-motorized transport such as cycling and walking, reducing vehicle usage and environmental pollution.
  • The government encourages businesses and citizens to reduce greenhouse gas emissions through green taxes and environmental subsidies. Estonia has also established a carbon emissions trading system to effectively reduce emissions.
  • Estonia’s economic efficiency largely depends on high-tech and information technology industries within the knowledge economy. These industries generate less pollution and help balance economic efficiency with environmental protection.
For these reasons, Estonia has achieved strong performance in both economic efficiency and ESG efficiency and has made significant progress in green economy development and sustainability.
Noted that Estonia’s widely adopted district heating (DH) system provides one of the most effective national-level opportunities to improve energy efficiency, increase renewable energy use, and reduce carbon dioxide emissions. Misztal et al. [65], in their study of sustainable energy sector development in Bulgaria, the Czech Republic, Estonia, and Poland from 2008 to 2022, argued that strengthening environmental taxes and reforming the EU Emissions Trading System are key tools for cost-effective improvements in ESG scores.
Iceland, as a small island country, demonstrates strong overall efficiency performance, which may be attributed to the following reasons:
  • Iceland’s energy supply mainly comes from renewable sources such as geothermal and hydropower, making its energy production environmentally friendly and less dependent on fossil fuels.
  • A considerable proportion of vehicles in Iceland are electric vehicles, which significantly contribute to reducing greenhouse gas emissions.
  • Iceland’s agricultural and industrial production scales are relatively small, resulting in lower environmental pollution.
  • The government actively promotes energy and environmental policies, such as establishing green funds to support and promote environmental industries and technologies, encouraging citizens and businesses to participate in emission reduction efforts.
  • Iceland performs well in gender equality, education, and public health, and it continued to advance gender equality policies in 2020, ranking among the top globally in gender equality indices.
  • Iceland has a high-quality education system, and its healthcare system demonstrated strong resilience during the pandemic.
Overall, Iceland achieves relatively high efficiency performance. However, due to its geographic location and small economic scale, its experience may not be fully applicable to other countries.
Latvia (LVA) is also a high-income European economy. According to the Index of Economic Freedom, Latvia scored 74.8, ranking 18th in the 2020 index. Latvia’s relatively high economic and ESG efficiency among OECD countries can mainly be attributed to the following reasons:
  • Latvia has shifted its energy structure from traditional coal and oil toward cleaner energy sources such as natural gas and renewables, enabling economic growth while reducing greenhouse gas emissions.
  • Latvia has strong carbon sequestration capacity in agriculture and forestry, which effectively reduces emissions.
  • The government implements green taxes and environmental subsidies and has established a carbon emissions trading system to reduce emissions.
  • Latvia actively promotes sustainable development and green economic growth, encourages environmentally friendly technologies, and maintains a well-developed public transportation system, while residents widely adopt cycling and walking, reducing pollution.
These factors enable Latvia to achieve advantages in both economic and ESG efficiency and to make notable progress in sustainable development.
Luxembourg’s economic efficiency being significantly higher than its ESG efficiency may be related to its economic structure and special conditions, including the following reasons:
  • Luxembourg is highly industrialized and service-oriented, leading to relatively high domestic greenhouse gas emissions. Although its ESG score is not low, its high GDP input suggests it should achieve even higher ESG outcomes compared to other countries; therefore, its ESG efficiency appears relatively weak.
  • Emission reduction measures are relatively insufficient, and weak implementation reduces effectiveness. For example, inadequate public transportation leads residents to rely heavily on private vehicles, increasing transportation-related emissions.
  • Luxembourg focuses more on attracting capital and business activities, and ESG regulations may be less strict or weakly enforced, allowing some firms to relax ESG standards.
  • As a small country with limited land and high population density, environmental and resource constraints limit large-scale emission reduction initiatives.
These factors collectively contribute to Luxembourg’s relatively low ESG efficiency. Improving this situation may require stricter regulations, stronger enforcement, greater corporate and investor responsibility, and broader social awareness of ESG issues. Nevertheless, with growing global concern over climate change and increasing international pressure, Luxembourg has begun strengthening its carbon reduction measures and aims to balance economic efficiency with environmental protection. The government has developed climate action plans targeting net-zero emissions by 2050 and participates in EU climate initiatives.
Liang [66] noted that although industrialized countries typically have smaller populations, they enjoy higher living standards and generally produce higher per capita cumulative greenhouse gas emissions. Luxembourg and Australia were identified as having the highest income-based per capita emissions. Wu et al. [67] further indicated that international trade contributes to economic growth but also increases emissions, with Luxembourg maintaining relatively high per capita emissions. Gavurova et al. [68] found that Ireland and Luxembourg are relatively inactive in total emission reductions and recommended that countries focus on reducing emissions for public health benefits.

4.2. Discussion

This study aims to examine whether there are countries that can simultaneously achieve economic development while maintaining strong ESG performance. Countries with relatively low levels of economic development but higher ESG scores are classified into other categories. Therefore, this study conducts clustering discussion and analysis of OECD countries based on the following three questions:
  • Which countries pursue economic efficiency but do not actively promote ESG, and are thus classified as Inactive countries?
  • Which countries achieve both economic efficiency and ESG efficiency simultaneously, representing Win–Win countries?
  • Which countries neither improve economic efficiency nor actively promote ESG, and are therefore considered Laissez-faire countries?
In statistics, quartiles are often used for research grouping purposes. For example, Foo et al. [69] analyzed the relationship between blood glucose concentration and hospitalization and conducted grouping using quartiles. Spichtig et al. [70] used quartiles to classify U.S. elementary, middle, and high school students according to reading efficiency and eye-movement measurements. Burguillo et al. [71] studied household vehicle usage behavior in Spain and grouped households by income quartiles to examine differences among groups and the impacts of transportation policies. This study applies quartile-based grouping to explore how OECD member countries balance economic efficiency and ESG scores. Methodologically, the grouping is not meant as a purely descriptive label; it is a decision rule that maps the continuous two-dimensional efficiency outcomes into a small number of policy-relevant regimes. Because Stage 1 and Stage 2 efficiencies capture different mechanisms (resource-to-income vs. income-to-ESG transformation), interpreting 38 country points one-by-one is difficult and prone to over-emphasizing small score differences. The quartile cutoffs provide a scale-free and sample-adaptive way to identify countries that are “frontier-like” in one stage but not the other, which directly answers RQ2 and enables benchmarking via “peer” sets (e.g., high Stage 1 but low Stage 2 countries can learn specifically from the Stage 2 practices of the Win–Win set).
Furthermore, Algorithm 1 (as shown below) is employed to classify countries according to the research questions. The classification results are presented in Table 5.
Algorithm 1: Group discrimination of OECD countries
Input: Stage 1 Efficiency, Stage 2 Efficiency
If Stage 1 Efficiency > third quartile(Q3) and Stage 2 Efficiency < first quartile(Q1) then
Output Inactive members
Else if Stage 1 Efficiency > third quartile(Q3) and Stage 2 Efficiency > third quartile(Q3)
  then
Output Win-Win members
Else if Stage 1 Efficiency < first quartile(Q1) and Stage 2 Efficiency < first quartile(Q1)
  then
Output Laissez-faire members
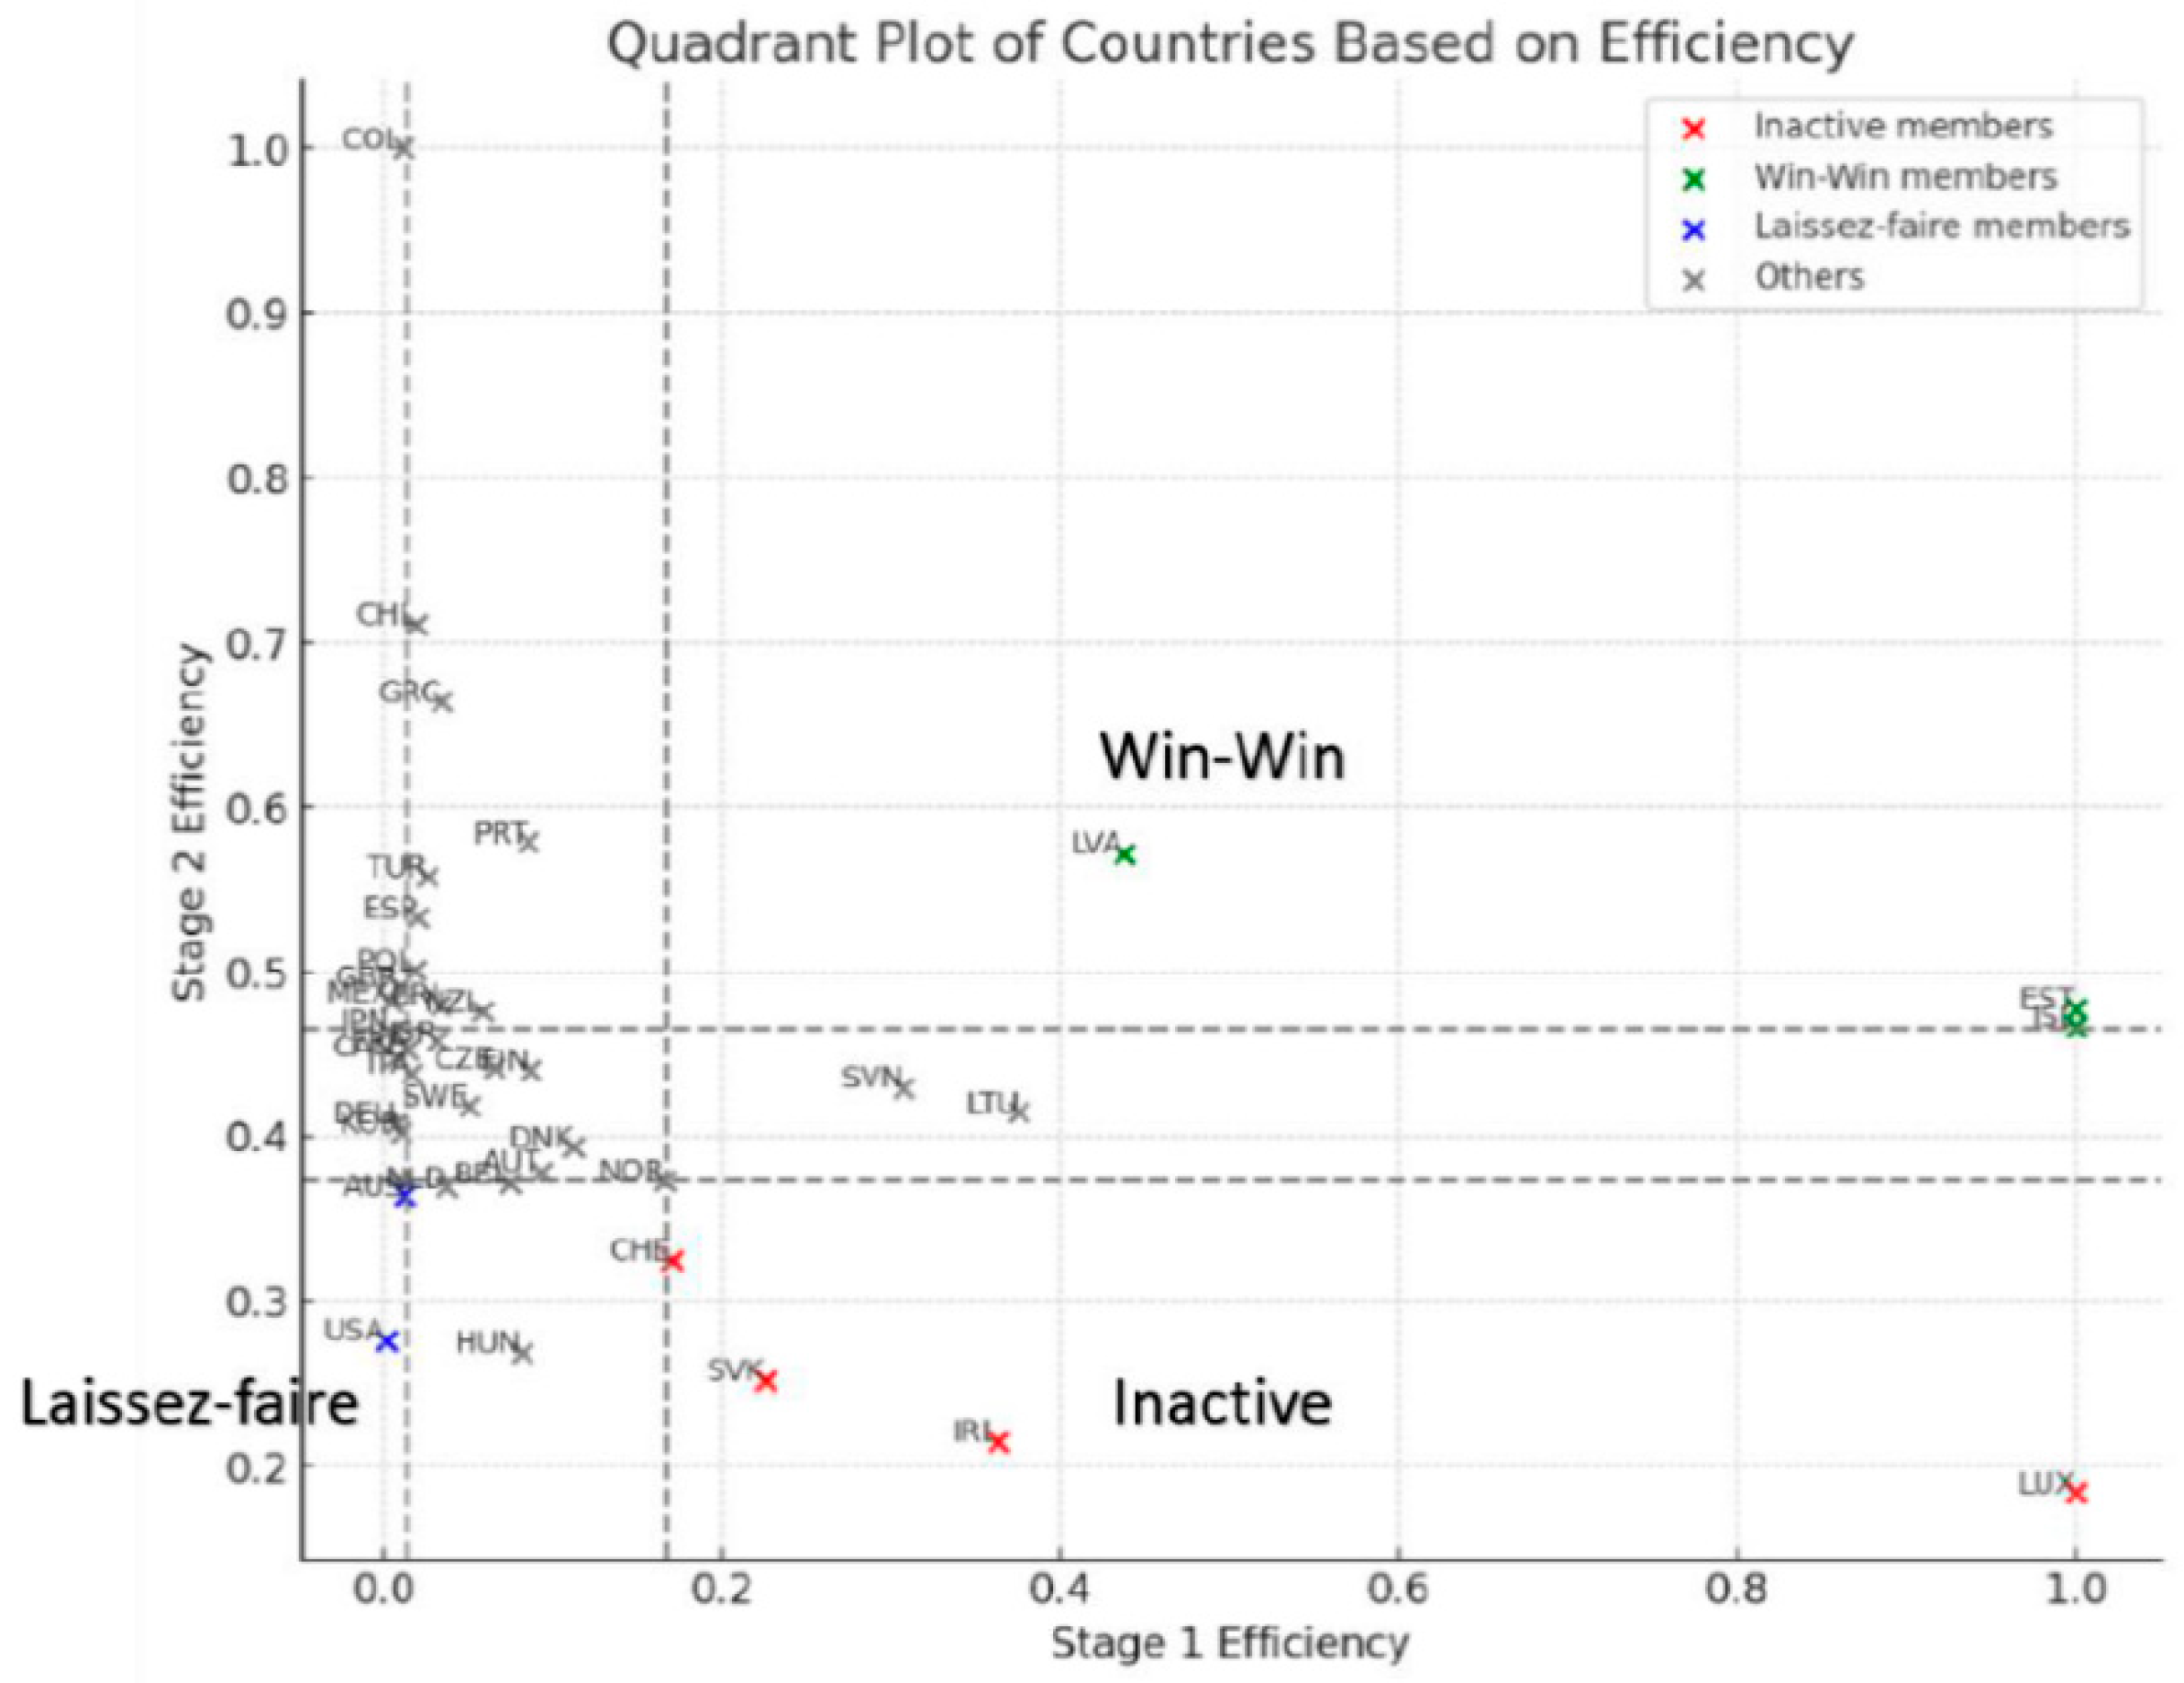
Figure 7 presents a quadrant diagram constructed based on the first stage and second-stage efficiency scores of OECD countries. Each country is positioned in different quadrants as follows:
  • Inactive countries: first-stage efficiency higher than 0.167 and second-stage efficiency lower than 0.3725.
  • Win–Win countries: first-stage efficiency higher than 0.167 and second-stage efficiency higher than 0.46425.
  • Laissez-faire countries: first-stage efficiency lower than 0.0135 and second-stage efficiency lower than 0.3725.
Each country is labeled in the figure using its corresponding abbreviation. The horizontal axis represents first-stage efficiency, while the vertical axis represents second-stage efficiency. Gray dashed lines divide the plot into different quadrant regions.

4.2.1. Win–Win Countries with Both Economic and ESG Efficiency

According to the classification results in Table 5, Estonia (EST), Iceland (ISL), and Latvia (LVA) are countries whose first stage and second stage efficiencies are both higher than the third quartile (0.167 and 0.46425).
Estonia is recognized as a pioneer of “e-government.” It promotes economic growth through digital governance and high-tech innovation. In terms of ESG, Estonia actively promotes renewable energy and reduces dependence on fossil fuels, thereby lowering carbon emissions. Socially, it invests heavily in public services such as education and healthcare to ensure a high quality of life and social security for citizens. In governance, Estonia maintains high government transparency and strict anti-corruption measures, which help build trust and a stable social environment.
Iceland is a Nordic country known for high income and high living standards. Thanks to its favorable geographical conditions, nearly all electricity consumption comes from renewable energy sources such as geothermal and hydropower. However, Clarke et al. [72] indicated that Iceland is considered a future example of high consumption and green regions, and its carbon footprint is largely embedded in global supply chains through imported products (approximately 71% of household emissions are attributed to imported goods). Even though Iceland has decarbonized its fixed energy system and is one of the few countries that have completed an energy transition, further improvements in greenhouse gas reduction efficiency are still possible. According to EU data, Iceland was also one of the earliest countries to ratify the Paris Agreement.
Latvia is one of the Baltic states and has an open market economy that has undergone significant economic transformation in recent decades. Lukjanova et al. [73] noted that Latvia’s economy is transitioning toward a sustainable development model, and one of the driving forces of national economic efficiency is the export of manufactured goods and services. Latvia achieved a renewable energy share of 41% in 2019 and plans to reach 50% by 2030, which the European Commission considers sufficiently ambitious. Brizga et al. [74] suggested that fuel consumption has the most significant impact on transportation emissions, and achieving decarbonization requires substantial reductions in fossil fuel use through measures such as higher fuel taxes, environmental infrastructure support, increased electric vehicle adoption, and social innovation. Latvia’s environmental taxes have helped reduce transportation emissions and have also had significant fiscal impacts.

4.2.2. Laissez-Faire Countries with Low Economic Efficiency and Limited ESG Promotion

According to the classification results in Table 5, the United States (USA) is the only OECD member country whose economic efficiency and ESG efficiency are both lower than the first quartile (0.0135 and 0.3725), showing low performance in both stages. Therefore, it is classified as a laissez-faire country.
From the perspective of economic efficiency, this does not necessarily mean that the country has not actively pursued economic efficiency, but rather that it may face slow or stagnant economic development. Study indicated that since early 2020, the COVID-19 outbreak has weakened Australia’s economy and capital markets, making many sectors, particularly transportation, more vulnerable. Xu et al. [75] noted that Canada’s economic growth has slowed in recent years and has only gradually recovered since hitting a low point in 2016. Maestas et al. [76] found that population aging in the United States reduces per capita GDP growth by 0.3 percentage points annually.
Regarding low ESG efficiency, Liang [66] noted that although industrialized countries generally have smaller populations than developing countries, their higher living standards lead to higher per capita cumulative greenhouse gas emissions. The United States is a well-known major carbon emitter. Davis et al. [77] reported that China, the United States, and the European Union together accounted for 49.1% of global greenhouse gas emissions in 2013. Crippa et al. [78] indicated that in 2018, China, the United States, India, the EU-28, Russia, and Japan were the largest carbon dioxide emitters and accounted for 80% of global fossil fuel consumption. Compared with 2017, U.S. emissions increased by 2.9%, while emissions in the EU and Japan declined, suggesting that the United States still needs stronger policies and measures to reduce greenhouse gas emissions.
The United States has a fragmented and inconsistent ESG policy and regulatory framework. Poor coordination between federal and state governments makes it difficult for firms to implement unified ESG standards. In addition, frequent policy changes due to political shifts increase compliance costs and uncertainty. Many U.S. firms prioritize short-term financial returns, which may weaken long-term ESG investment. Although some large corporations such as Apple and Microsoft have made notable ESG efforts, many companies still lack deep ESG commitments. Investor pressure for short-term financial performance may also reduce ESG investment. Cultural values may not fully support strong ESG measures nationwide. Although awareness of corporate social responsibility is increasing, it remains uneven. Overall, the United States faces both challenges and opportunities in ESG. With growing global ESG awareness and increasing emphasis on sustainability, U.S. companies may gradually improve their ESG performance in the future.
Although quartile cutoffs provide an intuitive rule-based typology, they are potentially sensitive to threshold choices. We therefore validate the grouping using unsupervised clustering (k-means and hierarchical clustering) and conduct threshold sensitivity checks; the main patterns remain robust (Table A3, Appendix C).

4.3. Robustness Checks and Determinants of Efficiency

This section strengthens the credibility of the DEA findings in two ways. First, it outlines robustness checks commonly expected in DEA studies. Second, it provides an empirical second-stage model that explains cross-country variation in Stage 2 (ESG transformation) efficiency.

4.3.1. Robustness Checks

Sensitivity to variable choice. We re-estimate the two-stage DEA by removing one variable at a time and compare the overall efficiency rankings with the baseline ranking using Spearman rank correlation. Overall, the results are highly stable if the core intermediate output (GDP per capita) remains at Stage 1.
  • Dropping one Stage 1 input at a time shows almost no impact on the rankings: dropping x1_population_million, x2_labor_force_million, or x4_coal_consumption_TWh_proxy yields identical rankings (Spearman = 1.000). Dropping x5_electricity_demand_TWh_proxy also has negligible impact (Spearman = 0.999).
  • Dropping the oil proxy input (x3_oil_consumption_TWh_proxy) slightly affects the frontier (Spearman = 0.978), with the Top 5 overlap equal to 4 (out of 5).
  • Dropping Trade openness from Stage 1 output remains stable overall (Spearman = 0.968; Top 5 overlap = 5).
  • In contrast, removing GDP per capita from Stage 1 outputs changes the meaning of the first-stage production step (the intermediate output becomes only “trade openness”), and the overall ranking becomes much less comparable to the baseline (Spearman = 0.608). In this scenario, the largest ranking swings include USA (rank 8 → 38), Australia (16 → 33), Japan (21 → 37), while several mid-performers move sharply upward (e.g., Poland 33 → 18; Czechia 29 → 14).
These patterns suggest that the baseline conclusions are robust to reasonable variations in input composition, but the two-stage structure is substantively anchored by GDP per capita as a key intermediate output.
Outlier influence. We test sensitivity to potential frontier-driving outliers by re-running the model after removing large or extreme countries.
  • Excluding the United States produces virtually identical rankings for the remaining 37 countries (Spearman = 1.000; the maximum rank shift is 1).
  • Excluding Luxembourg (an extreme high-income, small-country case) reduces stability (Spearman = 0.926). The largest shifts among the remaining countries include Lithuania (rank 26 → 7), Slovenia (17 → 6), and Slovakia (20 → 11).
Overall, the main qualitative interpretation (heterogeneity across OECD countries and the existence of different “economic–ESG transformation” profiles) remains intact under these outlier checks.
Statistical inference (bootstrap confidence intervals). DEA scores are deterministic conditional on the observed sample and can be sensitive to sampling variation. Following the bootstrap DEA inference tradition [79,80] and consistent with recent applied practice [81,82,83], we implement a non-parametric bootstrap to quantify uncertainty in efficiency estimates.
Specifically, we draw B = 500 bootstrap resamples (with replacement) from the 38-country OECD sample. For each resample, we re-estimate the two DEA stages and re-evaluate each country against the resampled reference set. We then construct 95% confidence intervals using the basic bootstrap method (percentile-reflection).
The resulting intervals suggest that uncertainty is meaningfully larger in Stage 1 than Stage 2, consistent with the fact that Stage 1 combines multiple resource and energy inputs with macroeconomic outputs. On average, the 95% interval width is 0.304 for Stage 1 efficiency, 0.082 for Stage 2 efficiency, and 0.272 for overall (product) efficiency. Practically, this supports focusing interpretation on (i) broad groups and (ii) clearly separated performers, rather than over-interpreting small rank differences among mid-performing countries.

4.3.2. Determinants of Stage 2 Efficiency (Second-Stage Regression)

To directly address RQ2 (the “why” question), we estimate a fractional logit model (GLM with binomial family and logit link) using Stage 2 efficiency as the dependent variable. As explanatory variables, we use country-level indicators from the World Bank: GDP per capita (PPP, constant international $), government effectiveness, and internet users (% of population). GDP per capita is log-transformed to capture diminishing marginal effects. Robust (HC3) standard errors are reported.
Model and key results (OECD):
  • Dependent variable: Stage 2_Efficiency (bounded between 0 and 1; values of 1 are treated as 0.999 for estimation).
  • Sample size: 38 countries (complete case for the selected covariates).
  • Main findings:
    -
    Ln(GDP per capita) is negatively associated with Stage 2 efficiency (coef = −1.627, p = 0.000), consistent with the idea that higher-income countries face a tougher benchmark in converting economic capacity into ESG outcomes.
    -
    Government effectiveness is positively associated with Stage 2 efficiency after controlling for income (coef = 0.649, p = 0.012), suggesting that institutional quality helps translate economic resources into ESG outcomes more effectively.
    -
    Internet users (% population) is not statistically significant in this specification (coef = −0.020, p = 0.212).
These results align with recent discussions on sovereign ESG measurement that highlight income-related effects and the importance of governance/institutions when interpreting cross-country ESG comparisons [84].
Policy interpretation. The negative income association implies that simply being wealthy does not guarantee high ESG transformation efficiency once expectations rise with capacity. Meanwhile, stronger government effectiveness can partially offset this, indicating that reforms improving policy implementation and public-sector effectiveness may be a practical lever to improve ESG outcomes relative to economic capacity.

5. Conclusions

This study employs a two-stage DEA approach to comprehensively evaluate the performance of OECD countries in terms of economic resource utilization efficiency and ESG efficiency, with the aim of identifying which countries can improve GDP while simultaneously maintaining strong ESG performance. The objectives and findings of this study are summarized as follows:
  • Some countries, such as Estonia, Iceland, and Latvia, perform well in transforming economic resources into ESG outcomes. These countries can effectively convert economic efficiency into improvements in environmental, social, and governance dimensions. In contrast, lower-efficiency countries, such as the United States, need further policy and practical improvements to enhance their ESG efficiency performance.
  • Specifically, this study finds that high-efficiency countries usually possess well-established policy frameworks, stronger corporate social responsibility cultures, and sufficient resources and capabilities to support ESG-related activities. Conversely, lower-efficiency countries may face challenges such as inconsistent policies, insufficient resources, and investor pressure.
  • Based on these findings, this study suggests that policymakers should strengthen the consistency and stability of ESG policies, while firms should increase long-term ESG investments and improve resource allocation to enhance the overall efficiency of ESG practices.
In addition, this study highlights the value of applying the DEA method to evaluate ESG efficiency at the national level. To the best of our knowledge, no similar studies have applied DEA to analyze sovereign ESG efficiency. By further applying quartile-based grouping, countries are classified into win–win, inactive, and laissez-faire categories, which helps identify which countries perform better in economic efficiency, ESG efficiency, or overall performance compared with others.
Some countries, such as Colombia, although having ESG scores like many other countries, exhibit an ESG efficiency value as high as 1. This is mainly because their GDP and trade openness levels are relatively lower than those of other countries. Under the condition of low input and high output, their efficiency value reaches 1. Since this study primarily focuses on whether countries emphasize economic development without considering ESG performance, countries with low economic development but high ESG scores are not discussed in detail.
This study provides a new direction for future research. By better understanding the relationship between economic efficiency and ESG efficiency, policymakers and investors can more effectively promote sustainable development and achieve a win–win outcome for both economic and social benefits.
In summary, improving ESG efficiency is not only crucial for achieving sustainable development but also provides stable and long-term support for economic growth. Future studies should further explore best practices in ESG implementation across different countries and industries to provide more empirical evidence and policy recommendations for global sustainable development.
We emphasize that second-stage regression is intended as an exploratory diagnostic tool to identify correlations of efficiency differences, not to establish causal effects. Governance indicators may be endogenous due to simultaneity and omitted institutional factors. Therefore, we interpret coefficient estimates as associations and rely on robustness checks (alternative specifications and lag structures) to assess stability.
  • Limitations
The limitations of this study are as follows:
  • Due to the COVID-19 pandemic, the United Nations database in recent years contains incomplete records and missing values. Therefore, the most recent and complete data available for this study is limited to 2020. If more updated and complete data become available, applying the same research procedure may yield results that better reflect current conditions.
  • Due to difficulties in collecting comprehensive data for all United Nations member states, this study only includes OECD member countries for the efficiency analysis. If complete data for all UN member states and additional years can be collected, the overall comparative analysis may lead to different efficiency results.
  • A further limitation is that national ESG outcomes may embed in income effects. Higher-income countries tend to have stronger regulatory capacity, higher-quality disclosure, and greater fiscal space for environmental and social investments, which can mechanically raise measured ESG scores. Because GDP and GDP per capita enter our model, ESG may be endogenous or at least highly correlated with income, potentially affecting second-stage interpretation. If ESG partly proxies income-related advantages, the second-stage association between ESG and efficiency may be overstated (upward bias) or become unstable due to overlapping explanatory content with GDP/GDP per capita. Therefore, our second-stage ESG coefficients should be interpreted as associations rather than causal effects.
  • Future Studies
  • The two-stage DEA efficiency analysis method enables comprehensive efficiency comparisons. If combined with other multi-criteria decision-making methods, more in-depth and integrated comparative studies could be conducted, leading to greater research contributions.
  • If continuous multi-year data for OECD member countries can be fully collected and ESG efficiency rankings can be constructed, the resulting long-term ESG efficiency trends would provide a clearer explanation of ESG performance comparisons among OECD countries.

Author Contributions

Conceptualization/Methodology/Formal analysis/Investigation/Writing—original draft, P.-Y.S.; Conceptualization/Validation/Supervision/Project administration/Resources, A.-C.H.; Software/Resources/Writing—review & editing, C.-C.C.; Supervision/Visualization/Writing—review & editing/Resources/Project administration, D.-H.S.; Writing—review & editing/Validation/Data curation/Supervision, M.-H.S. All authors have read and agreed to the published version of the manuscript.

Funding

This research received no external funding.

Data Availability Statement

The original data presented in the study are openly available in OECD Database, World bank and TheGlobalEconomy.com.

Conflicts of Interest

The authors declare no conflicts of interest.

Appendix A. Construction of the Composite ESG Score

This appendix documents the construction of the composite ESG score used as the final output in Stage 2. All indicators are sourced from the World Bank (World Development Indicators and Worldwide Governance Indicators).

Indicator List and Direction

Table A1 lists the indicators used for the Environmental (E), Social (S), and Governance (G) pillars, together with their World Bank codes and direction (higher-is-better vs. lower-is-better).
Table A1. Underlying indicators for the composite ESG score (2020).
PillarIndicator (Short Name)World Bank CodeDirectionNotes
ECO2 emissions per capitaEN.ATM.CO2E.PCLower is betterClimate pressure
ETotal greenhouse gas emissions per capitaEN.GHG.ALL.PC.CE.AR5Lower is betterBasic services
ERenewable energy consumption (% of total final energy)EG.FEC.RNEW.ZSHigher is betterEnergy transition
EForest area (% of land area)AG.LND.FRST.ZSHigher is betterNatural capital
EPM2.5 air pollution, mean annual exposureEN.ATM.PM25.MC.M3Lower is betterAir quality
SLife expectancy at birth (years)SP.DYN.LE00.INHigher is betterHealth
SSchool enrollment, secondary (% gross)SE.SEC.ENRRHigher is betterEducation access
SAccess to electricity (% of population)EG.ELC.ACCS.ZSHigher is betterBasic services
SPeople using safely managed drinking water services (% of population)SH.H2O.SMDW.ZSHigher is betterBasic services
SPeople using safely managed sanitation services (% of population)SH.STA.SMSS.ZSHigher is betterBasic services
SUnemployment, total (% of total labor force)SL.UEM.TOTL.ZSLower is betterLabor market inclusion
GGovernment effectivenessGE.ESTHigher is betterWGI
GRule of lawRL.ESTHigher is betterWGI
GControl of corruptionCC.ESTHigher is betterWGI
GRegulatory qualityRQ.ESTHigher is betterWGI
Table A2. Two-stage DEA efficiency analysis results.
OECD
Country
Overall
Efficiency
Stage 1 EfficiencyStage 2 Efficiency
EST0.73910.478
ISL0.73410.467
LUX0.59210.184
LVA0.4780.4370.572
LTU0.3850.3750.414
SVN0.3350.3070.429
IRL0.3230.3630.215
SVK0.230.2250.252
NOR0.1960.1660.373
CJE0.1920.170.325
DNK0.140.1120.393
PRT0.1230.0850.579
AUT0.1170.0930.378
FIN0.1140.0860.44
HUN0.0950.0810.269
BEL0.0950.0740.371
CZE0.0880.0650.441
NZL0.0810.0580.476
SWE0.0680.050.418
GRC0.0550.0340.664
NLD0.0490.0370.369
CRI0.0470.0330.48
ISR0.0440.0310.458
TUR0.0370.0250.558
CHL0.0320.0190.711
ESP0.030.020.533
POL0.0260.0180.501
ITA0.0230.0160.438
COL0.0230.0111
FRA0.020.0140.452
AUS0.0160.0120.364
KOR0.0140.010.402
GBR0.0130.0090.491
CAN0.0090.0070.448
DEU0.0090.0070.408
MEX0.0060.0040.482
JPN0.0040.0030.464
USA0.0010.0010.276
AVG.0.1470.1590.447

Appendix B. Robustness Check: PCA-Based ESG Weighting

To address the concern that the composite ESG score constructed using min–max normalization and equal weights may be overly simplistic, we perform a robustness check using a data-driven weighting scheme based on principal component analysis (PCA). Specifically, we standardize the three ESG pillars (E, S, and G) and extract the first principal component (PC1). The absolute PC1 loadings are normalized to sum to one and used as alternative pillar weights. The resulting PCA-based weights are highly balanced: (wE = 0.3329), (wS = 0.3357), and (wG = 0.3314). We then re-compute the composite ESG score using these PCA weights (after pillar-wise min–max normalization for comparability with the baseline). Results show perfect consistency between the equal-weight and PCA-weight composites: the country ranking is identical across the two schemes (Spearman’s rank correlation (\rho = 1.000); maximum rank change = 0). This indicates that our results are not sensitive to the equal-weight aggregation assumption for ESG.
The PCA-weighted composite therefore provides empirical support that the equal-weight index is not distorting cross-country comparisons in our sample.

Appendix C

Table A3. OECD country clustering results.
GroupNMembers (ISO3)Mean Stage 1 EfficiencyMean Stage 2 EfficiencyStage 1 RangeStage 2 Range
Group 1: 1USA0.0010.2760.001–0.0010.276–0.276
Group 2: 1LUX1.0000.1841.000–1.0000.184–0.184
Group 3: 3EST, ISL, LVA0.8120.5060.437–1.0000.467–0.572
Group 4: 3CHL, COL, GRC0.0210.7920.011–0.0340.664–1.000
Group 5: 26AUS, AUT, BEL, CAN, CRI, CZE, DEU, DNK, ESP, FIN, FRA, GBR, ISR, ITA, JPN, KOR, LTU, MEX, NLD, NOR, NZL, POL, PRT, SVN, SWE, TUR0.0660.4450.003–0.3750.364–0.579
Group 6: 4CJE, HUN, IRL, SVK0.2100.2650.081–0.3630.215–0.325

References

  1. Serafeim, G. Public sentiment and the price of corporate sustainability. Financ. Anal. J. 2020, 76, 26–46. [Google Scholar] [CrossRef] [Scilit]
  2. Eccles, R.G.; Ioannou, I.; Serafeim, G. The impact of corporate sustainability on organizational processes and performance. Manag. Sci. 2014, 60, 2835–2857. [Google Scholar] [CrossRef] [Scilit]
  3. Kaufmann, D.; Kraay, A.; Mastruzzi, M. The Worldwide Governance Indicators: Methodology and Analytical Issues; Policy Research Working Paper No. 5430; World Bank: Washington, DC, USA, 2010. [Google Scholar]
  4. OECD. OECD Environmental Performance Reviews (Series); OECD Publishing: Paris, France, Various years; Available online: https://www.oecd.org/en/publications/oecd-environmental-performance-reviews_19900090.html (accessed on 10 October 2025).
  5. Banker, R.D.; Charnes, A.; Cooper, W.W. Some models for estimating technical and scale inefficiencies in data envelopment analysis. Manag. Sci. 1984, 30, 1078–1092. [Google Scholar] [CrossRef] [Scilit]
  6. Cooper, W.W.; Seiford, L.M.; Tone, K. Data Envelopment Analysis: A Comprehensive Text with Models, Applications, References and DEA-Solver Software, 2nd ed.; Springer: New York, NY, USA, 2007. [Google Scholar]
  7. Kuznets, S. Economic growth and income inequality. Am. Econ. Rev. 1955, 45, 1–28. [Google Scholar]
  8. King, R.G.; Levine, R. Finance and growth: Schumpeter might be right. Q. J. Econ. 1993, 108, 717–737. [Google Scholar] [CrossRef] [Scilit]
  9. Rodrik, D. Institutions for high-quality growth: What they are and how to acquire them. Stud. Comp. Int. Dev. 2000, 35, 3–31. [Google Scholar] [CrossRef] [Scilit]
  10. Sexton, T.R.; Lewis, H.F. Two-stage DEA: An application to major league baseball. J. Product. Anal. 2003, 19, 227–249. [Google Scholar] [CrossRef] [Scilit]
  11. Färe, R.; Grosskopf, S. Network DEA. In Modeling Data Irregularities and Structural Complexities in Data Envelopment Analysis; Springer: New York, NY, USA, 2007. [Google Scholar]
  12. Berg, B.; Koelbel, J.; Rigobon, R. Aggregate Confusion: The Divergence of ESG Ratings; MIT Sloan School Working Paper; SSRN (Social Science Research Network): Rochester, NY, USA, 2019. [Google Scholar]
  13. Dimson, A.; Karakaş, O.; Li, X. Active ownership. Rev. Financ. Stud. 2015, 28, 3225–3268. [Google Scholar] [CrossRef] [Scilit]
  14. Jolliffe, I.T. Principal Component Analysis, 2nd ed.; Springer: New York, NY, USA, 2002. [Google Scholar]
  15. Nardo, A.; Saisana, M.; Saltelli, A.; Tarantola, S. Handbook on Constructing Composite Indicators: Methodology and User Guide; OECD/JRC: Paris, France, 2008. [Google Scholar]
  16. Ray, S.C. Data Envelopment Analysis: Theory and Techniques for Economics and Operations Research; Cambridge University Press: Cambridge, UK, 2004. [Google Scholar]
  17. Färe, R.; Grosskopf, S.; Lovell, C.A.K. Production Frontiers; Cambridge University Press: Cambridge, UK, 1994. [Google Scholar]
  18. Simar, J.W.; Wilson, P.W. Estimation and inference in two-stage, semi-parametric models of production processes. J. Econom. 2007, 136, 31–64. [Google Scholar] [CrossRef] [Scilit]
  19. Zelenyuk, V.; Zheka, V. Corporate governance and firm’s efficiency: The case of a transitional country. J. Product. Anal. 2006, 25, 143–157. [Google Scholar] [CrossRef] [Scilit]
  20. Tone, K.; Tsutsui, M. Network DEA: A slacks-based measure approach. Eur. J. Oper. Res. 2009, 197, 243–252. [Google Scholar] [CrossRef] [Scilit]
  21. Peter, C.; Helming, K.; Nendel, C. Do greenhouse gas emission calculations from energy crop cultivation reflect actual agricultural management practices?—A review of carbon footprint calculators. Renew. Sustain. Energy Rev. 2017, 67, 461–476. [Google Scholar] [CrossRef] [Scilit]
  22. Leogrande, A.; Costantiello, A. The Role of GDP Growth in the ESG Approach at World Level. 2023. Available online: https://ssrn.com/abstract=4434206 (accessed on 10 March 2025).
  23. Krappel, T.; Bogun, A.; Borth, D. Heterogeneous Ensemble for ESG Ratings Prediction. arXiv 2021, arXiv:2109.10085. [Google Scholar] [CrossRef] [Scilit]
  24. Citterio, A.; King, T. The role of Environmental, Social, and Governance (ESG) in predicting bank financial distress. Financ. Res. Lett. 2023, 51, 103411. [Google Scholar] [CrossRef] [Scilit]
  25. Tarmuji, I.; Maelah, R.; Tarmuji, N.H. The Impact of Environmental, Social and Governance Practices (ESG) on Economic Performance: Evidence from ESG Score. Int. J. Trade Econ. Financ. 2016, 7, 67–74. [Google Scholar] [CrossRef] [Scilit]
  26. Cek, K.; Eyupoglu, S. Does environmental, social and governance performance influence economic performance? J. Bus. Econ. Manag. 2020, 21, 1165–1184. [Google Scholar] [CrossRef] [Scilit]
  27. Halbritter, G.; Dorfleitner, G. The wages of social responsibility—Where are they? A critical review of ESG investing. Rev. Financ. Econ. 2015, 26, 25–35. [Google Scholar] [CrossRef] [Scilit]
  28. Qureshi, M.A.; Akbar, M.; Akbar, A.; Poulova, P. Do ESG endeavors assist firms in achieving superior financial performance? A case of 100 best corporate citizens. Sage Open 2021, 11, 21582440211021598. [Google Scholar] [CrossRef] [Scilit]
  29. Jiang, P.C.; Feng, G.F.; Yang, H.C. New measurement of sovereign ESG index. Innov. Green Dev. 2022, 1, 100009. [Google Scholar] [CrossRef] [Scilit]
  30. Cheng, L.T.; Lee, S.K.; Li, S.K.; Tsang, C.K. Understanding resource deployment efficiency for ESG and financial performance: A DEA approach. Res. Int. Bus. Financ. 2023, 65, 101941. [Google Scholar] [CrossRef] [Scilit]
  31. Pham, T.N.; Tran, P.P.; Le, M.H.; Vo, H.N.; Pham, C.D.; Nguyen, H.D. The effects of ESG combined score on business performance of enterprises in the transportation industry. Sustainability 2022, 14, 8354. [Google Scholar] [CrossRef] [Scilit]
  32. Charnes, A.; Cooper, W.W.; Rhodes, E. Measuring the efficiency of decision making units. Eur. J. Oper. Res. 1978, 2, 429–444. [Google Scholar] [CrossRef] [Scilit]
  33. Charnes, A.; Cooper, W.W. The non-Archimedean CCR ratio for efficiency analysis: A rejoinder to Boyd and Fare. Eur. J. Oper. Res. 1984, 15, 333–334. [Google Scholar] [CrossRef] [Scilit]
  34. Kaffash, S.; Azizi, R.; Huang, Y.; Zhu, J. A survey of data envelopment analysis applications in the insurance industry 1993–2018. Eur. J. Oper. Res. 2020, 284, 801–813. [Google Scholar] [CrossRef] [Scilit]
  35. Sarraf, F.; Nejad, S.H. Improving performance evaluation based on balanced scorecard with grey relational analysis and data envelopment analysis approaches: Case study in water and wastewater companies. Eval. Program Plan. 2020, 79, 101762. [Google Scholar] [CrossRef] [Scilit] [PubMed]
  36. Zhu, N.; Zhu, C.; Emrouznejad, A. A combined machine learning algorithms and DEA method for measuring and predicting the efficiency of Chinese manufacturing listed companies. J. Manag. Sci. Eng. 2021, 6, 435–448. [Google Scholar] [CrossRef] [Scilit]
  37. Nong, N.M.T. An application of delphi and dea to performance efficiency assessment of retail stores in fashion industry. Asian J. Shipp. Logist. 2022, 38, 135–142. [Google Scholar] [CrossRef] [Scilit]
  38. Mahmoudi, R.; Emrouznejad, A.; Shetab-Boushehri, S.N.; Hejazi, S.R. The origins, development and future directions of data envelopment analysis approach in transportation systems. Socio-Econ. Plan. Sci. 2020, 69, 100672. [Google Scholar] [CrossRef] [Scilit]
  39. Forouzandeh, F.; Arman, H.; Hadi-Vencheh, A.; Rahimi, A.M. A combination of DEA and AIMSUN to manage big data when evaluating the performance of bus lines. Inf. Sci. 2022, 618, 72–86. [Google Scholar] [CrossRef] [Scilit]
  40. Luo, Q.; Miao, C.; Sun, L.; Meng, X.; Duan, M. Efficiency evaluation of green technology innovation of China’s strategic emerging industries: An empirical analysis based on Malmquist-data envelopment analysis index. J. Clean. Prod. 2019, 238, 117782. [Google Scholar] [CrossRef] [Scilit]
  41. Zhou, X.; Caldecott, B.; Harnett, E.; Schumacher, K. The Effect of Firm-Level ESG Practices on Macroeconomic Performance; Working Paper No. 20-03; University of Oxford: Oxford, UK, 2020. [Google Scholar]
  42. Iqbal, W.; Altalbe, A.; Fatima, A.; Ali, A.; Hou, Y. A DEA approach for assessing the energy, environmental and economic performance of top 20 industrial countries. Processes 2019, 7, 902. [Google Scholar] [CrossRef] [Scilit]
  43. Wang, Q.; Zhang, F. The effects of trade openness on decoupling carbon emissions from economic growth–evidence from 182 countries. J. Clean. Prod. 2021, 279, 123838. [Google Scholar] [CrossRef] [Scilit]
  44. Moutinho, V.; Madaleno, M. A two-stage DEA model to evaluate the technical eco-efficiency indicator in the EU countries. Int. J. Environ. Res. Public Health 2021, 18, 3038. [Google Scholar] [CrossRef] [Scilit]
  45. Flegl, M.; Gress, E.S.H. A two-stage Data Envelopment Analysis model for investigating the efficiency of the public security in Mexico. Decis. Anal. J. 2023, 6, 100181. [Google Scholar] [CrossRef] [Scilit]
  46. Chen, F.; Lyu, J.; Wang, T. Benchmarking road safety development across OECD countries: An empirical analysis for a decade. Accid. Anal. Prev. 2020, 147, 105752. [Google Scholar] [CrossRef] [Scilit] [PubMed]
  47. Wang, D.; Du, Z.; Wu, H. Ranking global cities based on economic performance and climate change mitigation. Sustain. Cities Soc. 2020, 62, 102395. [Google Scholar] [CrossRef] [Scilit]
  48. Rebolledo-Leiva, R.; Angulo-Meza, L.; Iriarte, A.; González-Araya, M.C. Joint carbon footprint assessment and data envelopment analysis for the reduction of greenhouse gas emissions in agriculture production. Sci. Total Environ. 2017, 593, 36–46. [Google Scholar] [CrossRef] [Scilit]
  49. Diaye, M.A.; Ho, S.H.; Oueghlissi, R. ESG performance and economic growth: A panel co-integration analysis. Empirica 2022, 49, 99–122. [Google Scholar] [CrossRef] [Scilit]
  50. Kao, C.; Hwang, S.N. Efficiency decomposition in two-stage data envelopment analysis: An application to non-life insurance companies in Taiwan. Eur. J. Oper. Res. 2008, 185, 418–429. [Google Scholar] [CrossRef] [Scilit]
  51. Krausmann, F.; Gingrich, S.; Eisenmenger, N.; Erb, K.H.; Haberl, H.; Fischer-Kowalski, M. Growth in global materials use, GDP and population during the 20th century. Ecol. Econ. 2009, 68, 2696–2705. [Google Scholar] [CrossRef] [Scilit]
  52. Kitov, I.O. GDP growth rate and population. arXiv 2008, arXiv:0811.2125. [Google Scholar] [CrossRef] [Scilit]
  53. Mohsen, A.S. The relationship between trade openness and investment in Syria. J. Life Econ. 2015, 2, 19–28. [Google Scholar] [CrossRef] [Scilit]
  54. Bryant, J.; Jacobsen, V.; Bell, M.; Garrett, D. Labour Force Participation and GDP in New Zealand (No. 04/07); New Zealand Treasury Working Paper; New Zealand Treasury: Wellington, New Zealand, 2004.
  55. Majid, N. What Is the Effect of Trade Openness on Wages? International Labour Office: Geneva, Switzerland, 2004; Volume 18. [Google Scholar]
  56. Madanizadeh, S.A.; Pilvar, H. The impact of trade openness on labour force participation rate. Appl. Econ. 2019, 51, 2654–2668. [Google Scholar] [CrossRef] [Scilit]
  57. Campo, J.; Sarmiento, V. The relationship between energy consumption and GDP: Evidence from a panel of 10 Latin American countries. Lat. Am. J. Econ. 2013, 50, 233–255. [Google Scholar] [CrossRef] [Scilit]
  58. Nayan, S.; Kadir, N.; Ahmad, M.; Abdullah, M.S. Revisiting energy consumption and GDP: Evidence from dynamic panel data analysis. Procedia Econ. Financ. 2013, 7, 42–47. [Google Scholar] [CrossRef] [Scilit]
  59. Odhiambo, N.M. Trade openness and energy consumption in sub-Saharan African countries: A multivariate panel Granger causality test. Energy Rep. 2021, 7, 7082–7089. [Google Scholar] [CrossRef] [Scilit]
  60. Osei-Assibey Bonsu, M.; Wang, Y. The triangular relationship between energy consumption, trade openness and economic growth: New empirical evidence. Cogent Econ. Financ. 2022, 10, 2140520. [Google Scholar] [CrossRef] [Scilit]
  61. Qi, M.; Xi, J.; Ali, N.B.; Wang, S.; Xiong, F. The Nexus among Energy Consumption, Economic Growth and Trade Openness: Evidence from West Africa. Sustainability 2022, 14, 3630. [Google Scholar] [CrossRef] [Scilit]
  62. Prima, N.; Akbar, I. Beyond sustainability: Empirical evidence from OECD countries on the connection among natural resources, ESG performances, and economic development. Econ. Sociol. 2021, 14, 89–106. [Google Scholar] [CrossRef] [Scilit]
  63. Daud, S.N.M.; Ghazali, N.S.; Ismail, N.H.M. ESG, innovation, and economic growth: An empirical evidence. Stud. Econ. Financ. 2024, 41, 845–870. [Google Scholar] [CrossRef] [Scilit]
  64. Vargas-Santander, K.G.; Álvarez-Diez, S.; Baixauli-Soler, S.; Belda-Ruiz, M. Developing a country’s sustainability indicator: An analysis of the effect on trade openness. Environ. Sustain. Indic. 2023, 19, 100280. [Google Scholar] [CrossRef] [Scilit]
  65. Misztal, A.; Kowalska, M.; Fajczak-Kowalska, A. The impact of economic factors on the sustainable development of energy enterprises: The case of Bulgaria, Czechia, Estonia and Poland. Energies 2022, 15, 6842. [Google Scholar] [CrossRef] [Scilit]
  66. Liang, S.; Qu, S.; Zhu, Z.; Guan, D.; Xu, M. Income-based greenhouse gas emissions of nations. Environ. Sci. Technol. 2017, 51, 346–355. [Google Scholar] [CrossRef] [Scilit] [PubMed]
  67. Wu, Z.; Yang, L.; Chen, Q.; Ye, Q. The impacts of international trade on global greenhouse gas emissions: A thought experiment based on a novel no-trade analysis. J. Environ. Manag. 2021, 300, 113836. [Google Scholar] [CrossRef] [Scilit]
  68. Gavurova, B.; Rigelsky, M.; Ivankova, V. Greenhouse gas emissions and health in the countries of the European Union. Front. Public Health 2021, 9, 756652. [Google Scholar] [CrossRef] [Scilit]
  69. Foo, K.; Cooper, J.; Deaner, A.; Knight, C.; Suliman, A.; Ranjadayalan, K.; Timmis, A.D. A single serum glucose measurement predicts adverse outcomes across the whole range of acute coronary syndromes. BMJ J. Heart 2003, 89, 512–516. [Google Scholar] [CrossRef] [Scilit]
  70. Spichtig, A.N.; Pascoe, J.P.; Ferrara, J.D.; Vorstius, C. A comparison of eye movement measures across reading efficiency quartile groups in elementary, middle, and high school students in the US. J. Eye Mov. Res. 2017, 10, 24. [Google Scholar] [CrossRef] [Scilit]
  71. Burguillo, M.; del Río, P.; Jordán, D.R. Car use behaviour of Spanish households: Differences for quartile income groups and transport policy implications. Case Stud. Transp. Policy 2017, 5, 150–158. [Google Scholar] [CrossRef] [Scilit]
  72. Clarke, J.; Heinonen, J.; Ottelin, J. Emissions in a decarbonized economy? Global lessons from a carbon footprint analysis of Iceland. J. Clean. Prod. 2017, 166, 1175–1186. [Google Scholar] [CrossRef] [Scilit]
  73. Lukjanova, J.; Sushchenko, O.; Zyma, O. Educated and competent staff as important factor of innovation development of machine-building and metalworking industry in Latvia. In MATEC Web of Conferences; EDP Sciences: Les Ulis, France, 2019; Volume 297, p. 06006. [Google Scholar]
  74. Brizga, J.; Jurušs, M.; Šmite-Roķe, B. Impact of the environmental taxes on reduction of emission from transport in Latvia. Post-Communist Econ. 2022, 34, 666–683. [Google Scholar] [CrossRef] [Scilit]
  75. Xu, X.; Wei, Z.; Ji, Q.; Wang, C.; Gao, G. Global renewable energy development: Influencing factors, trend predictions and countermeasures. Resour. Policy 2019, 63, 101470. [Google Scholar] [CrossRef] [Scilit]
  76. Maestas, N.; Mullen, K.J.; Powell, D. The effect of population aging on economic growth, the labor force, and productivity. Am. Econ. J. Macroecon. 2023, 15, 306–332. [Google Scholar] [CrossRef] [Scilit]
  77. Davis, M.; Ahiduzzaman, M.; Kumar, A. How will Canada’s greenhouse gas emissions change by 2050? A disaggregated analysis of past and future greenhouse gas emissions using bottom-up energy modelling and Sankey diagrams. Appl. Energy 2018, 220, 754–786. [Google Scholar] [CrossRef] [Scilit]
  78. Crippa, M.; Oreggioni, G.; Guizzardi, D.; Muntean, M.; Schaaf, E.; Lo Vullo, E.; Vignati, E. Fossil CO2 and GHG Emissions of All World Countries; Publication Office of the European Union: Luxemburg, 2019; pp. 1–251. [Google Scholar]
  79. Simar, L.; Wilson, P.W. Sensitivity analysis of efficiency scores: How to bootstrap in nonparametric frontier models. Manag. Sci. 1998, 44, 49–61. [Google Scholar] [CrossRef] [Scilit]
  80. Simar, L.; Wilson, P.W. A general methodology for bootstrapping in non-parametric frontier models. J. Appl. Stat. 2000, 27, 779–802. [Google Scholar] [CrossRef] [Scilit]
  81. Flokou, A.; Aletras, V.H.; Miltiadis, C.; Karaferis, D.C.; Niakas, D.A. Approach in inputs & outputs selection of Data Envelopment Analysis (DEA) efficiency measurement in hospitals: A systematic review. PLoS ONE 2024, 19, e0293694. [Google Scholar]
  82. Sanz-Torro, V.; Calafat-Marzal, C.; Guaita-Martinez, J.M.; Marti, L. An integrated approach to resource efficiency, green markets and support measures in SMEs. Int. Entrep. Manag. J. 2025, 21, 84. [Google Scholar] [CrossRef] [Scilit]
  83. Arabmaldar, A.; Hatami-Marbini, A. Robust data envelopment analysis models for efficiency evaluation with new uncertainty sets. OR Spectr. 2026, 48, 1–42. [Google Scholar] [CrossRef] [Scilit]
  84. Gratcheva, E.; Gurhy, B. Sovereign Environmental, Social, and Governance (ESG) Investing: Chasing Elusive Sustainability; Departmental Paper No. 2024/102; International Monetary Fund: Washington, DC, USA, 2024. [Google Scholar] [CrossRef] [Scilit]
Figure 1. Research Process.
Mathematics 14 01042 g001
Figure 2. ESG investment.
Mathematics 14 01042 g002
Figure 3. Our proposed two stage DEA model.
Mathematics 14 01042 g003
Figure 4. Efficiency Analysis Framework.
Mathematics 14 01042 g004
Figure 5. Research Dimensions of the Two-Stage DEA Model.
Mathematics 14 01042 g005
Figure 6. Framework of the Two-Stage DEA Model.
Mathematics 14 01042 g006
Figure 7. Quartile-Based Clustering Diagram.
Mathematics 14 01042 g007
Table 1. Studies Related to ESG and Economic Efficiency.
CategoryAuthorsApproachesFindings
PredictionTim et al. [23]EnsembleMore accurate ESG rating forecasts
ReviewAlberto & King [24]Regression analysisCertain ESG components are significantly associated with banks
Tarmuji et al. [25]ESG scoreA significant positive relationship between ESG scores
Kemal and Eyupoglu [26]ESG ratingsESG efficiency significantly improves firms’ economic performance
Gerhard and Dorfleitner [27]ESG investmentHigh-ESG firms outperform in some markets
Case StudyQureshi et al. [28]ESG initiatives on the financeFirms actively engaged in ESG activities generally achieve superior
Jiang et al. [29]A novel sovereign ESG indexThe new index facilitates better comparison of national ESG
Data Envelopment Analysis (DEA)Cheng et al. [30]Resource allocation Efficient resource allocation is crucial
Pham et al. [31]Composite ESG scoresHigher ESG scores are significantly and positively associated with better firm performance
Table 2. Studies Related to Data Envelopment Analysis.
FieldTopicAuthors
Greenhouse Gas EmissionsEnvironmental efficiency evaluationIqbal et al. [42]
Wang et al. [43]
Ecological efficiency evaluationMoutinho & Madaleno [44]
Corporate Efficiency AnalysisReview of insurance company efficiencyKaffash et al. [34]
Efficiency assessment of manufacturing firmsZhu et al. [36]
Efficiency evaluation of fashion companiesNong [37]
TransportationReview of transportation system efficiencyMahmoudi [38]
Bus route efficiency evaluationForouzandeh et al. [39]
Port efficiency evaluationNong [37]
StrategyGreen technology innovation efficiency evaluationLuo et al. [40]
Public safety efficiency evaluationFlegl & Gress [45]
ESGImpact of firm-level ESG practices on macroeconomic performanceZhou et al. [41]
Effect of ESG on firm performance in the transportation industryPham et al. [31]
ESG and financial efficiency evaluationCheng et al. [30]
Table 3. Selected variables.
Variable CategoryVariableSourceLiterature
Inputx1: PopulationOECD DatabaseIqbal et al. [42]; Chen et al. [46]; Wang et al. [47]
x2: Labor ForceOECD DatabaseMoutinho & Madaleno [44]
x3: Gasoline ConsumptionTheGlobalEconomy.comRebolledo-Leiva et al. [48]
x4: Coal ConsumptionTheGlobalEconomy.comIqbal et al. [42]; Wang et al. [47]; Moutinho & Madaleno [44]
x5: Electricity ConsumptionTheGlobalEconomy.comIqbal et al. [42]; Wang et al. [47]; Moutinho & Madaleno [44]
Intermediatez1: Gross Domestic Product (GDP)OECD DatabaseIqbal et al. [42]; Wang et al. [47]; Wang et al. [43]; Moutinho & Madaleno [44]
z2: Trade OpennessTheGlobalEconomy.comIqbal et al. [42]
Outputy1: ESG (Environmental, Social, and Governance)World BankDiaye et al. [49]; Cheng et al. [30]; Leogrande & Costantiello [22]
Table 4. Descriptive Statistics of Input and Output Variables.
VariableMinMaxMeanSDVarUnit
Population0.366331.50136.09859.7283567.411million persons
Labor Force0.206160.74217.28428.835831.463million persons
Gasoline Consumption2.378049.22341.9681298.851687billion liters
Coal Consumption3.82477,39540,465.10788,906.5017,904,365,979.017100 million tons
Electricity Consumption6.213897.89271.5039635.129403,388.538T Wh/year
GDP15,650.442119,871.42946,951.52819,687.657387,603,847.737PPP
Trade Openness23.2637398.37864.954218.451(Export + Importsrts)/GDP
ESG Score56.666786.666772.28078.4471.2344score (0–100)
Table 5. Classification Results of OECD Member Countries.
Inactive Members
OECDOverall EffStage 1 EffStage 2 Eff
LUX0.59210.184
Win-Win Members
OECDOverall EffStage 1 EffStage 2 Eff
EST0.6191.0000.478
ISL0.5421.0000.467
LVA0.4780.4370.572
Laissez-Faire Members
OECDOverall EffStage 1 EffStage 2 Eff
USA0.0010.0010.276
Disclaimer/Publisher’s Note: The statements, opinions and data contained in all publications are solely those of the individual author(s) and contributor(s) and not of MDPI and/or the editor(s). MDPI and/or the editor(s) disclaim responsibility for any injury to people or property resulting from any ideas, methods, instructions or products referred to in the content.