Article

D-SFANet: Application of a Multimodal Fusion Framework Based on Attention Mechanisms in ADHD Identification and Classification

1
School of Data and Computer Science, Shandong Women’s University, Jinan 250303, China
2
School of Computer Science, Qilu University of Technology, Jinan 250303, China
*
Author to whom correspondence should be addressed.
Mathematics 2026, 14(5), 851; https://doi.org/10.3390/math14050851
Submission received: 8 January 2026 / Revised: 3 February 2026 / Accepted: 27 February 2026 / Published: 2 March 2026

Abstract

The diagnosis of attention-deficit/hyperactivity disorder (ADHD) has long relied on subjective scales, lacking objective neuroimaging biomarkers. Static functional connectivity (sFC) and dynamic functional connectivity (dFC), as commonly used metrics in resting-state functional magnetic resonance imaging (rs-fMRI) analysis, provide important perspectives for related research. However, existing unimodal approaches struggle to effectively integrate the spatiotemporal characteristics of functional connectivity. To address this, this paper proposes the multimodal fusion framework D-SFANet, which synergistically models the static and dynamic features of brain functional connectivity through an attention mechanism: in the static path, it integrates a multi-scale convolutional network with phenotypic information extraction to extract hierarchical topological features; in the dynamic path, it combines graph theory with a bidirectional long short-term memory network (BiLSTM) to capture key state transition patterns in brain networks. Experimental validation demonstrates that D-SFANet achieves significantly higher classification accuracy than existing mainstream methods, robustly validating the effectiveness of its spatiotemporal fusion strategy.

1. Introduction

Attention-deficit/hyperactivity disorder (ADHD) is a typical neurodevelopmental disorder whose core symptoms are closely associated with abnormalities in brain functional networks [1]. Resting-state functional magnetic resonance imaging (rs-fMRI) measures oxygen-dependent blood signals (BOLD) to capture functional coupling characteristics between brain regions [2]. Based on fMRI data, researchers can quantify functional connectivity (FC) by calculating the statistical correlation (e.g., Pearson correlation coefficient) between the time series of the BOLD signal from different regions of the brain, thus characterizing collaborative neural activity patterns between regions of the brain [3]. Static functional connectivity (sFC) is constructed based on an entire resting-state functional magnetic resonance imaging (rs-fMRI) scan (approximately 5 min), while dynamic functional connectivity (dFC) is analyzed over a shorter time period. Due to the different time scales employed, these two connectivity measures provide complementary information: sFC reflects relatively stable functional connectivity patterns throughout the entire scan, while dFC captures dynamic fluctuations in functional connectivity at the second-to-minute level. Representing the brain as both the sFC and the dFC networks helps to provide a more comprehensive and multi-faceted understanding of the functional mechanisms of the brain and their changes in disease [4].
Current research primarily uses sFC to construct classification models, i.e., by calculating the Pearson correlation coefficient of the BOLD signal time series between brain regions throughout the entire scanning period to construct a stable connectivity matrix. However, sFC implicitly assumes that brain networks remain constant during the scanning period, and this inherent limitation makes it difficult to capture the dynamic functional reorganization characteristics closely associated with ADHD [5]. In contrast, dFC analyzes the temporal evolution of brain networks using a sliding-window method, offering a new perspective for studying the dynamic pathological mechanisms of ADHD [6,7]. However, existing dFC analysis methods face a critical challenge: short time windows (<60 s) improve temporal resolution but are prone to noise interference, leading to feature distortion, while long time windows (>90 s) improve feature stability but blur transient yet critical brain state transitions [8,9,10]. It should be noted that sFC and dFC carry the spatial stability and temporal dynamic characteristics of brain networks, respectively, and that the two are complementary, providing new insights to improve the classification performance of ADHD [11]. Therefore, how to effectively integrate static and dynamic dual-modal features to construct a diagnosis model with spatiotemporal sensitivity has become a key issue in current research.
While prior studies have explored static functional connectivity (sFC) modeling using convolutional neural networks, dynamic functional connectivity (dFC) analysis based on sliding-window strategies, graph-theoretic descriptors, and temporal modeling with recurrent networks (e.g., LSTM or BiLSTM), these components are typically investigated in isolation or combined in a loosely coupled manner. In particular, most existing multimodal approaches either process sFC and dFC independently or rely on simple feature concatenation or late fusion strategies, which fail to explicitly capture the mutual dependency and complementary interactions between static and dynamic brain connectivity representations.
The primary novelty of this work lies in the proposed D-SFANet framework, which introduces an attention-guided fusion mechanism to model the interaction between sFC-derived and dFC-derived features. Specifically, static functional connectivity representations are first projected into a shared embedding space and subsequently used to attend to dynamic functional connectivity features, enabling static-to-dynamic feature guidance during the fusion process. This design allows the model to adaptively emphasize dynamic connectivity patterns that are most relevant to the global structural characteristics encoded by static connectivity, thereby achieving heterogeneous and adaptive integration across temporal scales without relying on a fixed or heuristic fusion scheme.
As a secondary contribution, we incorporate phenotypic information into the feature learning process through a phenotype-aware modulation mechanism, which adaptively adjusts connectivity representations across subjects. This design enhances the robustness and generalization ability of the model under heterogeneous clinical characteristics and data acquisition conditions.
The effectiveness and necessity of each proposed component are systematically validated through targeted ablation studies on fusion strategies and phenotypic integration, as well as repeated cross-validation with confidence interval estimation.

2. Related Work

2.1. Classification Methods for ADHD

In recent years, various functional connectivity-based methods have made significant progress in the field of diagnosis of ADHD. Compared with traditional subjective judgment methods, rs-fMRI-based FC models can not only extract functional connectivity as a potential biomarker for the classification of brain diseases but also identify areas of lesion, making them more objective and therefore attracting widespread attention. For example, Dongren Yao et al. utilized different region-of-interest (ROI) segmentation scale templates to construct sFC and input it into a triplet GCN (TGCN) module to learn the functional structural representation of brain connectivity networks on various scales, thus achieving the classification of ADHD [7]. Zhang et al. designed a multi-GCN generative adversarial network (MGCN-GAN) to learn representations of sFC by inferring individual structural connectivity based on functional connectivity [12]. Jie et al. designed weighted correlation kernels in convolutional neural networks to extract hierarchical features of dFC for the diagnosis of disease [13]. Xing et al. [14] utilized a GCN to extract features from dFC segments, and then processed them through long short-term memory (LSTM) layers to learn dFC representations.
However, it is unrealistic to assume that brain connectivity is purely static or purely dynamic. The aforementioned studies only used a single feature extracted from sFC or dFC for classification, ignoring the temporal and stability characteristics of functional connectivity. Recent studies have shown that integrating sFC and dFC may enhance the performance of brain disease identification [11]. Based on this, this paper proposes a classification model that integrates sFC and dFC features, aiming to combine the advantages of both to more comprehensively and accurately capture abnormal functional connectivity in the brains of patients with ADHD, thus improving diagnostic accuracy and reliability, and providing stronger support for clinical diagnosis.

2.2. Feature Extraction of Functional Connectivity

In brain network research, researchers widely apply convolutional neural network methods, applying convolutional operations to the processing of brain network image data. For example, Biao Jie et al. constructed a CNN framework based on convolutional kernels for the diagnosis of Alzheimer’s disease using fMRI data [13]. Kai Lin et al. proposed a convolutional recurrent neural network (CRNN) for the classification of automated encephalopathy [15]. Related studies have shown that phenotypic information plays an important role in the evaluation of intellectual development and the diagnosis of mental illness [16]. For example, Riaz et al. demonstrated the contribution of phenotypic characteristics such as age and sex when using them as inputs to a resilient network feature selection algorithm for the classification of ADHD using rs-fMRI [17].
Brain functional networks can be abstracted as graph structures with brain regions as nodes and functional connections as edges. Graph theory methods are advantageous in feature extraction and analysis of functional connections due to their ability to adapt to complex network relationships and capture both global and local characteristics. Some studies have integrated multiple graph theory features for the diagnosis of ADHD, achieving better performance than single features [18] For example, Rezaei et al. used rs-fMRI to calculate graph theory metrics of brain functional connectivity, combined with RFE feature selection and an SVM classifier to classify untreated ADHD children and typically developing (TD) children, and statistically analyzed brain network graph theory metrics [19]. Hu et al. constructed a functional connectivity network based on rs-fMRI data using graph theory and employed a 2LAGCN model with self-attention pooling mechanisms to distinguish between ADHD patients and typically developing individuals [20].
However, the above studies have obvious limitations: on the one hand, they mainly focus on feature extraction of functional connectivity networks themselves, ignoring the potential relationship between phenotypic features and functional connectivity features; on the other hand, the studies are mostly concentrated on the graph theory characteristics of sFC, and there is a lack of sufficient exploration of the temporal evolution characteristics of dFC.
To address these limitations, this paper proposes a solution: designing a CNN-based sFC feature extraction method to overcome the limitations of traditional CNNs in terms of insufficient fusion of phenotypic information and single-convolution-kernel scale, and proposing a temporal topological feature extraction architecture to capture dFC features, which calculates multi-scale topological features while implementing a BiLSTM to model the temporal evolution of dFC. This collaborative strategy enables the retention of dFC’s local spatial characteristics while capturing its global temporal dynamic topological characteristics, achieving a unified representation of the spatiotemporal fusion of the brain network.

3. Methodology

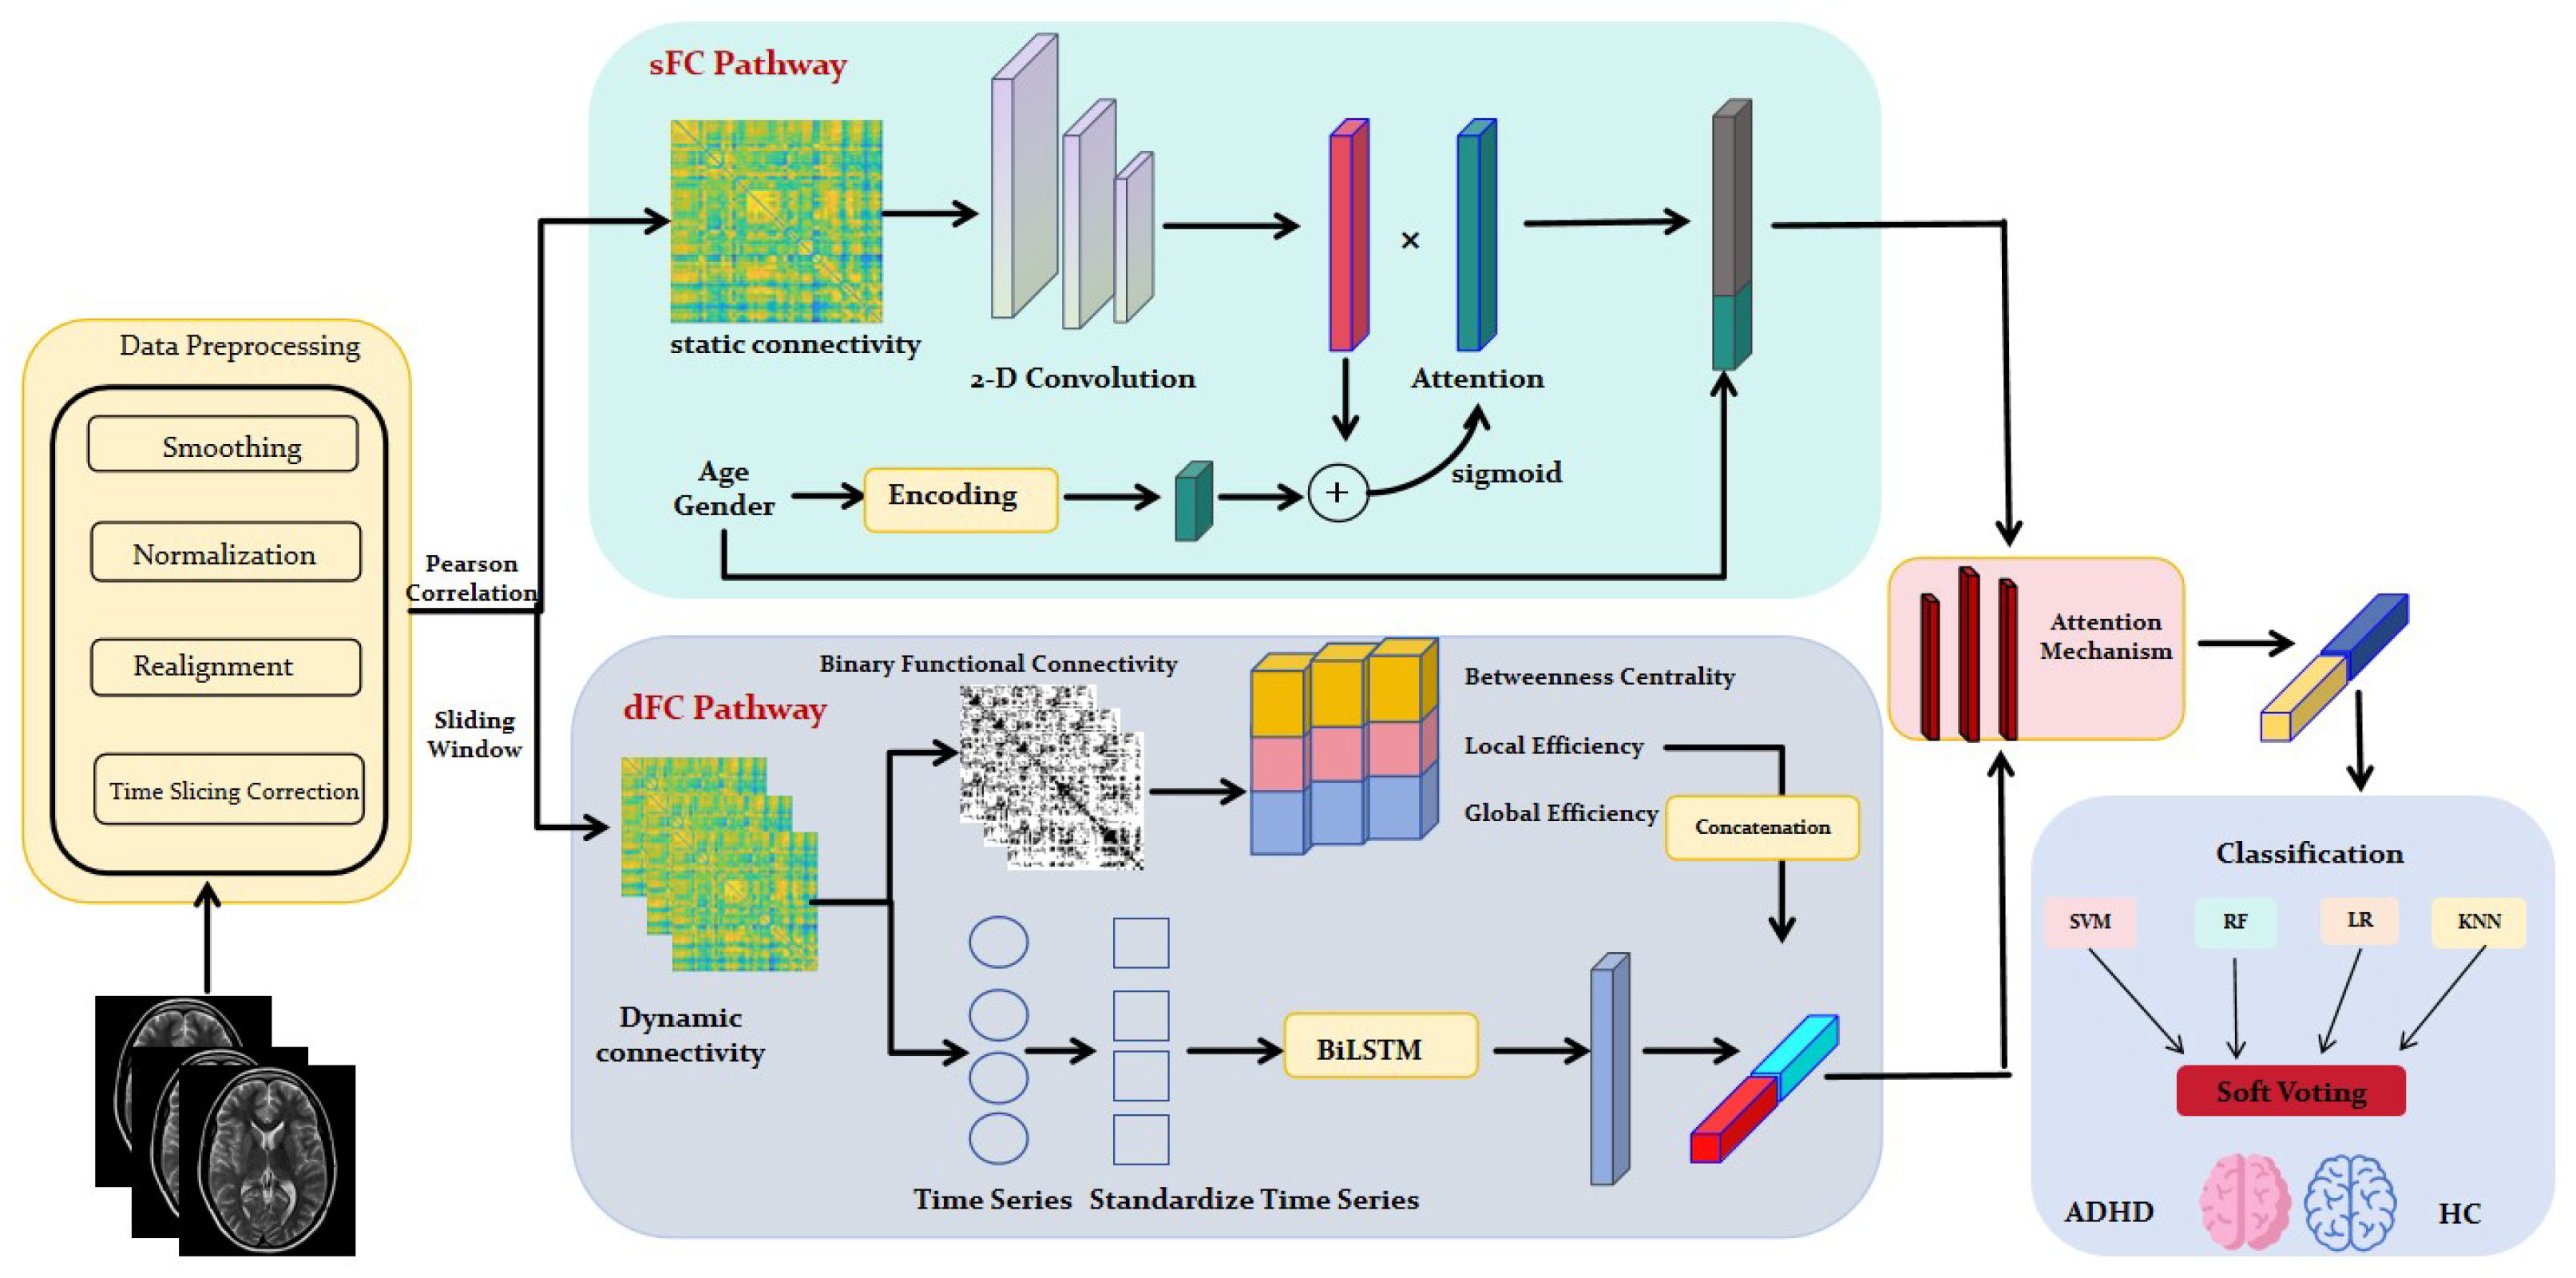
The general framework of this paper is shown in Figure 1. The following sections describe the model in detail.

3.1. Static Functional Connectivity Feature Extraction

This paper is inspired by the BrainNetCNNs technique [21] and uses convolutional neural networks (CNNs) to extract features from the sFC. In traditional image classification, standard square convolution kernels (such as 3 × 3 or 5 × 5) are often used for feature extraction. However, functional connectivity matrices possess unique topological characteristics: the i-th row represents the correlation between the i-th region of interest (ROI) and all other ROIs. This global connectivity makes it challenging for traditional small convolution kernels to fully preserve topological information. To address this issue, this paper proposes a multimodal fusion-based static functional connectivity feature extraction method, whose core architecture consists of a heterogeneous convolution encoder and a cross-modal attention mechanism. Based on the Automatic Anatomical Labeling Template (AAL-116), which divides preprocessed fMRI data into 116 regions of interest (ROIs), the preprocessed sFC matrix (size 116 × 116) is reconstructed into a two-dimensional topological brain region map and input into a three-branch parallel convolutional network for multi-scale feature decomposition: the first branch (local convolution) uses a 3 × 3 convolution kernel to extract short-range functional coupling patterns between adjacent brain regions, the second branch (longitudinal global convolution) uses a 116 × 1 convolution kernel to focus on capturing long-range functional interaction features across brain regions, and the third branch (lateral convolution) uses a 1 × 116 convolution kernel to analyze distributed topological structure features. The feature maps output by each branch are reduced in dimension via a 2 × 2 max pooling layer and then concatenated and fused along the channel dimension. The fused features are subsequently flattened into vectors and input into a 128-dimensional fully connected layer for nonlinear mapping, ultimately generating a static topological representation with high discriminative power.
In order to enhance the biological significance of feature representations, this study innovatively introduces a phenotypic attention fusion mechanism: first, Z-score normalization is performed on age features, and binary coding is implemented on gender features; subsequently, phenotypic attention weight vectors are generated through the fully connected layer, and the brain network features extracted by multi-scale convolution are dynamically weighted, which is calculated as follows:
F final = α F sFC F pheno
where α is the attention weight, ⊙ denotes the Hadamard product, and ⊕ is the operation of feature splicing. The design enables the model to adaptively enhance diagnostically relevant biological features by establishing phenotype–brain function mapping relationships and ultimately produces fused feature vectors that combine both static connectivity topology and phenotypic modulation information.

3.2. Feature Extraction of Dynamic Functional Connectivity

To overcome the limitations of sFC averaging in processing temporal information, this paper proposes a multi-scale spatiotemporal feature fusion framework based on dFC. By capturing the time-varying characteristics of the functional coupling strength between brain regions, this framework more sensitively reflects the dynamic reorganization of ADHD-related neural circuits. Based on this architecture, graph theory metrics are introduced to quantify the hierarchical topological relationships among nodes in dynamic functional connectivity, including node hubness, subnetwork robustness, and whole-brain information transmission efficiency [22].
This study selected betweenness centrality as an indicator to quantify the hubness of nodes, calculating the proportion of nodes participating in the shortest path in the whole-brain network to quantify the importance of functions of the brain region [23]. For the network composed of 116 ROIs throughout the brain, traditional methods to calculate the centrality of the interaction suffer from high time complexity (O(n3)). This study employs an improved Infomap algorithm that uses a hierarchical dimensionality reduction strategy.
Specific improvements include the following: 1. Introducing the traversal probability parameter τ , which allows random wandering to jump across communities with probability τ / ( n 1 ) and improves the algorithm’s adaptability to the dynamic topology of the brain network. 2. Iterative partitioning of the dynamic communities (Equation (2)), based on the minimization of the length of the information flow description, L ( M ) , to achieve a stable clustering of the subnetworks in each time window, and the whole brain network efficiently decomposed into m communities ( m n ). Based on this, the time-window functional connectivity matrix is first divided into communities, and the median centrality of each brain region is subsequently calculated at the subnetwork level (Equation (3)).
p α β ( 1 τ ) p α β + τ n
B C i = s i t n s t i g s t
where g s t represents the shortest path from node s to node t, and n s t i denotes the shortest path through node i in the shortest path from node s to node t.
Research suggests that ADHD may be associated with functional abnormalities in specific regions of the brain. This study adopted the system of segmentation of the brain region using the Automatic Anatomical Labeling Template (AAL-116), adding 26 cerebellar and cerebellar vermis regions to construct the emotional cognitive network (ECN) [24,25], ultimately forming a segmentation system comprising six functional modules (Table 1). Local efficiency metrics were used to quantify the dynamic functional characteristics of the modules. The calculation method involves removing the target node and then calculating the average shortest path length of the subgraph formed by the remaining adjacent nodes, thereby reflecting the rate of information integration in the brain regions and revealing differences between ADHD patients and healthy controls in the dynamic reorganization of the brain network. The formula is as follows:
E loc = 1 N G i ( N G i 1 ) j k G i 1 l j , k
where G i denotes the subgraph formed by its neighboring nodes after removing node i, N G i is the number of subgraph nodes, and l j , k denotes the shortest path length between nodes j and k [26].
Global efficiency is defined by quantifying the average reciprocal of the shortest paths between all nodes in the network, representing the overall efficiency of information transmission in the network. The higher the value, the stronger the brain network’s ability to integrate information. This study constructed a dynamic functional connectivity matrix based on a sliding time window and calculated global efficiency for each window to characterize the spatiotemporal evolution of the functional state of the brain network [27].
In order to distinguish between brain time-slice modeling and conventional time-series analysis, a two-layer BiLSTM architecture is used to achieve context-aware feature encoding. The first layer captures forward–backward long-range dependencies within a time window via the bidirectional LSTM(50), while the second layer extracts temporal latent patterns using LSTM(50) and finally compresses key dynamic features through Dense (25, activation = ‘relu’) [28,29]. The mathematical representation of the BiLSTM is as follows:
Forward LSTM : h t = H W x h x t + W h h h t 1 + b h
Backward LSTM : h t = H W x h x t + W h h h t 1 + b h
Combined Output : y t = H W h y h t + W h y h t + b y
Here, W x h R d x × d h denotes the weight matrix from the input to the forward hidden state, W h h R d h × d h denotes the weight matrix from the forward hidden state to itself, W h y R d h × d y and W h y R d h × d y denote the weight matrices from the forward and backward hidden states to the output, b h R d h is the bias term for the forward hidden state, and b y R d y is the bias term for the output.
To eliminate feature redundancy and generate spatiotemporally consistent sample-level representations, PCA ( n c o m p o n e n t s = 50 ) is also used to eliminate feature redundancy, and sample-level representations are generated by mean pooling. Compared with traditional unidirectional LSTM, BiLSTM autoencoders can simultaneously capture feedforward–feedback information transmission patterns of brain networks, which are more consistent with the neural mechanisms of continuous contextual information guidance in cognitive functions.

3.3. Integration of Static and Dynamic Features

Feature fusion is a key technique in deep learning tasks, especially in scenarios involving multiple sources of connectivity information. Effectively integrating heterogeneous features to improve classification performance remains a critical challenge. Traditional fusion strategies, such as direct feature concatenation, are simple to implement but often fail to capture the complex dependency structure between static and dynamic representations.
To address the complexity of integrating static and dynamic features, this study proposes a bidirectional cross-attention (BCA) mechanism. Given static features S R N × d s and dynamic features D R T × d d , we first project them into a unified feature space via a linear transformation:
S = S W s ( W s R d s × d )
D = D W d ( W d R d d × d )
To model the interaction between static and dynamic features, we introduce a static-guided attention mechanism in which the projected static features serve as query vectors, while dynamic features act as key–value pairs. The attention distribution is computed as follows:
α = softmax S D d
D ˜ = α D
Here, α denotes the attention weights that quantify the influence of static features on dynamic features, and D ˜ represents the dynamic feature representation reweighted under the guidance of static structural information.
Finally, the original projected static features and the attention-weighted dynamic features are concatenated to form the fused representation:
F = S D ˜
This fusion strategy effectively integrates heterogeneous features by retaining the global topological characteristics of static functional connectivity while incorporating dynamic information that has undergone adaptive filtering based on static features.
Compared with bidirectional or symmetric attention mechanisms, the proposed static-guided attention design offers several advantages. Static functional connectivity captures stable and global interaction patterns of brain networks, providing a reliable structural prior for feature selection. By using static features to guide the reweighting of dynamic connectivity representations, the model can suppress transient or noisy temporal fluctuations and emphasize dynamic patterns that are consistent with the underlying network organization. This results in a more stable and interpretable fusion process, which is particularly beneficial under limited sample sizes and inter-subject variability.

3.4. Classifiers

To improve the generalization ability and classification accuracy of the model, this study adopts the voting classifier architecture [30]. This architecture integrates four base classifiers: Logistic Regression, Support Vector Machine (SVC), Random Forest, and K-Nearest Neighbors (KNN). By aggregating their prediction results and leveraging model diversity, it compensates for the decision biases of individual classifiers. Specifically, a “soft voting” strategy is used to integrate the output of the base classifiers: each classifier’s predicted category probability is weighted in the voting process. This strategy considers the probability outputs of different classifiers to make the final category determination, potentially enhancing the model’s adaptability and classification accuracy across diverse samples. Due to the limited scale of publicly available ADHD functional magnetic resonance imaging data, no additional samples were introduced in this study. To enhance the robustness and statistical reliability of the performance evaluation, a 10-fold cross-validation strategy was used to assess the model. Specifically, the experiment repeated the 10-fold cross-validation five times. The 95% confidence interval for the AUC was estimated using bootstrap resampling based on all out-of-fold predictions, thus mitigating evaluation bias caused by random data partitioning.

4. Experiments

4.1. Materials and Pre-Treatment

This study utilized multi-subject resting-state fMRI data from the ADHD-200 dataset [31], which includes samples from three sites—New York University (NYU), the Kennedy Krieger Institute (KKI), and Peking University—along with their corresponding phenotypic information (see Table 2 for details). All rs-fMRI data were preprocessed using a standard pipeline, including slice-timing correction, head-motion realignment, and spatial normalization to a standard template (e.g., MNI space). Spatial smoothing was performed with a Gaussian kernel (FWHM = 4–8 mm). To reduce confounding motion and physiology-related nuisance regression, we included Friston-24 motion parameters and signals from white matter and cerebrospinal fluid, together with linear trend removal. Temporal band-pass filtering was applied in the 0.01–0.1 Hz range. Volumes with excessive motion were identified and removed using framewise displacement (FD) with a threshold of 0.5 mm, and subjects with a large proportion of censored volumes (e.g., >20%) were excluded. Global signal regression (GSR) was also considered and is explicitly reported where it was applied, so as to ensure reproducibility and comparability with previous studies.
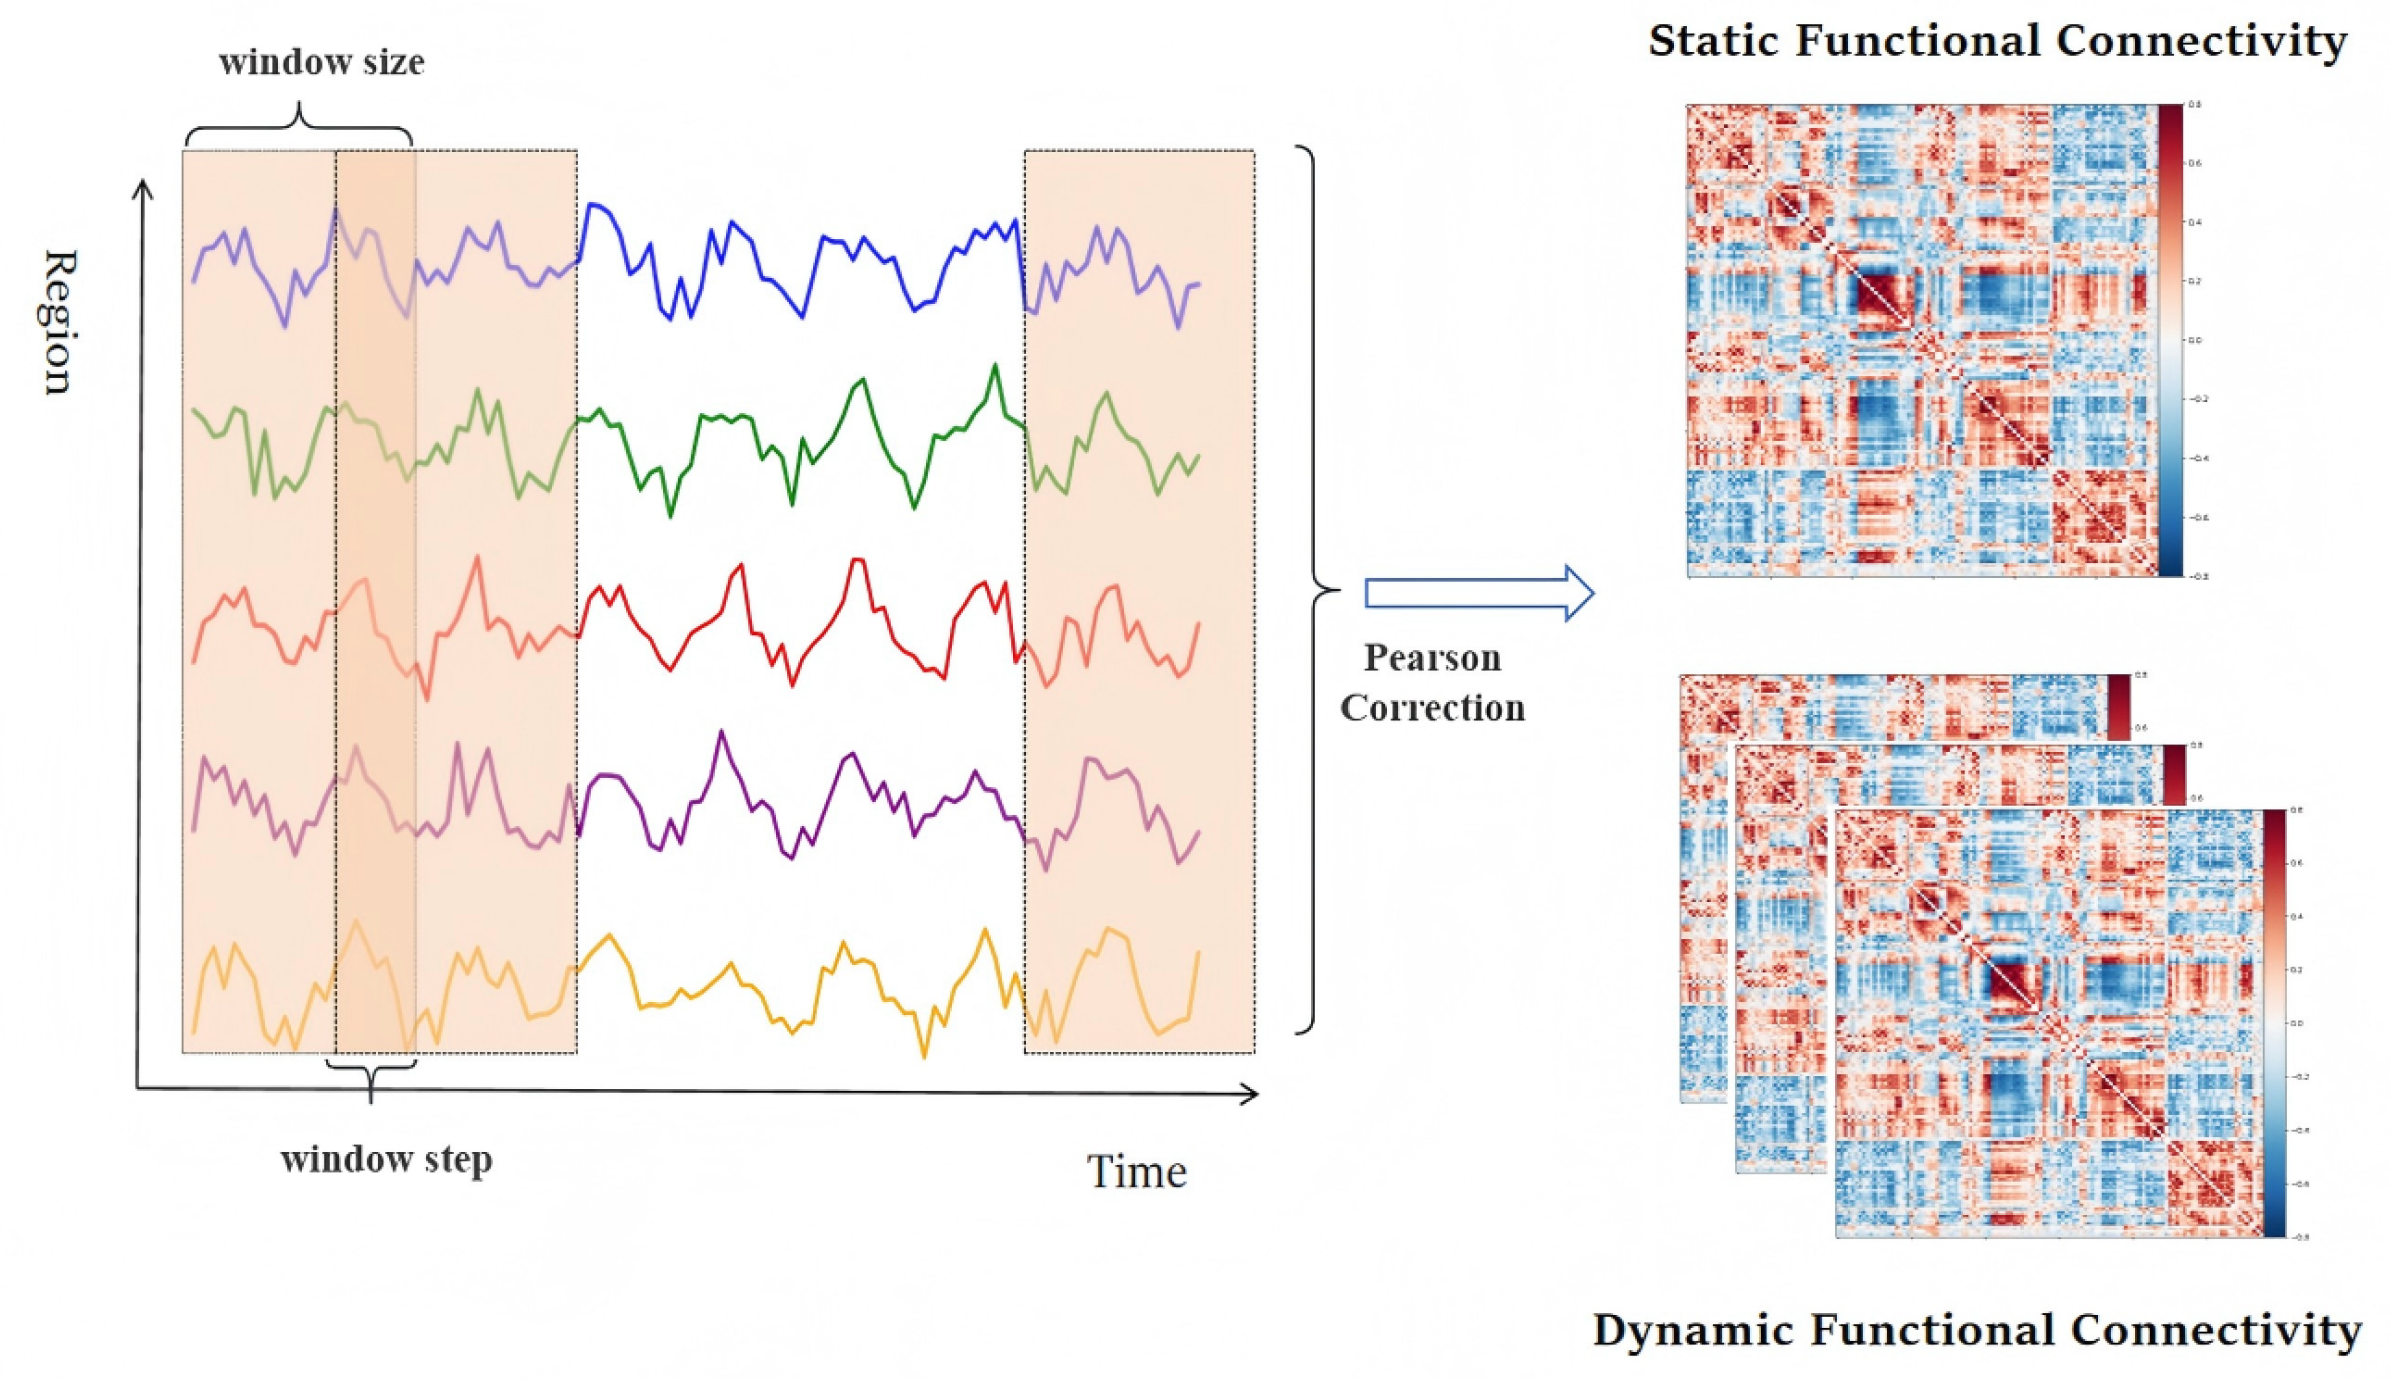
This study is based on the Automatic Anatomical Labeling Template (AAL-116), which divides preprocessed fMRI data into 116 regions of interest (ROI) and extracts the signal dependent on average blood oxygen level (BOLD) within each ROI to form the corresponding time series. The construction of sFC is based on the assumption that “functional connectivity remains constant throughout the scan,” achieved by calculating the Pearson correlation coefficient of all ROIs’ time series throughout the scan period. dFC is calculated using a sliding-time-window method: the time series is first divided into consecutive overlapping time windows, and the Pearson correlation coefficients between ROIs are recalculated within each window to generate a static functional connectivity matrix for that window. Finally, all window matrices are concatenated along the time dimension to form a dynamic functional connectivity sequence. The specific construction process of the static and dynamic functional connectivity matrices is detailed in Figure 2.

4.2. Experimental Setup

This paper uses the Peking site experiment as an example to illustrate the parameter settings. To suppress false weak connection interference and strengthen the interaction characteristics of key brain regions, a threshold method based on the Pearson correlation coefficient (r) between ROIs is used to perform sparsification processing on the functional connectivity matrix: when | r | < θ , the value is set to zero and the original value of | r | θ is retained. Reference [27] suggests controlling edge density within the 10–20% range to maintain the small-world properties of the functional connectivity network. After validation of the grid search, set θ = 0.3 . This sparsification strategy is applied simultaneously to the feature extraction processes of sFC and dFC, respectively, by constructing sparsified sFC and dFC matrices as dual-path inputs.
This paper uses a CNN combined with a phenotypic attention fusion strategy to extract sFC features. First, BOLD signal time series for each ROI are extracted based on the AAL-116 template. A 116 × 116 symmetric functional connectivity matrix is constructed by calculating the Pearson correlation coefficient over the entire period of time. This matrix is input into a multi-branch CNN architecture, where each branch undergoes 32-channel convolution (ReLU activation) and 2 × 2 max pooling before being concatenated and fused, resulting in a 128-dimensional fully connected feature vector.
At the same time, phenotypic characteristics are standardized and encoded: age is standardized using Z-scores, and gender is encoded using a binary system (male = 1/female = 0). An innovative attention-weighted mechanism is introduced, which uses a sigmoid activation function to learn adaptive weights for CNN features, thereby reinforcing key topological features related to phenotypes. Finally, the weighted features are concatenated with the phenotypic vector to form a highly discriminative static feature representation.
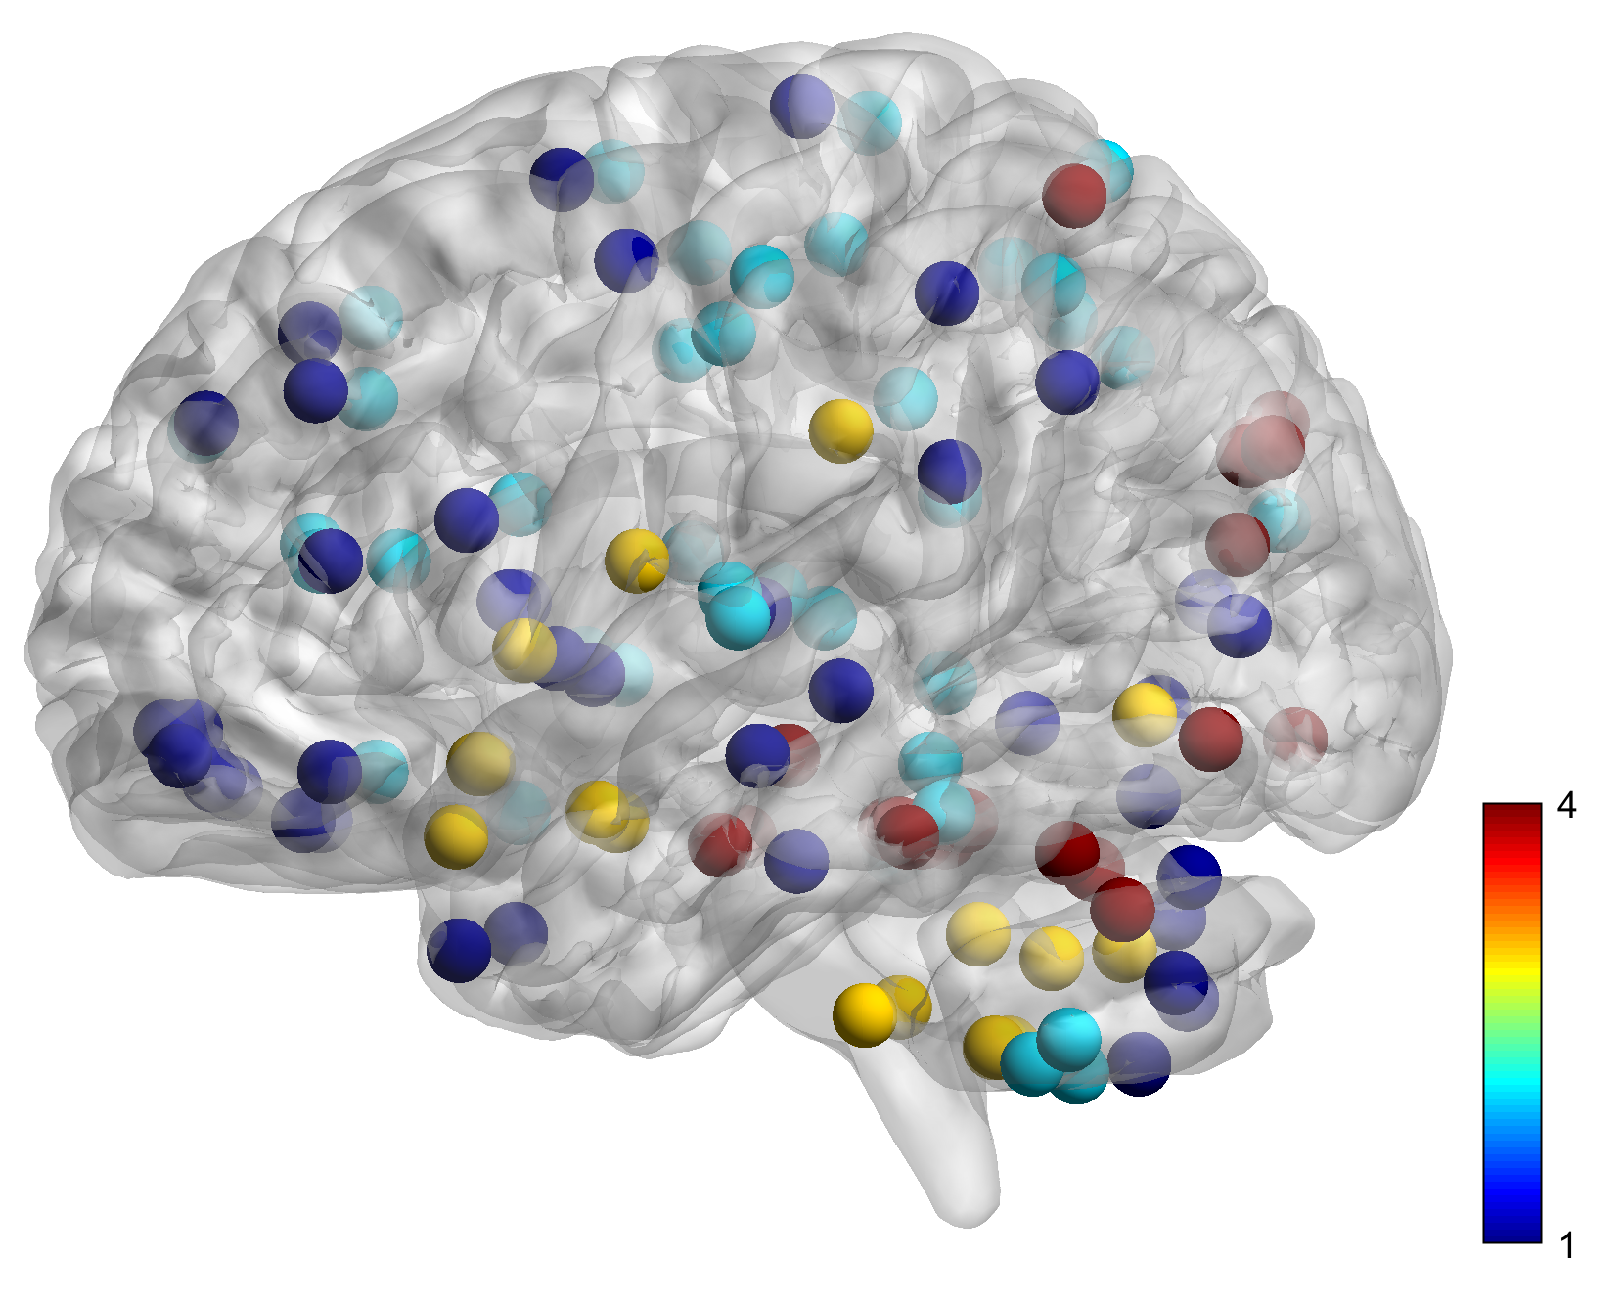
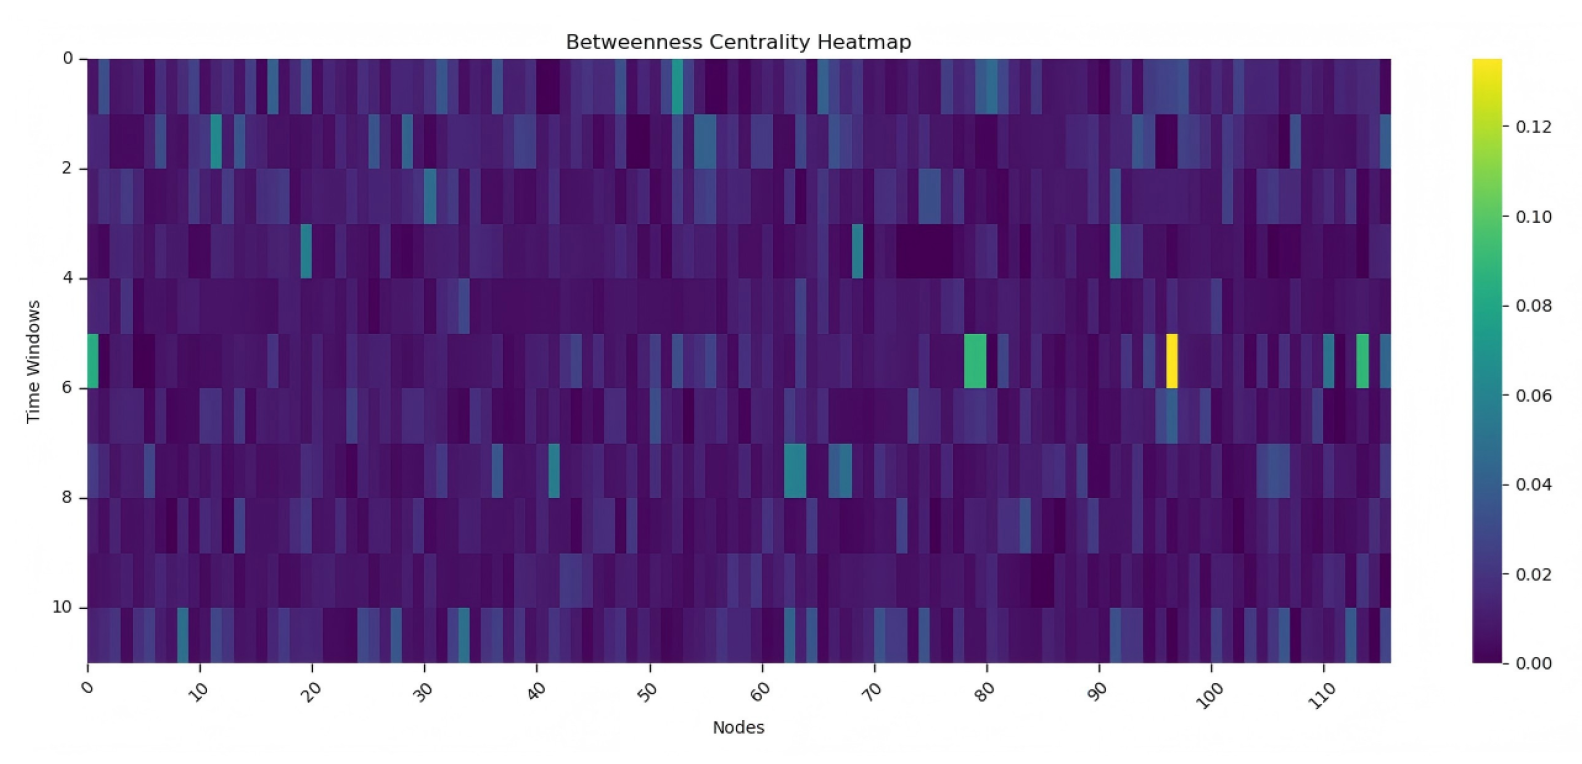
In dFC feature extraction, the functional connectivity matrix is first calculated for each sliding time window, and three graph-theoretic metrics—betweenness centrality, local efficiency, and global efficiency—are extracted to characterize the topological properties of the brain network. The improved Infomap algorithm is used to group the static sFC matrix (visualization results shown in Figure 3, with different colors representing different clusters), and the centrality of the relationship between nodes within each subgroup is calculated based on this grouping. Furthermore, based on the six predefined functional subnets (see Table 1), the local efficiency of each subnetwork (six subnetworks × seven windows) and the global efficiency of the entire network (one × seven windows) are calculated for each time window. Combined with the centrality of the intermediation of 116 brain regions (116 × seven windows), a set of multidimensional dynamic features is constructed. Figure 4 shows the dynamic evolution of the centrality of the difference through a heat map (rows: 116 regions of the brain; columns: 7 time windows). Multiple brain regions exhibit high centrality between locations in specific windows, indicating that they served as key hubs in the dynamic network, providing evidence for analyzing dynamic dependency relationships within the brain network.
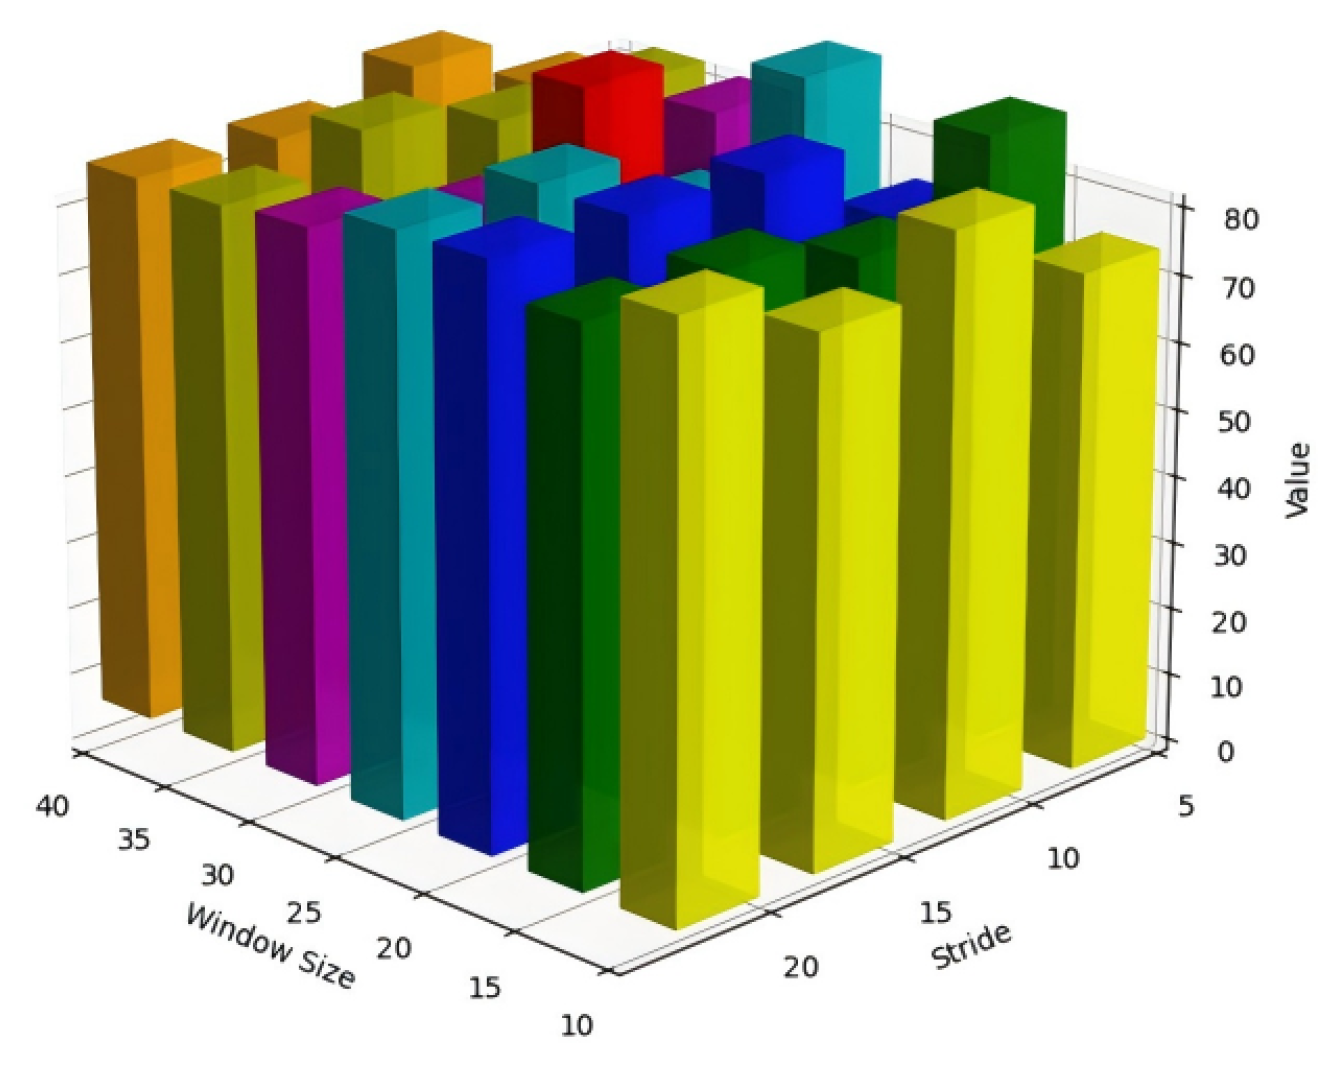
To optimize the temporal parameters, a grid search was conducted to evaluate the impact of window size (10–40 TR, step size 5) and step size (5–20 TR) on classification performance (Figure 5, where the X/Y/Z axes correspond to window size, step size, and accuracy, respectively). The results showed that the optimal performance was achieved at a window size of 30 TR and a step size of 10 TR. Taking into account both stability and generalization requirements, the final baseline configuration was set to a window size of 30 TR and a step size of 10 TR. Additionally, transfer learning fine-tuning was performed based on multi-site heterogeneity to enhance cross-site generalization capabilities.
In the feature fusion stage, standardized time series are reshaped and inputted into a BiLSTM autoencoder to extract time features, which are then fused with topological features to form dynamic features. A fully connected layer is used to adjust the dimension of the dynamic features to match the static features. An attention mechanism is used to weight and fuse the two to generate a unified feature representation. Finally, the fused features of all samples are entered into a voting classifier along with the labels to verify the validity of the features.
The experiments used a nested ten-fold cross-validation strategy: the outer loop evaluated the model performance, and the inner loop optimized the classifier hyperparameters through grid search. Evaluation metrics including precision, sensitivity, specificity, balanced accuracy, and the area under the ROC curve (AUC) were used to comprehensively assess the efficacy of the classification.

4.3. Statistical Analysis

To investigate differences in the dynamic stability of the brain network between ADHD patients and healthy controls, this study conducted a coefficient of variation (CV) analysis based on the local efficiency characteristics of dFC. The coefficient of variation is defined as the ratio of the standard deviation to the mean, providing a standardized measure of the temporal fluctuation intensity of functional connectivity within modules: a higher CV value indicates more intense fluctuations in local efficiency across time windows and lower connectivity stability; conversely, a lower CV value suggests a more stable network state. The specific analysis process was as follows: first, the local efficiency of each module was calculated window by window, and then the CV values for each module were calculated based on the full-time data; second, abnormal fluctuation modules were identified through directional difference statistics (calculating the proportion of CV values in the ADHD group that are greater than those in the control group), with some results shown in Table 3.

4.4. Ablation Experiment

To validate the effectiveness of static and dynamic pathways, this study designed a systematic ablation experiment. In the static pathway analysis, two comparison schemes were employed to evaluate feature contributions: (1) removal of phenotypic features and use of only static functional connectivity features extracted via convolutional methods, and (2) classification using only static features extracted from the paths. For dynamic paths, a similar dual-control design was employed: (1) classification using only dynamic features extracted from paths via graph theory, with the LSTM module removed, and (2) classification using only dynamic features extracted from dynamic pathways. To validate the contribution of the proposed single-attention mechanism fusion guided by static functional connectivity features to classification, feature contributions were evaluated using two comparison schemes: (1) removing the attention mechanism and using simple concatenation to fuse static and dynamic connectivity features, and (2) using a bidirectional attention mechanism to fuse static and dynamic connectivity features.

4.5. Runtime Profiling and Complexity Analysis

Meanwhile, we separately analyzed the theoretical time complexity and empirical runtime of each major module (Table 4). Runtime evaluation was conducted at the subject level, as feature extraction was performed independently for each subject, and the overall runtime at the dataset level scaled linearly with the number of subjects.
As shown in Table 4, the primary computational cost comes from the dynamic functional connectivity module, particularly feature extraction based on bidirectional long short-term memory (BiLSTM) and the subsequent dimensionality reduction step of the Principal Component Analysis (PCA). This result aligns with expectations, as modeling time across multiple sliding windows is central to capturing dynamic brain connectivity patterns. In contrast, static functional connectivity feature extraction—including spatial modeling via convolutional neural networks and attention-based fusion with phenotypic features—incurs minimal computational overhead.
The voting classifier introduces additional costs due to ensemble learning and cross-validation, yet its runtime remains moderate and does not constitute a primary computational burden. In general, this framework achieves a reasonable balance between modeling capability and computational efficiency, demonstrating its feasibility for practical neuroimaging applications.

5. Results and Discussion

5.1. Comparative Framework

The framework proposed in the literature [19] utilizes graph theory to extract brain network features from resting-state fMRI data, then uses a recursive feature elimination algorithm to select the most discriminative subset of features, and finally uses a gradient-boosting (GB) classifier for classification.
The Attentional Attribute Enhancement Network (AAEN) proposed in the literature [32] improves the performance of ADHD classification by combining multimodal characteristics. The model is based on the Convolutional Variational Autoencoder (CVAE) framework, which first extracts potential features of brain functional connectivity, subsequently introduces phenotypic attributes such as age and gender to generate attentional weights, and dynamically weights the potential features to highlight key information. Finally, enhanced features of brain connectivity are fused with original phenotypic data and input into a Support Vector Machine (SVM) to perform classification.
Ref. [33] proposes a spatiotemporal attention autoencoder (STAAE) to perform spatiotemporal modeling of functional magnetic resonance imaging of the resting state (rs-fMRI) through unsupervised learning to solve the long-distance-dependent modeling problem, and to construct a classification framework based on temporal templates of the resting state (RSTT) to identify patients with ADHD.
The model proposed in [34] has three modules: data enhancement, feature selection, and classification. Data enhancement connects the network with Gaussian noise, Mixup, and sliding-window processing functions. Feature selection extracts local and global features with the CNN and GAT. Finally, the feature fusion module fuses the two features to generate an effective feature representation for the identification of patients with ADHD.
Shao et al. [35] extracted 1D functional connectivity and 3D Amplitude of Low-Frequency Fluctuation (ALFF) features from fMRI data. They proposed an enhanced gcForest model that integrates these features via a multi-granularity scanning structure, generating augmented feature vectors for final classification through a cascade forest.
To provide a more intuitive comparison of the differences between the aforementioned five references and this study, Table 5, Table 6, and Table 7 systematically compare whether phenotypic information was incorporated, the static and dynamic functional connectivity features extracted, and the methods used to fuse these two types of features, respectively.
Although the proposed framework achieved competitive mean AUC values across different sites, the corresponding 95% confidence intervals remained relatively wide. This observation indicates that the model performance still exhibits noticeable variability under different data partitions, suggesting that further improvements are possible.
The relatively broad confidence intervals can be attributed to several factors. First, the limited sample size and class imbalance inherent in publicly available ADHD neuroimaging datasets can amplify performance fluctuations across cross-validation folds. Second, inter-site heterogeneity in data acquisition protocols, scanner characteristics, and subject demographics may further increase variability in model predictions. Inter-site heterogeneity may systematically shift both sFC topology and dFC temporal statistics, thereby affecting learned representations and model performance. This motivates future work on domain-adaptive learning to improve cross-site robustness and generalization. In addition, the high dimensionality of functional connectivity features relative to the number of samples may introduce estimation uncertainty.
These results highlight the necessity of future work focusing on larger multi-site datasets, improved feature selection or dimensionality reduction strategies, and more robust domain-adaptive learning frameworks to enhance the generalizability and stability of ADHD classification models.
To validate the effectiveness of each component of the feature extraction framework proposed in this paper, ablation experiments were conducted using data from the PK site. The results are shown in Table 8. In the static pathway, removal of phenotypic features reduced the precision of the model from 73.91% to 68.18%, confirming that phenotypic information plays a critical additional role in modeling static functional connectivity. In the dynamic pathway, removal of BiLSTM temporal features resulted in a decrease in classification precision from 77.27% to 72.73%, indicating that temporal encoding effectively improves the ability to represent dynamic functional connectivity in time. The joint classification precision of the feature fusion framework reached 86.36%, significantly outperforming the static (73.91%) or dynamic (77.27%) single-feature baselines, and validating the effectiveness of the multimodal feature synergy mechanism. The experimental results indicate the following: (1) Phenotypic data and static functional connectivity features extracted via convolution exhibit complementarity. (2) Temporal modeling enhances the representational granularity of dynamic functional connectivity. (3) The bidirectional feature fusion strategy exhibits a nonlinear gain effect.
During the feature fusion stage, we further compared the classification performance differences between simple feature concatenation, bidirectional attention fusion, and unidirectional attention fusion guided by static features. Experiment E used direct concatenation of static and dynamic functional connectivity features for classification, achieving an accuracy of only 65.22%. This result was significantly lower than those obtained using static (73.91%) or dynamic (77.27%) features alone, indicating that simple concatenation struggles to effectively capture the intrinsic dependencies between the two feature types and may instead introduce redundant information and noise interference. Experiment F introduced a bidirectional attention mechanism to model interactions between static and dynamic features, improving the classification accuracy to 69.57%. Although this represents an improvement over simple concatenation (65.22%), it remains significantly lower than the unidirectional attention fusion strategy employed by our baseline model (86.36%). This result indicates that symmetric bidirectional feature interactions do not yield further performance gains and may instead weaken the global structural constraints provided by static functional connectivity.
The experimental results demonstrate the following: (1) Phenotypic data exhibit complementarity with static functional connectivity features extracted via convolution. (2) Temporal modeling enhances the representational granularity of dynamic functional connectivity. (3) The unidirectional attention mechanism-based feature fusion strategy, where static functional connectivity guides dynamic functional connectivity, yields a nonlinear gain effect.

5.2. Categorized Performance

Table 9 summarizes the classification performance of the proposed framework at the NYU, Peking, and KKI sites, including accuracy, sensitivity, specificity, and area under the curve (AUC). As shown in the table, the proposed model demonstrates high accuracy and AUC values at all three sites. Among them, the KKI site exhibits the best classification performance, with an accuracy of 90.91% and an AUC value of 96.97%. The model also exhibits a good balance of sensitivity and specificity across all sites. In particular, the specificity at both the NYU and KKI sites reaches 100%, indicating that the model achieves extremely high accuracy in identifying negative class samples. In general, the model demonstrates outstanding classification performance at different sites, validating its effectiveness and generalization in the ADHD classification task.
Table 10 shows the results of the classification accuracy comparison between the method proposed in this document and the existing state-of-the-art methods. Our method demonstrates significant advantages in classification performance at all sites, achieving accuracy rates of 85%, 86.96%, and 90.91% at the NYU, PK, and KKI sites, respectively, all of which outperform all comparison methods. Specifically, compared to the static feature extraction method in [32], our method effectively captures the dynamic characteristics of brain networks through dynamic functional connectivity analysis and BiLSTM temporal modeling, improving precision at the PK site by 8.76%. Compared to the spatiotemporal attention autoencoder (STAAE) in Reference [33], our method uses a dual-path feature extraction strategy (combining CNN static features with BiLSTM dynamic features), achieving a 14.31% improvement in accuracy at the highest-performing site (KKI). Additionally, compared to [35], our method achieves accuracy improvements of 11.83% and 22.09% at the NYU and PK sites, respectively, by introducing multi-scale topological feature extraction and phenotypic information fusion. Table 10 summarizes the key differences between existing ADHD classification studies and the proposed D-SFANet, highlighting how our method explicitly models the mutual dependencies between static and dynamic functional connectivity rather than simply stacking separate modules.
To validate the effectiveness of each component of the feature extraction framework proposed in this article, ablation experiments were conducted using data from the PK site The results are shown in Table 8. In the static pathway, the removal of phenotypic features reduced the accuracy of the model from 73.91% to 68.18% ( Δ = 5.73%), confirming that phenotypic information plays a critical complementary role in modeling static functional connectivity. In the dynamic pathway, removal of BiLSTM temporal features resulted in a decrease in classification precision from 77.27% to 72.73% ( Δ = 4.54%), indicating that temporal encoding effectively enhances the ability to represent dynamic functional connectivity in time. The joint classification precision of the feature fusion framework reached 86.36%, significantly outperforming the static (73.91%) or dynamic (77.27%) single-feature baselines, and validating the effectiveness of the multimodal feature synergy mechanism. The experimental results indicate the following: (1) Phenotypic data and static functional connectivity features extracted via convolution exhibit complementarity. (2) Temporal modeling enhances the representational granularity of dynamic functional connectivity. (3) The bidirectional feature fusion strategy exhibits a nonlinear gain effect.

5.3. Discussion

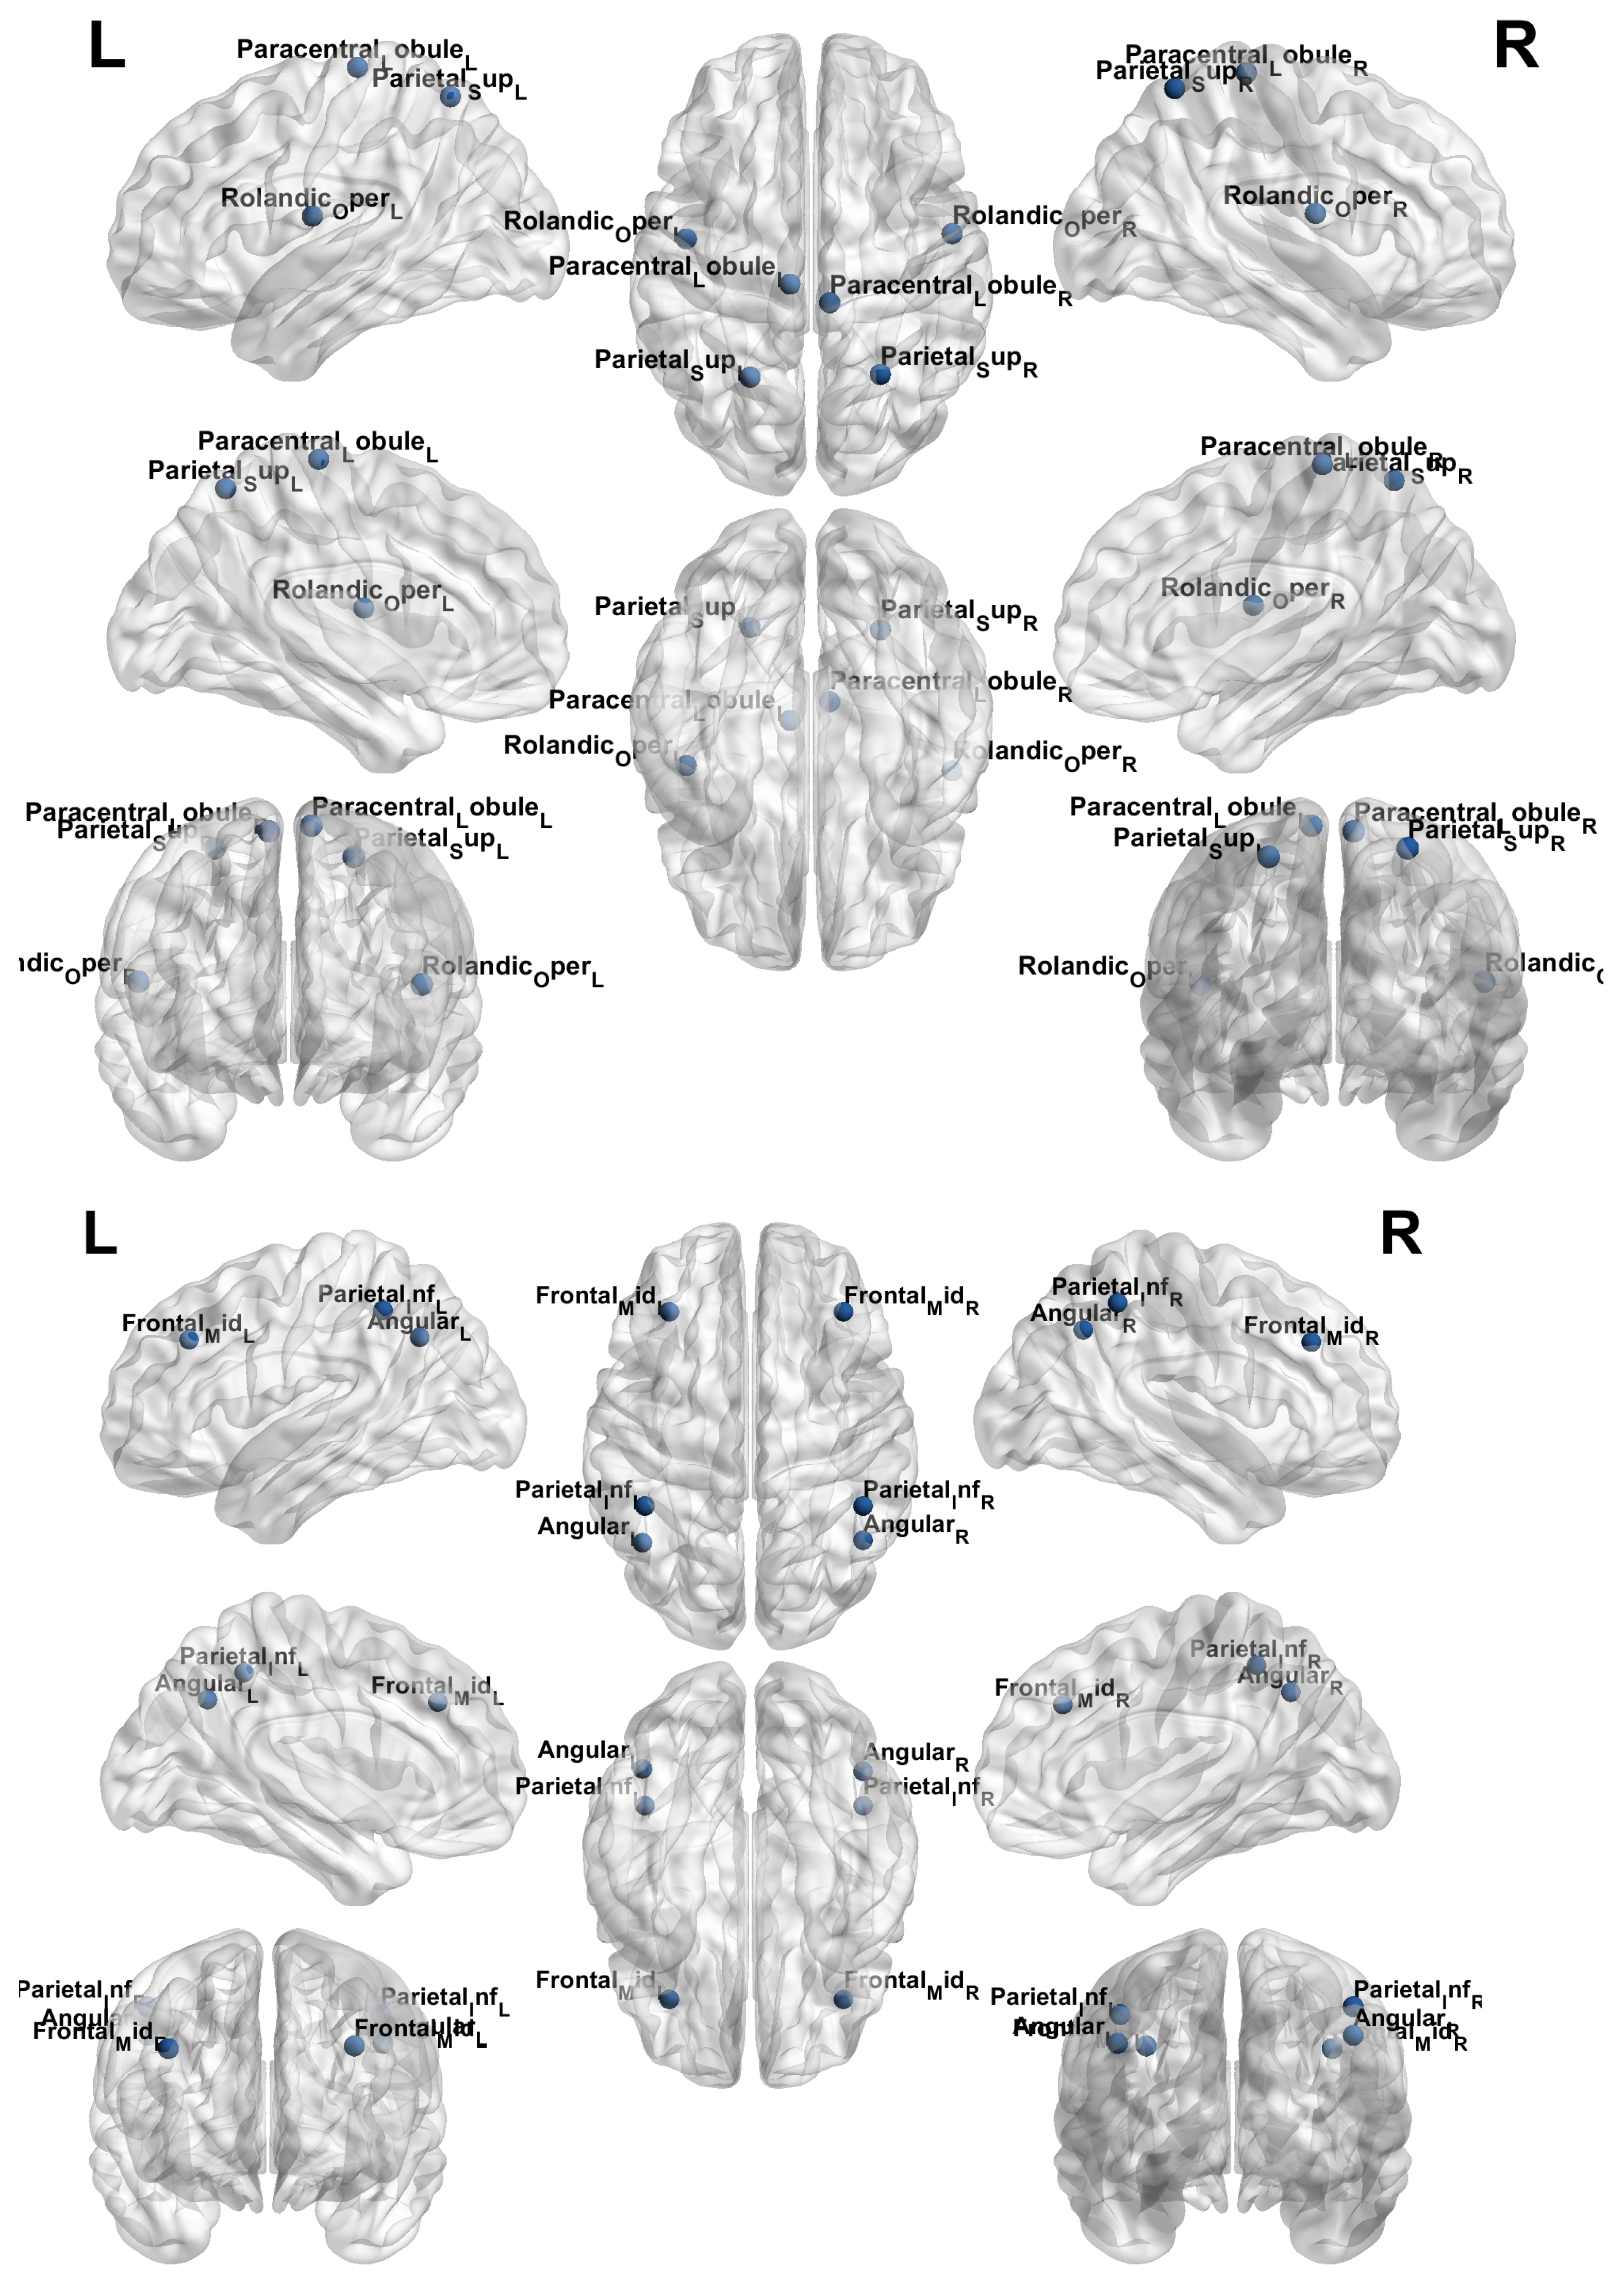
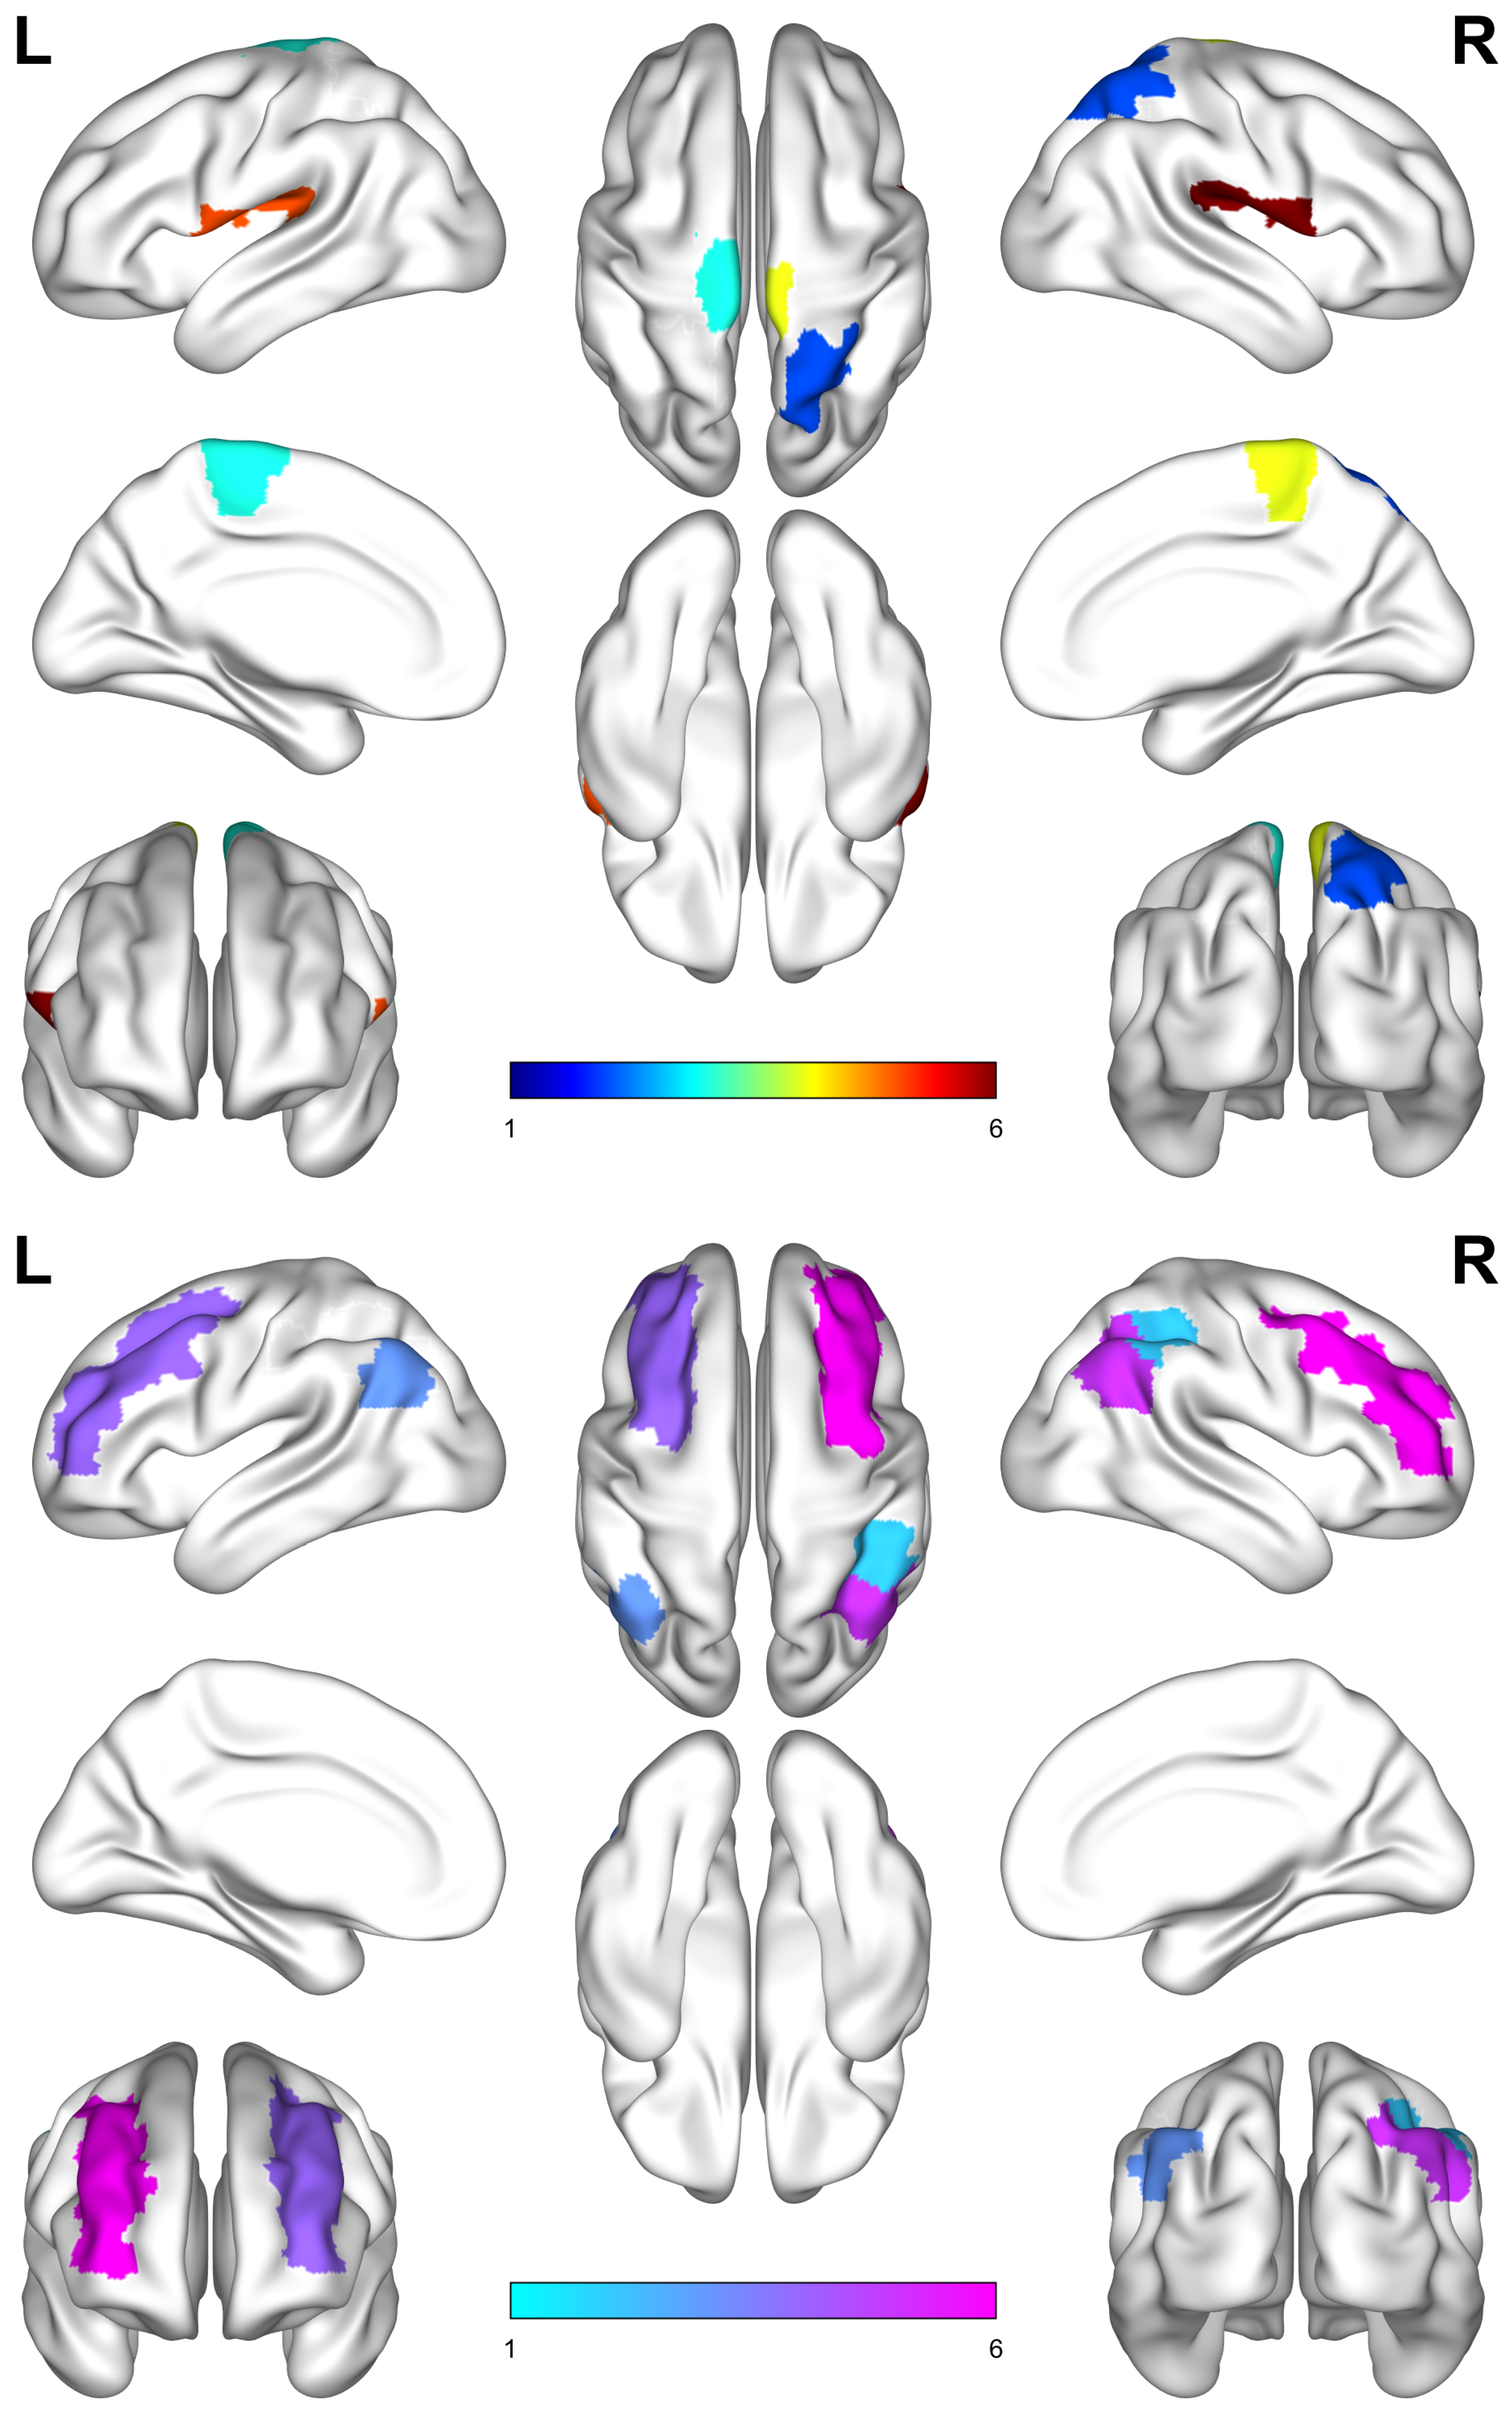
In this study, two independent feature extraction paths were designed by combining the characteristics of static functional connectivity (sFC) and dynamic functional connectivity (dFC), and the extracted features were fused to achieve the classification of ADHD. In the dFC feature extraction path, the topological features of functional connectivity were extracted on the basis of graph theory, and local efficiency was analyzed. Compared to controls, the ADHD group exhibited significantly higher coefficients of variation (CV) of local efficiency in both the attention network module (29 ADHD samples) and the sensorimotor network module (26 ADHD samples), indicating greater temporal variability in these networks. Figure 6 shows some regions of the brain included in the modules of the attention and sensorimotor network, and Figure 7 lists their corresponding names. The attention network is closely related to maintaining and switching attention, whereas the sensorimotor network is involved in sensory integration and motor coordination. The increased CV of local efficiency in these networks suggests reduced stability of information integration over time, which is consistent with the clinical phenotype of fluctuating attention allocation and impaired sensorimotor coordination in ADHD.
Nevertheless, rs-fMRI-derived connectivity dynamics remains an indirect proxy of neural activity; therefore, mechanistic interpretations should be made with caution. To strengthen the biological basis of our interpretation, we relate the observed temporal instability in graph efficiency derived from dFC to complementary neurophysiological evidence. For example, Ronca et al. used attention-related EEG indices that were originally developed in ADHD research—specifically, the frontal beta/theta ratio (i.e., the inverse theta–beta Ratio)—to track fluctuations in attention processing and cognitive control in different experimental conditions, demonstrating that objective EEG markers can sensitively capture dynamic variations in attentional state [36]. Although EEG and fMRI probe neural processes at different temporal scales, both modalities support the notion that attention regulation in ADHD is characterized by increased temporal instability, which is conceptually consistent with the elevated CV of local efficiency observed in our modules of the attention and sensorimotor network. These findings reveal a core neural mechanism and significant heterogeneity in ADHD, but the specifics need further validation using larger samples.
We emphasize that rs-fMRI connectivity dynamics provides an indirect measure of neural activity; therefore, the mechanistic interpretation should be made with caution. To improve biological grounding, complementary neurophysiological evidence indicates that attentional dynamics and cognitive control in ADHD can be characterized using objective EEG-derived indices (e.g., attention-related EEG markers). This evidence supports the concept that ADHD is associated with increased temporal instability in attentional regulation, consistent with the elevated variability in network efficiency observed in our dFC-derived features. Future work will integrate neurophysiological attention indices with fMRI connectivity dynamics to establish a more direct cross-modal mechanistic mapping.


6. Conclusions

This paper proposes a dual-path ADHD classification model that combines a convolutional neural network (CNN) with a bidirectional long- and short-term memory network (BiLSTM). The model extracts static functional connectivity (sFC) features (based on Pearson correlation analysis) and dynamic functional connectivity (dFC) features (based on a sliding-time-window method) from fMRI data through two independent pathways and combines the two types of features for diagnostic classification. The experimental results demonstrate that the model significantly outperforms various comparison algorithms on multi-site ADHD datasets, validating its effectiveness and superiority. Additionally, analysis of the dynamic feature path reveals abnormal characteristics of the brain network dynamics in ADHD patients, providing new information for neuroimaging-based diagnosis.
Nevertheless, the proposed model still faces limitations related to the relatively small sample size and inter-site variability, which may affect the stability of classification performance. Future work will focus on validating the framework on larger multi-site datasets and exploring more robust feature learning and domain-adaptive strategies to further improve generalization and diagnostic reliability.

Author Contributions

Methodology, L.Z.; Validation, G.D.; Formal Analysis, M.J.; Writing—Original Draft, G.D.; Writing—Review and Editing, M.J.; Supervision, L.Z.; Project Administration, M.J. All authors have read and agreed to the published version of the manuscript.

Funding

This research was funded by the Shandong Innovation Project (2023TSGC0603) and the National Natural Science Foundation of China (61902202).

Data Availability Statement

Restrictions apply to the availability of these data. Data were obtained from the ADHD-200 Consortium/ADHD-200 Global Competition repository and are available at http://preprocessed-connectomes-project.org/adhd200/ in accordance with the repository’s terms of use. The derived data generated in this study (e.g., dynamic functional connectivity sequences and graph-derived features) and implementation details are available from the corresponding author upon reasonable request.

Conflicts of Interest

The authors declare no conflicts of interest.

References

  1. Drechsler, R.; Brem, S.; Brandeis, D.; Grünblatt, E.; Berger, G.; Walitza, S. ADHD: Current concepts and treatments in children and adolescents. Neuropediatrics 2020, 51, 315–335. [Google Scholar] [CrossRef]
  2. Smith, S.M. Overview of fMRI analysis. Br. J. Radiol. 2004, 77, S167–S175. [Google Scholar] [CrossRef] [PubMed]
  3. Atasoy, S.; Donnelly, I.; Pearson, J. Human brain networks function in connectome-specific harmonic waves. Nat. Commun. 2016, 7, 10340. [Google Scholar] [CrossRef] [PubMed]
  4. Kim, M.; Bao, J.; Liu, K.; Park, B.Y.; Park, H.; Baik, J.Y.; Shen, L. A structural enriched functional network: An application to predict brain cognitive performance. Med. Image Anal. 2021, 71, 102026. [Google Scholar] [CrossRef] [PubMed]
  5. Menon, S.S.; Krishnamurthy, K. A comparison of static and dynamic functional connectivities for identifying subjects and biological sex using intrinsic individual brain connectivity. Sci. Rep. 2019, 9, 5729. [Google Scholar] [CrossRef]
  6. Chen, Y.; Tang, Y.; Wang, C.; Liu, X.; Zhao, L.; Wang, Z. ADHD classification by dual subspace learning using resting-state functional connectivity. Artif. Intell. Med. 2020, 103, 101786. [Google Scholar] [CrossRef]
  7. Yao, D.; Sui, J.; Wang, M.; Yang, E.; Jiaerken, Y.; Luo, N.; Yap, P.T.; Liu, M.; Shen, D. A mutual multi-scale triplet graph convolutional network for classification of brain disorders using functional or structural connectivity. IEEE Trans. Med. Imaging 2021, 40, 1279–1289. [Google Scholar] [CrossRef]
  8. Ji, J.; Ye, C.; Yang, C. Convolutional bidirectional GRU for dynamic functional connectivity classification in brain diseases diagnosis. Knowl.-Based Syst. 2024, 287, 111450. [Google Scholar] [CrossRef]
  9. Leonardi, N.; Van De Ville, D. On spurious and real fluctuations of dynamic functional connectivity during rest. Neuroimage 2015, 104, 430–436. [Google Scholar] [CrossRef]
  10. Aggarwal, P.; Gupta, A. Multivariate graph learning for detecting aberrant connectivity of dynamic brain networks in autism. Med. Image Anal. 2019, 56, 11–25. [Google Scholar] [CrossRef]
  11. Dumkrieger, G.; Chong, C.D.; Ross, K.; Berisha, V.; Schwedt, T.J. Static and dynamic functional connectivity differences between migraine and persistent post-traumatic headache: A resting-state magnetic resonance imaging study. Cephalalgia 2019, 39, 1366–1381. [Google Scholar] [CrossRef] [PubMed]
  12. Zhang, L.; Wang, L.; Zhu, D. Recovering brain structural connectivity from functional connectivity via multi-gcn based generative adversarial network. In Proceedings of the International Conference on Medical Image Computing and Computer-Assisted Intervention; Springer: Berlin/Heidelberg, Germany, 2020; pp. 53–61. [Google Scholar] [CrossRef]
  13. Jie, B.; Liu, M.; Lian, C.; Shi, F.; Shen, D. Designing weighted correlation kernels in convolutional neural networks for functional connectivity based brain disease diagnosis. Med. Image Anal. 2020, 63, 101709. [Google Scholar] [CrossRef] [PubMed]
  14. Xing, X.; Li, Q.; Yuan, M.; Wei, H.; Xue, Z.; Wang, T.; Shi, F.; Shen, D. DS-GCNs: Connectome classification using dynamic spectral graph convolution networks with assistant task training. Cereb. Cortex 2021, 31, 1259–1269. [Google Scholar] [CrossRef] [PubMed]
  15. Lin, K.; Jie, B.; Dong, P.; Ding, X.; Bian, W.; Liu, M. Convolutional recurrent neural network for dynamic functional MRI analysis and brain disease identification. Front. Neurosci. 2022, 16, 933660. [Google Scholar] [CrossRef]
  16. Gaub, M.; Carlson, C.L. Gender differences in ADHD: A meta-analysis and critical review. J. Am. Acad. Child Adolesc. Psychiatry 1997, 36, 1036–1045. [Google Scholar] [CrossRef]
  17. Riaz, A.; Asad, M.; Alonso, E.; Slabaugh, G. Fusion of fMRI and non-imaging data for ADHD classification. Comput. Med. Imaging Graph. 2018, 65, 115–128. [Google Scholar] [CrossRef]
  18. dos Santos Siqueira, A.; Biazoli Junior, C.E.; Comfort, W.E.; Rohde, L.A.; Sato, J.R. Abnormal functional resting-state networks in ADHD: Graph theory and pattern recognition analysis of fMRI data. BioMed Res. Int. 2014, 2014, 380531. [Google Scholar] [CrossRef]
  19. Rezaei, M.; Zare, H.; Hakimdavoodi, H.; Nasseri, S.; Hebrani, P. Classification of drug-naive children with attention-deficit/hyperactivity disorder from typical development controls using resting-state fMRI and graph theoretical approach. Front. Hum. Neurosci. 2022, 16, 948706. [Google Scholar] [CrossRef]
  20. Hu, Y.; Ran, J.; Qiao, R.; Xu, J.; Tan, C.; Hu, L.; Tian, Y. Identifying ADHD-Related Abnormal Functional Connectivity with a Graph Convolutional Neural Network. Neural Plast. 2024, 2024, 8862647. [Google Scholar] [CrossRef]
  21. Kawahara, J.; Brown, C.J.; Miller, S.P.; Booth, B.G.; Chau, V.; Grunau, R.E.; Zwicker, J.G.; Hamarneh, G. BrainNetCNN: Convolutional neural networks for brain networks; towards predicting neurodevelopment. NeuroImage 2017, 146, 1038–1049. [Google Scholar] [CrossRef]
  22. Rubinov, M.; Sporns, O. Complex network measures of brain connectivity: Uses and interpretations. Neuroimage 2010, 52, 1059–1069. [Google Scholar] [CrossRef]
  23. Zhu, Z.; Wang, H.; Bi, H.; Lv, J.; Zhang, X.; Wang, S.; Zou, L. Dynamic functional connectivity changes of resting-state brain network in attention-deficit/hyperactivity disorder. Behav. Brain Res. 2023, 437, 114121. [Google Scholar] [CrossRef] [PubMed]
  24. Hansen, J.Y.; Cauzzo, S.; Singh, K.; García-Gomar, M.G.; Shine, J.M.; Bianciardi, M.; Misic, B. Integrating brainstem and cortical functional architectures. Nat. Neurosci. 2024, 27, 2500–2511. [Google Scholar] [CrossRef] [PubMed]
  25. Chen, Y.; Su, W.; Gui, C.F.; Guo, Q.F.; Tan, H.X.; He, L.; Jiang, H.H.; Wei, Q.C.; Gao, Q. Effectiveness of cerebellar vermis intermittent theta-burst stimulation in improving trunk control and balance function for patients with subacute stroke: A randomised controlled trial protocol. BMJ Open 2023, 13, e066356. [Google Scholar] [CrossRef] [PubMed]
  26. Achard, S.; Bullmore, E. Efficiency and cost of economical brain functional networks. PLoS Comput. Biol. 2007, 3, e17. [Google Scholar] [CrossRef]
  27. Latora, V.; Marchiori, M. Efficient behavior of small-world networks. Phys. Rev. Lett. 2001, 87, 198701. [Google Scholar] [CrossRef]
  28. Graves, A. Long short-term memory. In Supervised Sequence Labelling with Recurrent Neural Networks; Springer: Berlin/Heidelberg, Germany, 2012; pp. 37–45. [Google Scholar] [CrossRef]
  29. Fan, B.; Xie, L.; Yang, S.; Wang, L.; Soong, F.K. A deep bidirectional LSTM approach for video-realistic talking head. Multimed. Tools Appl. 2016, 75, 5287–5309. [Google Scholar] [CrossRef]
  30. Kotsiantis, S.B.; Zaharakis, I.D.; Pintelas, P.E. Machine learning: A review of classification and combining techniques. Artif. Intell. Rev. 2006, 26, 159–190. [Google Scholar] [CrossRef]
  31. Bellec, P.; Chu, C.; Chouinard-Decorte, F.; Benhajali, Y.; Margulies, D.S.; Craddock, R.C. The Neuro Bureau ADHD-200 Preprocessed repository. NeuroImage 2017, 144, 275–286. [Google Scholar] [CrossRef]
  32. Gao, M.S.; Tsai, F.S.; Lee, C.C. Learning a phenotypic-attribute attentional brain connectivity embedding for ADHD classification using rs-fMRI. In Proceedings of the 2020 42nd Annual International Conference of the IEEE Engineering in Medicine & Biology Society (EMBC), 20–20 July 2020; IEEE: Piscataway, NJ, USA, 2020; pp. 5472–5475. [Google Scholar] [CrossRef]
  33. Qiang, N.; Dong, Q.; Liang, H.; Ge, B.; Zhang, S.; Zhang, C.; Gao, J.; Sun, Y. A novel ADHD classification method based on resting state temporal templates (RSTT) using spatiotemporal attention auto-encoder. Neural Comput. Appl. 2022, 34, 7815–7833. [Google Scholar] [CrossRef]
  34. Pei, S.; Wang, C.; Cao, S.; Lv, Z. Data augmentation for fMRI-based functional connectivity and its application to cross-site ADHD classification. IEEE Trans. Instrum. Meas. 2022, 72, 2501015. [Google Scholar] [CrossRef]
  35. Shao, L.; Zhang, D.; Du, H.; Fu, D. Deep forest in ADHD data classification. IEEE Access 2019, 7, 137913–137919. [Google Scholar] [CrossRef]
  36. Ronca, V.; Brambati, F.; Napoletano, L.; Marx, C.; Trösterer, S.; Vozzi, A.; Aricò, P.; Giorgi, A.; Capotorto, R.; Borghini, G.; et al. A Novel EEG-Based Assessment of Distraction in Simulated Driving under Different Road and Traffic Conditions. Brain Sci. 2024, 14, 193. [Google Scholar] [CrossRef]
Figure 1. Multimodal fusion framework process flow.
Mathematics 14 00851 g001
Figure 2. Illustration of static functional connections and dynamic functional connections.
Mathematics 14 00851 g002
Figure 3. Brain node clustering visualization graph.
Mathematics 14 00851 g003
Figure 4. Calculation results of meso-centrality.
Mathematics 14 00851 g004
Figure 5. Model classification accuracy with different window sizes and step sizes.
Mathematics 14 00851 g005
Figure 6. Representative brain regions associated with the attention network and sensorimotor network (AAL-116).
Mathematics 14 00851 g006
Figure 7. Visualization of representative brain regions associated with the attention network and sensorimotor network (AAL-116).
Mathematics 14 00851 g007
Table 1. Brain network partitioning.
Module NameCorresponding AAL Template Regions (Selected Representative Regions)
Sensorimotor Network (SMN)Right Supplementary Motor Area, Bilateral Precentral Gyrus, Postcentral Gyrus, Superior Parietal Lobule, Superior Parietal Gyrus, Supramarginal Gyrus, Insula, Superior Temporal Gyrus, Heschl’s Gyrus
Visual Network (VN)Bilateral Superior, Middle, and Inferior Occipital Gyrus, Cuneus, Calcarine Sulcus, Fusiform Gyrus, Lingual Gyrus
Attention Network (AN)Bilateral Middle, Inferior, and Superior Frontal Gyrus, Angular Gyrus, Inferior Parietal Lobule
Default Mode Network (DMN)Bilateral Anterior Cingulate, Medial Superior Frontal Gyrus, Posterior Cingulate, Precuneus, Middle Temporal Gyrus
Subcortical Network (SN)Bilateral Parahippocampal Gyrus, Hippocampus, Amygdala, Temporal Pole, Olfactory Cortex, Thalamus, Caudate Nucleus, Putamen, Pallidum
Table 2. Description of rs-fMRI datasets.
SITEADHDTD
Age (Year)Gender (M/F)TotalAge (Year)Gender (M/F)Total
Peking11.63 ± 2.9475/118611.12 ± 2.5375/57132
KKI11.60 ± 2.8920/82811.41 ± 3.1734/2559
NYU11.67 ± 3.1890/3112112.19 ± 3.0148/4896
Total11.62 ± 3.02185/5023511.89 ± 3.26157/130287
Table 3. Local efficiency (LE) differences across brain regions.
Brain Region Δ LE (Group A) Δ LE (Group B) Δ LE (Group C) Δ LE (Group D)
SMN0.0864603010.0443203870.157172520.14212616
AN0.2301821780.0090304090.1777582710.120759675
SN0.0106504970.0982860240.0508791750.047869947
Table 4. Computational time of each module in the proposed framework.
ModuleProcessing StepTime (s)
Static FC (sFC)Static FC computation0.025
CNN feature extraction0.464
Attention-based fusion0.009
Dynamic FC (dFC)Sliding-window & graph metrics6.309
BiLSTM autoencoder training2.212
BiLSTM feature extraction + PCA25.817
Feature aggregation0.000
ClassifierVoting classifier training & inference5.690
Note: The reported computational time corresponds to the average runtime for processing a single subject, including both feature extraction and classification stages. All experiments were conducted on the same hardware platform to ensure fair comparison. The results indicate that the dynamic functional connectivity (dFC) module is the most time-consuming component, mainly due to the BiLSTM-based feature extraction, while the static functional connectivity (sFC) module is computationally efficient.
Table 5. Comparison of data source and phenotype integration.
WorkData SourcePhenotype Integration
[19]rs-fMRI → FCNot considered
[32]rs-fMRI → FCYes
[33]rs-fMRINot considered
[34]rs-fMRI → FCNot considered
[35]rs-fMRINot considered
This workrs-fMRI → sFC & dFCYes
Table 6. Comparison of static/dynamic FC modeling.
WorkStatic FC ModelingDynamic FC Modeling
[19]Graph metricsNot considered
[32]Attention embeddingNot considered
[33]Not modeledAttention autoencoder
[34]Deep FC featuresWindow-based FC
[35]Handcrafted FC + ALFFNot considered
This workCNN multi-scaleBiLSTM + graph metrics
Table 7. Comparison of static–dynamic fusion strategies.
WorkStatic–Dynamic Fusion StrategyNotes
[19]No fusionsFC only
[32]No fusionsFC only
[33]No interactionOnly temporal modeling
[34]Late fusion/implicitNo explicit cross-scale dependency
[35]No fusionShallow classifier
This workBidirectional cross-attentionExplicit mutual conditioning
Table 8. Classification performance of baseline and ablation variants.
MethodAccuracy (%)Sensitivity (%)Specificity (%)AUC (%)BAC (%)
Baseline86.3681.8290.9185.9586.36
A73.9191.6754.5587.8873.11
B68.18100.0036.3685.1268.18
C77.2772.7381.8285.9577.27
D72.73100.0045.4588.4372.73
E65.2266.6763.6472.7365.15
F69.5745.4591.6769.7068.56
Table 9. Categorization performance of the proposed framework across sites.
SiteAccuracy (%)Sensitivity (%)Specificity (%)AUC (%)AUC (95% CI)BAC (%)
NYU83.2070.4598.5079.6079.60 [60.50, 83.10]84.48
PK85.4088.2082.1092.1092.10 [65.40, 80.20]85.15
KKI88.7078.3098.9094.5094.50 [67.10, 82.40]88.60
Table 10. Comparison of classification accuracy across sites and methods.
SiteProposed FrameworkLiterature [19]Literature [32]Literature [33]Literature [34]Literature [35]
NYU85.0076.4282.2073.0073.17
PK86.9678.2078.4375.5074.7064.87
KKI90.9194.5476.6075.30
Disclaimer/Publisher’s Note: The statements, opinions and data contained in all publications are solely those of the individual author(s) and contributor(s) and not of MDPI and/or the editor(s). MDPI and/or the editor(s) disclaim responsibility for any injury to people or property resulting from any ideas, methods, instructions or products referred to in the content.