1. Introduction
The microstructure of iron ore pellets is a direct manifestation of the pelletizing process conditions and serves as a critical indicator for assessing process stability and rationality; its structural characteristics exert a decisive influence on the mechanical and metallurgical properties of the pellets [
1]. Inadequate process control readily leads to the formation of laminated or grape-like agglomerated structures within pellets, the former being primarily caused by non-uniform densification during balling, while the latter is closely associated with elevated contents of FeO and silicate liquid phases. Such structures typically originate from poor green pellet quality, excessive recycling ratios, overly high roasting temperatures, or FeO enrichment induced by a reducing atmosphere, all of which promote liquid-phase formation and enhance interparticle bonding [
2]. In contrast, under appropriate process conditions, the oxidation of Fe
3O
4 to Fe
2O
3 proceeds uniformly throughout the pellet, leading to the formation of a dense and interconnected structure between newly formed and primary Fe
2O
3 grains, thereby markedly enhancing pellet strength [
3]. Owing to substantial differences among iron mineral phases in crystal structure, oxygen diffusivity, and reaction activity, their relative proportions directly govern the oxidation behavior, reduction kinetics, and strength stability of the pellets; consequently, accurate segmentation and quantitative analysis of hematite and magnetite based on microscopic images constitute a crucial step toward understanding pellet metallurgical performance and optimizing roasting process parameters [
4]. Furthermore, quantitative microstructural descriptors such as grain size, phase boundary area, pore structure, and connectivity can be employed not only to characterize pellet performance but also as key inputs for performance prediction models, contributing to improved predictive accuracy and deeper insights into pellet behavior during blast furnace and direct reduction processes [
5,
6,
7,
8,
9].
In recent years, a variety of methods have been proposed for the segmentation of microscopic images of iron ore pellet microstructures, and notable progress has been achieved. Early studies primarily employed traditional image processing techniques, such as Otsu thresholding and morphological operations, to segment mineral phases and pores; however, these methods are highly dependent on image quality and are sensitive to illumination conditions, polishing states, and grayscale variations, making them difficult to apply to complex or low-contrast mineral phases [
10]. With the development of deep learning, convolutional neural network-based semantic segmentation models, including PSPNet, FC-DenseNet, and DeepLabv3, have been introduced into pellet microscopic image analysis and have achieved relatively high segmentation accuracy in automated microstructural recognition; nevertheless, limitations remain in handling complex boundaries, identifying small-scale defects, and achieving robust cross-sample generalization [
11]. To improve model efficiency and practical applicability, some studies have enhanced the U-Net architecture by incorporating lightweight encoders, depthwise separable convolutions, and attention mechanisms, achieving certain improvements in the segmentation of bonded regions and microstructural defects; however, the recognition of highly agglomerated structures and latent defects remains constrained [
12]. In addition, segmentation results from microscopic images have been applied to pellet performance prediction or combined with three-dimensional microscopic imaging for mineral phase and pore structure reconstruction; although progress has been made in prediction accuracy and structural characterization, model performance is still limited by factors such as image quality, data scale, and acquisition cost [
13,
14].
From the perspective of methodological development, traditional image segmentation approaches have largely relied on grayscale analysis to accomplish region partitioning [
15] or employed threshold-based methods for target extraction [
16], often in combination with wavelet transforms to enhance texture feature representation [
17,
18]. To improve segmentation stability, some studies have introduced clustering methods to group pixels [
19,
20] or adopted support vector machines for supervised classification [
21]; however, when image structures become complex or boundaries are blurred, the feature representation capability based on pixel-level contrast remains limited [
22]. In recent years, advances in convolutional neural networks have driven major breakthroughs in image segmentation, with fully convolutional networks enabling pixel-level prediction through end-to-end architectures and effectively enhancing the representation of deep semantic features [
23,
24]. Building upon this foundation, U-Net introduced an encoder–decoder architecture with skip connections to achieve multi-scale feature fusion, demonstrating outstanding performance in materials and industrial image segmentation tasks [
25]. In terms of model architecture optimization, researchers have enhanced feature extraction capability by incorporating high-quality backbones such as VGG16 into the U-Net encoder, leading to improvements in detail recovery and small-scale target recognition [
26]; meanwhile, the integration of transfer learning strategies can further improve model generalization under limited data conditions [
27], and multi-weight fusion U-Net-backbone structures have also been shown to enhance overall segmentation accuracy [
28]. In addition, loss function design plays a critical role in segmentation performance: composite loss functions have demonstrated superior performance across various segmentation tasks [
29], and improved loss functions targeting class imbalance and boundary ambiguity have also achieved notable results [
30]. To further strengthen structural constraints, the introduction of shape-consistency or boundary-aware loss functions can further improve segmentation performance for complex structures [
31,
32]. To further enhance the stability and generalization ability of the model, relevant research on probability distribution modeling and robustness design can be referenced. Chunpeng Wang et al. improved the robustness against geometric attacks by modeling image information distributions and employing stable embedding and extraction mechanisms [
33]. A similar approach can be applied to semantic segmentation tasks by introducing a distribution constraint based on KL divergence to enhance the model’s resistance to disturbances.
The microstructure of iron ore pellets is highly complex, involving multiphase coexistence [
34], morphological heterogeneity [
35], and mechanical differences among mineral phases [
36]. These characteristics make it difficult for conventional image segmentation methods to handle complex regions accurately. In microscopic images of roasted pellets, multiple constituents—including magnetite, hematite, silicates, slag, and pores—are distributed in a spatially non-uniform manner [
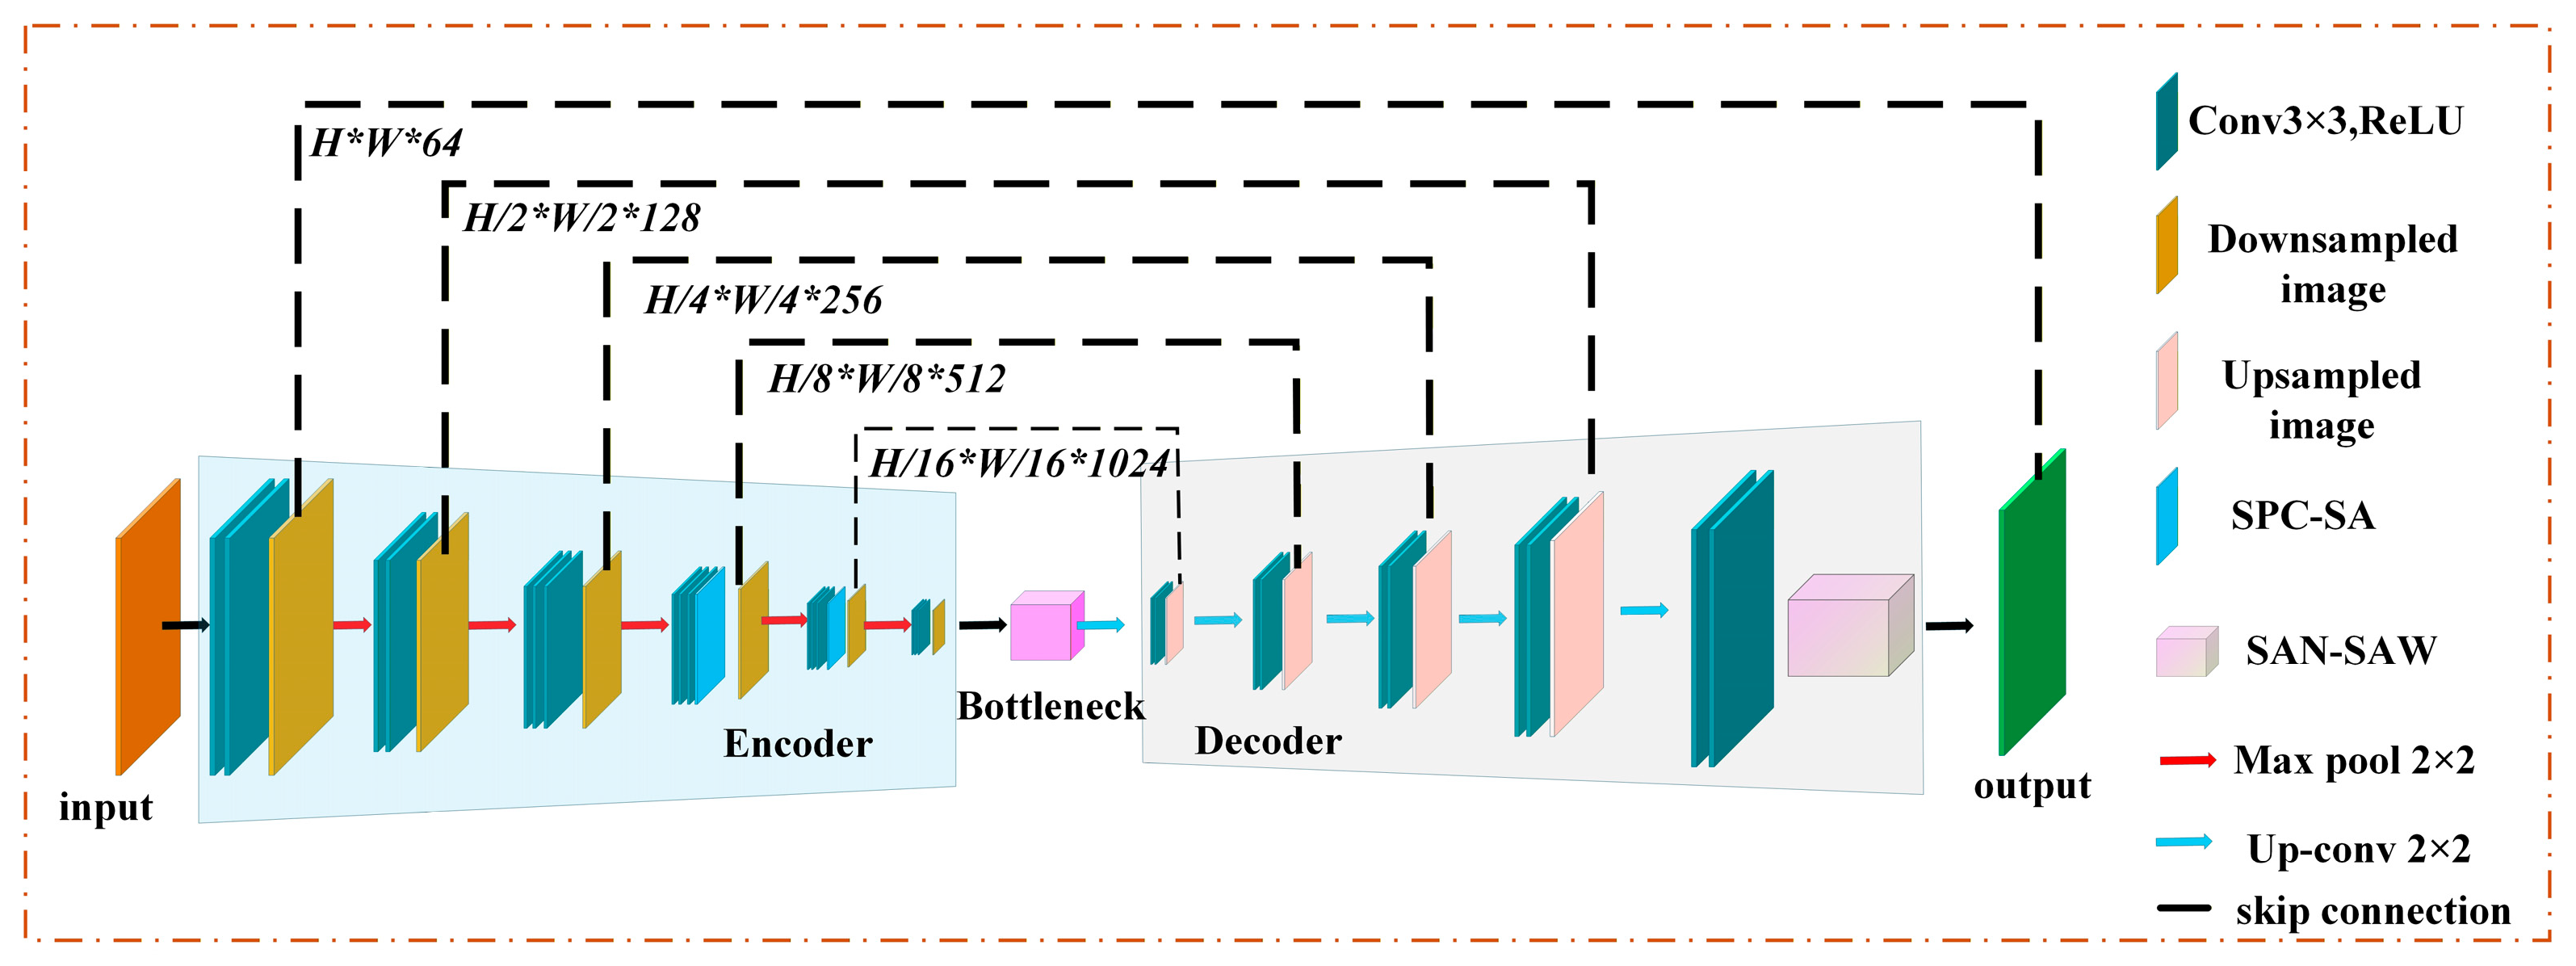
10], which poses additional challenges for reliable segmentation. To address the limitations of existing methods in complex-structure scenarios, this study proposes a hybrid intelligent optimization-based VGG16-U-Net segmentation model that integrates SPC-SA, SAN–SAW modules, and Kullback–Leibler (KL) divergence regularization. Compared with conventional attention-based U-Net variants, the proposed model incorporates the following design elements, which contribute to performance improvements to some extent:
Multi-scale feature learning: A VGG16-U-Net encoder–decoder architecture is used to extract multi-scale features that capture both fine details and global context, which may improve segmentation in regions where magnetite is interwoven with other mineral phases.
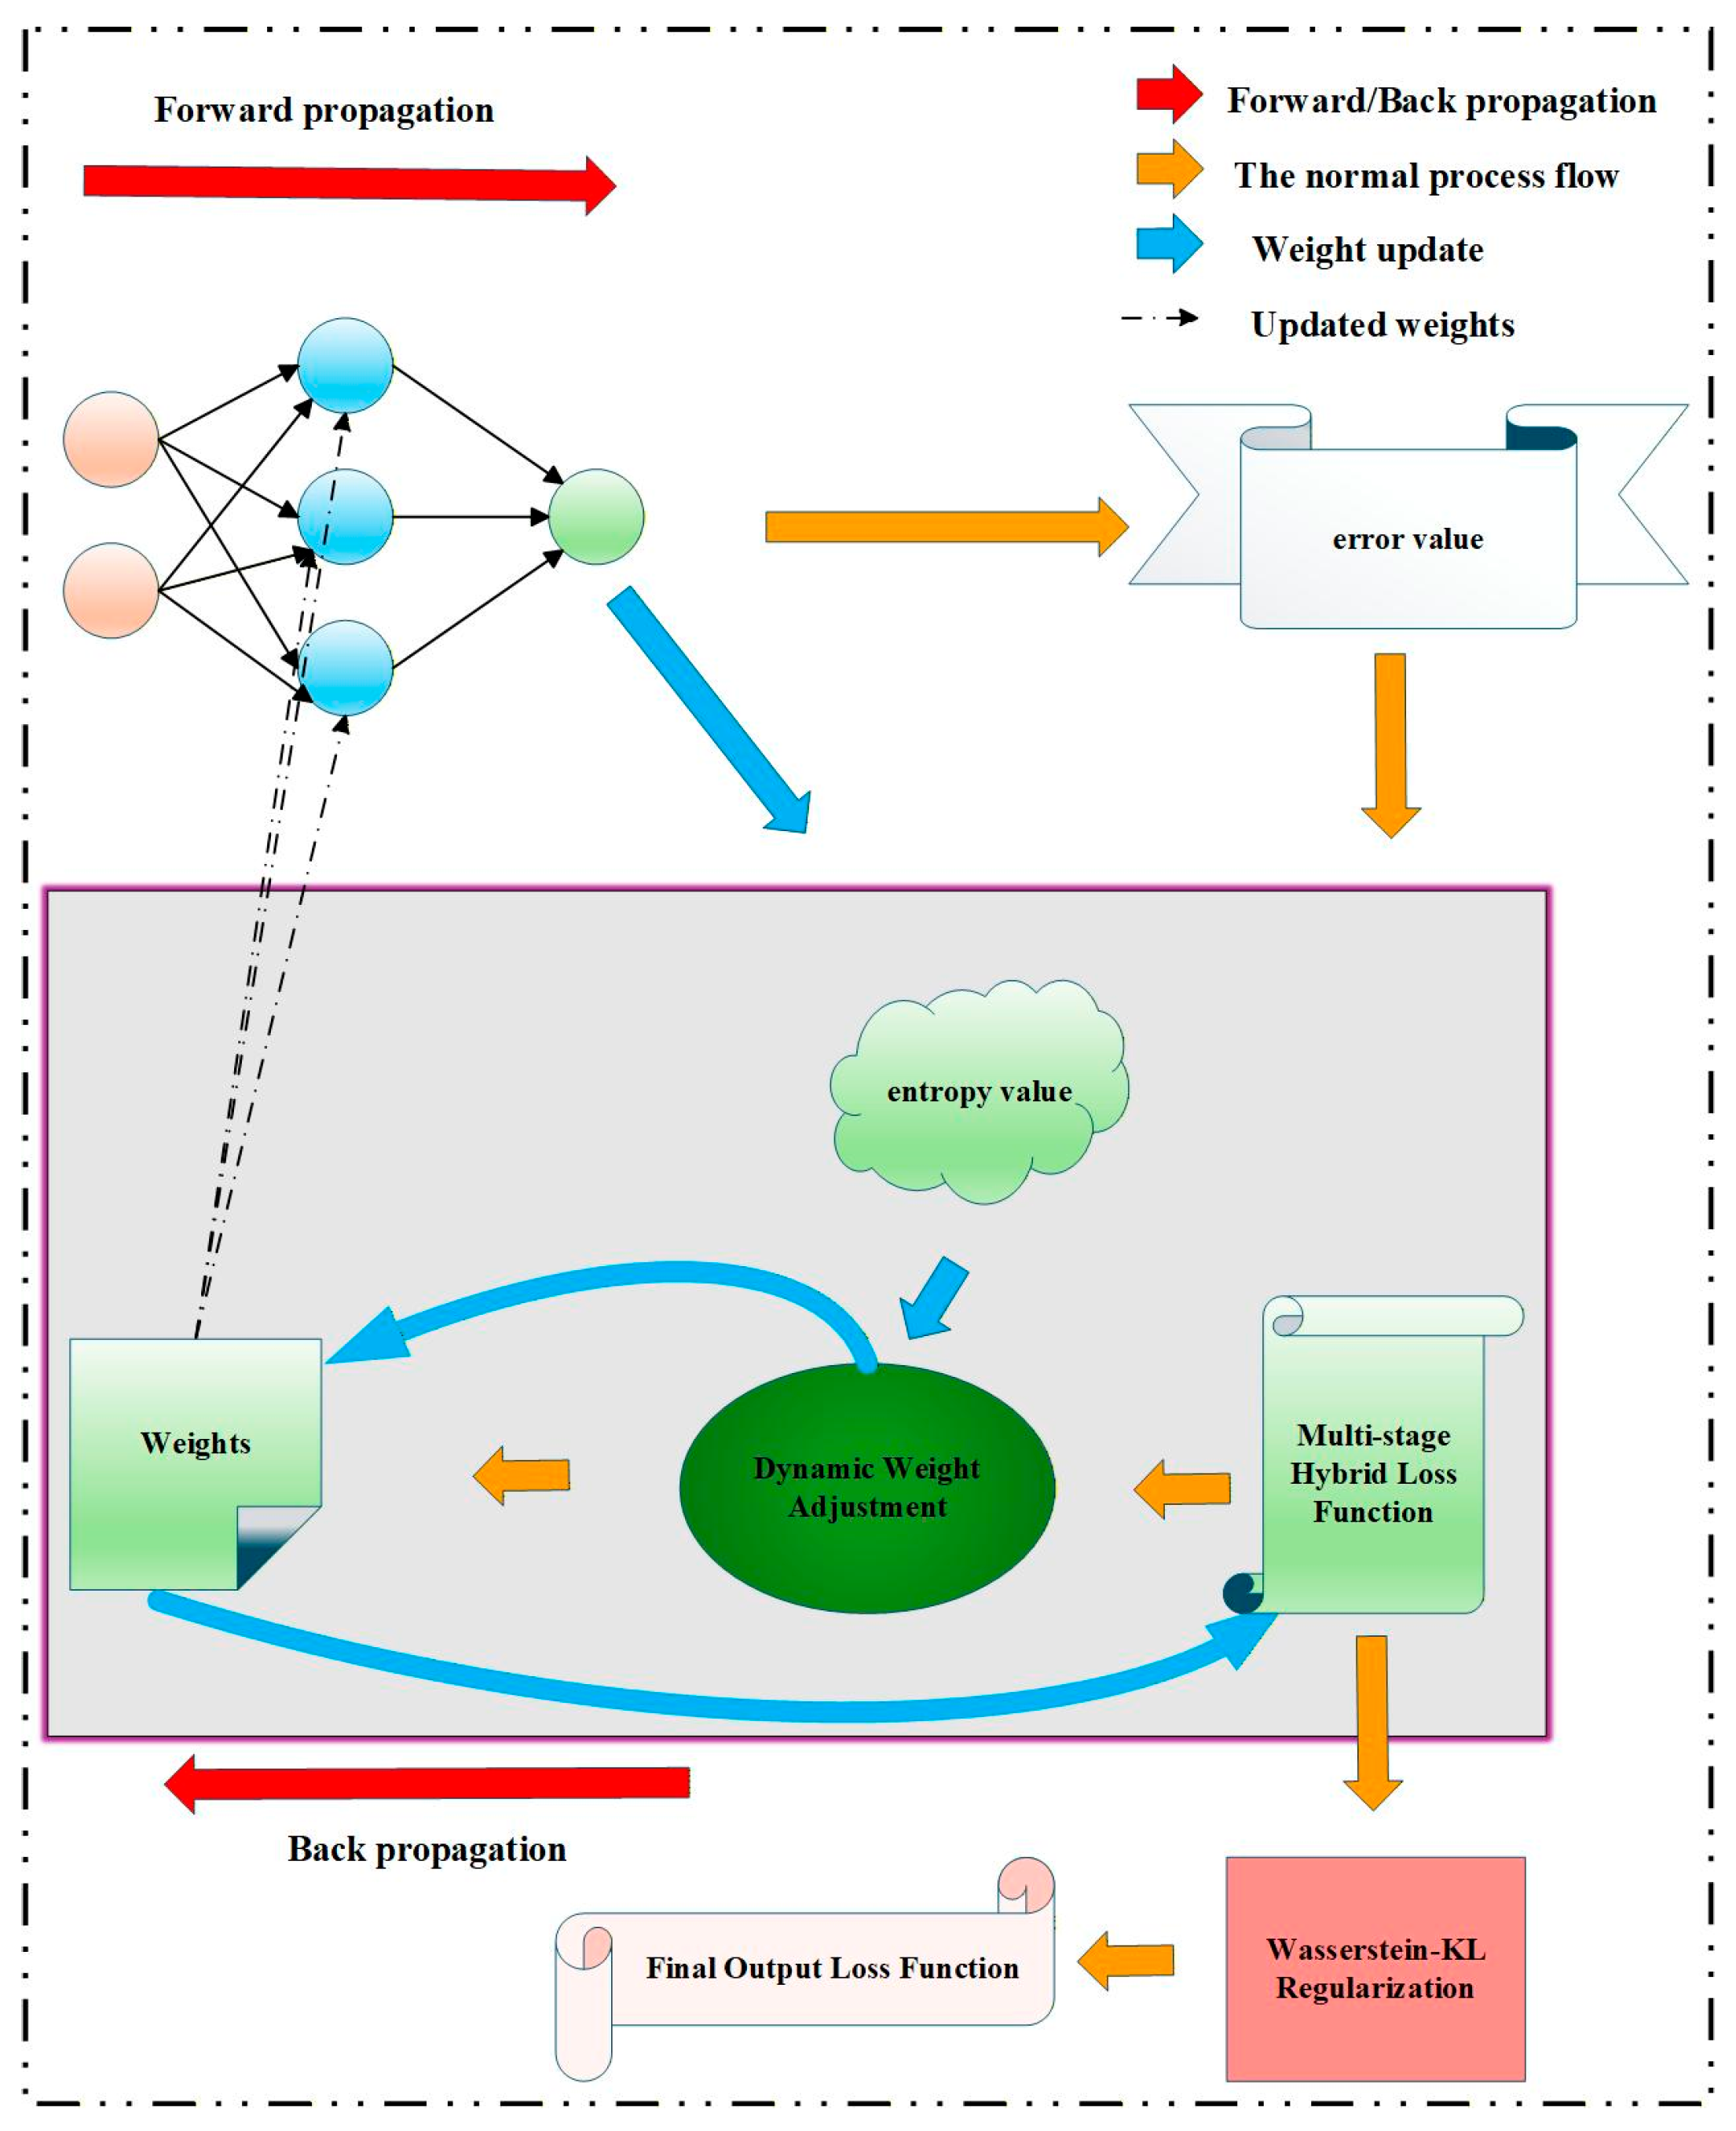
KL divergence regularization: KL divergence regularization constrains the model by dynamically shaping the output probability distribution, which may facilitate alignment across different class-specific feature spaces. Compared with entropy-based regularization, KL divergence offers an alternative way to regulate inter-class distribution alignment. In this work, a uniform distribution is adopted as the reference distribution, and the KL divergence is computed to constrain the model outputs, leading to a smoother distribution of the predicted features.
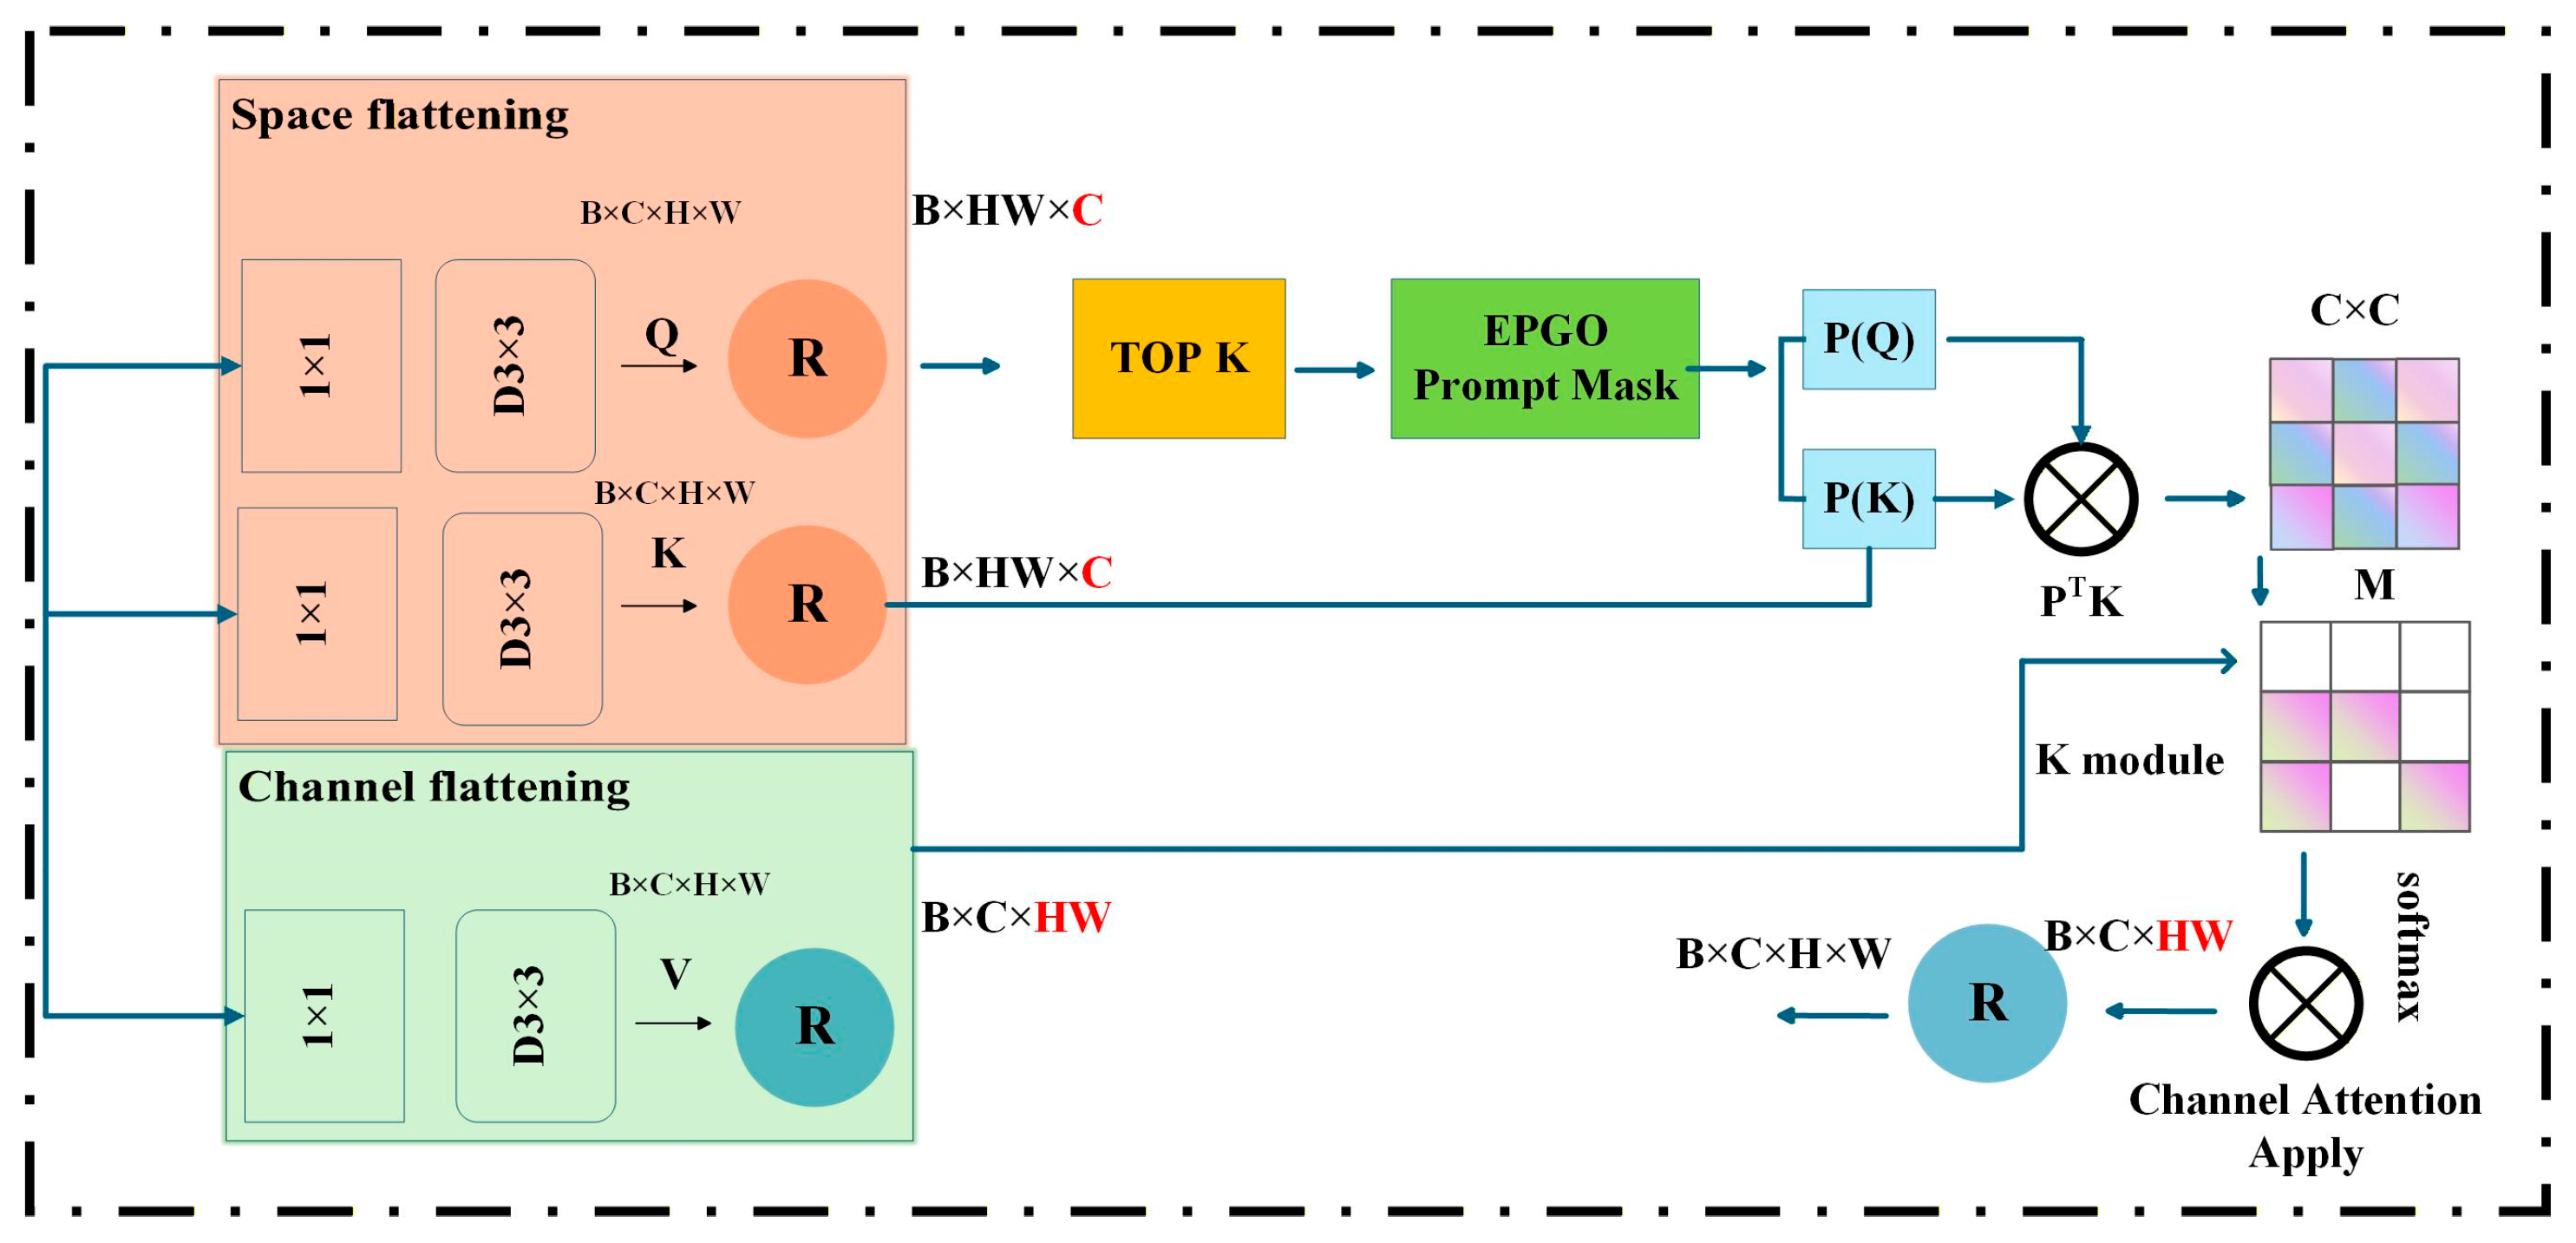
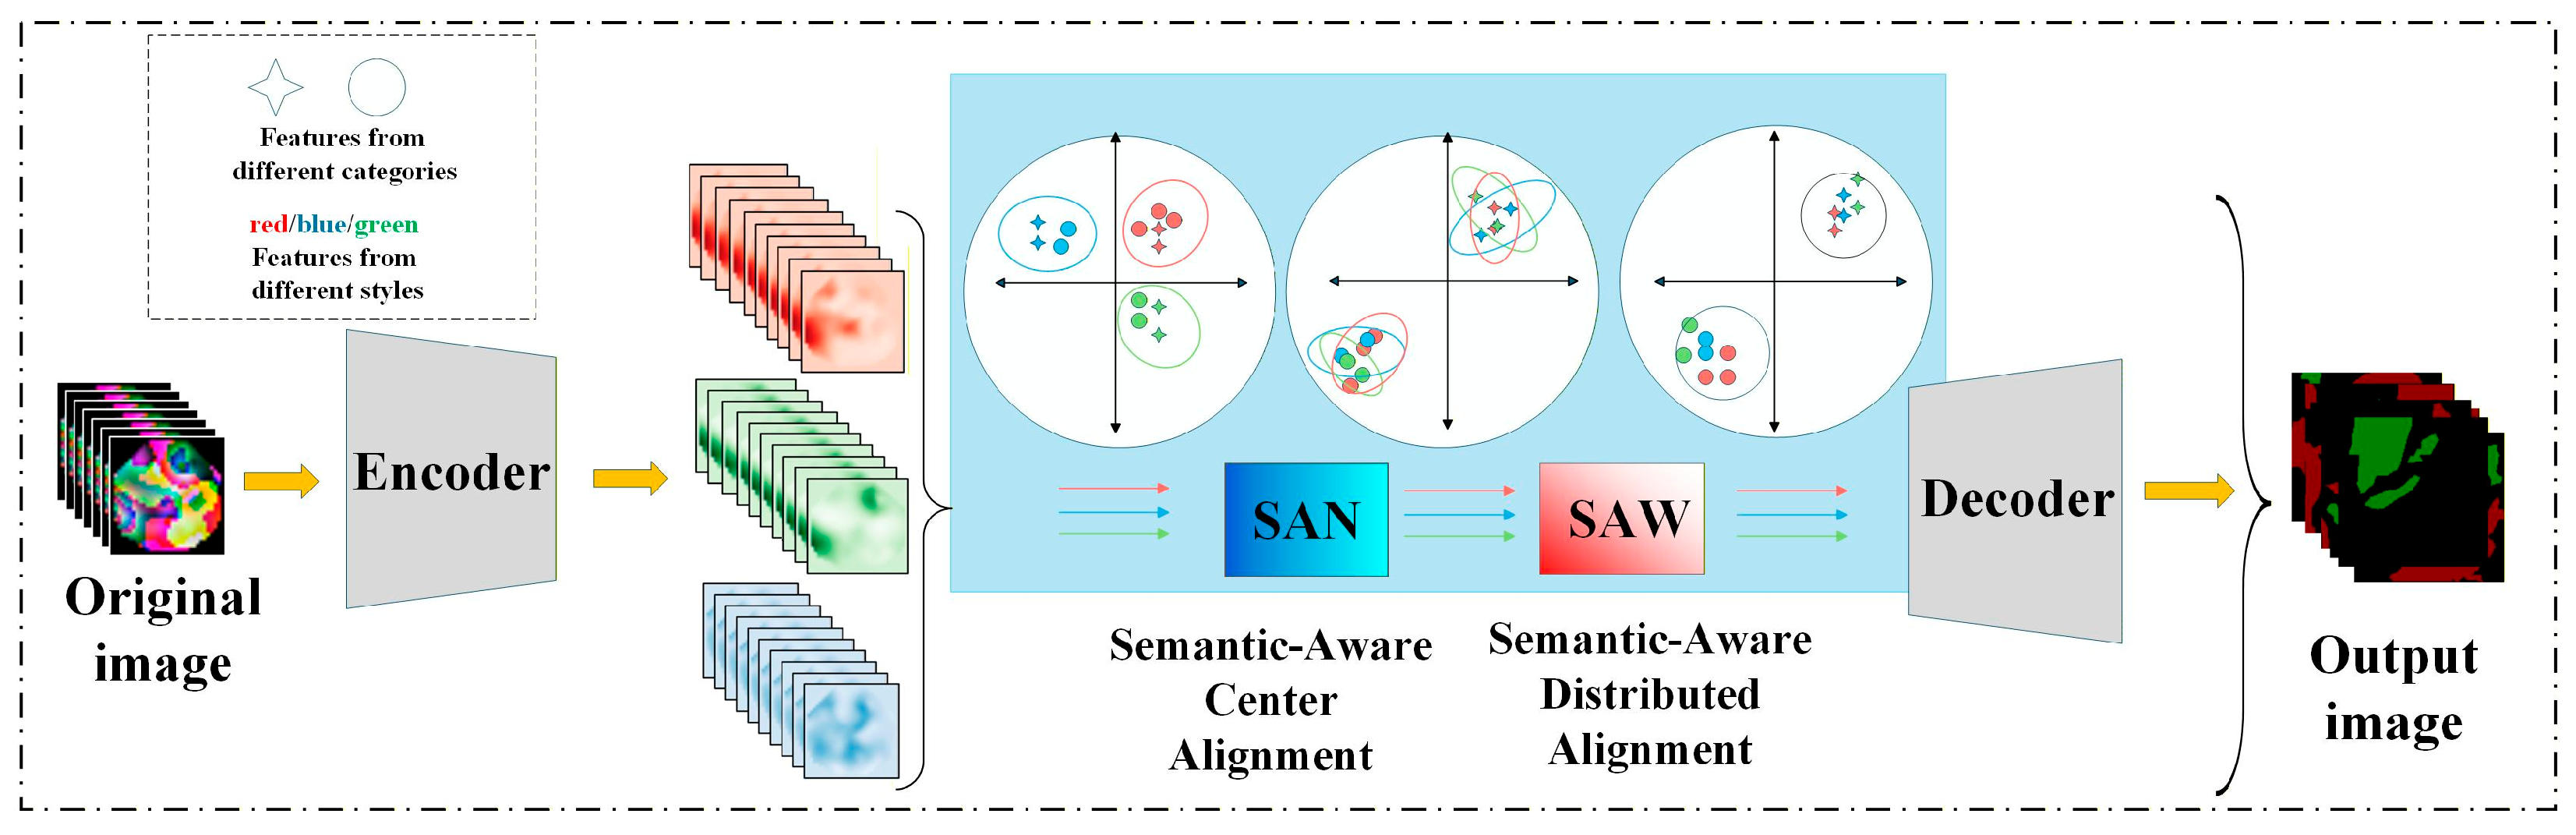
Attention mechanisms: In many existing U-Net variants, attention is often applied separately as either channel attention or spatial attention. In the proposed model, the SPC-SA module combines the Q/K/V mechanism with sparse spatial prompts (EPGO) to realize more fine-grained channel-level attention, and the self-attention formulation is intended to improve sensitivity to complex boundaries and subtle defects. To better handle complex structures and backgrounds, SAN–SAW modules are further introduced to jointly model spatial and channel attention. This design aims to strengthen feature representations in semantically sensitive regions, and a sparsity-inspired weighting scheme is used to assign higher importance to informative features, thereby contributing to performance improvements to some extent.
Comparison with existing methods: Compared with U-Net variants that employ high-quality backbones such as VGG16 [
25,
26,
27,
28], the proposed model shows improved capability in detail recovery and small-scale target recognition under our experimental settings. In addition, while many conventional approaches rely on a single attention module (either channel attention or spatial attention), the proposed model integrates multiple attention mechanisms, which may help the network capture diverse semantic structures in the images.
2. Materials and Methods
2.1. Dataset Production
Previous studies cate that hematite and magnetite are the primary mineral constituents of iron ore pellets, and their relative proportions serve as key factors influencing the pellets’ metallurgical performance. In this study, hematite and magnetite were annotated in the pellet microstructure images to support subsequent segmentation analysis.
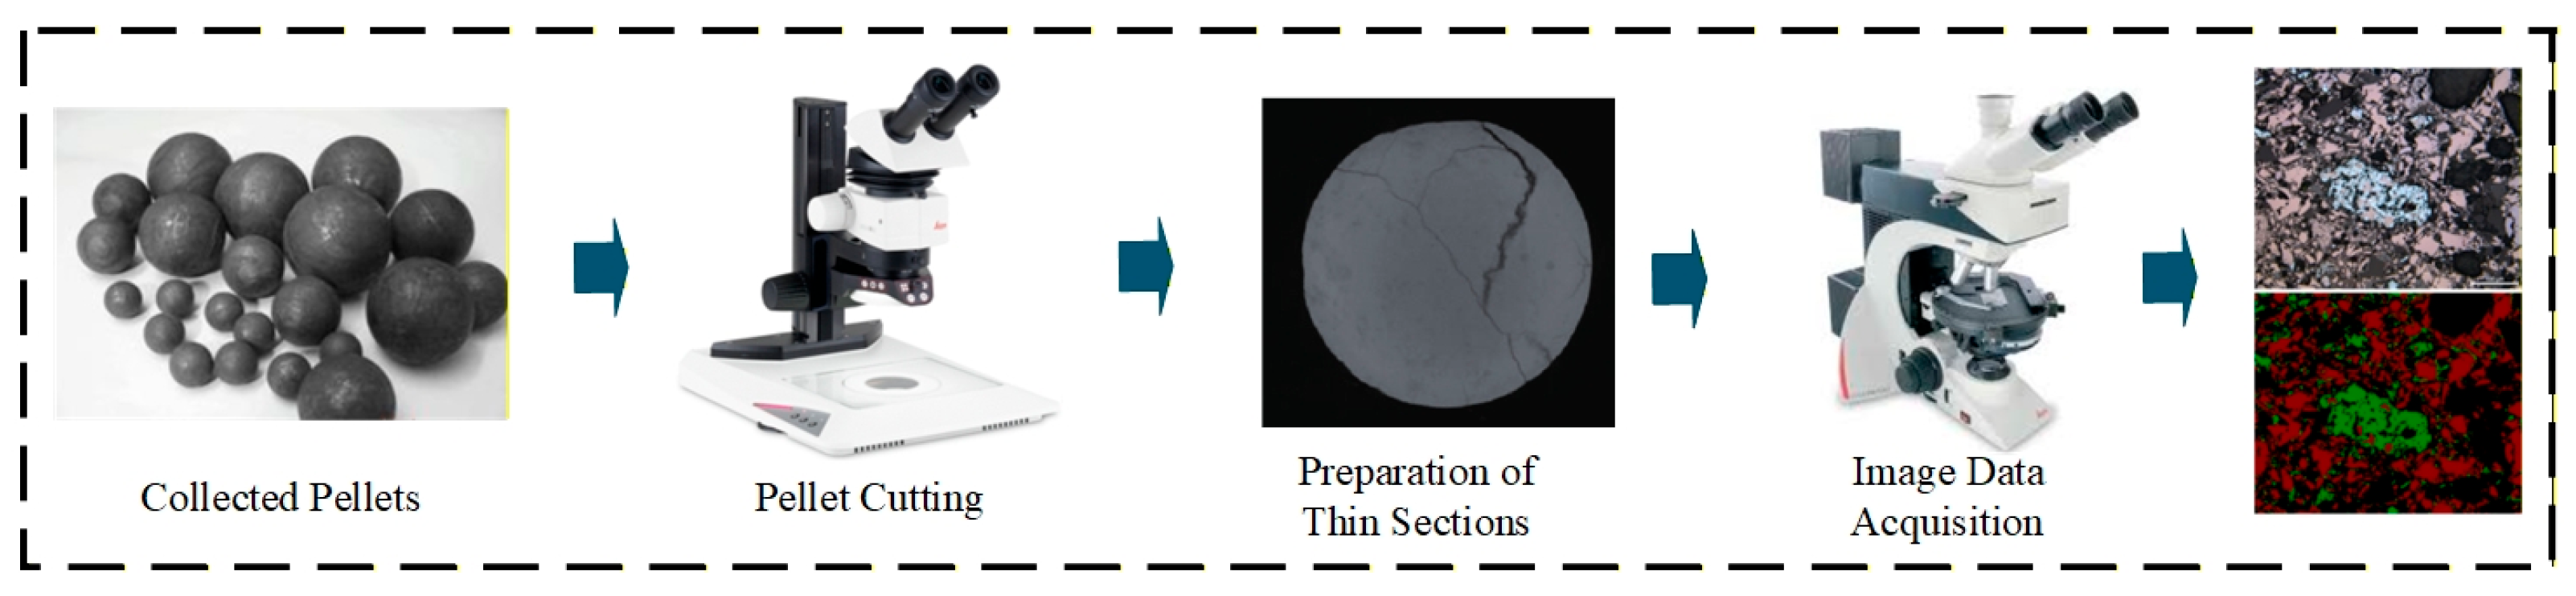
Figure 1 illustrates the workflow for producing pellet microstructure images.
In the dataset construction process of this study, the pellet samples were first screened and cleaned, ensuring the samples were intact before being labeled. Then, a Leica M80 sample preparation machine was used to cut the samples to obtain pellet cross-sections, and the thin sections were progressively ground and polished to ensure a smooth surface. Subsequently, a Leica DM4500P polarizing microscope was used for image acquisition, capturing microstructural images of the entire pellet cross-section and local mineral phases. All labeled images were annotated by a single annotator, and the annotation process strictly followed a unified annotation standard, with annotation checks performed to ensure consistency. The annotation pass rate for all images was 100%. All labeled images were annotated by a single annotator, and the annotation process strictly followed a unified annotation standard, with annotation checks performed to ensure consistency. The annotation pass rate for all images was 100%. Regarding the category distribution, the red category consists of 715,526 pixels (28.54%), the green category consists of 177,199 pixels (7.07%), and the background (black) consists of 1,614,027 pixels (64.39%). The total pixel count is 2,506,752. The final microstructural images of the pellets were obtained with a resolution of 2560 × 1920.
During the construction of the pellet microstructure semantic segmentation dataset, a
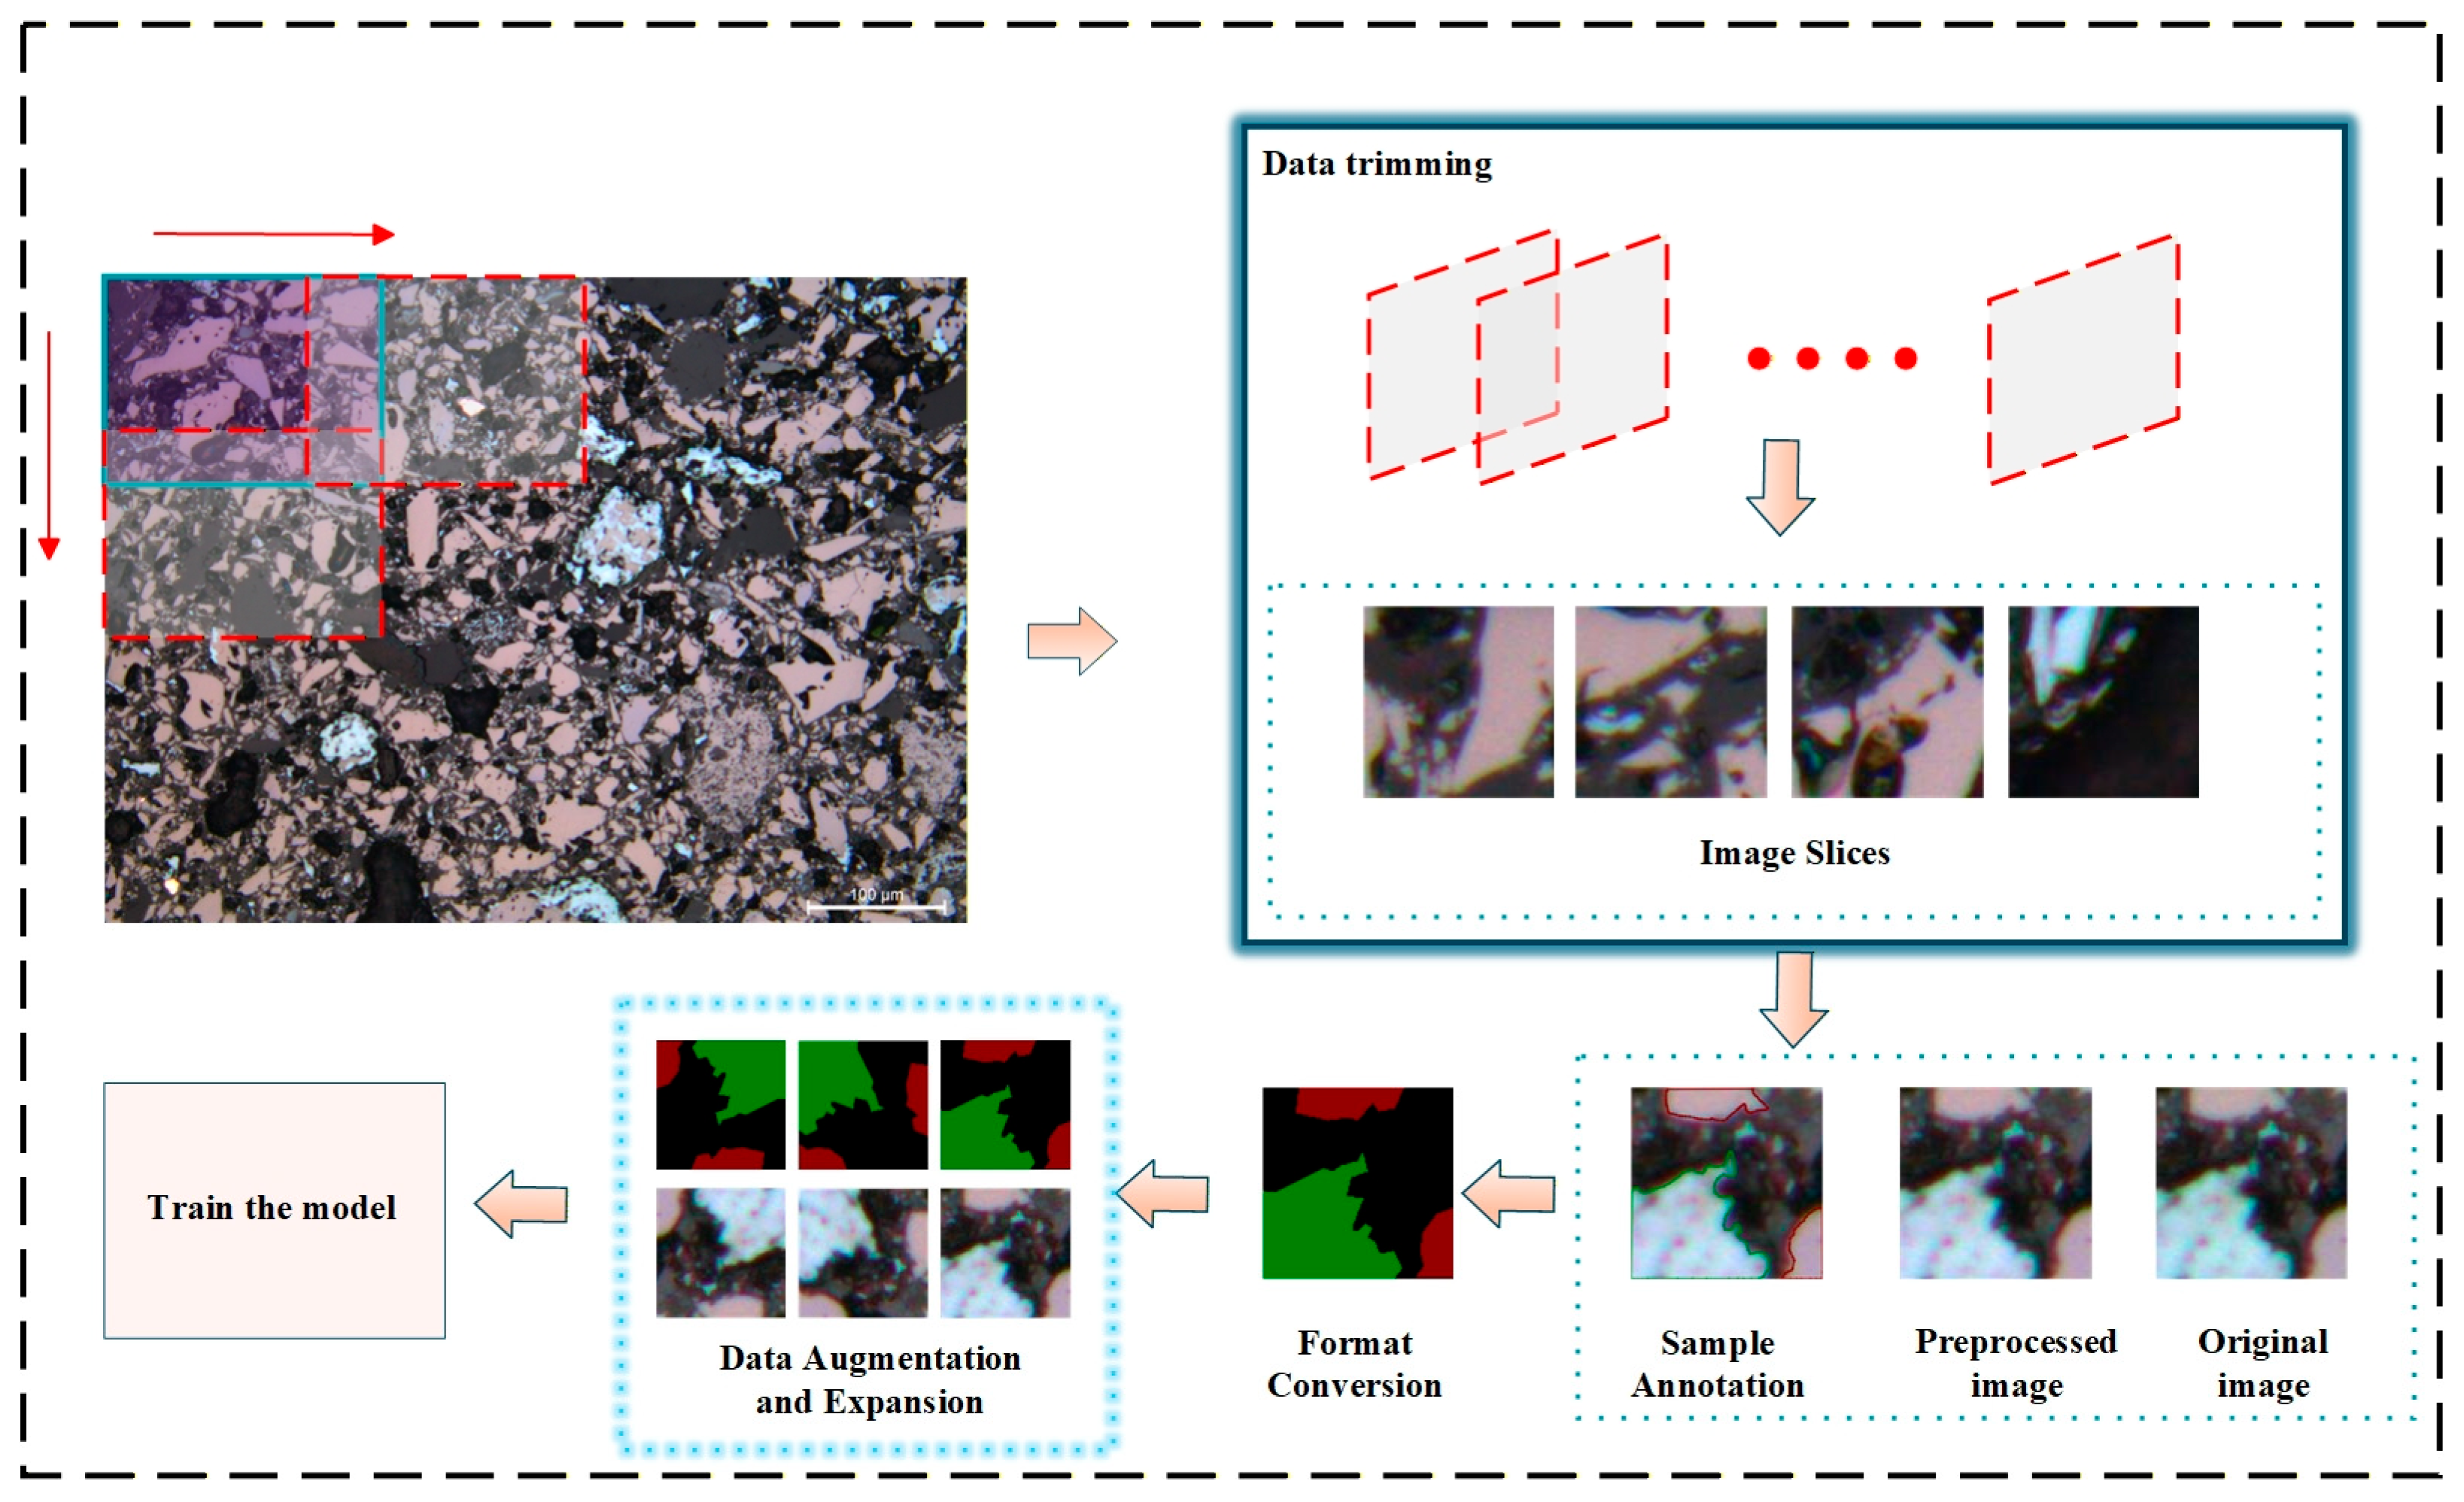
sliding window was applied to extract patches from the original images, with a stride of 128, in order to reduce the loss of boundary information caused by cropping. This setting introduces overlaps between adjacent patches in both the horizontal and vertical directions, thereby preserving boundary context without substantially increasing the number of samples. Next, to meet the annotation-quality requirements for deep learning training, Labelme was used to perform pixel-wise annotation of two target classes (hematite and magnetite), and the annotations were then converted into the required format for the semantic segmentation training framework. In total, 224 annotated images were obtained. For dataset splitting, we followed a VOC-style training and validation strategy: all annotated samples were first included in the training and validation set (without creating a separate test set), and the training and validation set was then split into training and validation subsets at a 9:1 ratio. The training set was used for parameter learning, whereas the validation set was used for performance evaluation and model selection during training. Overall, the pipeline consists of patch extraction, annotation, format conversion, dataset splitting, and training-time data augmentation; the detailed procedure is illustrated in
Figure 2.
The figure illustrates the overall pipeline for constructing the model training dataset from the original pellet mineral-phase micrographs. First, the original micrographs are cropped, and the large field-of-view images are divided into multiple fixed-size patches. The red arrows indicate the cropping direction, and the red dashed boxes represent the final cropped image patches. The patches are then preprocessed and annotated to generate the corresponding label masks. Subsequently, the images and labels are converted into the required format, and data augmentation is applied to enhance image clarity and highlight mineral-phase structural characteristics. Finally, the processed data are used for model training to enable automatic identification and segmentation of pellet mineral microstructures.
2.2. Evaluation Metrics
To comprehensively evaluate the segmentation performance of the proposed model, several mainstream metrics were employed, including overall pixel accuracy (Accuracy), mean pixel accuracy (mPA), mean intersection over union (mIoU), along with training loss (Total Loss) and validation loss (Val Loss). Specifically, Accuracy measures the overall prediction correctness across all pixels. The mPA metric reflects the model’s pixel-level recognition performance across different classes. Meanwhile, mIoU evaluates segmentation accuracy based on the overlap ratio between the predicted regions and the ground-truth regions. In addition, Total Loss and Val Loss are used to monitor the model’s fitting behavior during training and its generalization capability during validation, respectively. The corresponding calculation formulas are as follows:
denotes the number of pixels that belong to class i and are predicted as class i; represents the number of pixels that belong to class i but are misclassified as class j; and respectively denote the ground-truth pixel set and the predicted pixel set of class c. denotes the total number of label classes. denotes the assigned weight. denotes the type of loss function used. By jointly employing the above metrics, the segmentation performance of the model can be comprehensively evaluated in terms of both overall accuracy and class-level balance.
2.3. Data Preprocessing
During the image preprocessing stage, a strategy that integrates multi-scale feature extraction with edge enhancement is employed to improve image details and edge information.
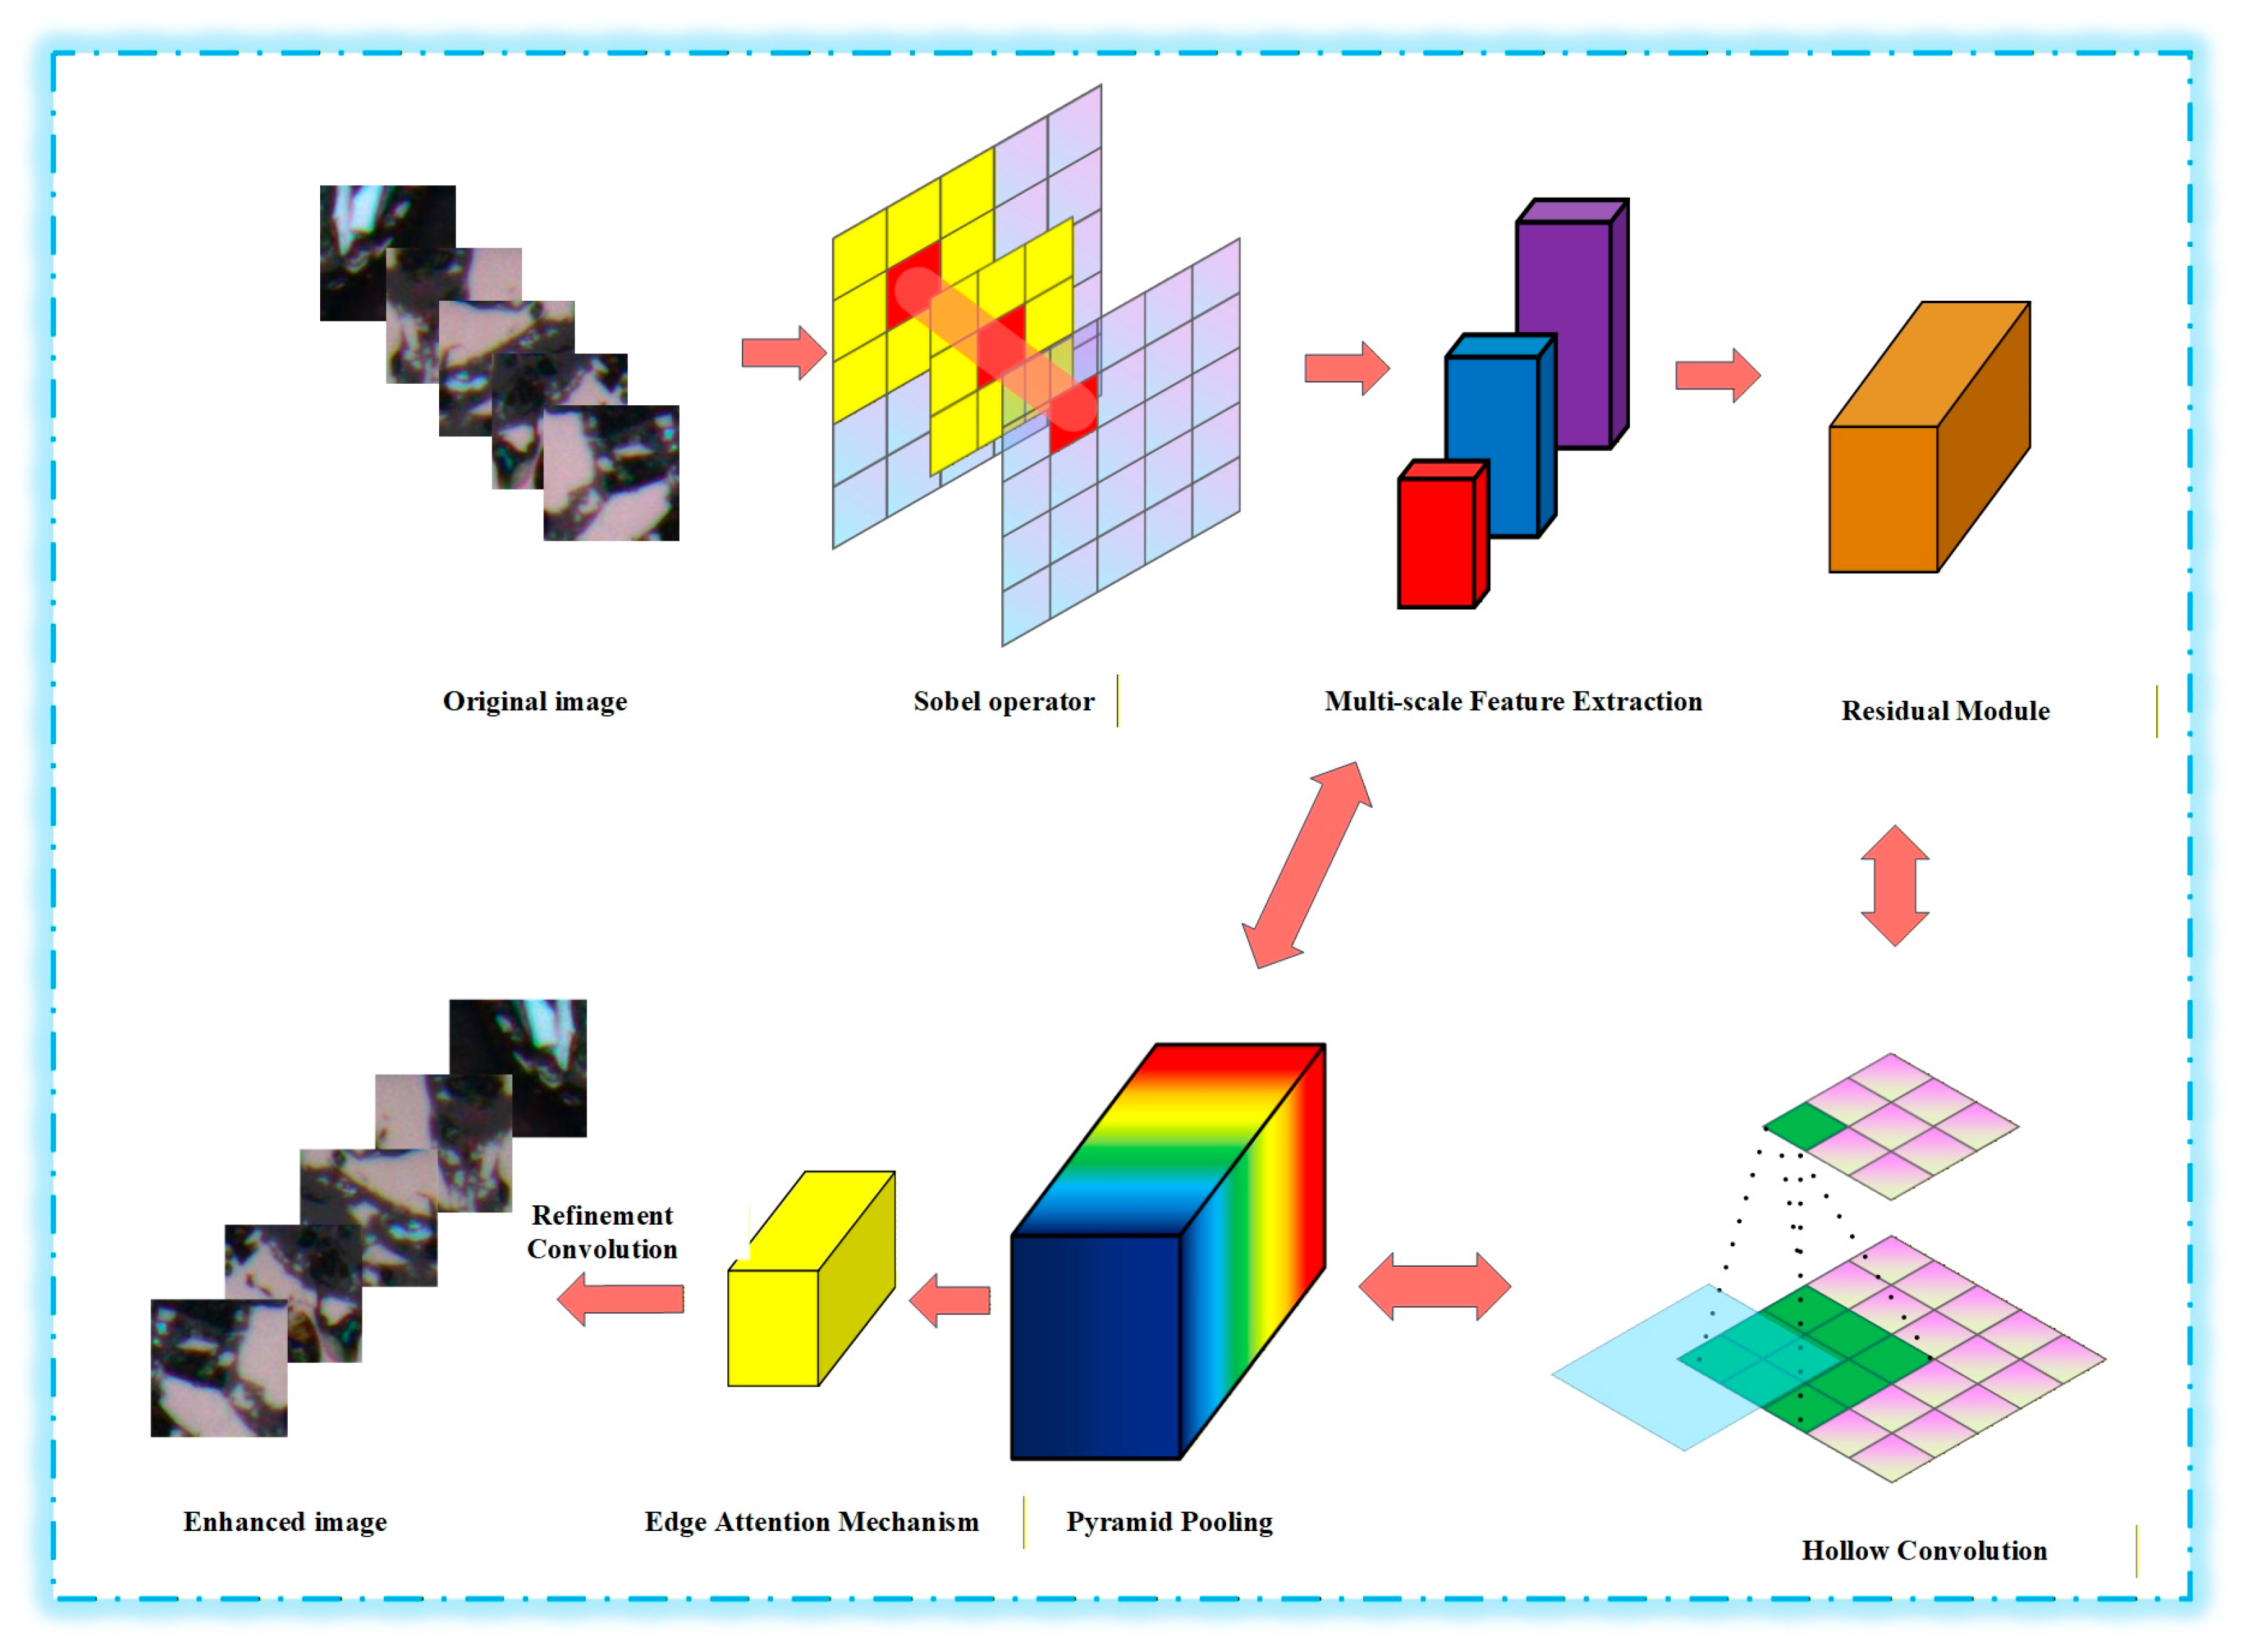
Figure 3 illustrates the overall framework of the image enhancement process.
First, edge features are extracted using the Sobel operator. Multi-scale convolutional kernels (1 × 1, 3 × 3, and 5 × 5) are then employed to capture features at different spatial scales. The extracted features are fused with the input image through a residual learning structure, thereby enhancing the representation of fine-grained image details. Subsequently, dilated convolution is applied to enlarge the receptive field and capture more extensive contextual information. To further enhance edge details, pyramid pooling is utilized to extract global contextual information, which is then adaptively weighted by an edge attention mechanism to emphasize edge regions in the image. As a result, an enhanced image with clearer details and sharper edges is generated. This preprocessing method effectively improves image detail representation, particularly in edge regions, making it well suited for tasks that require high-quality visual perception. After image enhancement, the model performance is significantly improved, as shown in
Table 1, which presents the results obtained using the enhanced images.
In this experiment, the performance of the model trained with original images is compared with that trained using enhanced images. An analysis of multiple performance metrics indicates that the use of enhanced images leads to notable improvements across several evaluation criteria. Specifically, the mIoU increases from 84.98% to 85.58% when enhanced images are used, indicating more accurate segmentation results and improved recognition of target regions. Meanwhile, the mPA rises from 91.12% to 91.54%, suggesting higher accuracy in pixel-level classification. In addition, the overall accuracy improves from 93.43% to 93.58%, reflecting a modest enhancement in the model’s overall classification performance.
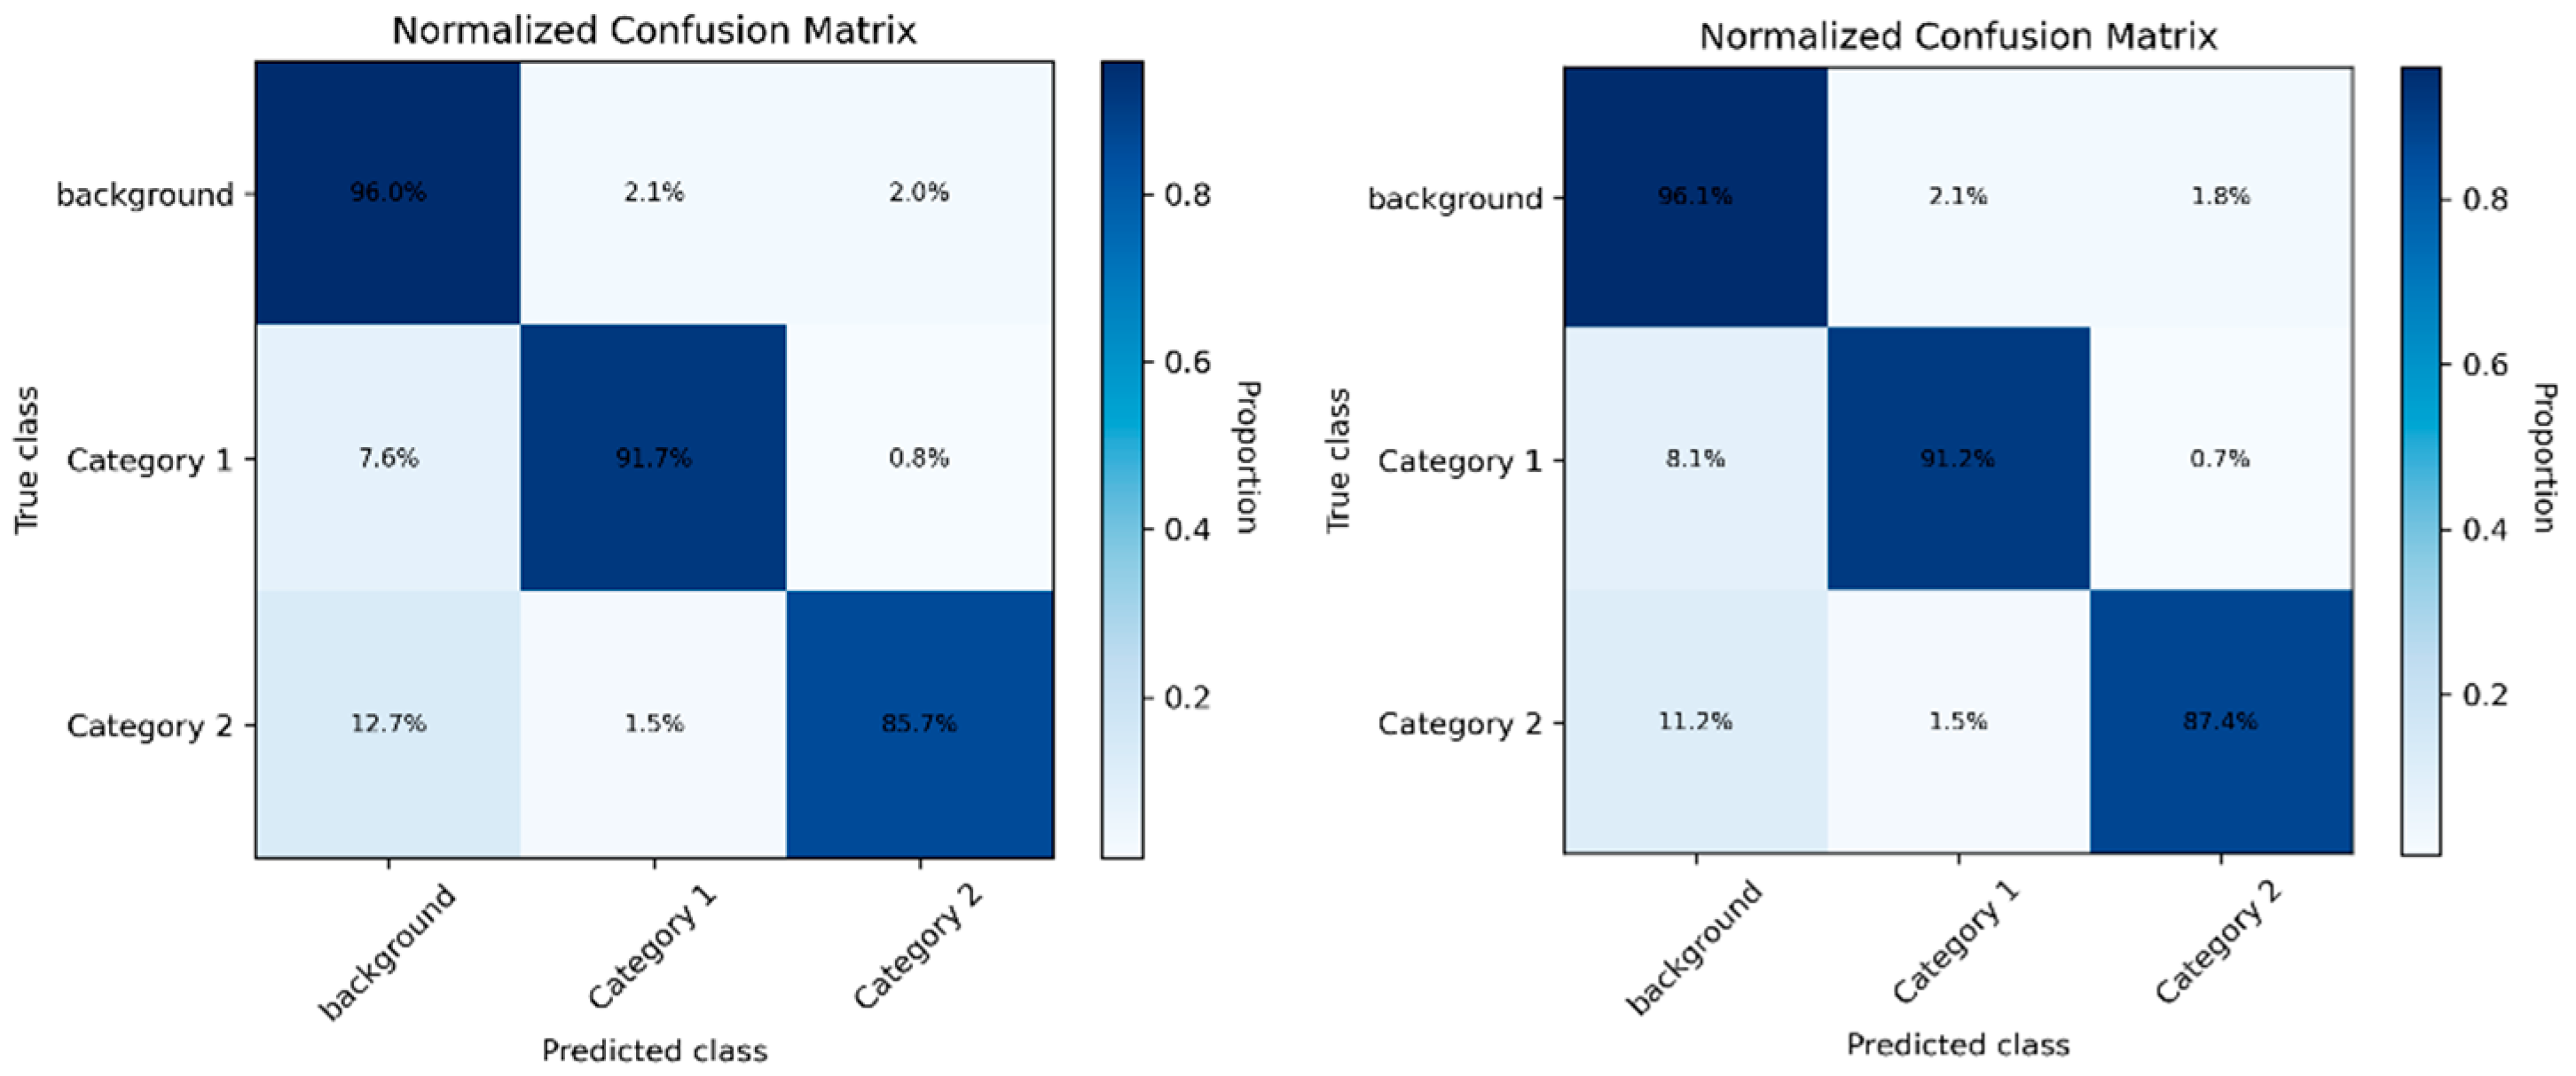
To further evaluate the impact of image enhancement on model performance, a confusion matrix is employed to conduct a comparative analysis of pixel-level predictions across different classes, as illustrated in
Figure 4:
From the normalized confusion matrices of the image-enhanced model (left) and the original model (right), it can be observed that the image-enhanced model exhibits improved recognition performance across all categories. For Category 1 and Category 2, the enhanced model shows higher proportions along the diagonal, indicating increased correct classification rates, while the proportions of pixels misclassified as background or other categories are reduced, demonstrating improved discrimination of foreground features. Although the background class maintains high accuracy in both models, the off-diagonal regions in the enhanced model are overall lighter, suggesting reduced inter-class confusion. Overall, image enhancement effectively improves the model’s generalization capability, with particularly notable gains in recognizing small targets and easily confused categories.
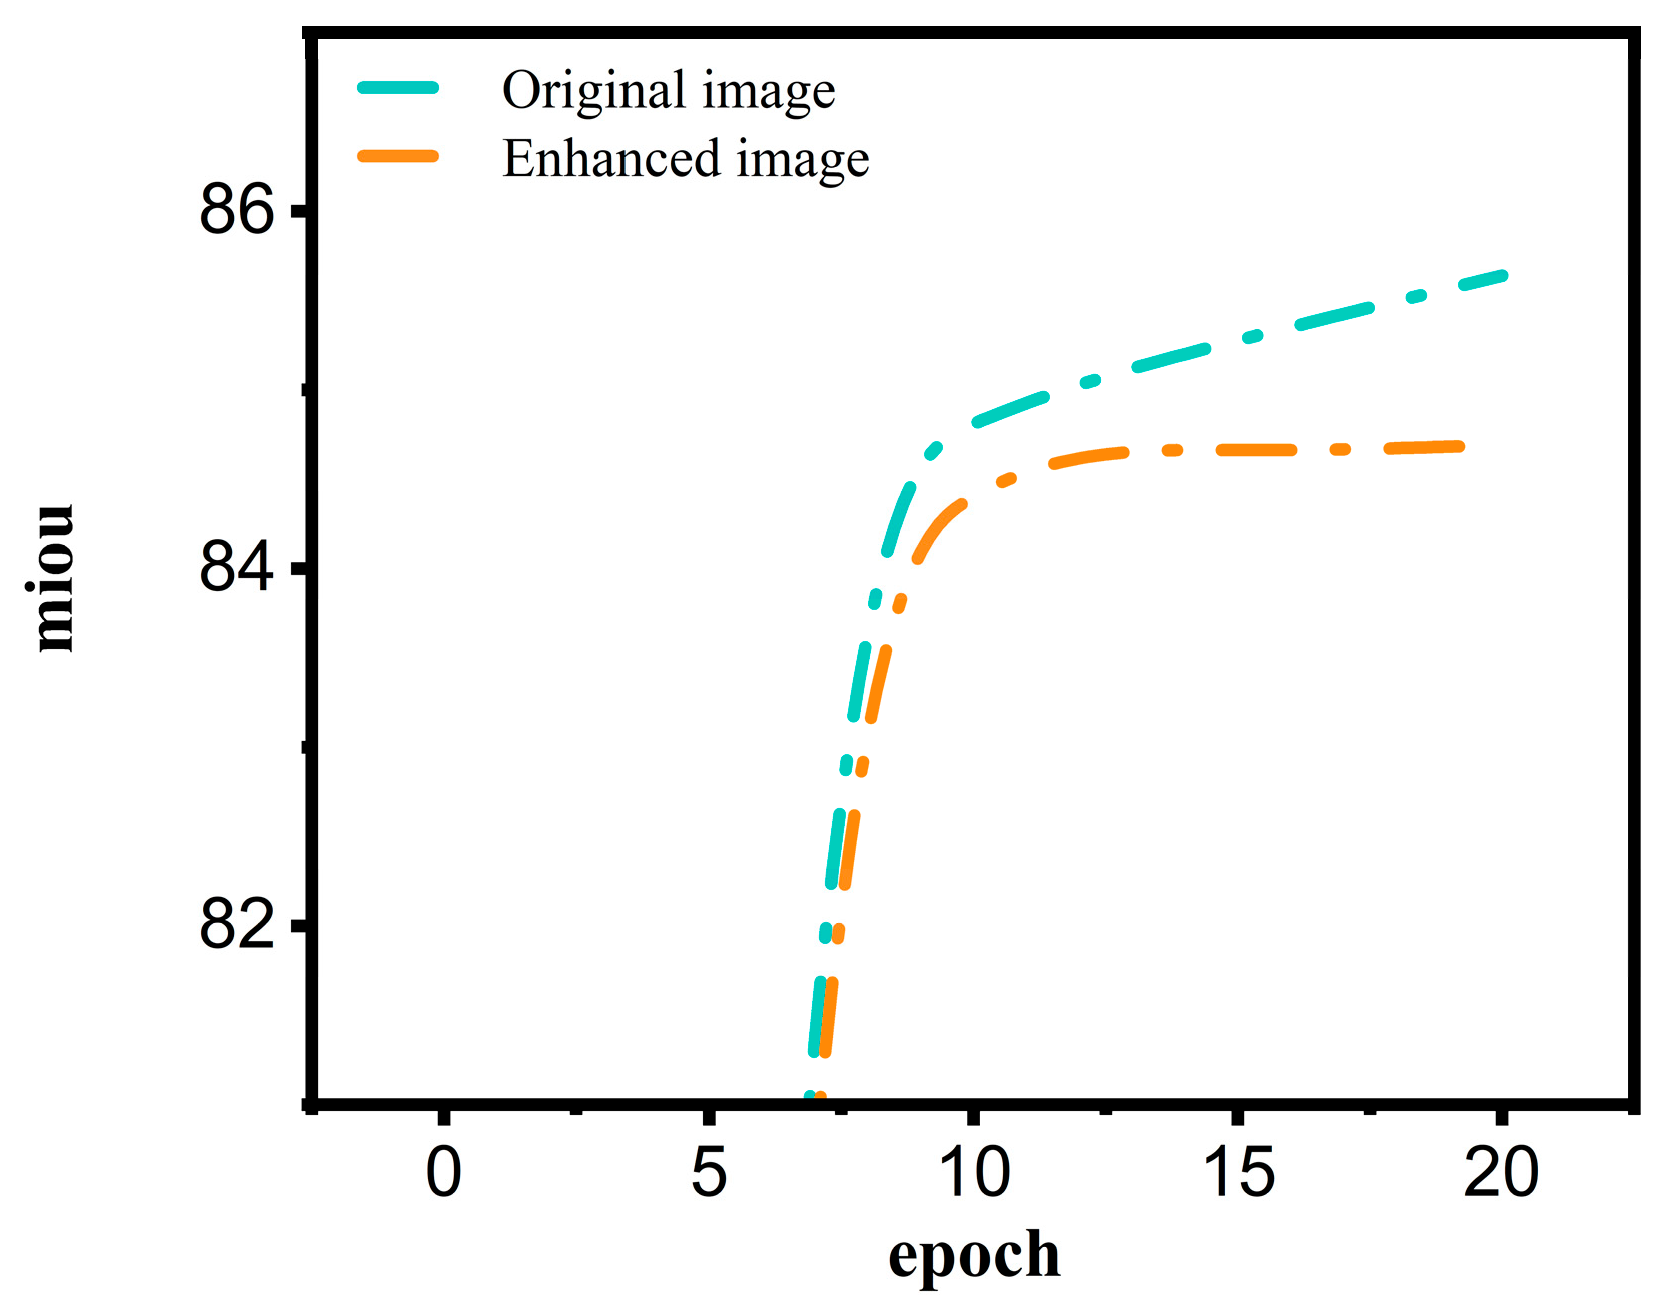
Figure 5 presents the mean Intersection over Union (mIoU) at each training epoch. As shown in the figure, image enhancement demonstrates clear advantages in improving both training efficiency and final model accuracy. The use of enhanced images enables faster model convergence and leads to superior final performance. Specifically, the mIoU of the enhanced images increases rapidly within approximately five epochs and then stabilizes, whereas the model trained on original images requires more training epochs to reach a comparable mIoU level. This indicates that image enhancement allows the model to achieve strong performance at an early stage of training. Furthermore, after 20 epochs, the mIoU obtained with enhanced images is slightly higher than that achieved with original images, suggesting that image enhancement not only accelerates training but also improves final accuracy. The mIoU of the enhanced images stabilizes at approximately 85.5%, while that of the original images remains around 84.5%.
4. Experimental Results
4.1. Framework for Optimizing Metal Smelting Production Processes
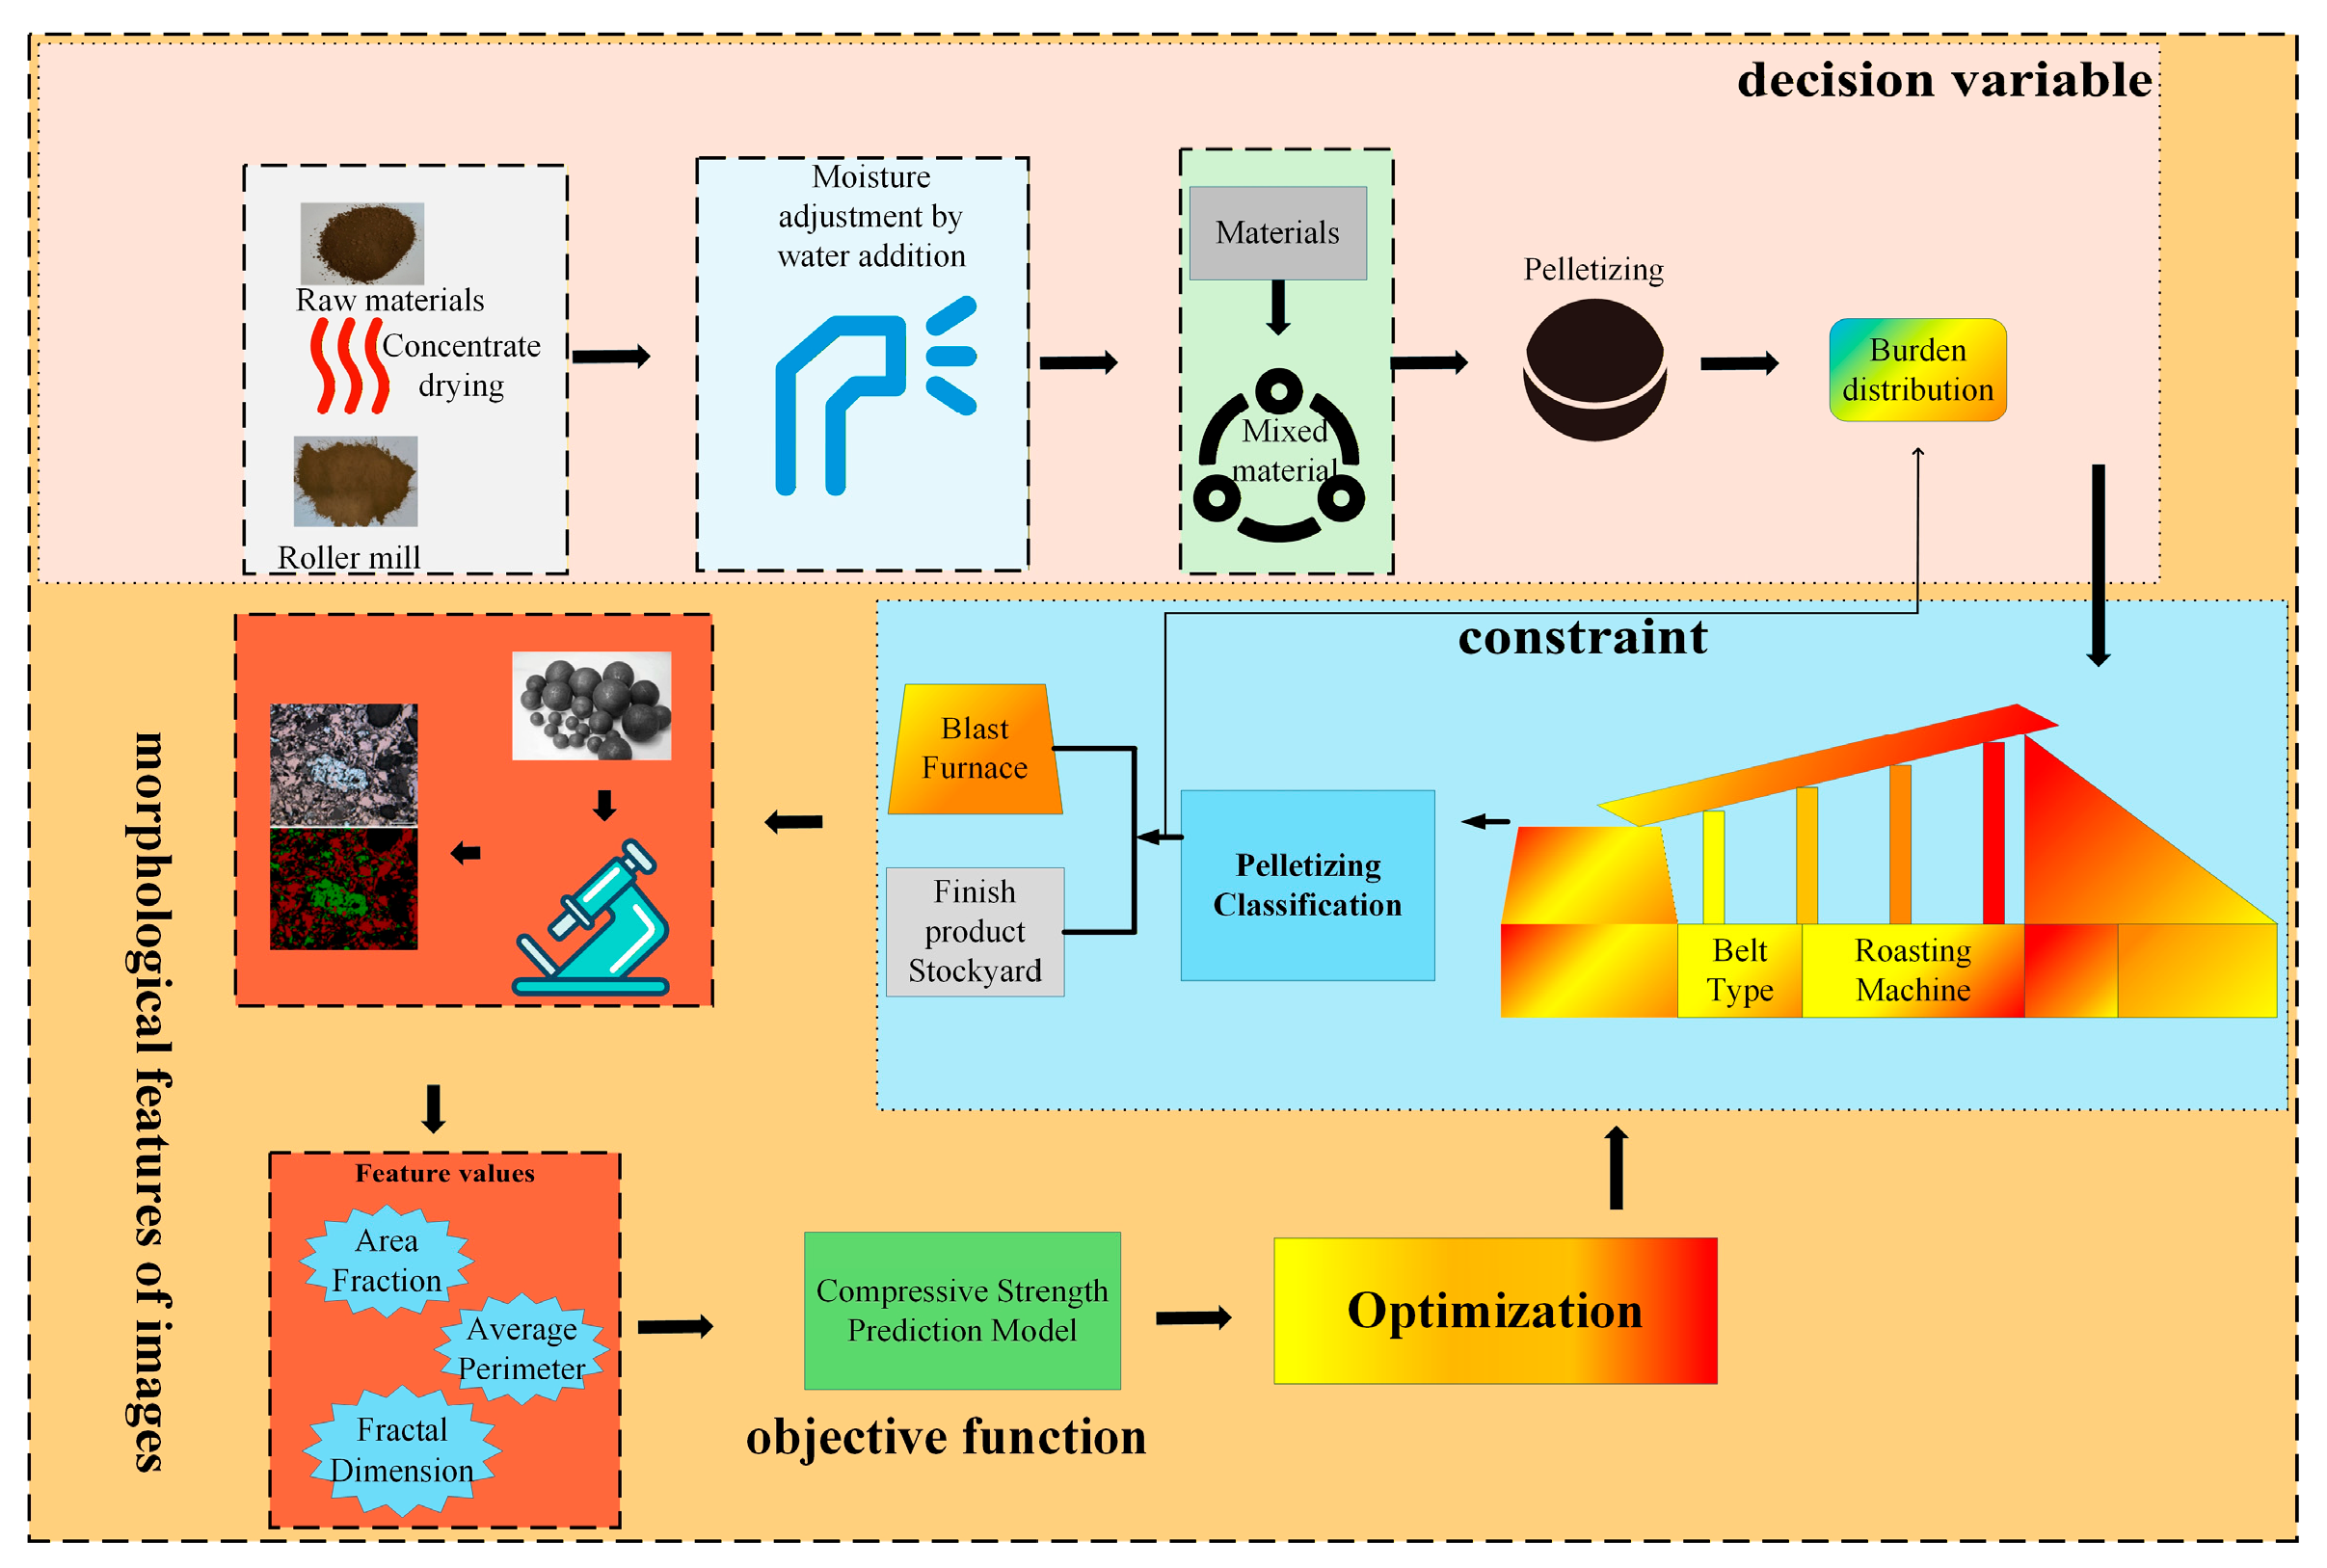
To illustrate the potential role of the proposed method in pellet production and quality evaluation,
Figure 10 presents a conceptual framework diagram. It should be emphasized that this study is limited to the development and validation of the pellet image segmentation model. The quality prediction and process parameter optimization depicted in the figure are provided for background purposes and fall outside the scope of this work.
In the pellet production process, process parameters such as water addition, mixing time, pelletizing speed, and roasting temperature are typically regarded as decision variables in optimization problems, while quality indicators including pellet strength, size distribution, and porosity are required to satisfy certain constraints. In related studies, metrics such as compressive strength, energy consumption, or production efficiency are commonly considered as optimization objectives. After obtaining pellet and pore regions through image segmentation, morphological features such as area fraction, equivalent diameter, perimeter, circularity, and fractal dimension can be further extracted to characterize pellet microstructures, thereby providing inputs for subsequent quality analysis or modeling. Owing to the complex coupling mechanisms during the roasting process and the generally nonlinear relationships among process parameters, structural features, and performance indicators, parameter optimization in pellet production is typically categorized as a nonlinear optimization problem. This study provides only a conceptual description of this issue and does not involve the formulation or solution of specific optimization models. In related studies, indicators such as pellet compressive strength, production efficiency, or energy consumption are often treated as optimization objectives, and their values can be evaluated through experimental measurements or data-driven models. These definitions are intended to illustrate the general structure of optimization problems in metallurgical production and do not involve the development or solution of specific optimization models.
4.2. Experimental System Configuration
The hybrid intelligent optimization-based VGG16-U-Net image segmentation model is implemented using Python 3.9 and the PyTorch framework, and is trained on a single NVIDIA RTX 4060 GPU with 8 GB of memory. During training, a fixed random seed of 11 is used to ensure reproducibility, and a single-machine, single-GPU training mode is adopted with the number of target classes set to three. The model is initialized by loading a specified set of pretrained weights with matched initialization, and all input images are resized to a unified resolution of . Training is conducted from epoch 0 to epoch 20 with a batch size of 2. The Adam optimizer is employed with an initial learning rate of , and the minimum learning rate is set to 1% of the initial value. A cosine annealing strategy is applied for learning rate scheduling, while weight decay is set to zero. During training, a weighted loss function is used to alleviate class imbalance by assigning loss weights to all classes. Model checkpoints are saved at the end of each epoch, and the validation set is evaluated periodically. The entire training process takes approximately 30 min on a single RTX 4060 GPU.
4.3. Ablation Studies
To comprehensively evaluate the contribution of each module to the overall model performance, systematic ablation studies were conducted. This section analyzes the effects of the VGG16 backbone, the U-Net decoder, the SPC-SA module, the SAN-SAW attention mechanism, and the loss function design in a step-by-step manner. Under identical training settings and dataset conditions, multiple model variants with different component combinations were constructed. Their performance was evaluated on the validation set using key metrics, including mPA, mIoU, Accuracy, Total Loss, and Validation Loss, to quantitatively assess the effectiveness of each component, as summarized in
Table 2:
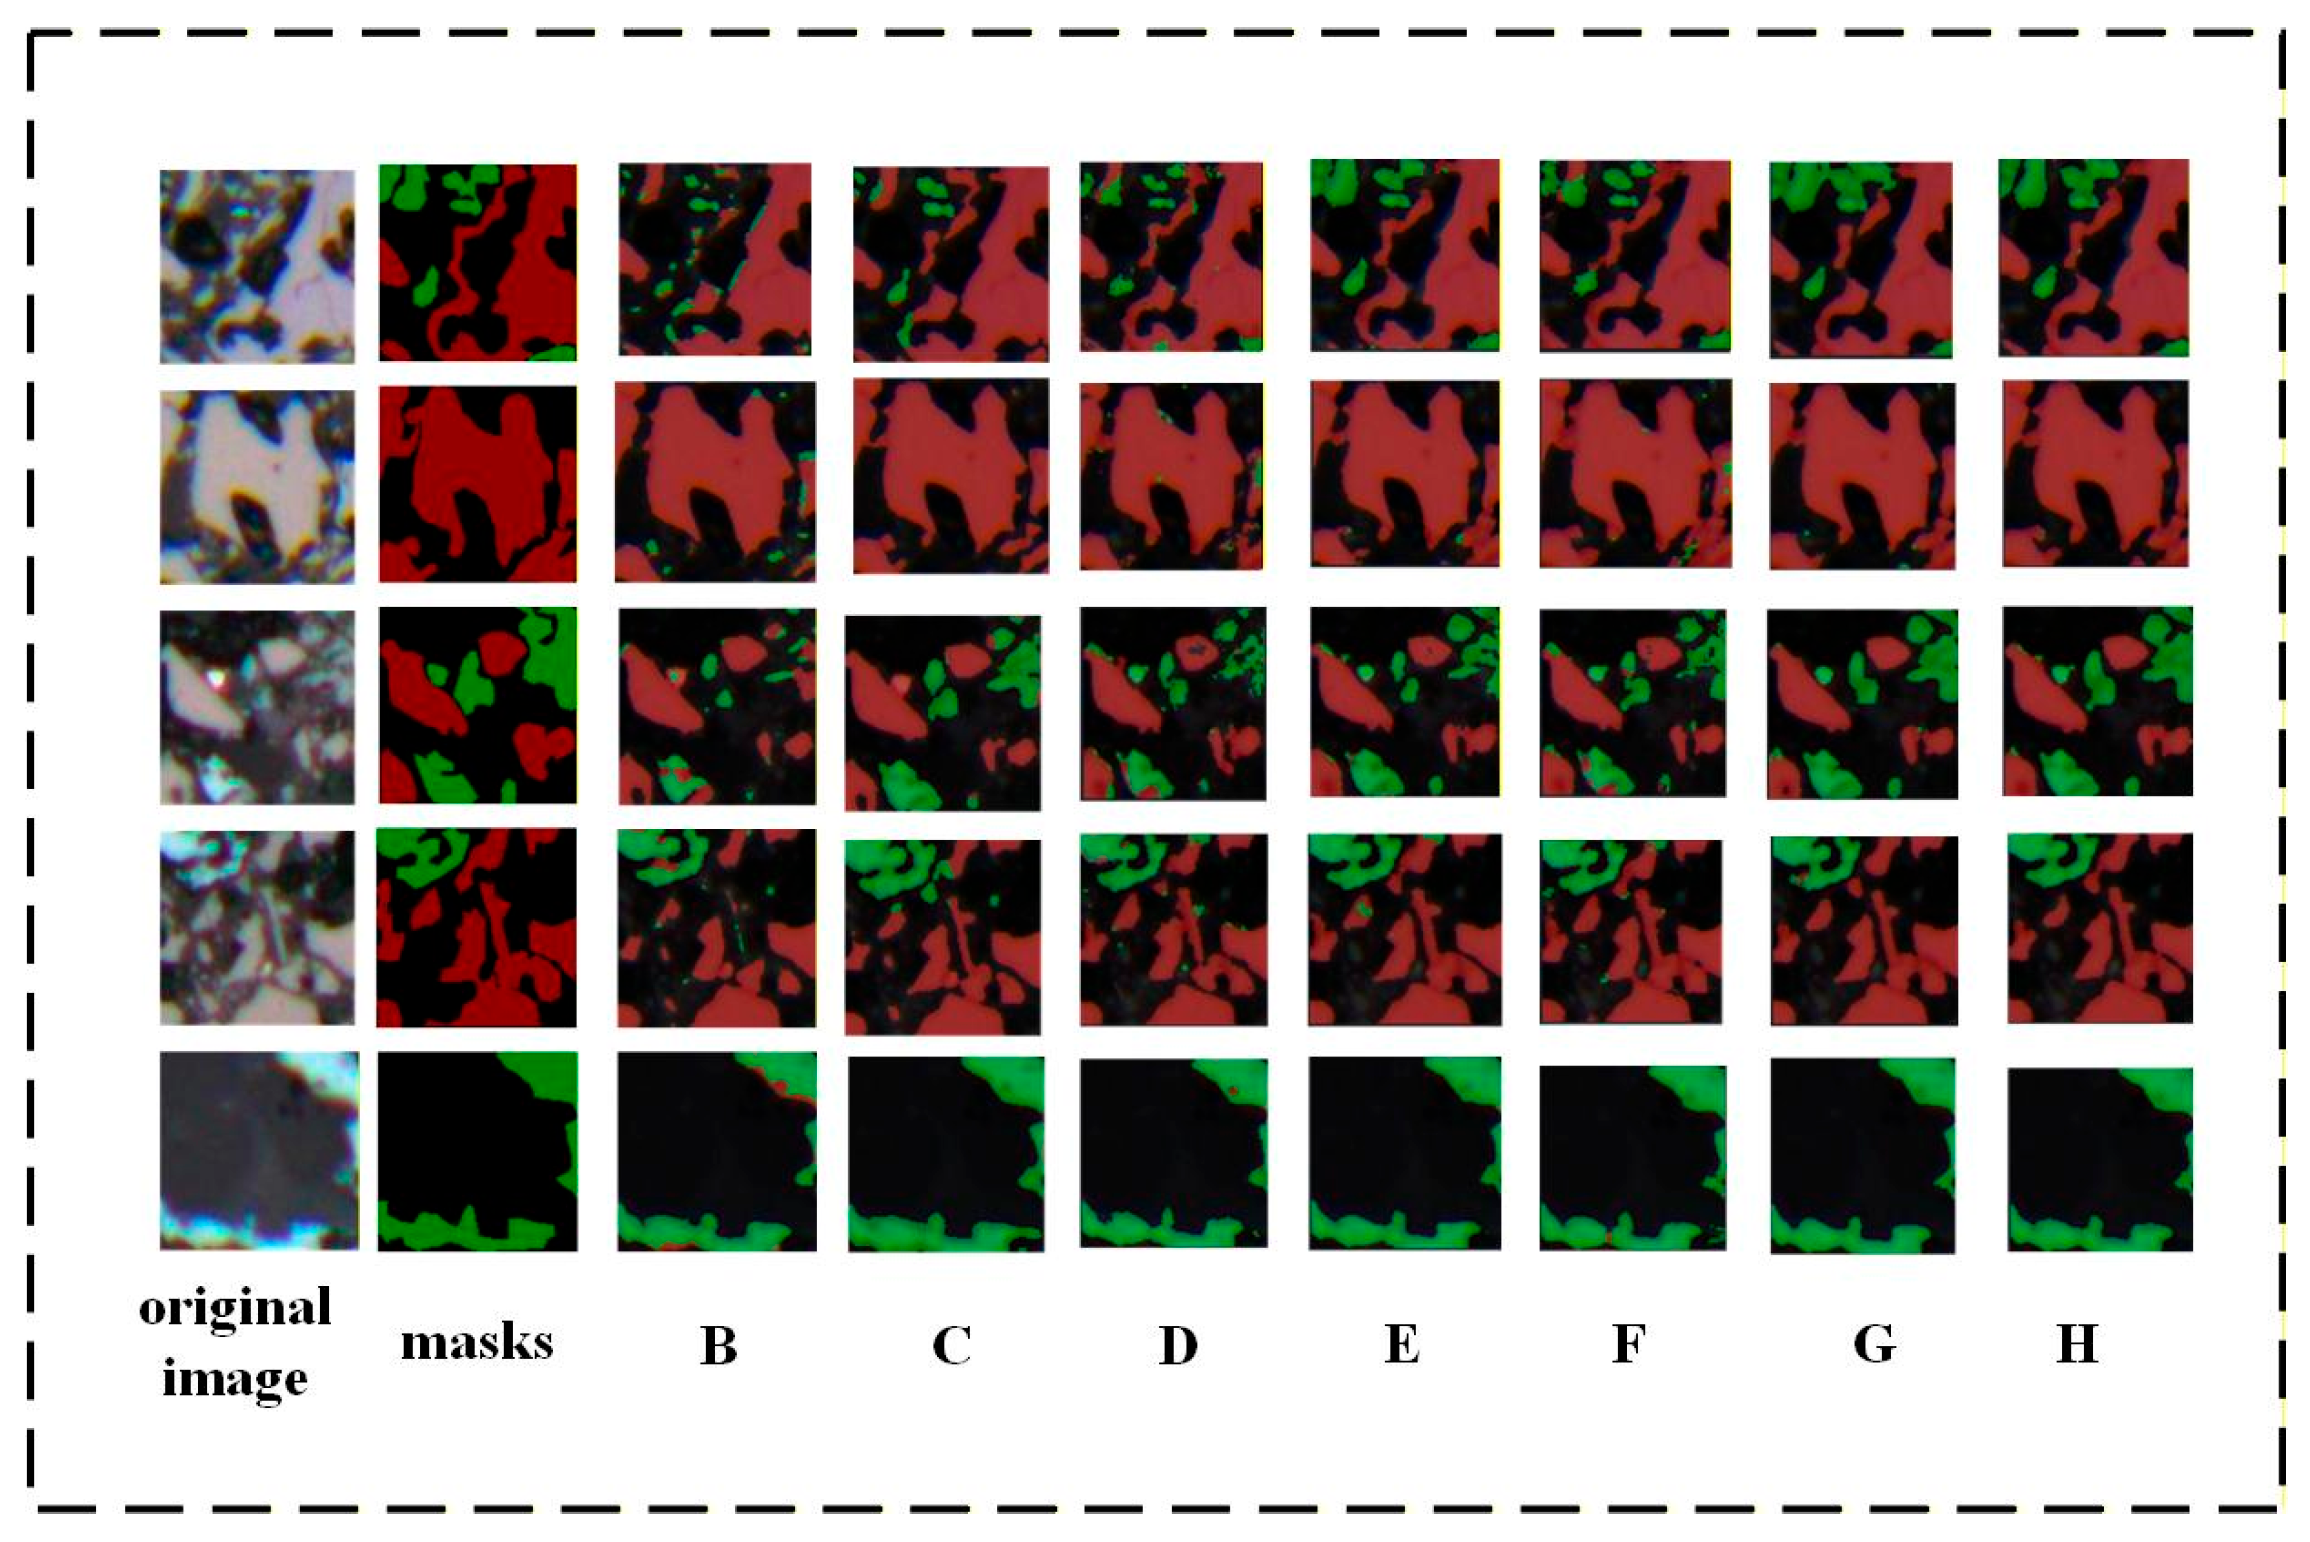
To provide an intuitive comparison of the impact of different experimental settings on segmentation performance, the results of each experiment are visualized and analyzed in
Figure 11. The masks shown at the top of the figure represent the manually annotated standard segmentation results and serve as the ground truth reference. A higher degree of consistency between the segmentation results produced by each model and the standard masks indicates greater accuracy in structural recognition and region delineation, and thus superior segmentation performance. As shown in
Figure 11, the experimental settings for B–H and others correspond to the settings of each model in
Table 2. The differences between the models in segmentation accuracy and region division reflect their strengths and weaknesses in handling structural recognition tasks.
From the tables and figures, using the U-Net-only configuration (B) as the baseline, adding the decoder-side SAN–SAW module alone (C) results in only a modest performance change (mIoU 74.49%), suggesting that when encoder features remain relatively weak, spatial refinement alone may provide limited benefit. After introducing a stronger VGG-based encoder (D), the performance increases to an mIoU of 78.00%, indicating that deeper convolutional features are more capable of capturing fine-grained textures and structural patterns in pellet microstructures and can serve as a foundation for subsequent improvements. Building on this configuration, incorporating the SPC-SA module (E) further increases the mIoU to 82.27%. This behavior is consistent with SPC-SA modeling channel-wise dependencies and performing adaptive re-calibration, assigning higher weights to channels related to mineral phases or pores while suppressing noisy or redundant channels, thereby enhancing deep semantic discriminability In comparison, combining SAN–SAW with the VGG encoder (F) also leads to a performance increase (mIoU 82.52%), plausibly by strengthening decoder responses to key mineral regions and boundary-adjacent areas through spatial attention and reweighting, which may help alleviate localization bias and background interference during upsampling. When SPC-SA and SAN–SAW are enabled simultaneously (G), the mIoU further increases to 84.52%, suggesting a complementary effect between channel-wise semantic selection (SPC-SA) and spatial focusing with decoding refinement (SAN–SAW) for segmenting complex structures and blurred boundaries. Finally, adding KL divergence regularization on top of configuration (G) (H) yields the best performance among the evaluated settings. From a probabilistic perspective, KL regularization constrains the output distribution by encouraging a reasonable entropy level and discouraging overly confident single-class predictions; this may reduce the amplification of high-confidence errors during gradient updates, particularly in boundary and texture-mixed regions, thereby improving training stability without compromising segmentation accuracy. Overall, the results suggest that the VGG encoder provides stronger feature representations, SPC-SA enhances channel discrimination, SAN–SAW improves spatial responses during decoding, and KL regularization moderates overconfident predictions at the distribution level. The combination of these components is associated with consistent and stable performance gains in the segmentation of complex pellet microstructures.
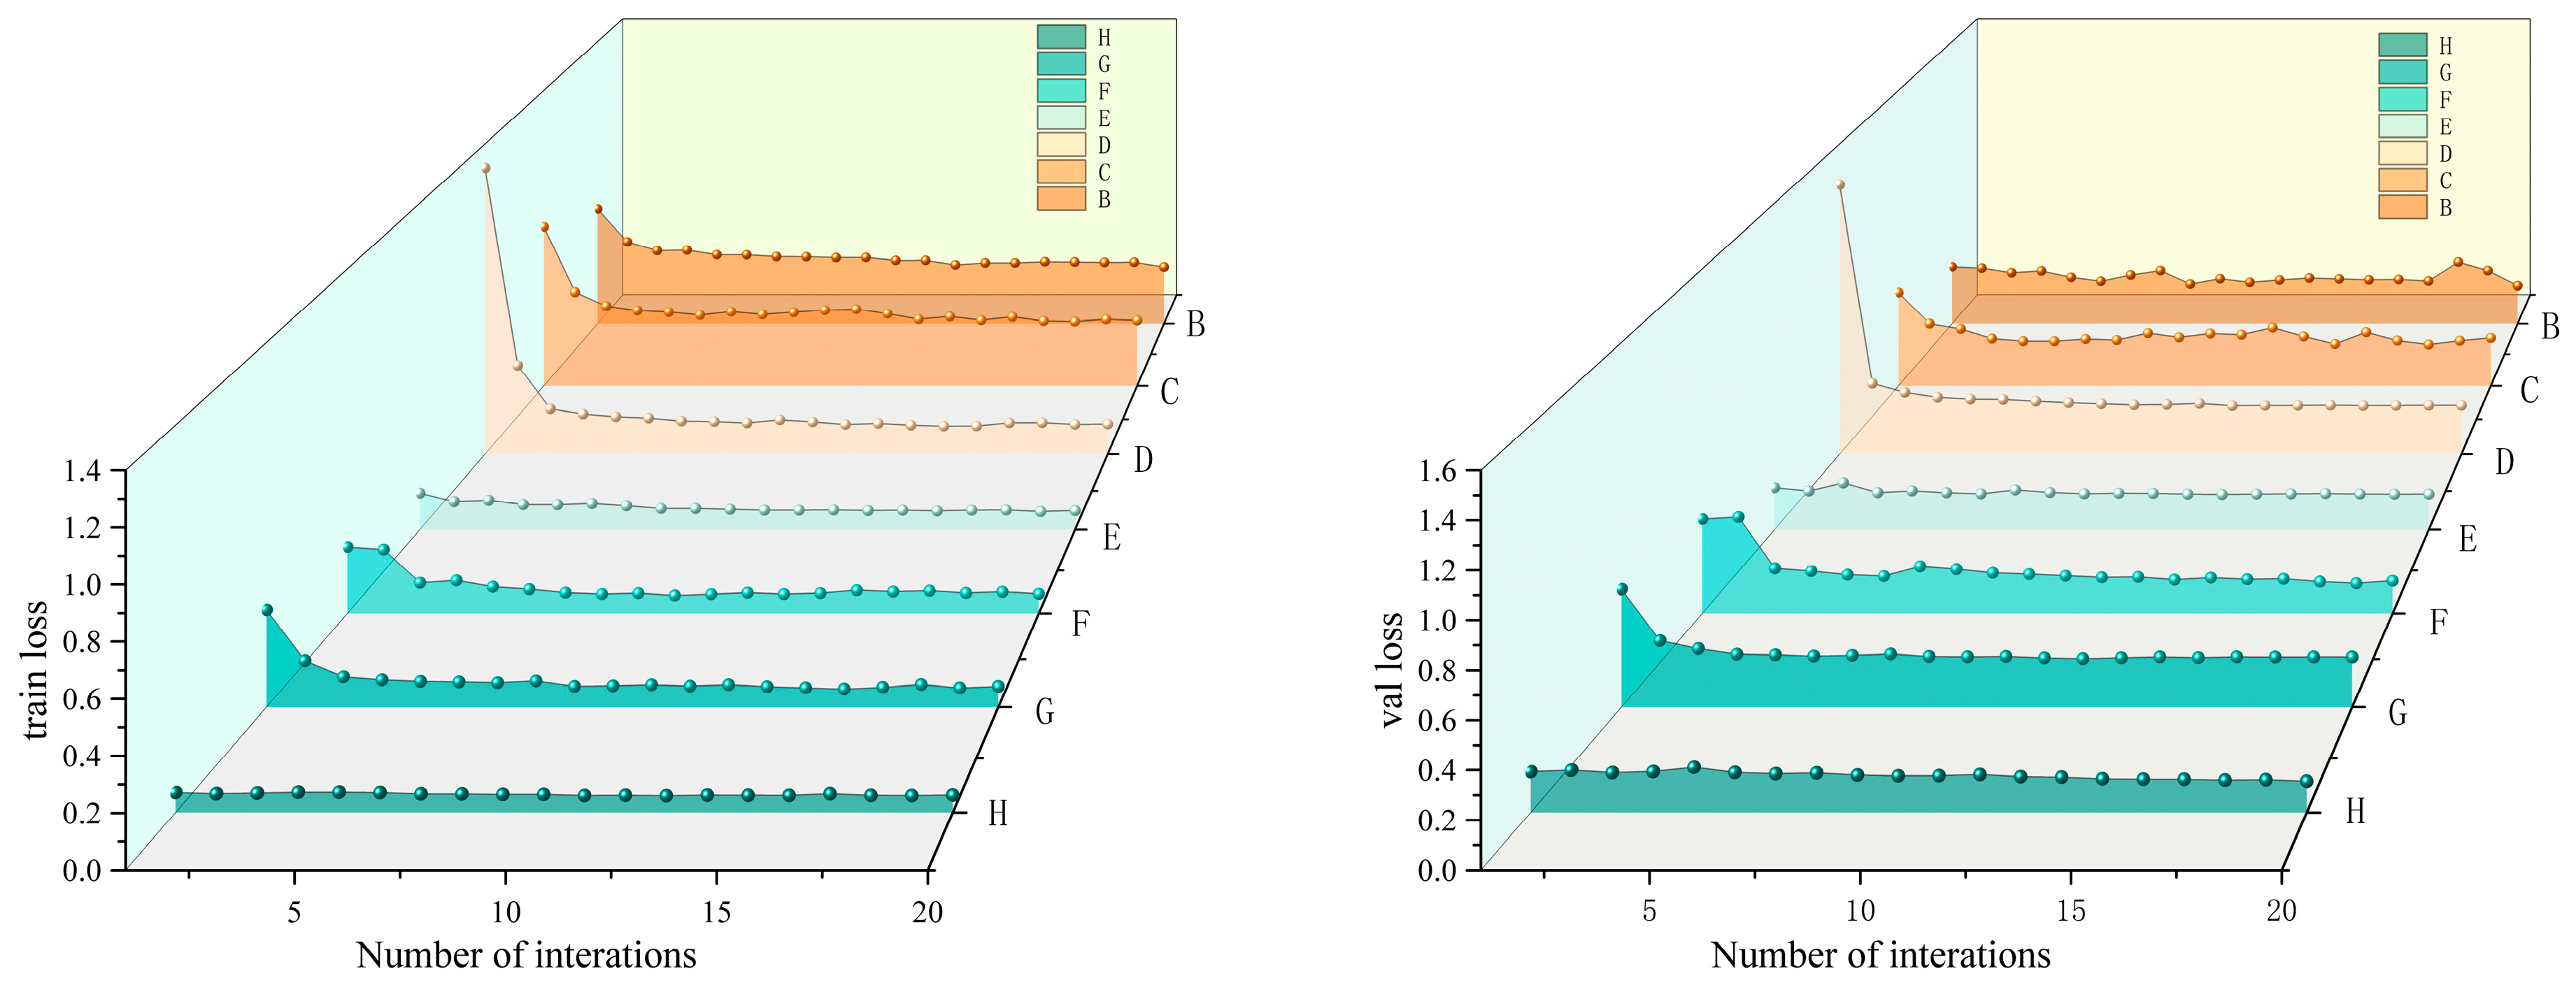
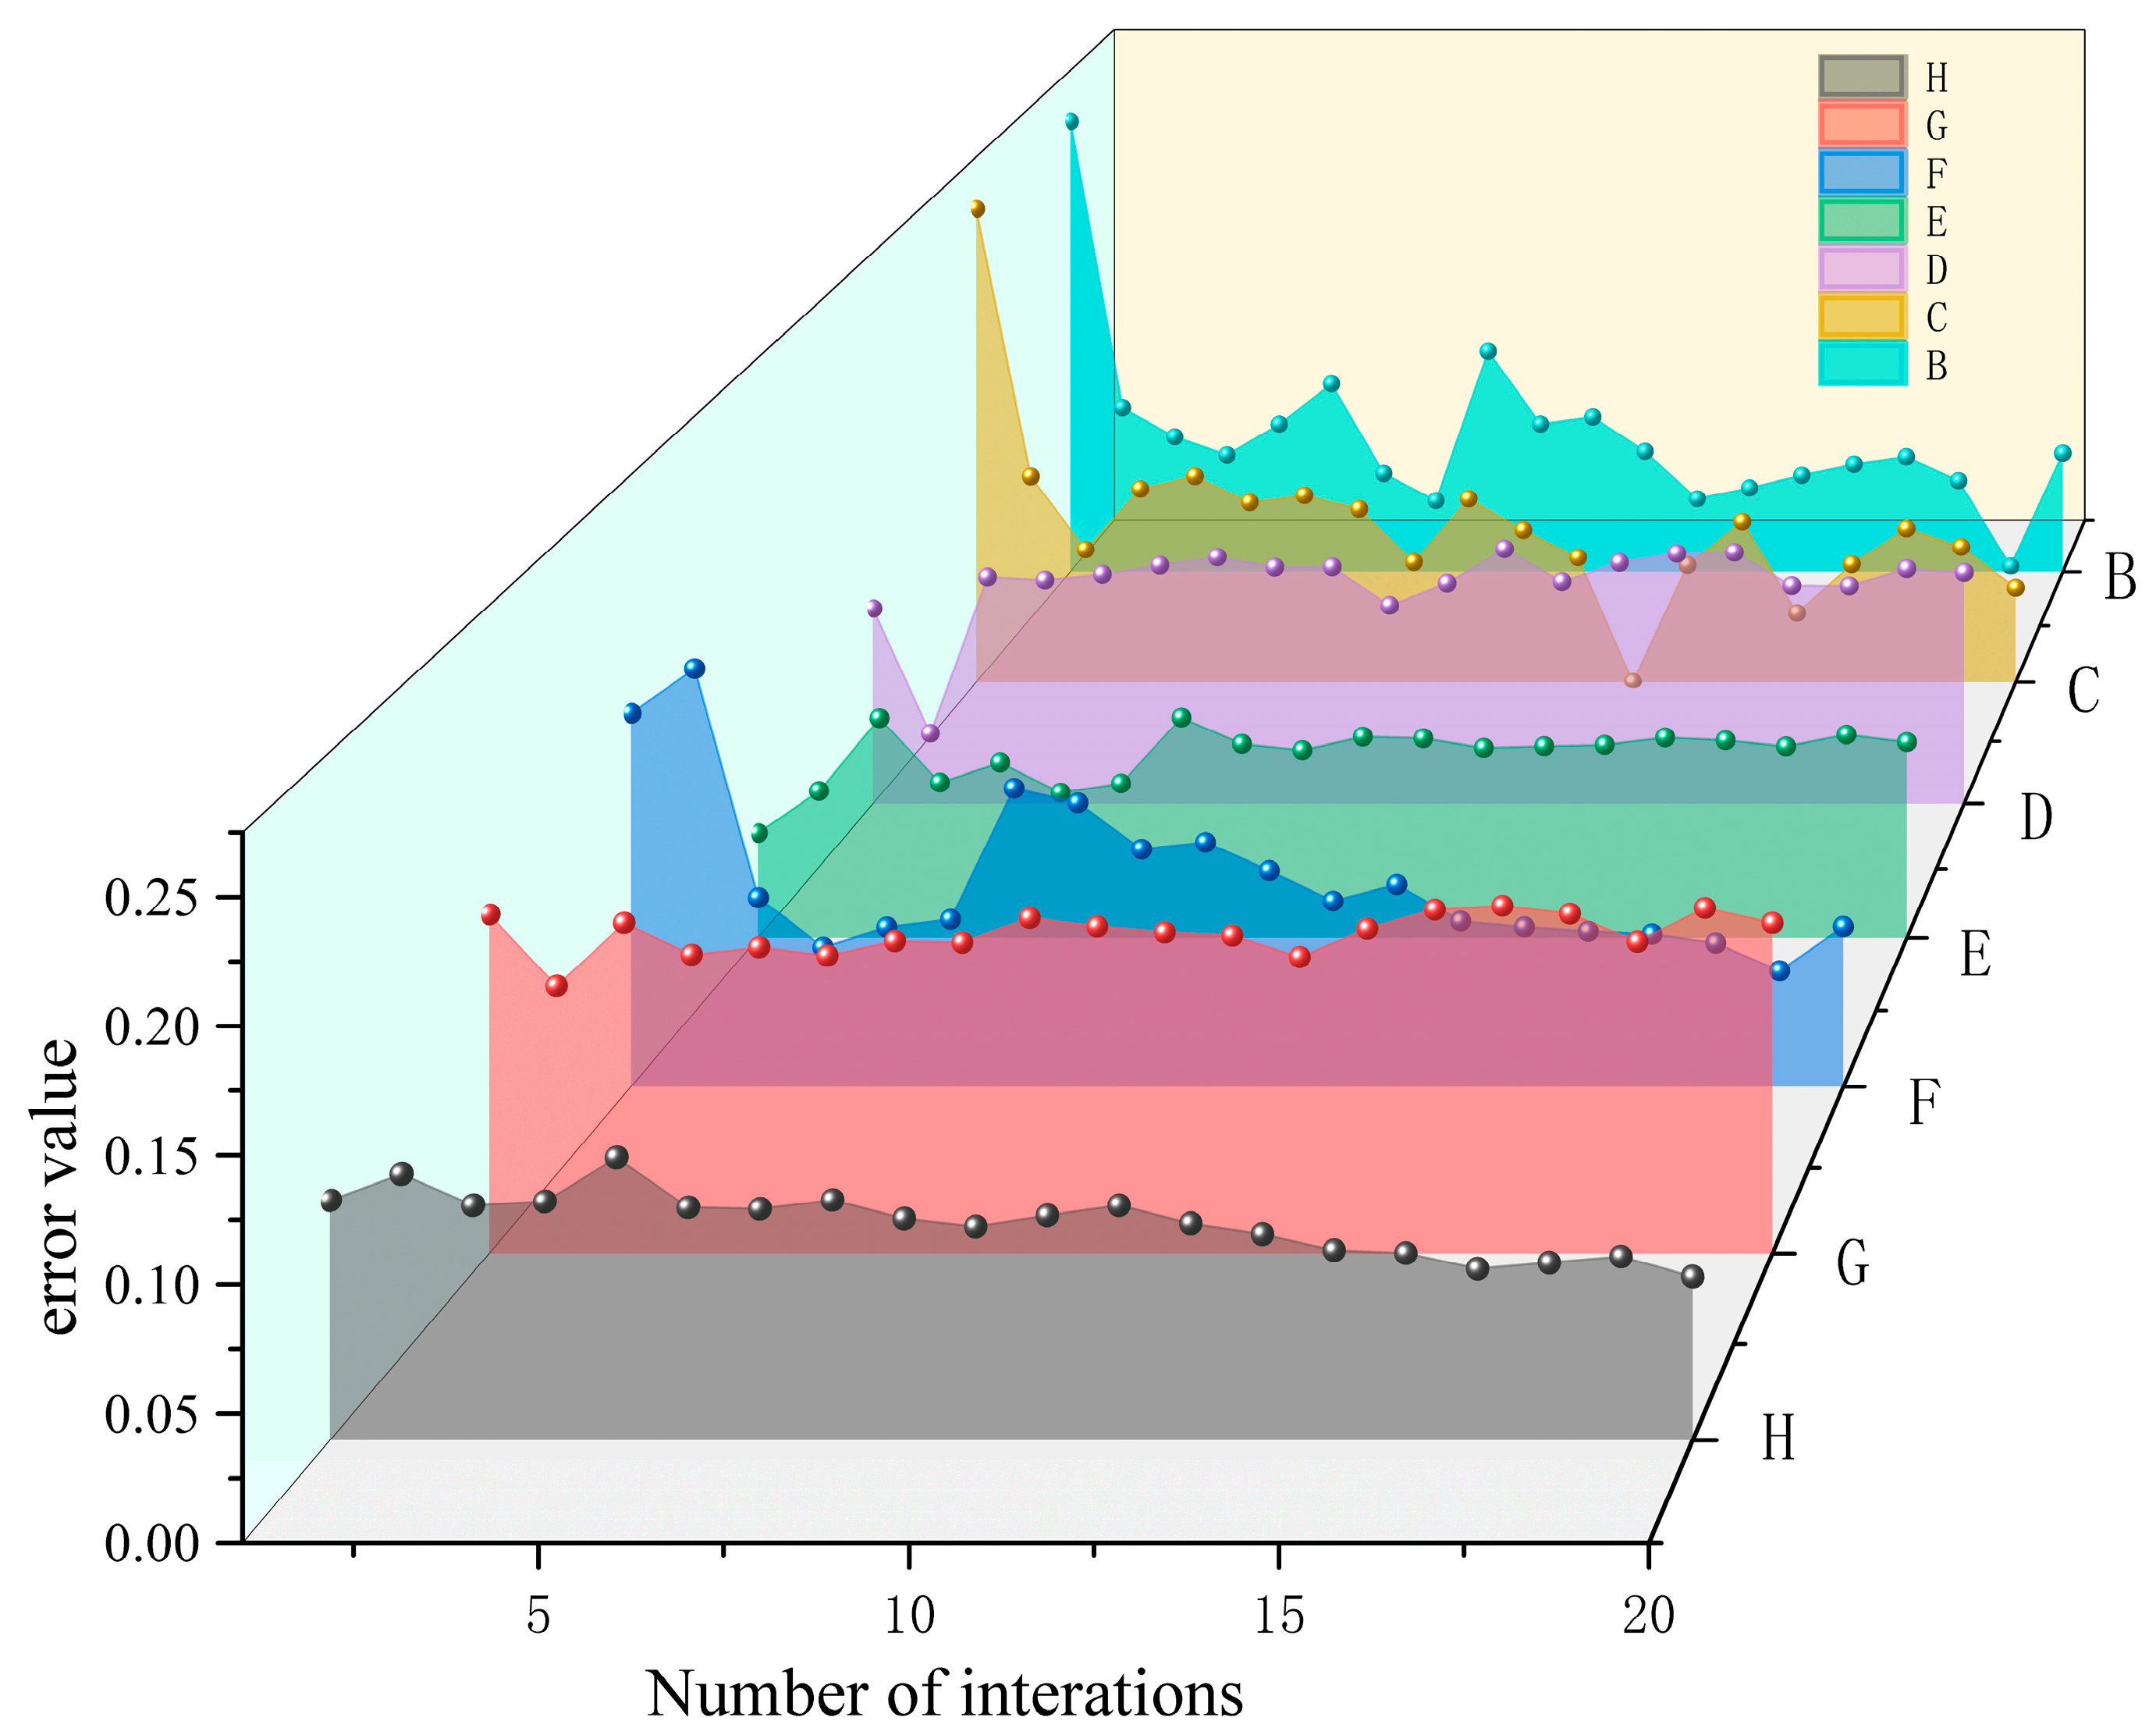
To further evaluate the training stability of the model, an analysis was conducted on the trends of training loss and validation loss over iterations, as shown in
Figure 12 and
Figure 13.
From the trends of training loss, validation loss, and their difference for each model in the figure, it is evident that as the structure is progressively improved, the model’s convergence speed and stability continue to increase. Ultimately, Model H maintains the lowest levels of training and validation loss, with smooth curves and minimal fluctuation. Furthermore, the model does not exhibit significant overfitting during training, demonstrating stronger stability and better fitting ability.
4.4. Impact of KL Divergence Regularization
4.4.1. Sensitivity Analysis of the KL Regularization Weight (λ)
To evaluate the impact of the KL regularization weight
on segmentation performance and to assess the robustness of our method to hyperparameter selection, we conducted comparative experiments with different values of
while keeping all other training settings unchanged. The results are reported in
Table 3.
To evaluate the impact of the KL regularization weight on segmentation performance, we conducted comparative experiments with different values of while keeping all other training settings unchanged. The results show that, compared with the setting without KL regularization, incorporating KL regularization improves segmentation performance overall. Moreover, the evaluation metrics vary only slightly within the tested range of , indicating that the model is relatively insensitive to and thus exhibits good robustness and reproducibility, which reduces the cost of hyperparameter tuning.
4.4.2. Segmentation Performance Analysis Based on Region Partitioning
We perform a morphology-based partitioning of pixel regions using the labels and conduct region-wise evaluation accordingly. Let the annotation be denoted as
, where the background class is indexed as 0. An effective-pixel mask is defined as
to exclude pixels labeled as ignore. We first construct a foreground mask
. Based on
, morphological dilation and erosion are applied using a structuring element with radius
:
The interior-region mask is defined as
, and the boundary-region mask is defined as:
Based on the above region partitioning, we separately compute the mIoU, mPA, Accuracy, and loss for the boundary regions and the interior regions, and compare the results obtained with KL regularization (Ours + KL) and without KL regularization (Ours), as summarized in
Table 4.
According to the results in
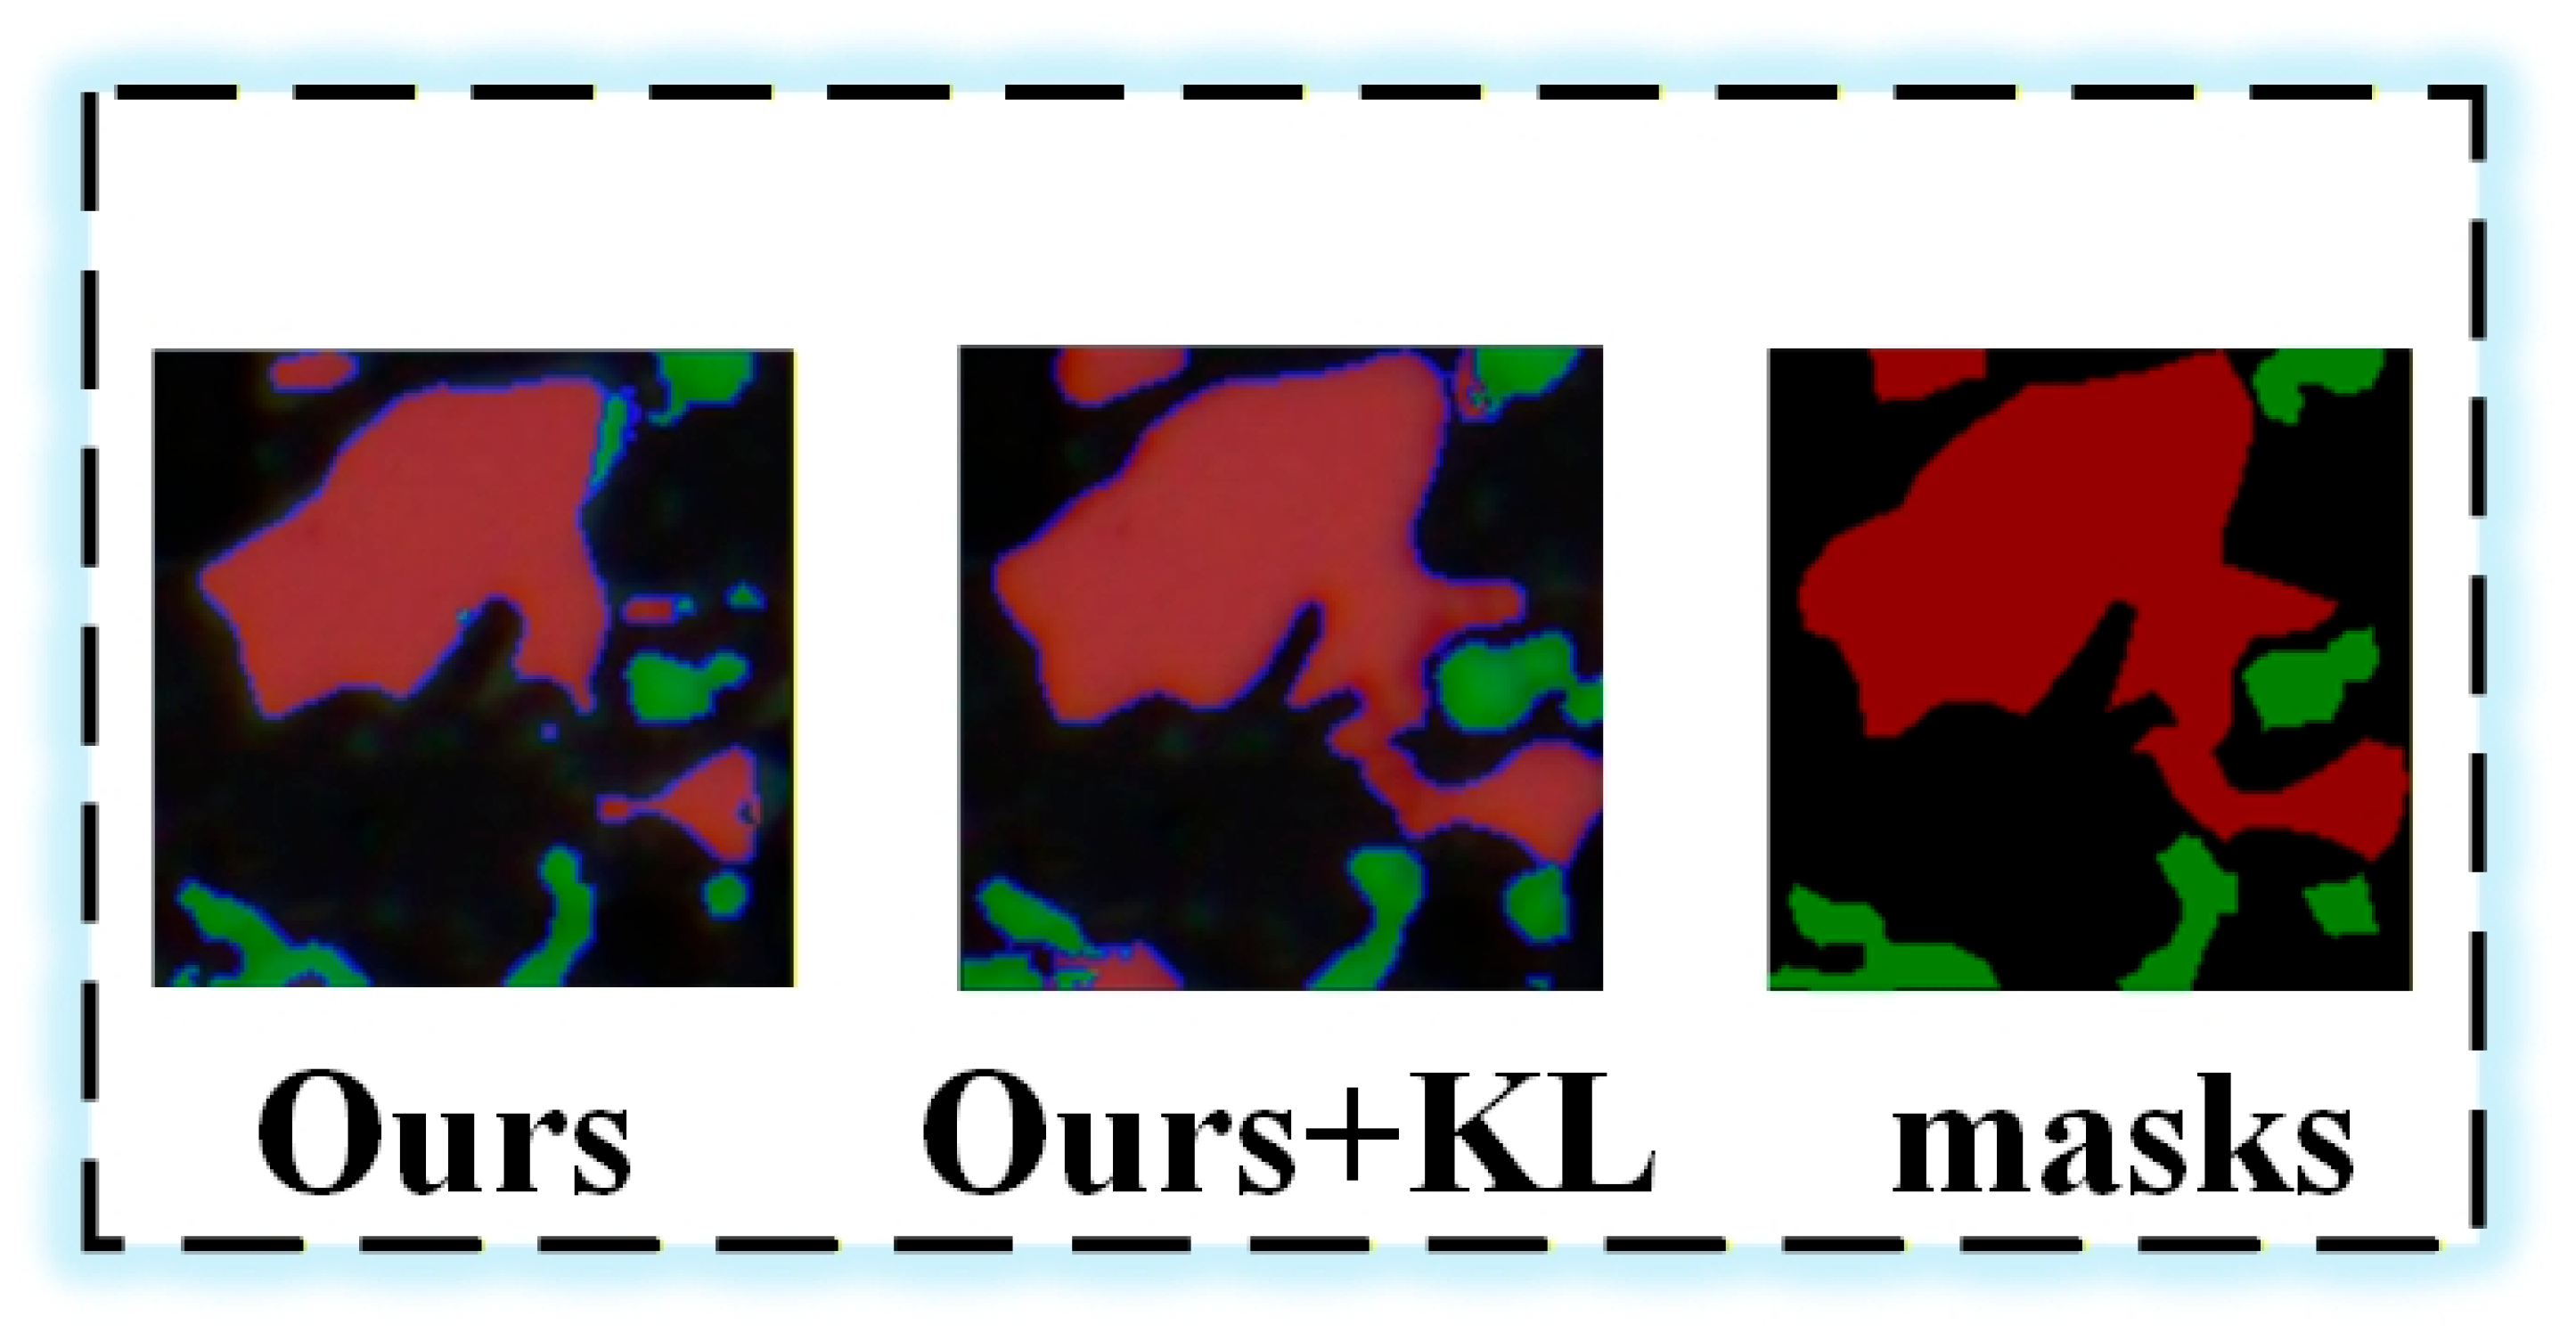
Table 4, after introducing KL regularization, the loss in the interior region decreases, while mIoU, mPA, and Accuracy show increases. These observations suggest that KL regularization may help mitigate overly confident predictions and reduce the influence of noise in semantically consistent core regions, leading to a more stable predictive distribution. Qualitative visual comparisons further provide evidence consistent with the above observations: compared with the model without KL regularization, incorporating KL regularization yields predictions that more closely follow the ground-truth masks in boundary-transition regions, and misclassifications as well as abrupt discontinuities appear less frequent, as shown in
Figure 14.
Overall, Red and green represent different category regions in the segmentation, black represents the background, and the blue line indicates the boundary. As shown in
Figure 14, KL regularization exhibits a more pronounced stabilizing effect in the interior regions of targets, while boundary regions remain the primary source of segmentation ambiguity and errors; nevertheless, a certain degree of improvement in segmentation performance is also observed in these regions.
In semantic segmentation tasks, severe class distribution imbalance can impact the training loss and regularization terms. Previous studies have shown that traditional loss functions and their regularization terms inherently introduce a bias towards region size, and different designs affect the model’s learning of the minority class. Liu et al.’s work, through information-theoretic analysis, pointed out that common segmentation losses contain a bias towards region scale and proposed that explicitly incorporating the target class ratio into the loss function can alleviate the imbalance effect, thereby improving the matching of predicted regions to the true class ratios [
39]. Additionally, Boykov et al. analyzed the so-called volumetric bias within the energy optimization framework for image segmentation and reconstruction, and noted that the likelihood terms of many standard methods are equivalent to a KL divergence penalty from a uniform distribution, which tends to generate equally sized class regions. However, when classes are highly imbalanced, this can lead to artifacts or biases [
40]. Furthermore, a substantial amount of research on addressing class imbalance indicates that strategies such as weighted loss functions, redesigned loss functions for imbalance, or dynamic weighting mechanisms are needed when the class distribution has a long tail, in order to improve the performance of the minority class. Otherwise, the default uniform prior or unweighted design often fails to achieve optimal results. Related work includes the use of focal loss, resampling methods, or adaptive weight loss functions to mitigate the impact of class imbalance [
41]. In summary, these analyses suggest that when the background dominates or the class distribution is extremely imbalanced, the KL regularization term assuming a uniform distribution may not be optimal. Future work could consider introducing category-aware target distributions, weighted KL divergence, or dynamic weighting mechanisms as regularization designs better suited to handling class imbalance, thereby improving model performance.
4.4.3. Comparison of Segmentation Performance with and Without KL Regularization
To examine the effect of the KL regularization term and different loss combinations on segmentation performance, loss-function ablation experiments were conducted under identical network architectures, data splits, and training settings.
Table 5 summarizes the performance obtained using CE, Dice, and their combinations, with and without KL regularization, and further presents a comparison of the proposed method under the two regularization settings. The evaluation metrics include mIoU, mPA, and Accuracy.
Table 5 presents the ablation results for different loss functions and the KL regularization term. Overall, after incorporating KL regularization into CE, mIoU shows varying degrees of improvement, suggesting that KL regularization provides a certain level of benefit.
4.4.4. Robustness Evaluation Under Adversarial and Gaussian Noise Perturbations
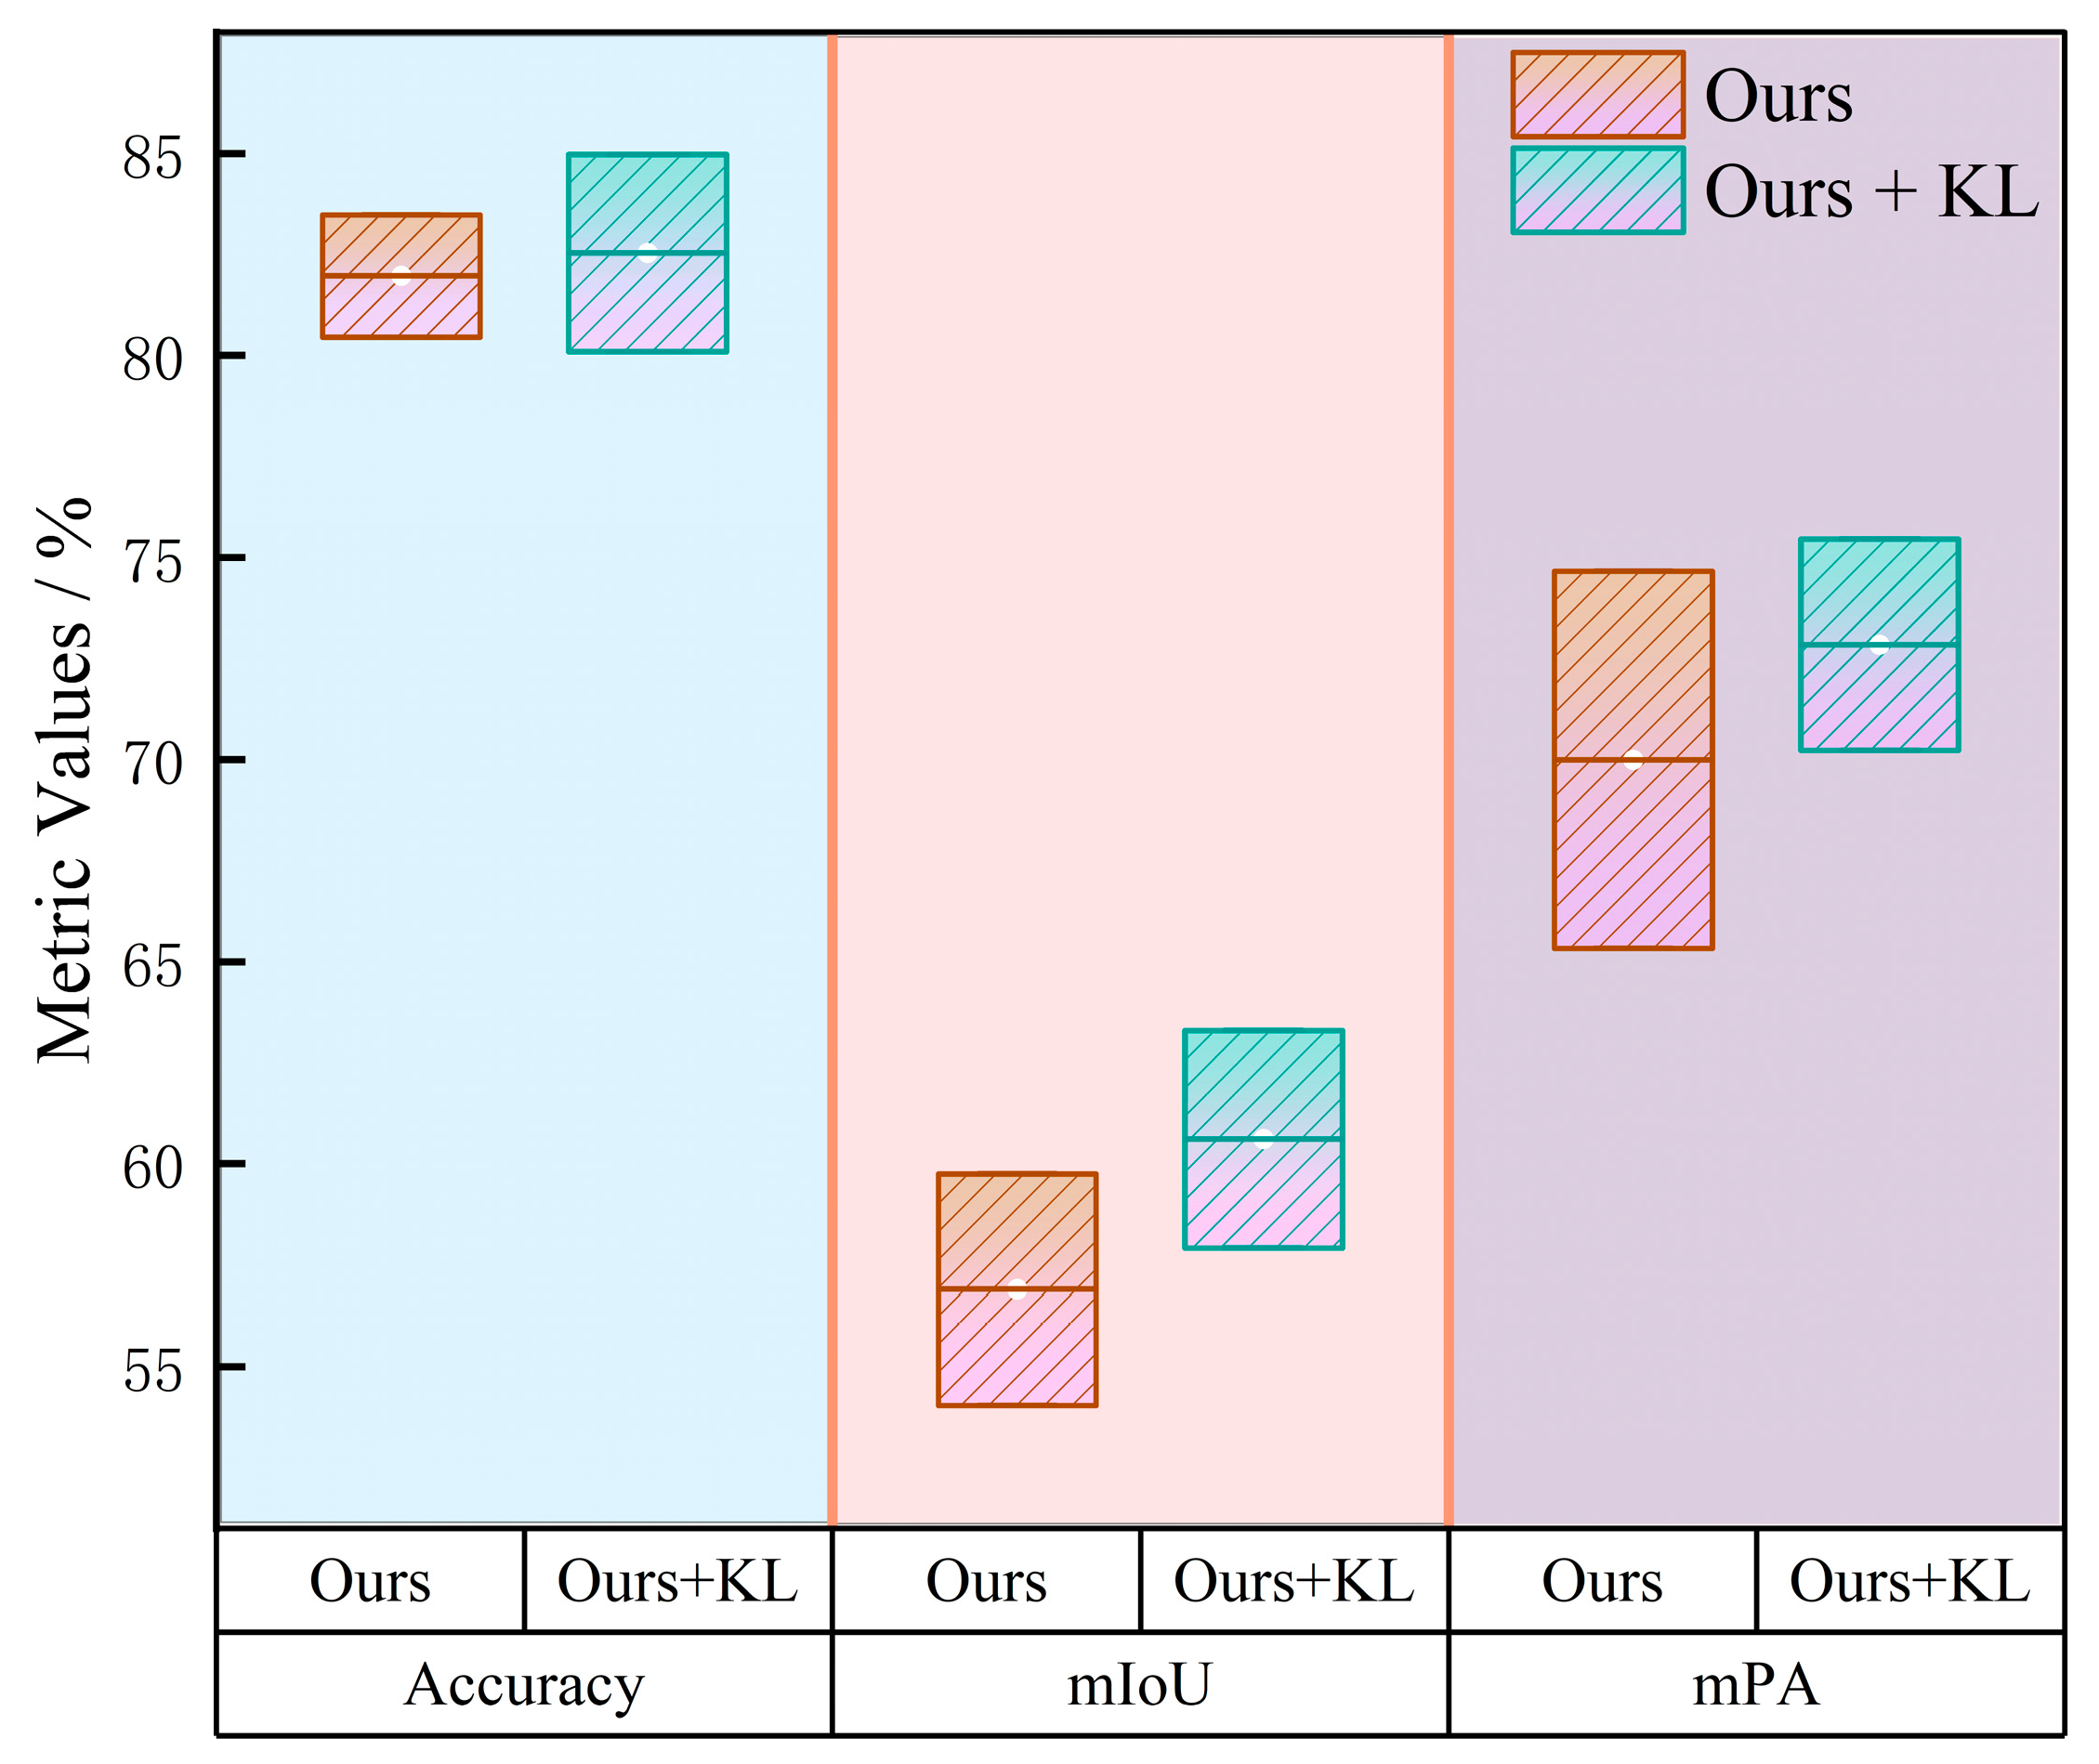
To systematically analyze the stability and robustness of the model under complex disturbance conditions, we performed robustness evaluation from two perspectives: adversarial perturbations and random noise interference. In terms of adversarial sample evaluation, we generate adversarial examples using the FGSM method, which involves applying small gradient perturbations to the input images, and then evaluate the model’s performance on the adversarial samples, as shown in
Table 6:
Figure 15 shows the range of the model’s performance in terms of Accuracy, mIoU, and mPA:
As shown in the figure and table, after introducing the KL regularization term, the model demonstrates improvements in Accuracy, mIoU, and mPA compared to the model without KL regularization. This indicates that the inclusion of KL regularization effectively enhances the model’s stability and accuracy under adversarial perturbations.
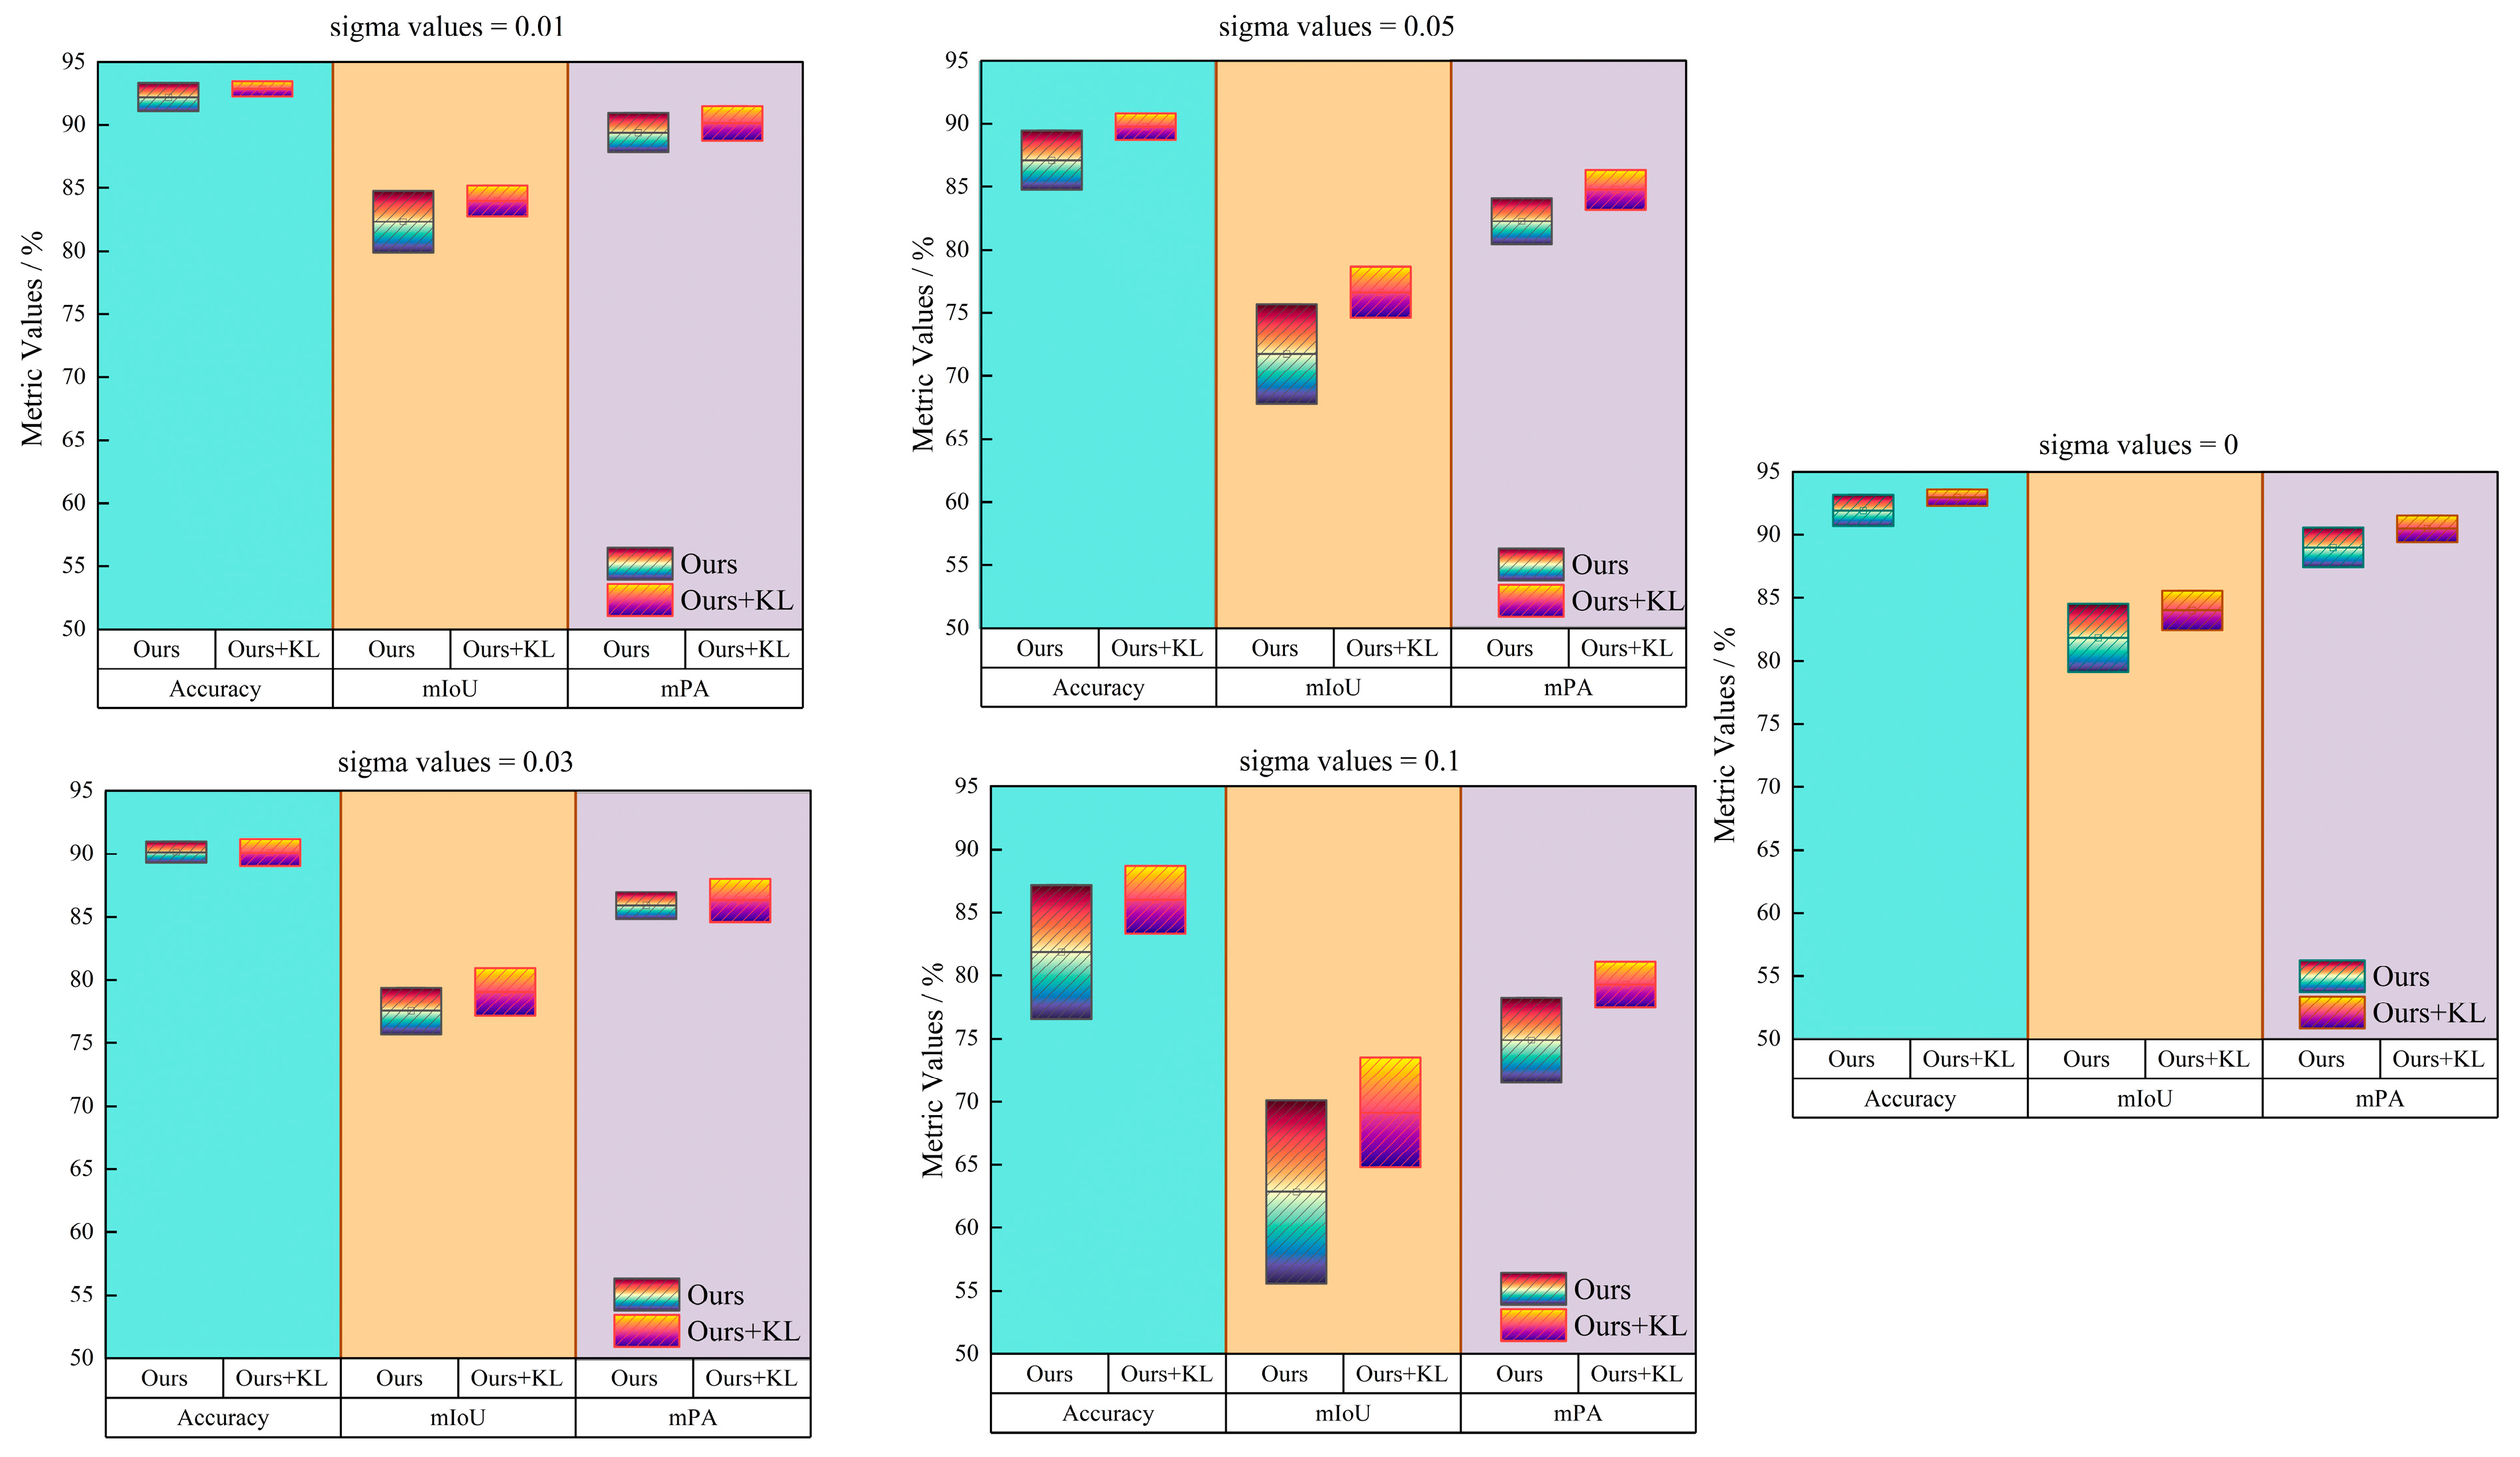
In terms of Gaussian noise evaluation, to simulate the impact of imaging noise, transmission noise, and environmental interference in real-world scenarios, we add Gaussian noise of varying intensities to the original images. The standard deviation of the noise is set in the normalized space as
, which is used to evaluate the model’s robustness under different noise conditions, as shown in the
Table 7:
Figure 16 shows the range of the model’s performance in terms of Accuracy, mIoU, and mPA under different noise standard deviations:
As shown in the table and figure, the model with KL regularization outperforms the model without KL regularization under all noise intensities. Particularly, under high noise standard deviations (e.g., and ), KL regularization brings significant improvements. These results indicate that KL regularization effectively enhances the model’s robustness under noisy conditions, especially in high-noise environments, by mitigating the negative impact of noise and improving the model’s stability and accuracy.
4.5. Comparative Experiments with Different Semantic Segmentation Model
To validate the effectiveness of the hybrid intelligence-optimized VGG16-U-Net image segmentation model for pellet microstructural image segmentation, it is compared with four representative semantic segmentation methods, including the superpixel segmentation algorithm [
42], Medical-SAM-Adapter [
43], texture-based segmentation of SEM images [
44], PSPNet, FC-DenseNet, ResUNet [
14] and DeepLabv3. To ensure a fair comparison, all competing methods are adapted to a three-class output configuration and retrained on the pellet microstructural image dataset to suit the three-class segmentation task addressed in this study. The experimental results are summarized in
Table 8.
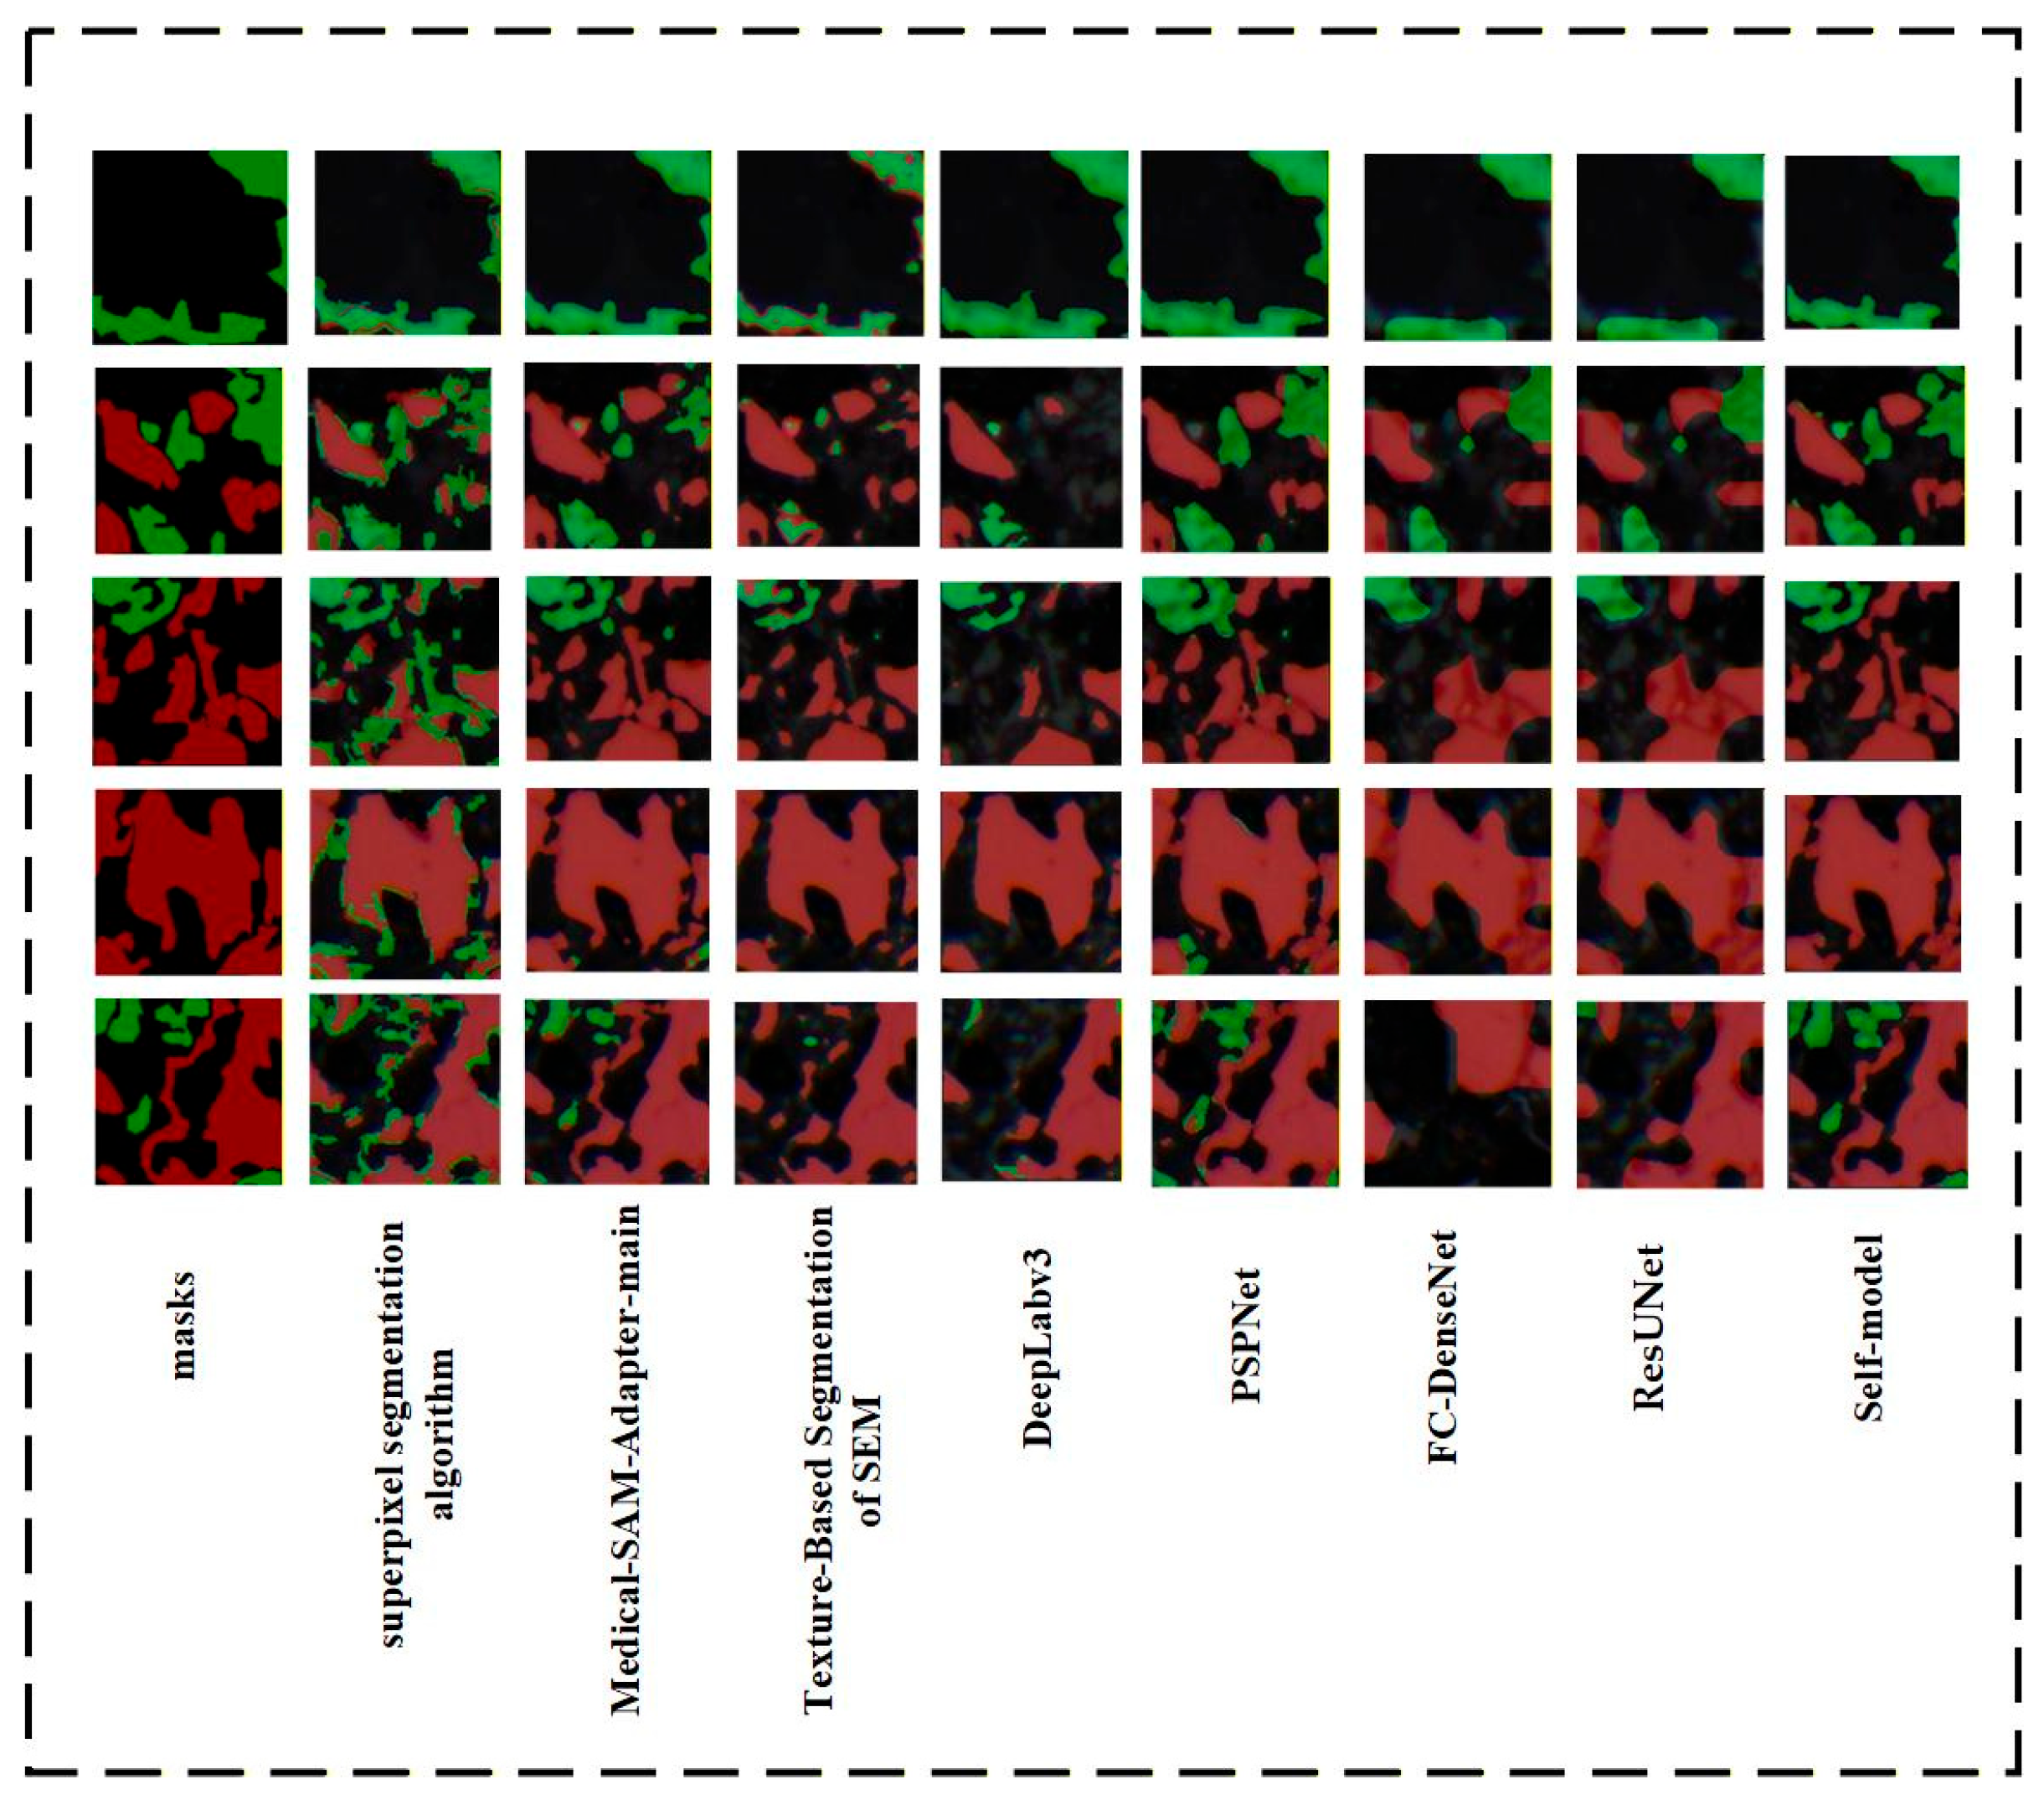
To further verify the segmentation superiority of the proposed model, the segmentation results of different methods are visualized to provide an intuitive comparison of their performance in boundary detail preservation and complex region segmentation, as shown in
Figure 17:
As shown in
Table 8 and
Figure 17, the traditional superpixel-based segmentation method exhibits the weakest performance in this task. It shows limited capability in distinguishing magnetite from other mineral phases within complex microstructures, and tends to produce fragmented regions and misclassifications. Compared with the traditional approach, texture-based segmentation of SEM images shows some improvement; however, it remains constrained by the representational capacity of handcrafted features and exhibits unstable behavior in regions with complex boundaries.
Among deep learning approaches, DeepLabv3, PSPNet, and FC-DenseNet—by incorporating atrous convolutions, multi-scale pooling, or dense connections—generally achieve better overall performance than traditional methods. However, boundary regions may still exhibit some degree of over-smoothing or local misclassification. Medical-SAM-Adapter-main performs relatively well in semantically consistent regions; nevertheless, owing to its general-purpose visual pretraining, deviations can still be observed near boundaries. In contrast, the proposed Self-model achieves the highest scores across the reported metrics among the evaluated methods under our experimental settings. As illustrated in
Figure 17, the Self-model produces predictions with more consistent mineral boundary continuity and pore-region integrity, and it shows improved separation between magnetite and other phases. Misclassifications and boundary jaggedness also appear less frequent. These results are consistent with the combined effects of the model design, including multi-scale feature extraction based on VGG16-U-Net, attention modules that adaptively emphasize informative channels and spatial regions, and KL divergence regularization that moderates overly confident predictions, which together contribute to improved segmentation accuracy.
4.6. Complexity Experiments
4.6.1. Complexity Analysis of the Simplified SPC-SA Module
To reduce the implementation complexity of the SPC-SA module while highlighting its core mechanism, the original structure is simplified while retaining key components, including Q/K/V feature extraction, Top-k spatial position selection, and channel self-attention with sparsification. Specifically, the EPGO-based prompt weight generation network and its channel-wise weighting operation on prompt features in the original design are removed, and the additional 1 × 1 convolutional projection layer at the output is discarded, such that the model directly constructs the channel correlation matrix using the selected sparse spatial features and applies Top-k sparsification. This simplification preserves the core concept of SPC-SA, namely modeling inter-channel dependencies via sparse prompts, while significantly reducing the number of parameters and computational cost, thereby making the module more lightweight and easier to implement. To validate the effectiveness of the proposed simplified SPC-SA module, comparative experiments are conducted under the same experimental settings as those reported in the original study, and the results are summarized in
Table 9.
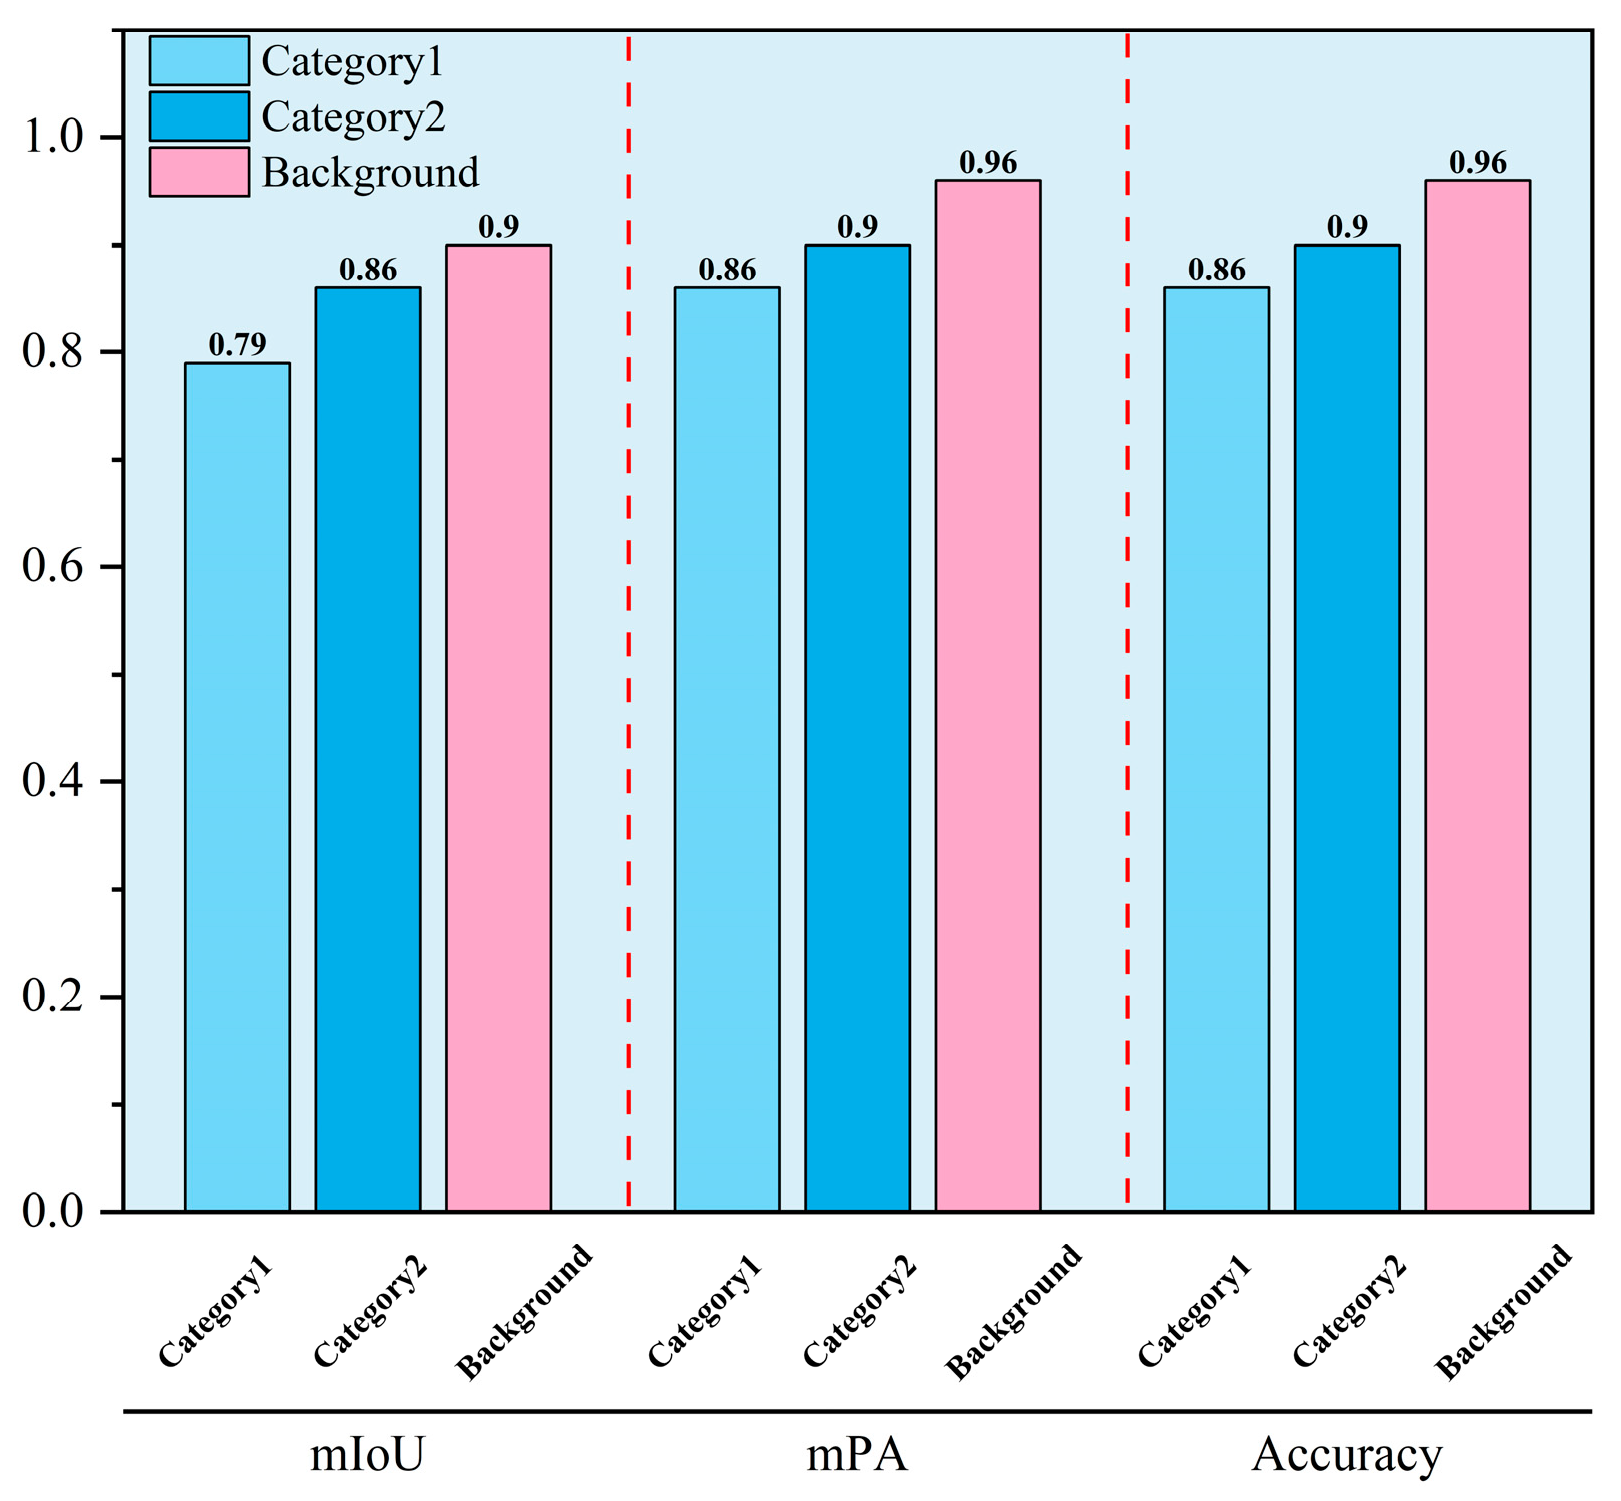
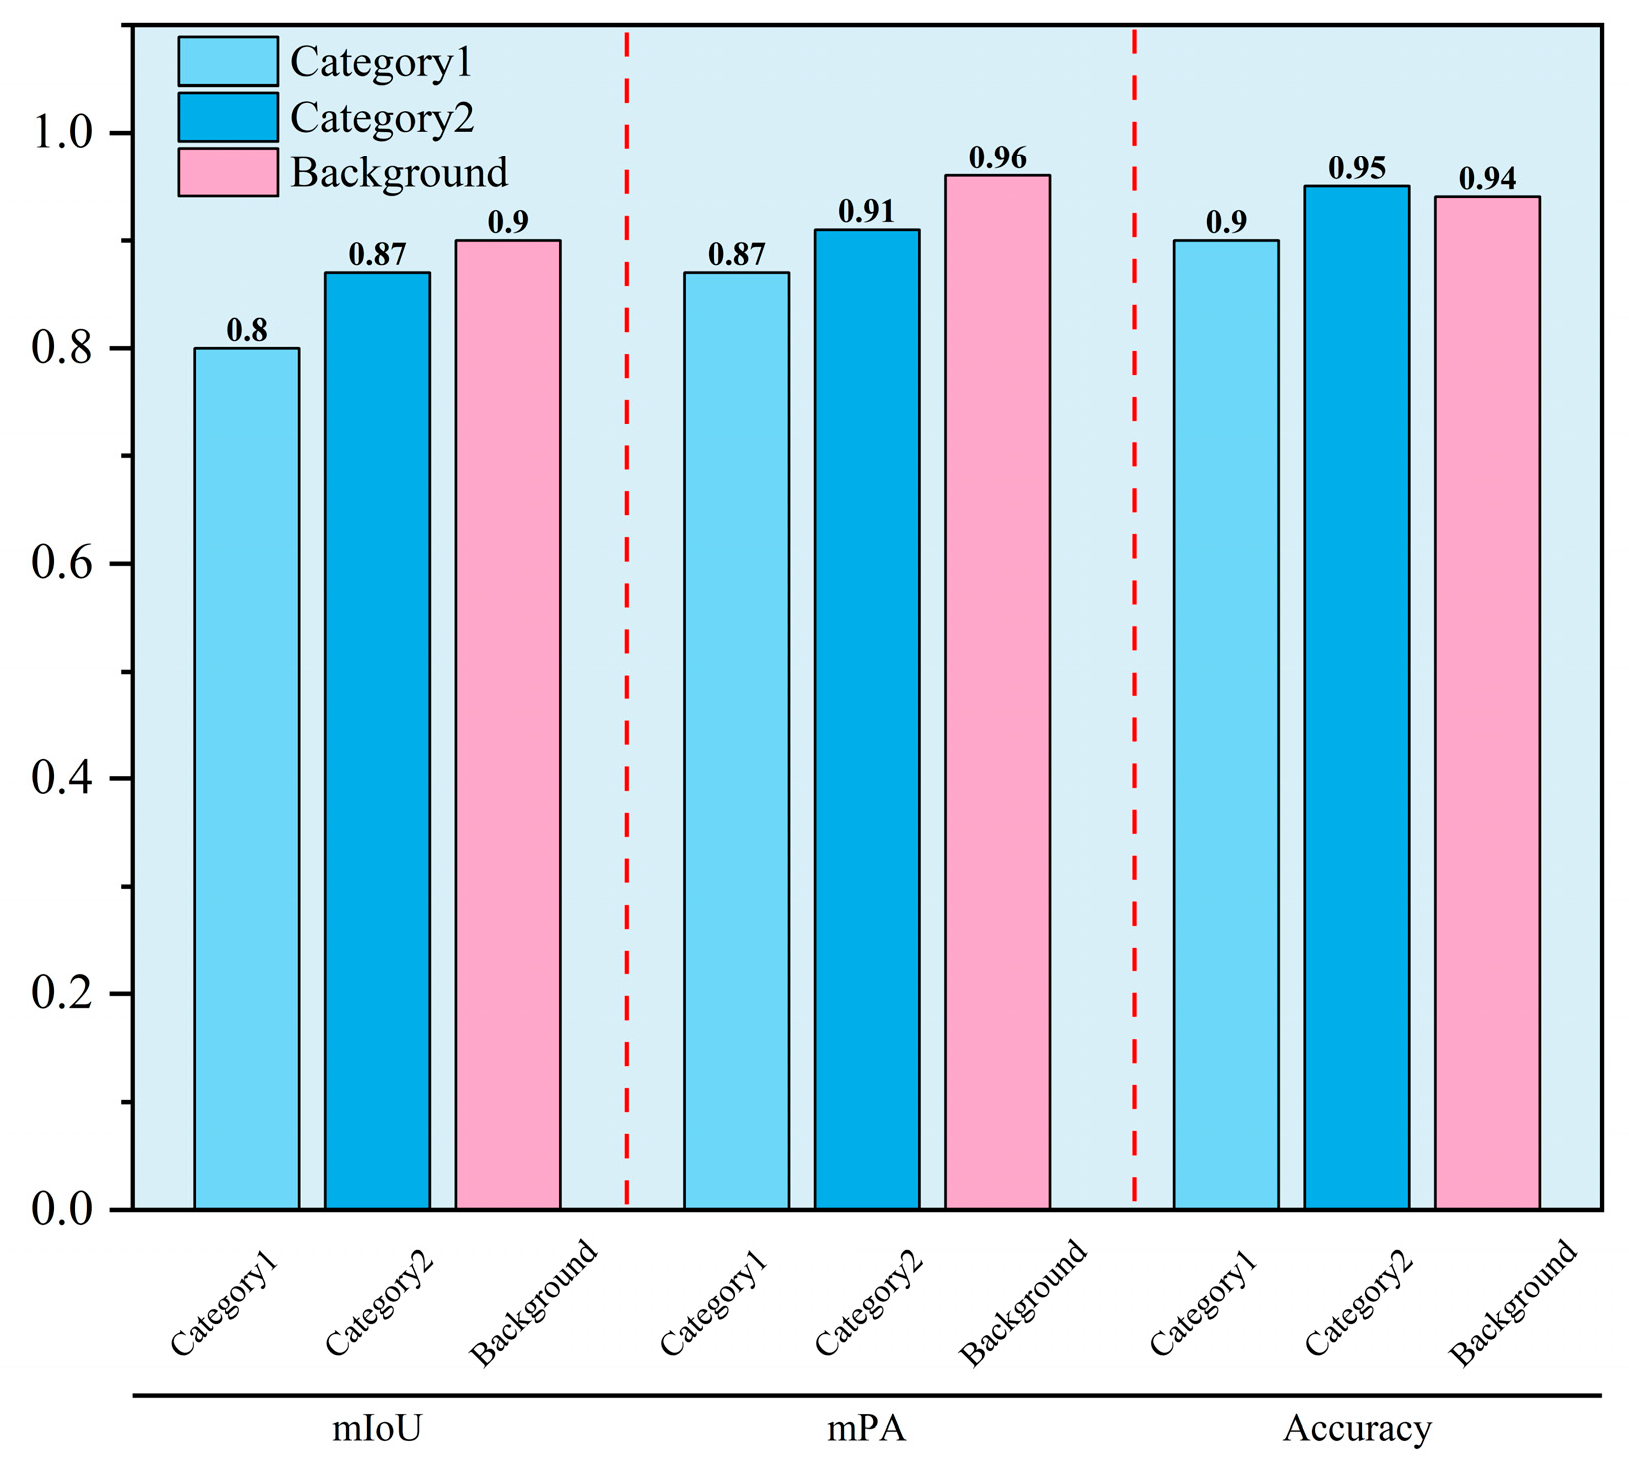
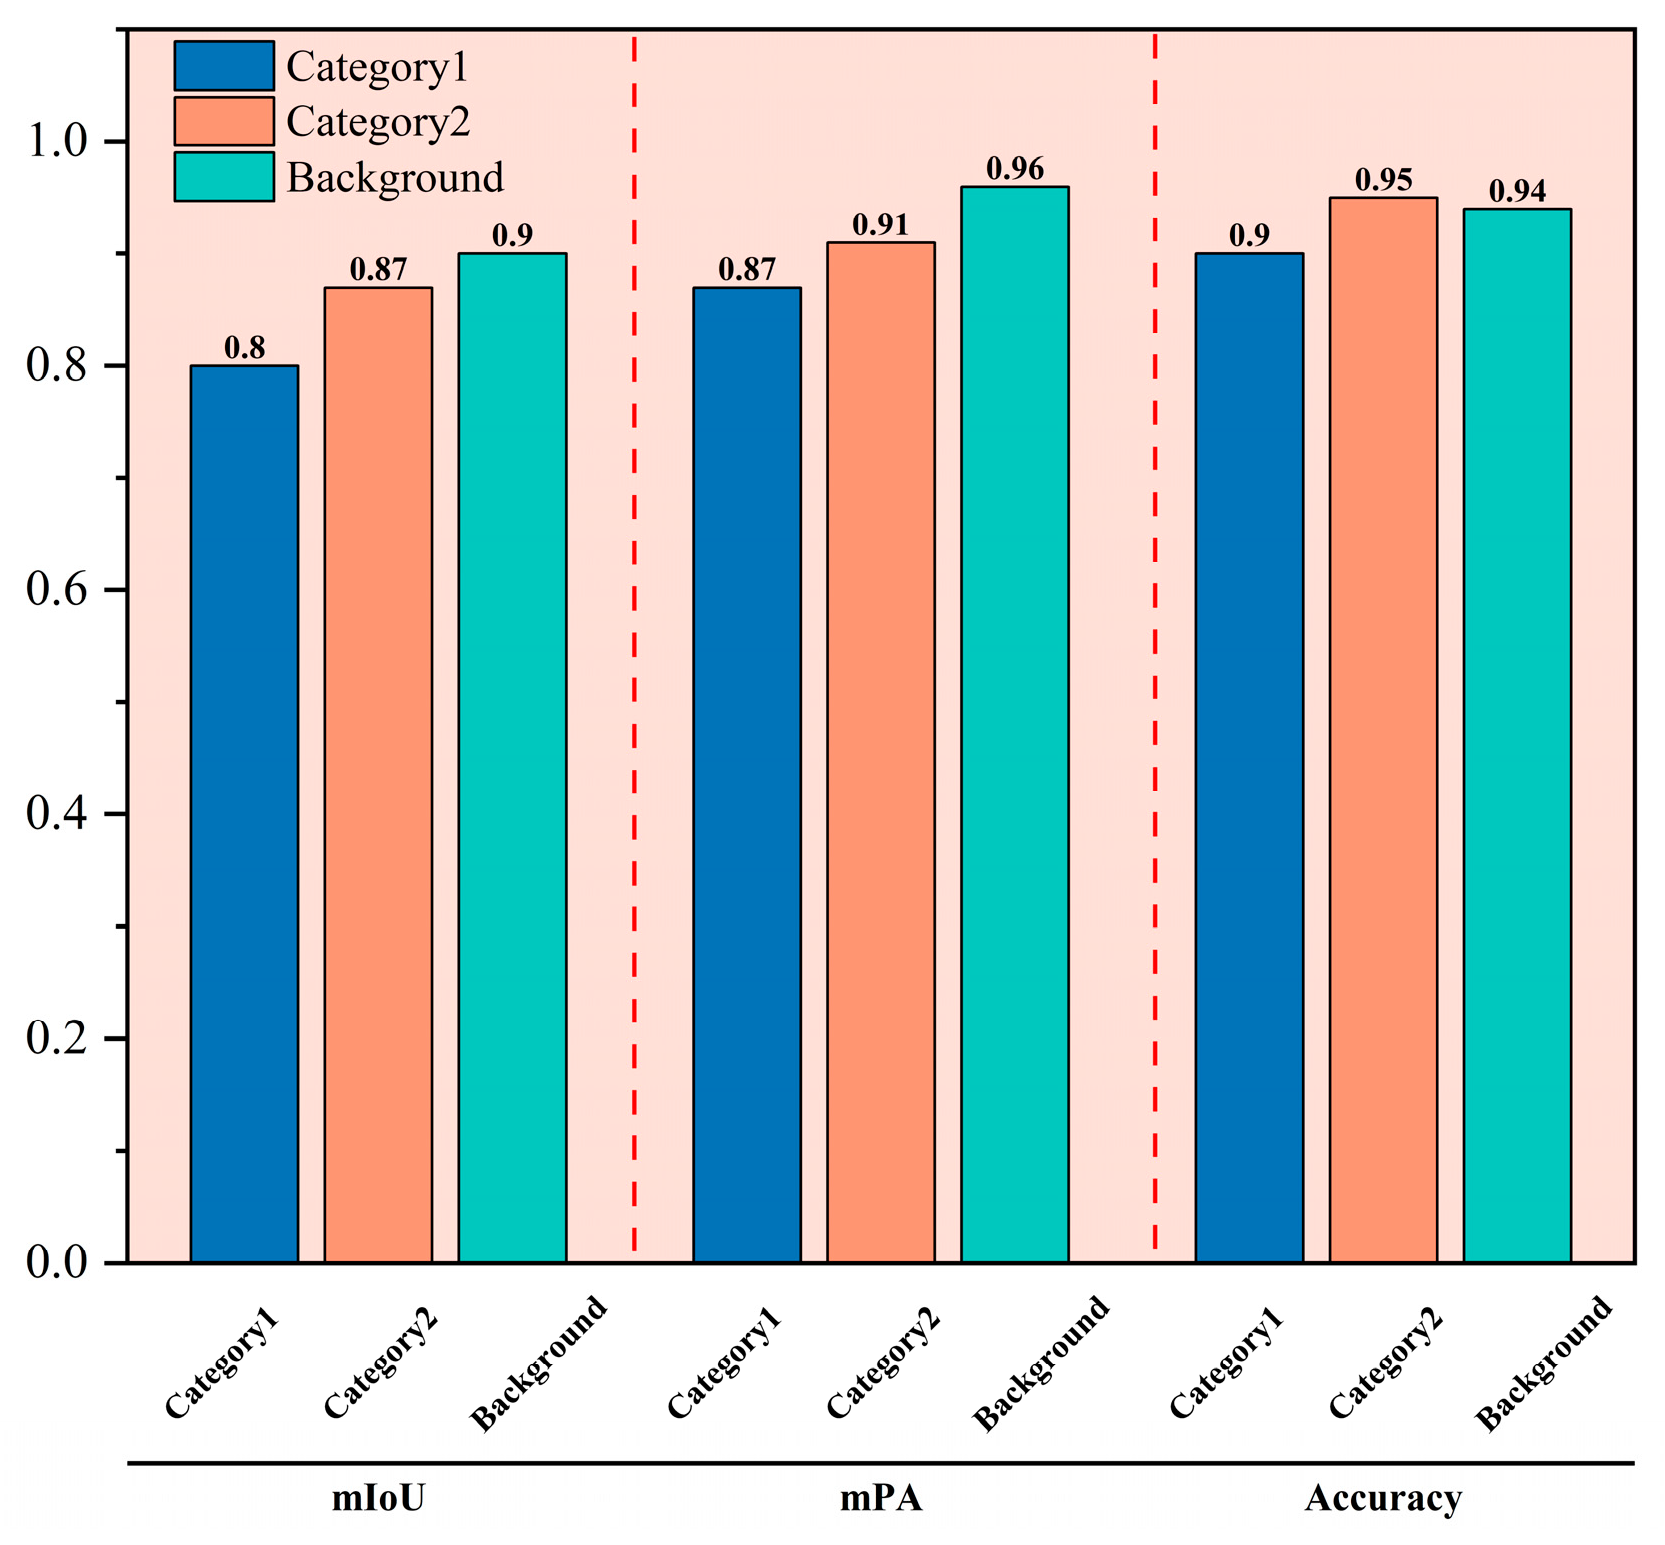
Despite the removal of the EPG weight generation and output projection layers, the simplified SPC-SA module maintains—and even slightly improves—the overall model performance. Specifically, the mIoU increases from 84.91% to 85.58%, the mPA improves from 90.86% to 91.54%, and the overall classification Accuracy rises from 92.80% to 93.58%. These results indicate that the simplified architecture not only reduces module complexity and computational overhead but also effectively captures critical inter-channel relationships, achieving performance comparable to or even better than that of the original design. To further analyze the performance differences between the original SPC-SA and the proposed simplified SPC-SA across different categories, class-wise statistics of mIoU, mPA, and Accuracy are computed for three classes (Category 1, Category 2, and Background), as shown in
Figure 18 and
Figure 19.
The results indicate that the simplified SPC-SA achieves performance comparable to, or slightly better than, the original module across most categories. In particular, the mIoU and Accuracy for Category 1 and Category 2 are noticeably higher than those of the original design, demonstrating that the simplified structure does not compromise the model’s discriminative capability but instead improves overall stability while reducing complexity. To analyze the computational advantages of the simplified SPC-SA module, a quantitative comparison is conducted in terms of FLOPs, parameter count, memory consumption, and inference speed, as summarized in
Table 10.
4.6.2. Simplification of the SAN-SAW Module
To reduce the computational complexity of the original SAN-SAW module and improve inference efficiency, the structure is simplified while preserving its core semantic-aware enhancement principle. Specifically, the original SAN computes class-wise weighted means and variances based on category probabilities to achieve semantic-conditioned normalization, whereas the simplified SAN replaces class-wise statistics with global channel attention, generating channel weights from global context to approximately align features across different semantic regions. Meanwhile, the original SAW involves semantic whitening and class–channel relationship modeling, which incurs substantial computational cost; in contrast, the simplified SAW adopts a lightweight spatial attention mechanism that enhances semantically salient regions via pixel-level weighting, thereby achieving a similar semantic-sensitive feature reweighting effect. Overall, the simplified SAN-SAW significantly reduces parameter count and computational overhead while effectively retaining semantic-aware modulation capability, making it more suitable as a lightweight enhancement module in the decoding stage. To validate the effectiveness of the proposed simplified SAN-SAW module, comparative experiments are conducted under the same experimental settings as those used in the original study, and the results are summarized in
Table 11.
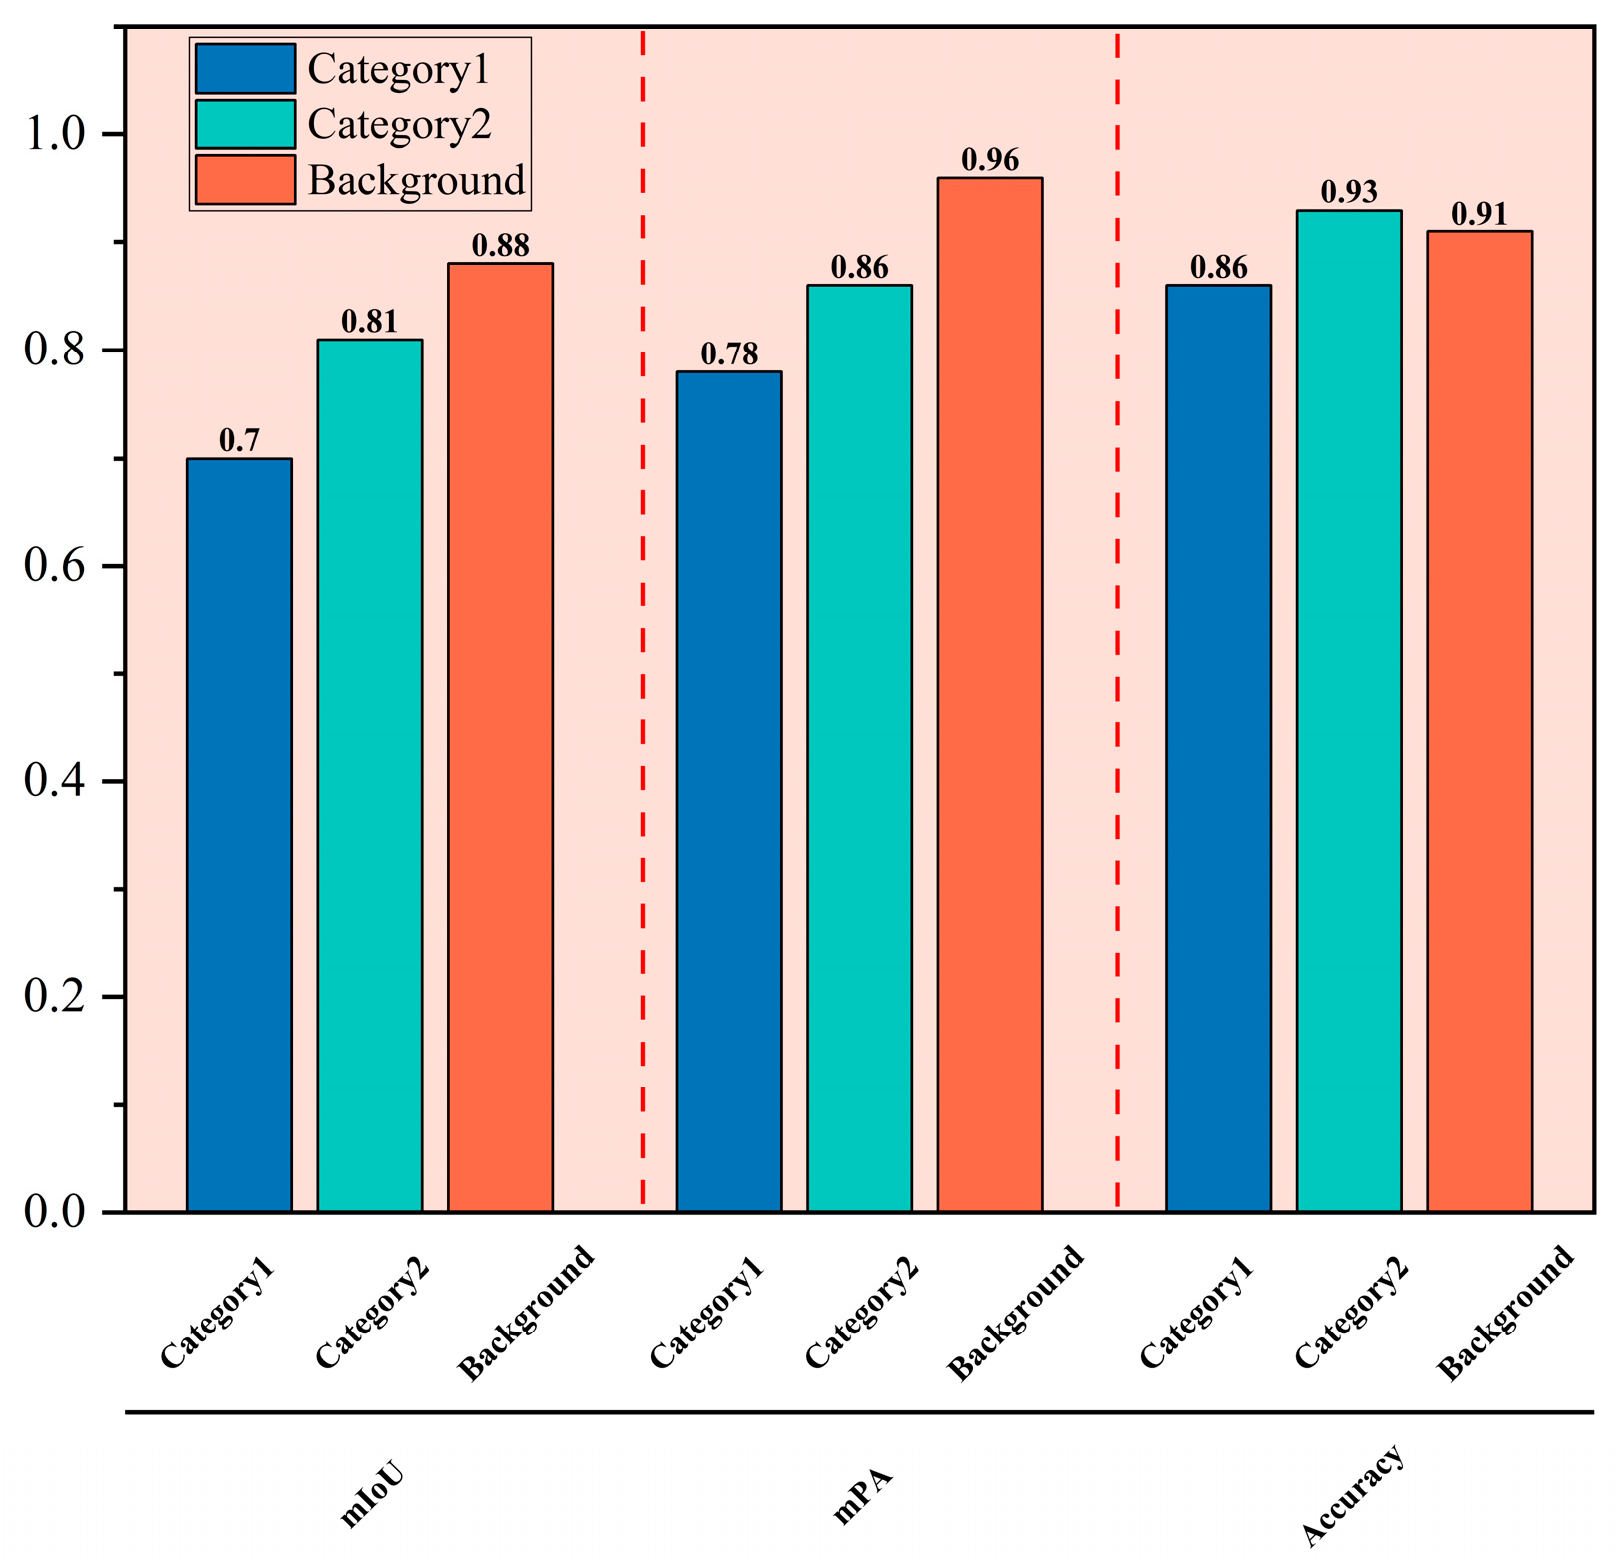
To further analyze the performance differences between the original SAN-SAW and the proposed simplified SAN-SAW modules across different categories, class-wise statistics of mIoU, mPA, and Accuracy are computed for three classes (Category 1, Category 2, and Background), as shown in
Figure 20 and
Figure 21.
A comparison between
Figure 20 and
Figure 21 shows that the simplified SAN-SAW achieves varying degrees of improvement over the original module across all categories in terms of mIoU, mPA, and Accuracy. While reducing semantic statistical computations, the simplified approach effectively enhances semantically relevant features through lightweight channel and spatial attention mechanisms, thereby achieving more stable and superior class-wise performance under lower computational complexity. To further analyze the computational advantages of the simplified SPC-SA module, a quantitative comparison is conducted, as summarized in
Table 12.
As shown in
Table 12, the simplified SAN-SAW module exhibits a slight reduction in computational complexity compared with the original design, while achieving more pronounced improvements in inference efficiency. The simplified version maintains nearly identical FLOPs and parameter count; however, the activation memory decreases slightly from 876.50 MB to 875.50 MB, indicating that the lightweight structure reduces intermediate feature storage overhead. In terms of runtime efficiency, the latency is reduced from 30.338 ms to 28.111 ms, corresponding to an inference speed improvement of approximately 7.3%, while the throughput increases from 32.96 FPS to 35.57 FPS. Overall, the simplified SAN-SAW effectively reduces runtime overhead with minimal impact on model capacity, resulting in a more lightweight module with higher inference efficiency.
4.7. Model Evaluation
In the preliminary experiments, the dataset was divided into training and validation sets. To better assess the model’s performance, data augmentation was applied to the dataset to further evaluate the model’s generalization ability. Random sampling was used to allocate 80% of the original data to the training and validation sets, while the remaining 20% was used for the test set. Subsequently, the training and validation sets were split in a 3:1 ratio, resulting in final proportions of 60%, 20%, and 20% for the training, validation, and test sets, respectively. To ensure the randomness of the data partitioning, all experiments were conducted with a fixed random seed. The experimental results are shown in
Table 13:
The experimental results show that after introducing the test set, the model’s performance on the validation and test sets is similar, indicating that the model has good generalization ability.
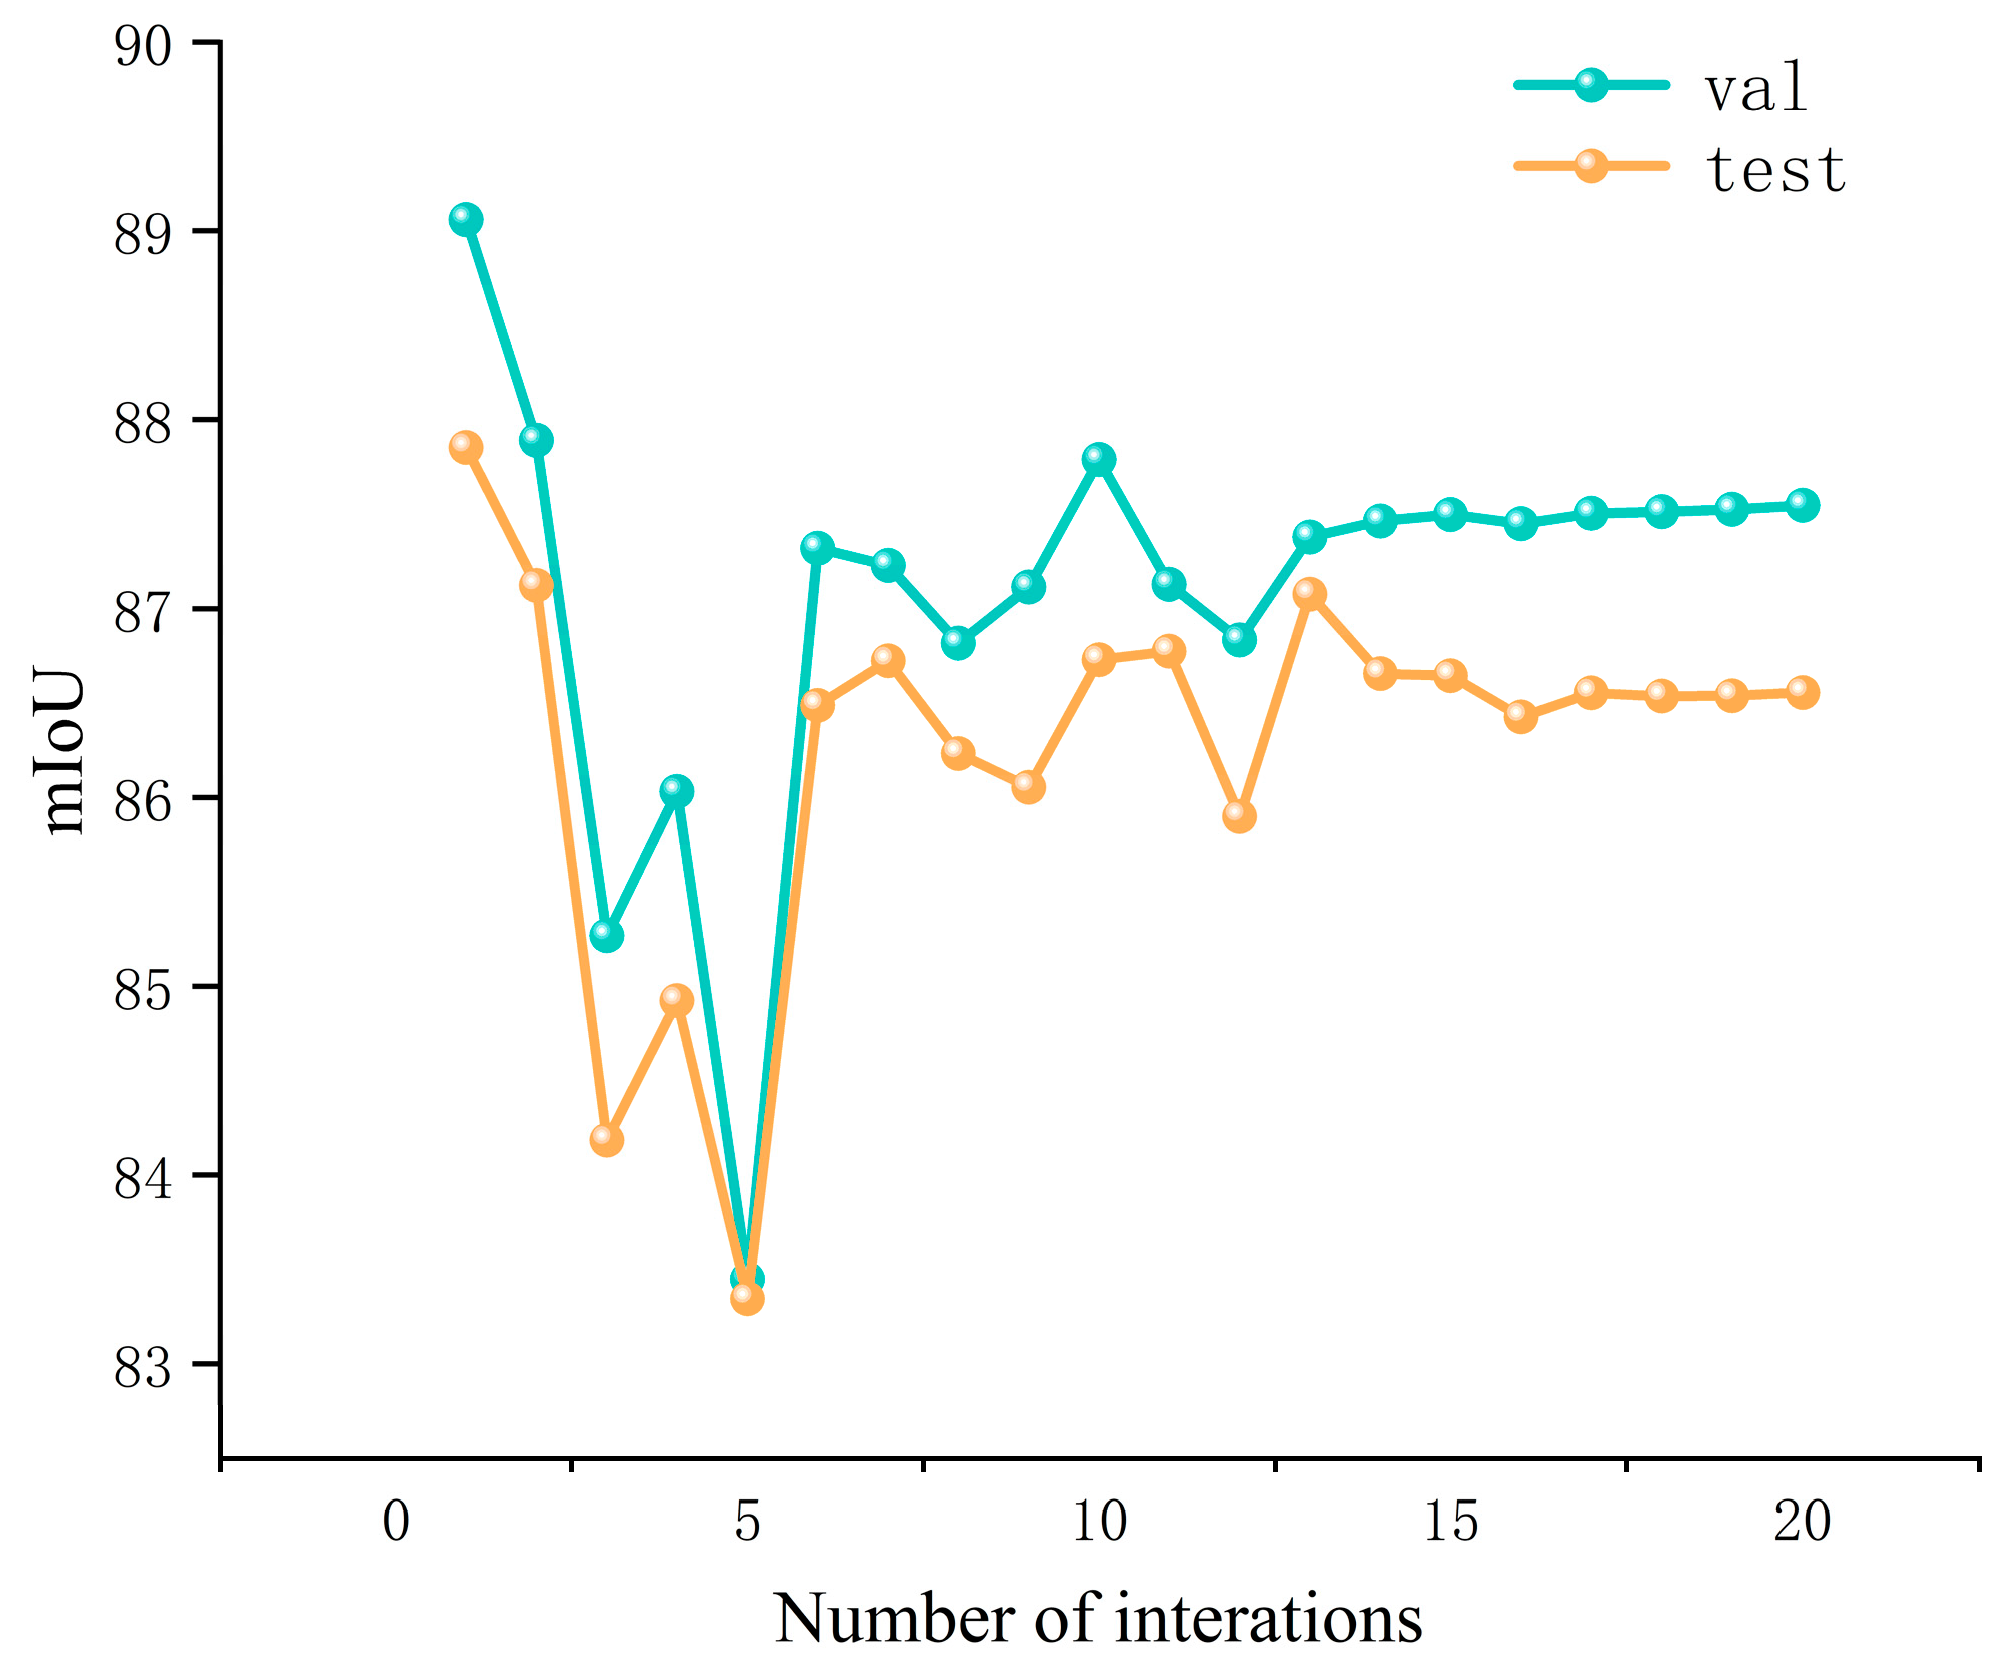
The figure shows the performance changes of the validation and test sets during the model training process. As shown in
Figure 22, it can be observed that the mIoU curves for both the validation and test sets exhibit some fluctuation during training, but their performance gradually stabilizes as training progresses.
To further enhance the model’s generalization ability, data augmentation techniques such as random horizontal and vertical flips, small-angle rotations, slight scaling and padding, and color jittering were applied. All augmentation operations were simultaneously applied to both the images and their corresponding labels, with label images being interpolated using nearest-neighbor interpolation to avoid the loss of class values. Through this data augmentation strategy, the original training set was expanded to 2500 samples, enhancing its performance on unseen data.
As shown in the
Table 14, after augmentation, the Accuracy, mIoU, and mPA metrics for both the test and validation sets have decreased. This indicates that while data augmentation improves generalization ability, it may also introduce complexity, negatively impacting model accuracy. Future work will focus on optimizing the augmentation strategy to balance generalization ability and accuracy.
Although the method proposed in this paper achieves effective segmentation results on two-dimensional microstructure images, its design, based solely on two-dimensional images, has inherent limitations in capturing the true three-dimensional internal structure of particles. Two-dimensional planar images can only reflect information along a single cross-section, often neglecting three-dimensional spatial features perpendicular to the imaging plane. These three-dimensional details are crucial in material internal structure analysis, defect localization, and the evaluation of organizational connectivity. Research has indicated that three-dimensional imaging technology and focused ion beam scanning electron microscopy (FIB SEM) tomography are becoming increasingly widely used in microstructural characterization. These methods allow for non-destructive three-dimensional reconstruction of complex internal structures and reveal spatial geometric details that are difficult to capture with two-dimensional images [
45]. Three-dimensional tomography based on FIB SEM has been applied to the morphological characterization of porous particles and composite materials, providing an intuitive method for studying three-dimensional porosity, phase interfaces, and morphological changes [
46]. Furthermore, research combining micro X-ray CT and deep learning has demonstrated that semantic segmentation of three-dimensional volumetric data allows for higher-precision quantitative analysis of microstructural components and defects, which is crucial for a deeper understanding of the relationship between internal structure and material performance [
47]. Review studies in the field of structural characterization have also emphasized that multi-scale three-dimensional imaging and analysis are essential methods for revealing the connection between complex microstructures and their properties, further indicating that two-dimensional designs may lack sufficient information when dealing with complex three-dimensional geometries [
48].
Therefore, the current design based on two-dimensional images in this paper may have limitations in tasks involving complex three-dimensional geometries or requiring multi-scale feature fusion. Future work could consider incorporating three-dimensional microimaging data or multimodal information to enhance the model’s ability to represent and analyze real internal structures, thereby providing a more comprehensive understanding and prediction of material performance.