Application of Machine Learning to Cluster Analysis of Diabetes Mortality at the Municipality Level in Mexico According to Sociodemographic Factors

 , , , ,
Abstract
1. Introduction
1.1. Computational Applications in Mexico Using Diabetes Data from an Epidemiological Perspective
1.2. Computational Applications on Diabetes Datasets from a Global Epidemiological Perspective
1.3. Application of Machine Learning to Diabetes Datasets
2. Methodology
2.1. Business Understanding
2.2. Data Collection
2.3. Data Preparation
2.3.1. Selection of Attributes
2.3.2. Generation of Indicators
2.3.3. Record Selection
2.3.4. Normalization of Attribute Values
2.4. Modeling
2.4.1. Algorithm k-Means++
| Algorithm 1: k-means++ | |
| 1 | Initialization: |
| 2 | X: = {x1, …, xn}; //The set of data |
| 3 | Assign the value for k; |
| 4 | V: = {}; //The set of centroids is initialized |
| 5 | V: = V U {vi}; //Where the first centroid vi is selected randomly |
| 6 | for i = 2 to k do |
| 7 | Select the i-th centroid vi ∈ X that maximizes probability D(vi)2/∑x∈X D(x)2; |
| 8 | V: = V U {vi}; |
| 9 | end for |
| 10 | Return V; |
| 11 | End of algorithm |
2.4.2. FCM Algorithm
| Algorithm 2: Fuzzy C-Means++ | |
| Input: dataset X, c, m, t, ε | |
| Output: V, U | |
| 1 | Initialization: |
| 2 | X: = {x1, …, xn}; |
| 3 | c: = 20; |
| 4 | Function K++ (X, c); |
| 5 | Return V′; |
| 6 | m: = 1.3; |
| 7 | ε: = 0.01; |
| 8 | t: = 0; |
| 9 | Calculate membership matrix U(0): |
| 10 | Calculate the membership matrix using Equation (5); |
| 11 | Repeat |
| 12 | Calculate centroids: |
| 13 | Calculate the centroids using Equation (6); |
| 14 | t: = t + 1; |
| 15 | Calculate membership matrix U(t): |
| 16 | Calculate the membership matrix using Equation (5); |
| 17 | Until |U(t) − U(t−1)| < ε |
| 18 | End of algorithm |
3. Experimental Results and Discussion
3.1. Experiments Design
3.2. Result Analysis
3.3. Analysis of the Results of Time Patterns of Clusters
3.4. Discussion
4. Conclusions
Author Contributions
Funding
Data Availability Statement
Conflicts of Interest
References
- World Health Organization. Available online: https://www.who.int/es/news-room/fact-sheets/detail/diabetes (accessed on 30 May 2025).
- International Diabetes Federation. Available online: https://idf.org/es/about-diabetes/diabetes-facts-figures/ (accessed on 15 June 2025).
- Organización Panamericana de la Salud. Available online: https://www.paho.org/es/enlace/causas-principales-mortalidad-discapacidad (accessed on 2 June 2025).
- World Health Organization. Available online: https://ourworldindata.org/grapher/death-rate-from-diabetes-ghe?time=latest&mapSelect=FJI~MUS~PLW~TTO~KIR~HRV~MHL~JAM~FSM~BRB~TON~TUV~MEX#sources-and-processing (accessed on 10 July 2025).
- Instituto Nacional de Estadística y Geografía (INEGI). Available online: https://www.inegi.org.mx/app/saladeprensa/noticia/9409 (accessed on 12 July 2025).
- Soto Estrada, G.; Moreno Altamirano, L.; Pahua Díaza, D. Panorama epidemiológico de México, principales causas de morbilidad y mortalidad. Rev. Fac. Med. UNAM 2016, 59, 8–22. [Google Scholar]
- Bragg, F.; Kuri-Morales, P.; Berumen, J.; Garcilazo-Ávila, A.; Gonzáles-Carballo, C.; Ramírez-Reyes, R.; Santacruz-Benitez, R.; Aguilar-Ramirez, D.; Gnatiuc Friedrichs, L.; Herrington, W.G.; et al. Diabetes and infectious disease mortality in Mexico City. BMJ Open Diabetes Res. Care 2023, 11, e003199. [Google Scholar] [CrossRef]
- Bragg, F.; Kuri-Morales, P.; Trichia, E.; Torres, J.M.; Baca, P.; Garcilazo-Ávila, A.; González-Carballo, C.; Ramirez-Reyes, R.; Rivas, F.; Aguilar-Ramirez, D.; et al. Type 2 diabetes and cause-specific mortality in Mexico City: A Mendelian randomisation analysis. Lancet Reg. Health-Am. 2025, 45, 101082. [Google Scholar] [CrossRef]
- Revista del Consumidor (PROFECO). Available online: https://bibliotecadelconsumidor.profeco.gob.mx/documento/68155aed350daaf0cb0cd24f (accessed on 26 January 2026).
- Montoya, A.; Gallardo-Rincon, H.; Silva-Tinoco, R.; Garcia-Cerde, R.; Razo, C.; Ong, L.; Stafford, L.; Lenox, H.; Tapia-Conyer, R. Epidemia de diabetes tipo 2 en México. Análisis de la carga de la enfermedad 1990–2021 e implicaciones en la política pública. Gac. Med. Mex. 2023, 159, 488–500. [Google Scholar] [CrossRef]
- Petermann-Rocha, F.; Diaz-Toro, F.; Nazar, G.; Apolinar-Jiménez, E.; Medina, C.; Deo, S.; O’Donovan, G. Diabetes is one of the main drivers of mortality in Mexico: A latent class analysis of chronic diseases using the Mexico City prospective study. Diabetes Obes. Metab. 2025, 27, 5889–5898. [Google Scholar] [CrossRef]
- World Health Organization. Available online: https://www.who.int/es/news/item/14-04-2021-new-who-global-compact-to-speed-up-action-to-tackle-diabetes (accessed on 12 July 2025).
- Pérez-Ortega, J.; Almanza-Ortega, N.N.; Torres-Poveda, K.; Martínez-González, G.; Zavala-Díaz, J.C.; Pazos-Rangel, R. Application of data science for cluster analysis of COVID-19 mortality according to sociodemographic factors at municipal level in Mexico. Mathematics 2022, 10, 2167. [Google Scholar] [CrossRef]
- Pérez-Ortega, J.; Vega-Villalobos, A.; Almanza-Ortega, N.N.; Pazos-Rangel, R.A.; Zavala-Díaz, J.C.; Rodríguez-Lélis, J.M.; Hernández, Y. Prediction of Diabetes Mortality in Mexico City Applying Data Science. In Proceedings of the Progress in Artificial Intelligence and Pattern Recognition, Cham, Switzerland, 4 November 2021. [Google Scholar]
- Khalid, S.; Kim, H.; Kim, H.S. Recent trends in diabetes mellitus diagnosis: An in-depth review of artificial intelligence-based techniques. Diabetes Res. Clin. Pract. 2025, 224, 112221. [Google Scholar] [CrossRef] [PubMed]
- Wang, X.; Si, J.; Li, Y.; Tse, P.; Zhang, G.; Wang, X.; Ren, J.; Xu, J.; Sun, J.; Yao, X. Effectiveness and safety of AI-driven closed-loop systems in diabetes management: A systematic review and meta-analysis. Diabetol. Metab. Syndr. 2025, 17, 238. [Google Scholar] [CrossRef] [PubMed]
- García-Domínguez, A.; Galván-Tejada, C.E.; Magallanes-Quintanar, R.; Gamboa-Rosales, H.; Curiel, I.G.; Peralta-Romero, J.; Cruz, M. Diabetes detection models in Mexican patients by combining machine learning algorithms and feature selection techniques for clinical and paraclinical attributes: A comparative evaluation. J. Diabetes Res. 2023, 2023, 9713905. [Google Scholar] [CrossRef]
- Oikonomou, E.K.; Khera, R. Machine learning in precision diabetes care and cardiovascular risk prediction. Cardiovasc. Diabetol. 2023, 22, 259. [Google Scholar] [CrossRef]
- Chen, Z.; Liu, X.; Li, S.; Wu, Z.; Tan, H.; Yu, F.; Wang, D.; Bo, Y. Machine learning for the prediction of diabetes-related amputation: A systematic review and meta-analysis of diagnostic test accuracy. Clin. Exp. Med. 2025, 25, 151. [Google Scholar] [CrossRef]
- Bello-Chavolla, O.Y.; Rojas-Martinez, R.; Aguilar-Salinas, C.A.; Hernández-Avila, M. Epidemiology of diabetes mellitus in Mexico. Nutr. Rev. 2017, 75, 4–12. [Google Scholar] [CrossRef]
- IBM Analytics. Metodología Fundamental para la Ciencia de Datos. Available online: https://es.scribd.com/document/434999289/metodologia-IBM-pdf (accessed on 30 May 2025).
- Bello-Chavolla, O.Y.; Antonio-Villa, N.E.; Fermín-Martínez, C.A.; Fernández-Chirino, L.; Vargas-Vázquez, A.; Ramírez-García, D.; Basile-Alvarez, M.R.; Hoyos-Lázaro, A.E.; Carrillo-Larco, R.M.; Wexler, D.J.; et al. Diabetes-related excess mortality in Mexico: A comparative analysis of National Death Registries between 2017–2019 and 2020. Diabetes Care 2022, 45, 2957–2966. [Google Scholar] [CrossRef]
- Cervantes, C.A.D.; Baptista, E.A. Mortality from type 2 diabetes mellitus across municipalities in Mexico. Arch. Public Health 2024, 82, 196. [Google Scholar] [CrossRef] [PubMed]
- Green, C.; Hoppa, R.D.; Young, T.K.; Blanchard, J.F. Geographic analysis of diabetes prevalence in an urban area. Soc. Sci. Med. 2003, 57, 551–560. [Google Scholar] [CrossRef]
- Link, C.L.; McKinlay, J.B. Disparities in the prevalence of diabetes: Is it race/ethnicity or socioeconomic status? Results from the Boston Area Community Health (BACH) survey. Ethn. Dis. 2009, 19, 288–292. [Google Scholar]
- Bravo, M.A.; Anthopolos, R.; Miranda, M.L. Characteristics of the built environment and spatial patterning of type 2 diabetes in the urban core of Durham, North Carolina. J. Epidemiol. Community Health 2019, 73, 303–310. [Google Scholar] [CrossRef] [PubMed]
- Fang, L.; Sheng, H.; Tan, Y.; Zhang, Q. Prevalence of diabetes in the USA from the perspective of demographic characteristics, physical indicators and living habits based on NHANES 2009–2018. Front. Endocrinol. 2023, 14, 1088882. [Google Scholar] [CrossRef]
- Crespo, R.; Alvarez, C.; Hernandez, I.; García, C. A spatially explicit analysis of chronic diseases in small areas: A case study of diabetes in Santiago, Chile. Int. J. Health Geogr. 2020, 19, 24. [Google Scholar] [CrossRef]
- Montoya-Betancur, K.V.; Caicedo-Velásquez, B.; Álvarez-Castaño, L.S. Exploratory spatial analysis of diabetes mortality and its relationship with the socioeconomic conditions of Colombian municipalities. Cad. Saude Publica 2020, 36, e00101219. [Google Scholar] [CrossRef] [PubMed]
- Oliveira, F.L.P.; Pimenta, A.M.; Duncan, B.B.; Griep, R.H.; Souza, G.; Barreto, S.M.; Giatti, L. Spatial clusters of diabetes: Individual and neighborhood characteristics in the ELSA-Brasil cohort study. Cad. Saude Publica 2023, 39, e00138822. [Google Scholar] [CrossRef]
- Valson, J.S.; Kutty, V.R.; Soman, B.; Jissa, V.T. Spatial clusters of diabetes and physical inactivity: Do neighborhood characteristics in high and low clusters differ? Asia Pac. J. Public Health 2019, 31, 612–621. [Google Scholar] [CrossRef]
- Zhou, M.; Astell-Burt, T.; Yin, P.; Feng, X.; Page, A.; Liu, Y.; Liu, J.; Li, Y.; Liu, S.; Wang, L.; et al. Spatiotemporal variation in diabetes mortality in China: Multilevel evidence from 2006 and 2012. BMC Public Health 2015, 15, 633. [Google Scholar] [CrossRef] [PubMed]
- Luo, H.M.; Hu, W.B.; Xu, Y.J.; Zheng, X.Y.; He, Q.; Lyu, L.; Meng, R.L.; Xu, X.J.; Zou, F. Identifying high-risk areas for type 2 diabetes mellitus mortality in Guangdong, China: Spatiotemporal clustering and socioenvironmental determinants. Biomed. Environ. Sci. 2025, 38, 585–597. [Google Scholar] [PubMed]
- Marinov, M.; Mosa, A.S.; Yoo, I.; Boren, S.A. Data-mining technologies for diabetes: A systematic review. J. Diabetes Sci. Technol. 2011, 5, 1549–1556. [Google Scholar] [CrossRef]
- Kavakiotis, I.; Tsave, O.; Salifoglou, A.; Maglaveras, N.; Vlahavas, I.; Chouvarda, I. Machine learning and data mining methods in diabetes research. Comput. Struct. Biotechnol. J. 2017, 15, 104–116. [Google Scholar] [CrossRef]
- Khokhar, P.B.; Gravino, C.; Palomba, F. Advances in artificial intelligence for diabetes prediction: Insights from a systematic literature review. Artif. Intell. Med. 2025, 164, 103132. [Google Scholar] [CrossRef] [PubMed]
- Prabhu, P.; Selvabharathi, S. Deep Belief Neural Network Model for Prediction of Diabetes Mellitus. In Proceedings of the 2019 3rd International Conference on Imaging, Signal Processing and Communication (ICISPC), Singapore, 27–29 July 2019. [Google Scholar]
- Elmenshawy, K.; Wael, N.; Ahmed, R.; Eldouh, A. Diabetes prediction using machine learning and explainable artificial intelligence techniques. SciNexuses 2024, 1, 28–43. [Google Scholar] [CrossRef]
- Allani, U. Interactive Diabetes Risk Prediction Using Explainable Machine Learning: A Dash-Based Approach with SHAP, LIME, and Comorbidity Insights. Available online: https://arxiv.org/pdf/2505.05683 (accessed on 11 July 2025).
- Olaniran, O.R.; Sikiru, A.O.; Allohibi, J.; Alharbi, A.A.; Alharbi, N.M. Hybrid random feature selection and recurrent neural network for diabetes prediction. Mathematics 2025, 13, 628. [Google Scholar] [CrossRef]
- Omar Yaxmehen, B.-C.; Jessica Paola, B.-L.; Arsenio, V.-V.; Neftali Eduardo, A.-V.; Alejandro, M.-S.; Carlos, A.F.-M.; Rosalba, R.; Roopa, M.; Ivette, C.-B.; Sergio, H.-J.; et al. Clinical characterization of data-driven diabetes subgroups in Mexicans using a reproducible machine learning approach. BMJ Open Diabetes Res. Care 2020, 8, e001550. [Google Scholar] [CrossRef]
- Tanabe, H.; Sato, M.; Miyake, A.; Shimajiri, Y.; Ojima, T.; Narita, A.; Saito, H.; Tanaka, K.; Masuzaki, H.; Kazama, J.J.; et al. Machine learning-based reproducible prediction of type 2 diabetes subtypes. Diabetologia 2024, 67, 2446–2458. [Google Scholar] [CrossRef]
- Antonio-Villa, N.E.; Bello-Chavolla, O.Y.; Fermín-Martínez, C.A.; Ramírez-García, D.; Vargas-Vázquez, A.; Basile-Alvarez, M.R.; Núñez-Luna, A.; Sánchez-Castro, P.; Fernández-Chirino, L.; Díaz-Sánchez, J.P.; et al. Diabetes subgroups and sociodemographic inequalities in Mexico: A cross-sectional analysis of nationally representative surveys from 2016 to 2022. Lancet Reg. Health-Am. 2024, 33, 100732. [Google Scholar] [CrossRef] [PubMed]
- Taurbekova, B.; Sarsenov, R.; Yaqoob, M.M.; Atageldiyeva, K.; Semenova, Y.; Fazli, S.; Starodubov, A.; Angalieva, A.; Sarria-Santamera, A. Cluster analysis in diabetes research: A systematic review enhanced by a cross-sectional study. J. Clin. Med. 2025, 14, 3588. [Google Scholar] [CrossRef]
- Preedasawakul, O.; Wiroonsri, N. 4TaStiC: Time and Trend Traveling Time Series Clustering for Classifying Long-Term Type 2 Diabetes Patients. Available online: https://arxiv.org/pdf/2505.07702 (accessed on 11 July 2025).
- Carrillo-Larco, R.M.; Castillo-Cara, M.; Anza-Ramirez, C.; Bernabé-Ortiz, A. Clusters of people with type 2 diabetes in the general population: Unsupervised machine learning approach using national surveys in Latin America and the Caribbean. BMJ Open Diabetes Res. Care 2021, 9, e001889. [Google Scholar] [CrossRef]
- Manzini, E.; Vlacho, B.; Franch-Nadal, J.; Escudero, J.; Génova, A.; Reixach, E.; Andrés, E.; Pizarro, I.; Portero, J.-L.; Mauricio, D.; et al. Longitudinal deep learning clustering of type 2 diabetes mellitus trajectories using routinely collected health records. J. Biomed. Inform. 2022, 135, 104218. [Google Scholar] [CrossRef] [PubMed]
- Abbasi, M.; Tosur, M.; Astudillo, M.; Refaey, A.; Sabharwal, A.; Redondo, M.J. Clinical characterization of data-driven diabetes clusters of pediatric type 2 diabetes. Pediatr. Diabetes 2023, 2023, 6955723. [Google Scholar] [CrossRef] [PubMed]
- Priambodo, B.; Amalia, R.F.; Jumaryadi, Y.; Naf’an, E.; Ahmad, A.; Kadir, R.A. Evaluating Lifestyle Factors Contributing to Diabetes Using K-Means Clustering. In Proceedings of the 2025 International Conference on Computer Sciences, Engineering, and Technology Innovation (ICoCSETI), Jakarta, Indonesia, 21 January 2025. [Google Scholar]
- Ruiz-Lopez, J.; Pérez-Ortega, J.; Ortiz-Hernandez, J.; Hernandez, Y.; Saenz-Sanchez, S. Systematic Review of Methodologies in Data Science. In Proceedings of the 2021 Mexican International Conference on Computer Science, Morelia, Mexico, 9–11 August 2021. [Google Scholar]
- Dirección General de Información Sanitaria (DGIS). Available online: http://www.dgis.salud.gob.mx/contenidos/basesdedatos/da_defunciones_gobmx.html (accessed on 30 May 2025).
- Catálogo Único de Claves de Áreas Geoestadísticas, Estatales, Municipales y Localidades. Available online: https://www.inegi.org.mx/app/ageeml (accessed on 30 May 2025).
- Instituto Nacional de Estadística y Geografía (INEGI). Available online: https://www.inegi.org.mx/programas/ccpv/2020/#Datos_abiertos (accessed on 30 May 2025).
- Consejo Nacional de Evaluación de la Política de Desarrollo Social (CONEVAL). Available online: https://www.coneval.org.mx/Medicion/Paginas/Pobreza-municipio-2010-2020.aspx (accessed on 30 May 2025).
- Sistema Nacional de Información Municipal (SNIM). Available online: http://snim.rami.gob.mx (accessed on 30 May 2025).
- International Statistical Classification of Diseases and Related Health Problems 10th Revision. Available online: https://icd.who.int/browse10/2019/en (accessed on 30 May 2025).
- MacQueen, J. Some Methods for Classification and Analysis of Multivariate Observations. In Proceedings of the 5th Berkeley Symposium on Mathematical Statistics and Probability, Berkeley, CA, USA, 21 June–18 July 1965. [Google Scholar]
- Arthur, D.; Vassilvitskii, S. k-means++: The Advantages of Careful Seeding. In Proceedings of the Eigtheenth Annual ACM-SIAM Symposium on Discrete Algorithms, New Orleans, LA, USA, 7 January 2007. [Google Scholar]
- Bezdek, J.C.; Ehrlich, R.; Full, W. FCM: The Fuzzy C-means clustering algorithm. Comput. Geosci. 1984, 10, 191–203. [Google Scholar] [CrossRef]
- Stetco, A.; Zeng, X.J.; Keane, J. Fuzzy C-means++: Fuzzy C-means with effective seeding initialization. Expert Syst. Appl. 2015, 42, 7541–7548. [Google Scholar] [CrossRef]
- Bezdek, J.C. A Short Tutorial: Some things you might not know about K-means clustering. IEEE Syst. Man Cybern. Mag. 2025, 11, 23–33. [Google Scholar] [CrossRef]
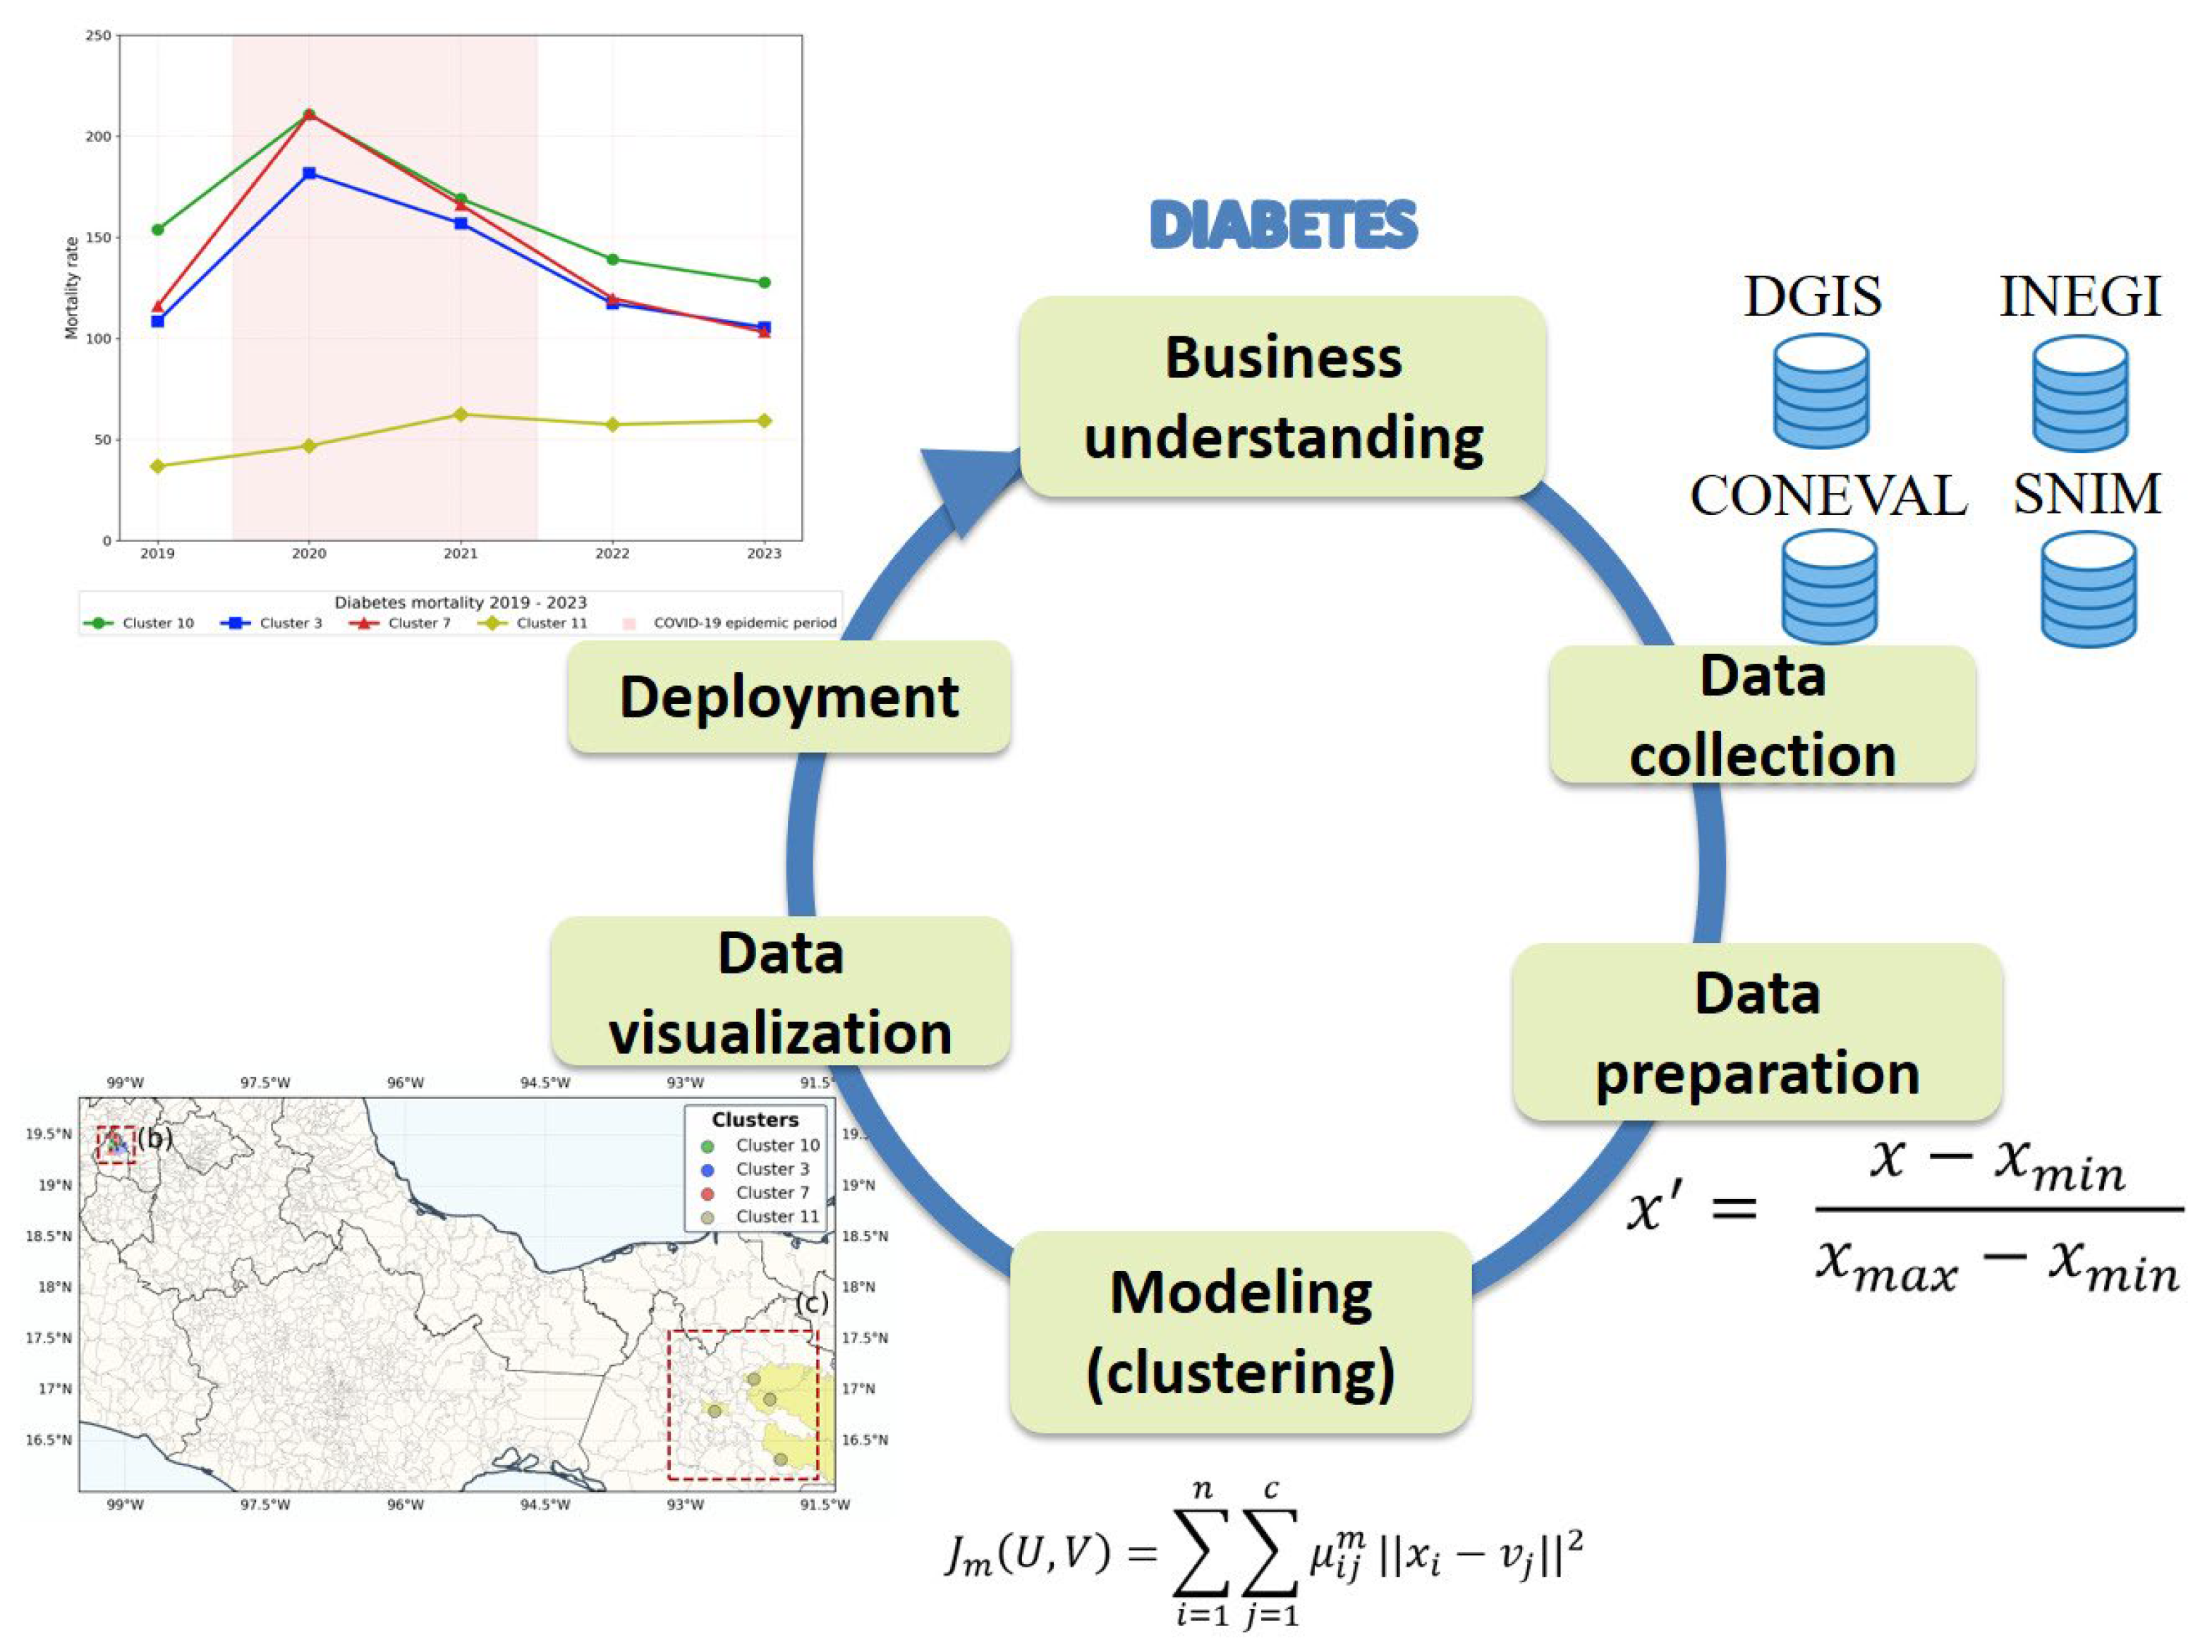





| Source | Dataset | Number of Records | Number of Attributes |
|---|---|---|---|
| DGIS (Dirección General de Información en Salud) [51] | Death records 2019–2023 | 4,604,360 | 59 |
| INEGI (Instituto Nacional de Estadística y Geografía) [52,53] | Population and housing census 2020 | 195,663 | 286 |
| CONEVAL (Consejo Nacional de Evaluación de la Política de Desarrollo Social) [54] | Poverty indicators 2020 | 2469 | 145 |
| SNIM (Sistema Nacional de Información Municipal) [55] | Municipal information records | 2477 | 5 |
| Dataset | Base Attributes |
|---|---|
| Death records 2019–2023 (DGIS) | State code, municipality code, death cause, and date of death |
| Population and housing census 2020 (INEGI) | State code, state name, municipality code, municipality name, total population, longitude, latitude, and altitude |
| Poverty indicators 2020 (CONEVAL) | State code, municipality code, and percentage of population in poverty |
| Municipal information records (SNIM) | State code, state name, municipality code, municipality name, and municipality area in km2 |
| Index | 14 | 16 | 18 | 20 | 22 | 24 |
|---|---|---|---|---|---|---|
| Partition coefficient | 0.9155 | 0.9155 | 0.9215 | 0.9376 | 0.9284 | 0.9299 |
| Partition entropy | 0.1540 | 0.1540 | 0.1481 | 0.1210 | 0.1354 | 0.1336 |
| Silhouette index | 0.4481 | 0.4481 | 0.4411 | 0.4639 | 0.4476 | 0.4551 |
| Cluster | Population Density | Population in Poverty | Number of Municipalities | Average Mortality Rate |
|---|---|---|---|---|
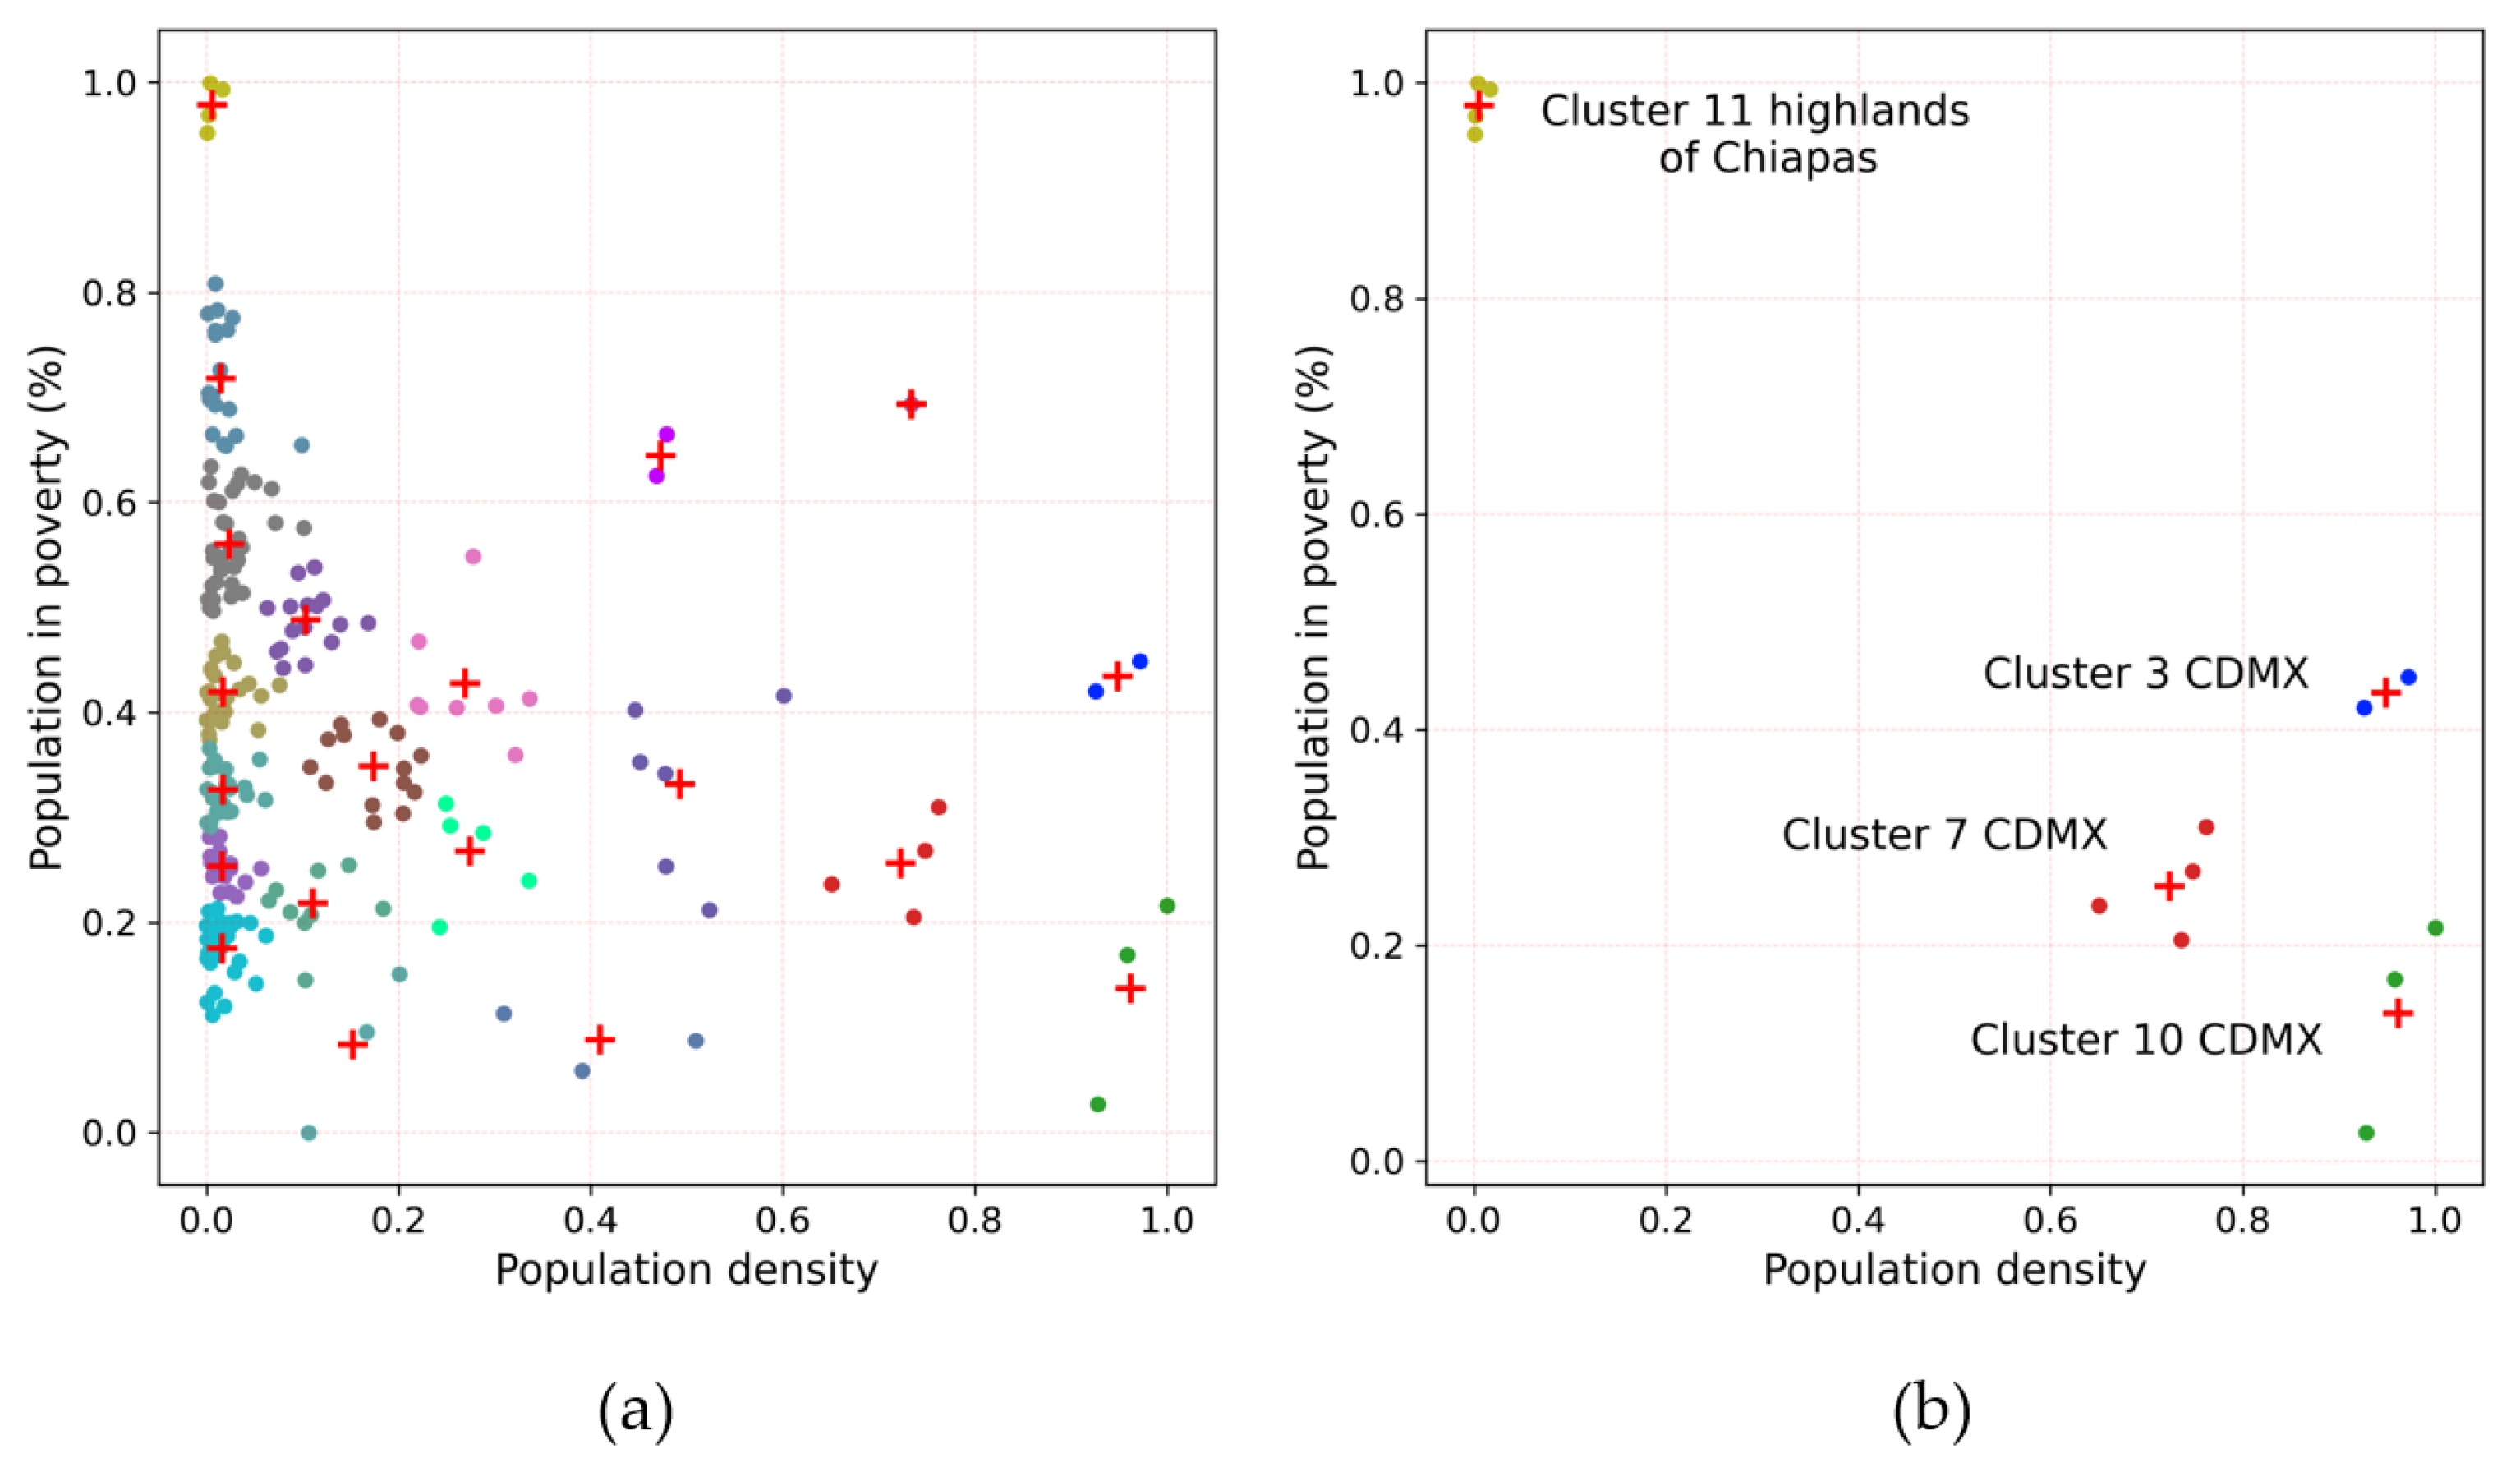
| 10 | 0.9619 | 0.1372 | 3 | 0.5970 |
| 3 | 0.9486 | 0.4344 | 2 | 0.5101 |
| 19 | 0.7339 | 0.6936 | 1 | 0.3699 |
| 7 | 0.7237 | 0.2549 | 4 | 0.5975 |
| 17 | 0.4960 | 0.3296 | 6 | 0.4016 |
| 5 | 0.4733 | 0.6454 | 2 | 0.3876 |
| 16 | 0.4030 | 0.0866 | 3 | 0.3628 |
| 9 | 0.2734 | 0.2653 | 5 | 0.4049 |
| 4 | 0.2696 | 0.4265 | 8 | 0.3077 |
| 12 | 0.1727 | 0.3479 | 14 | 0.3247 |
| 0 | 0.1576 | 0.0822 | 3 | 0.2110 |
| 13 | 0.1090 | 0.2147 | 9 | 0.1731 |
| 18 | 0.1035 | 0.4866 | 16 | 0.3775 |
| 1 | 0.0236 | 0.5593 | 33 | 0.4097 |
| 14 | 0.0168 | 0.3247 | 26 | 0.2721 |
| 2 | 0.0173 | 0.4171 | 25 | 0.3471 |
| 6 | 0.0161 | 0.1768 | 31 | 0.2196 |
| 8 | 0.0161 | 0.2548 | 20 | 0.2469 |
| 15 | 0.0167 | 0.7180 | 19 | 0.3934 |
| 11 | 0.0056 | 0.9788 | 4 | 0.1078 |
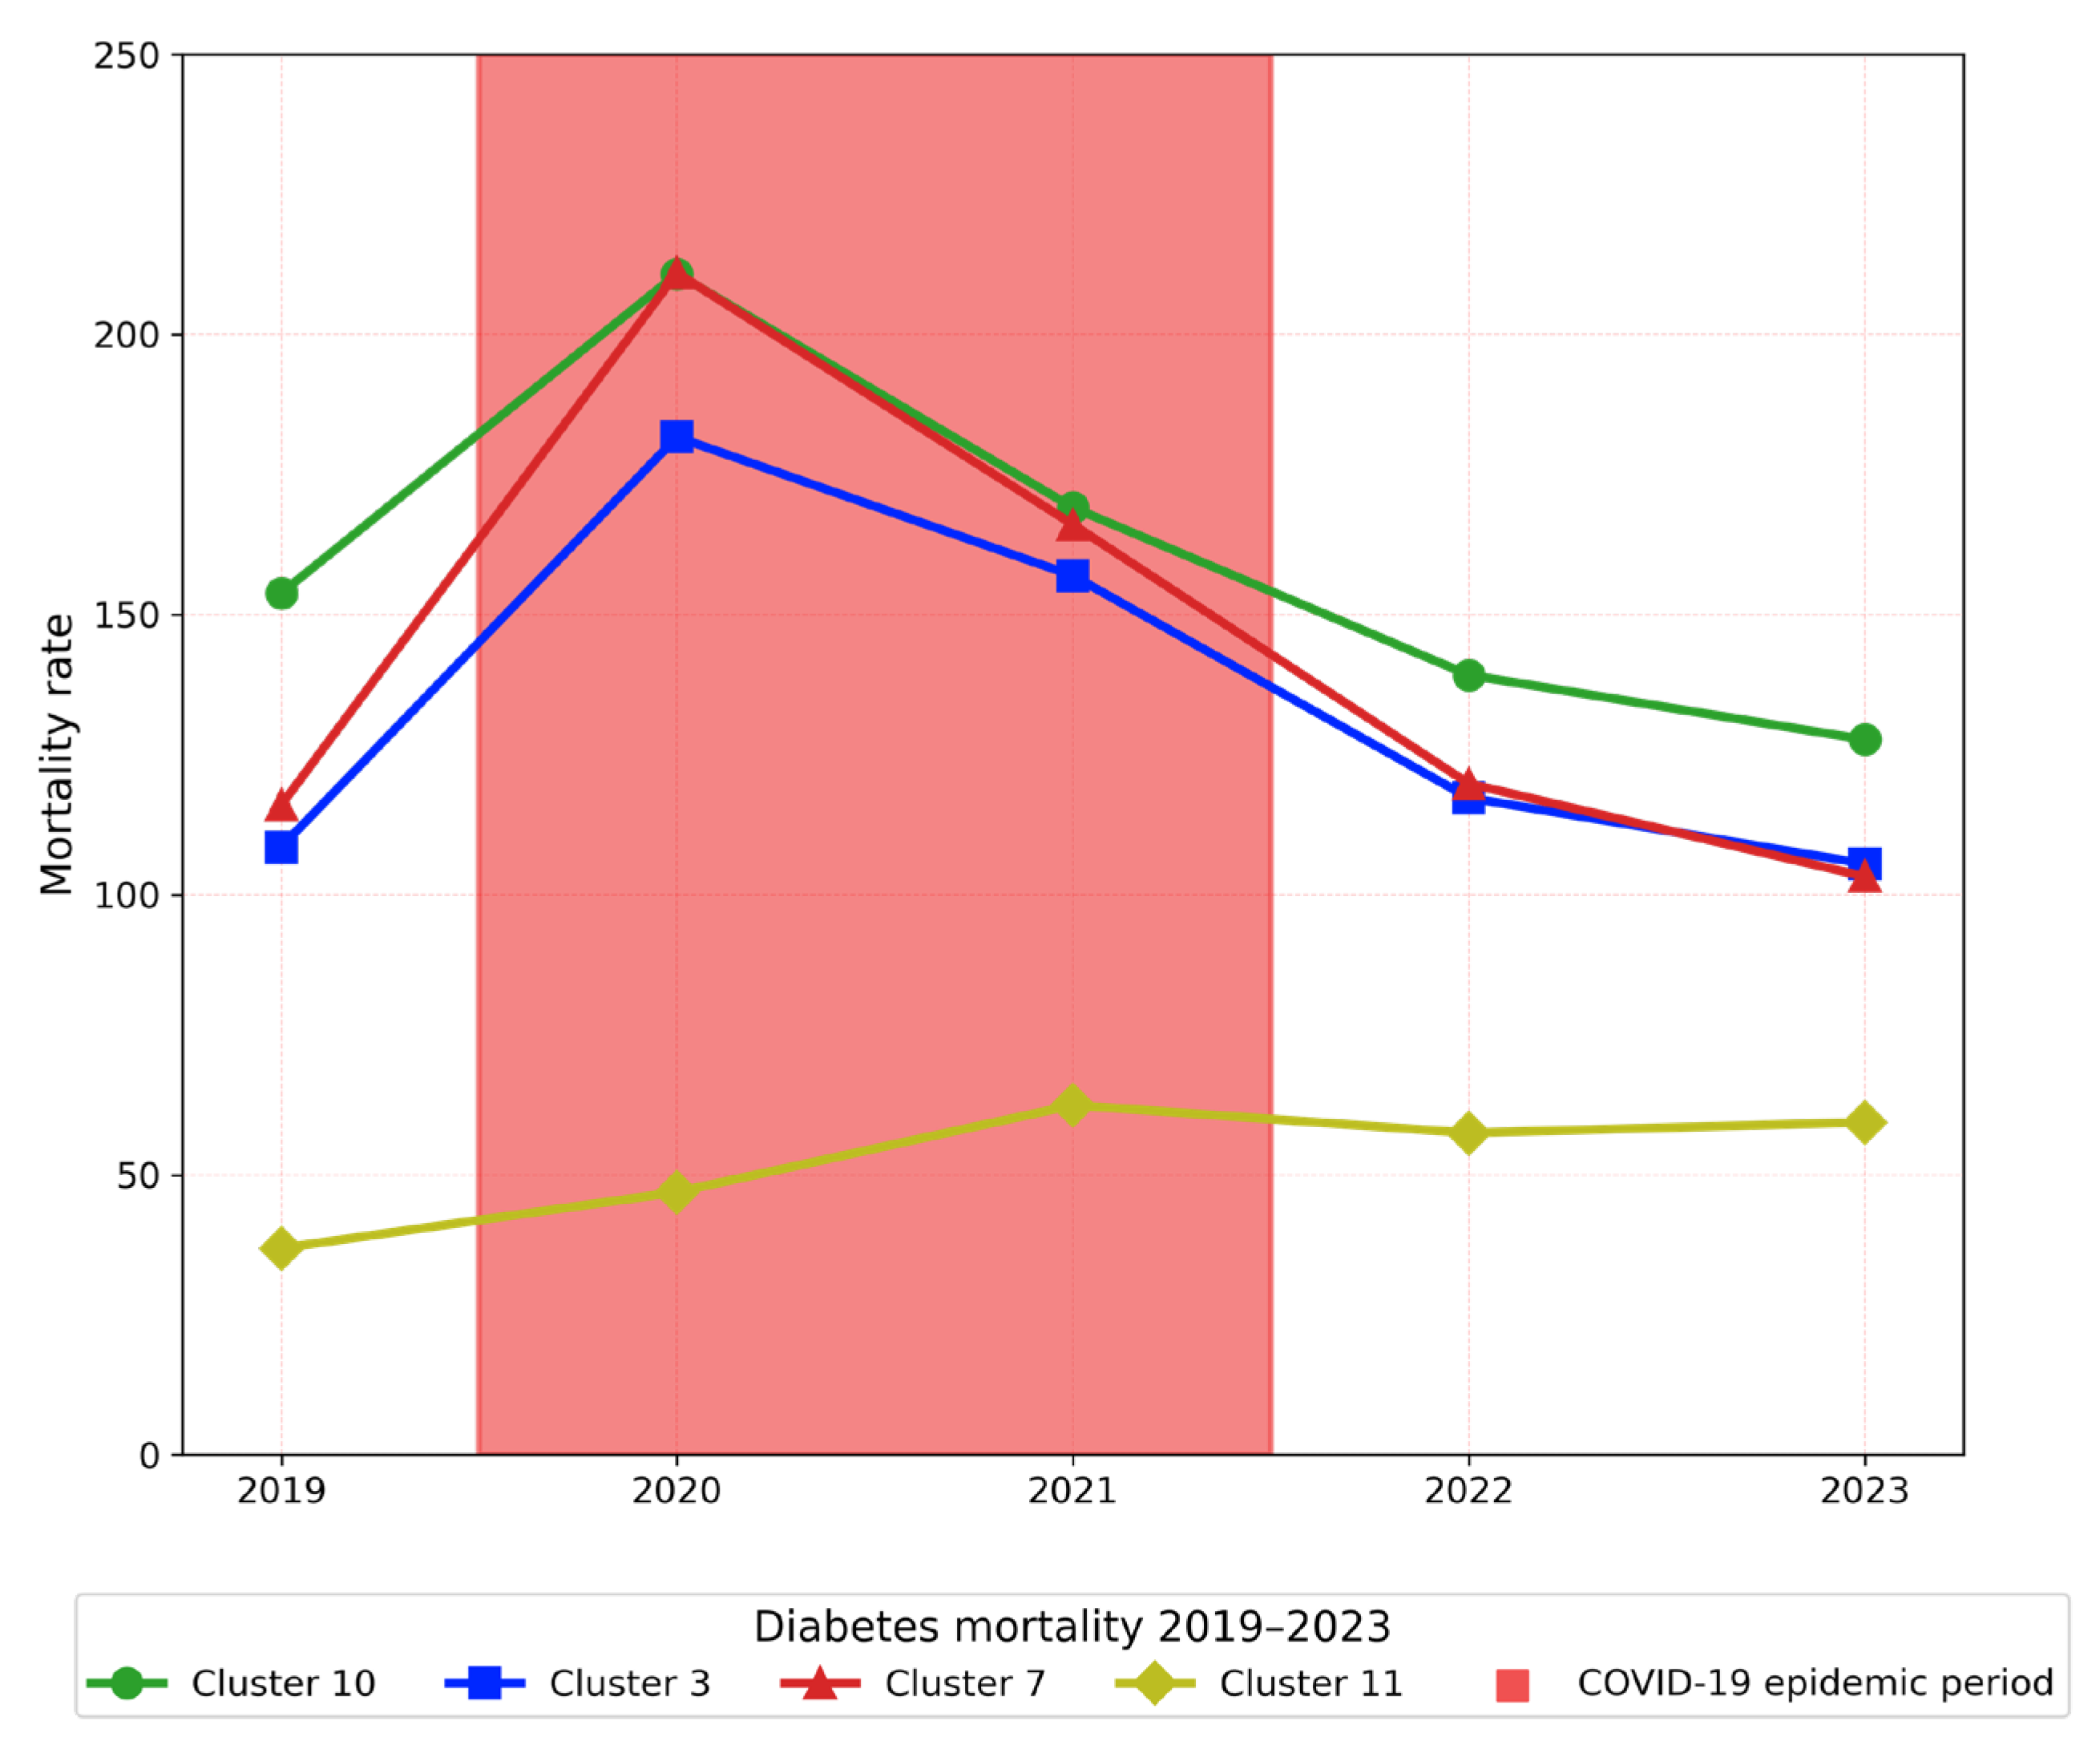
| Year | Cluster | Population Density | Population in Poverty | Average Mortality Rate | Average Age at Death |
|---|---|---|---|---|---|
| 2019 | 10 | 0.9618 | 0.1371 | 153.8019 | 68.4934 |
| 3 | 0.9485 | 0.4343 | 108.4972 | 68.3355 | |
| 7 | 0.7222 | 0.2560 | 115.9756 | 68.8533 | |
| 11 | 0.0056 | 0.9786 | 36.8833 | 63.5742 | |
| 2020 | 10 | 0.9618 | 0.1371 | 210.8076 | 68.5474 |
| 3 | 0.9485 | 0.4343 | 181.6783 | 67.6134 | |
| 7 | 0.7222 | 0.2560 | 210.9831 | 68.8384 | |
| 11 | 0.0056 | 0.9786 | 46.9043 | 64.0137 | |
| 2021 | 10 | 0.9618 | 0.1371 | 169.1083 | 69.0481 |
| 3 | 0.9485 | 0.4343 | 156.9382 | 68.8953 | |
| 7 | 0.7222 | 0.2560 | 166.0642 | 69.5284 | |
| 11 | 0.0056 | 0.9786 | 62.4245 | 64.3385 | |
| 2022 | 10 | 0.9618 | 0.1371 | 139.2098 | 70.0100 |
| 3 | 0.9485 | 0.4343 | 117.2857 | 70.3936 | |
| 7 | 0.7222 | 0.2560 | 119.8149 | 70.7411 | |
| 11 | 0.0056 | 0.9786 | 57.4546 | 63.2591 | |
| 2023 | 10 | 0.9618 | 0.1371 | 127.6741 | 70.0408 |
| 3 | 0.9485 | 0.4343 | 105.5273 | 70.1341 | |
| 7 | 0.7222 | 0.2560 | 103.2399 | 70.6185 | |
| 11 | 0.0056 | 0.9786 | 59.3680 | 63.4612 |
| Cluster | State | Municipality |
|---|---|---|
| 10 | CDMX | Iztacalco |
| CDMX | Benito Juárez | |
| CDMX | Cuauhtémoc | |
| 3 | CDMX | Iztapalapa |
| Estado de México | Nezahualcóyotl | |
| 7 | CDMX | Azcapotzalco |
| CDMX | Coyoacán | |
| CDMX | Gustavo A. Madero | |
| CDMX | Venustiano Carranza | |
| 11 | Chiapas | Chamula |
| Chiapas | Chilón | |
| Chiapas | Las Margaritas | |
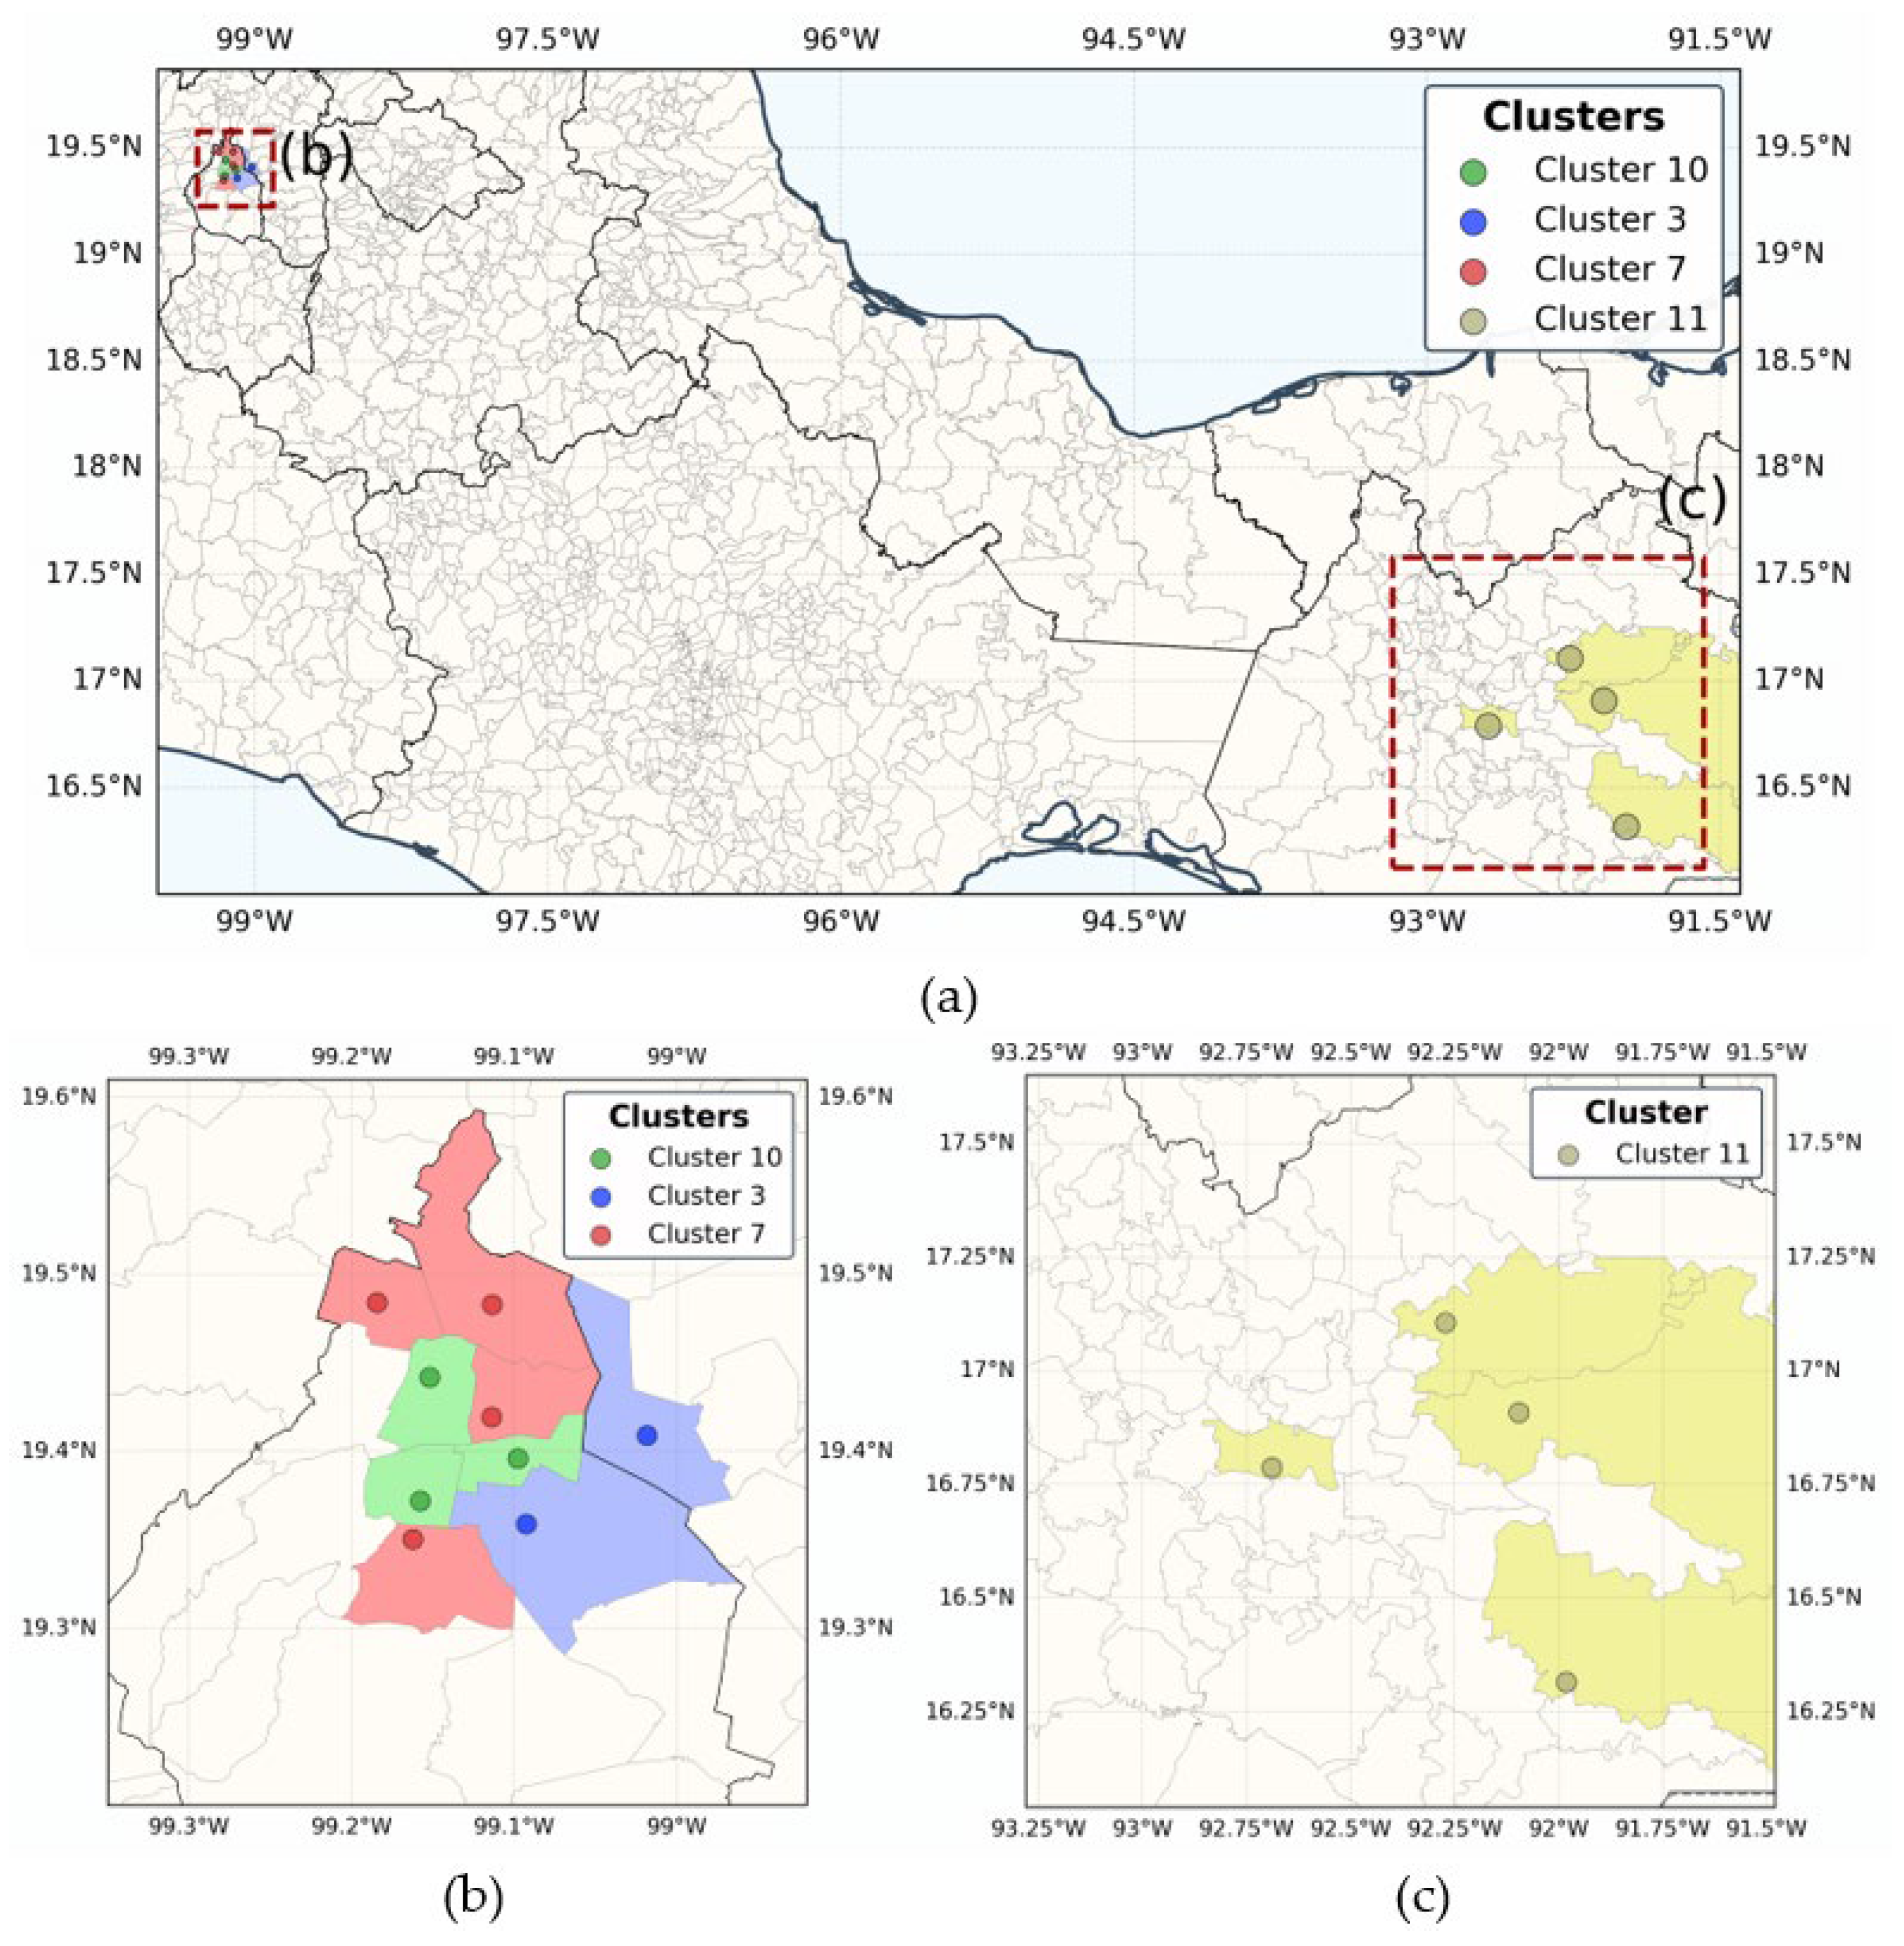
| Chiapas | Ocosingo |
Disclaimer/Publisher’s Note: The statements, opinions and data contained in all publications are solely those of the individual author(s) and contributor(s) and not of MDPI and/or the editor(s). MDPI and/or the editor(s) disclaim responsibility for any injury to people or property resulting from any ideas, methods, instructions or products referred to in the content. |
© 2026 by the authors. Licensee MDPI, Basel, Switzerland. This article is an open access article distributed under the terms and conditions of the Creative Commons Attribution (CC BY) license.
Share and Cite
Almanza-Ortega, N.N.; Moreno-Calderon, C.F.; Roblero-Aguilar, S.S.; Pazos-Rangel, R.; Pérez-Ortega, J.; Landero-Nájera, V.; Castellanos-Escamilla, V.A. Application of Machine Learning to Cluster Analysis of Diabetes Mortality at the Municipality Level in Mexico According to Sociodemographic Factors. Mathematics 2026, 14, 573. https://doi.org/10.3390/math14030573
Almanza-Ortega NN, Moreno-Calderon CF, Roblero-Aguilar SS, Pazos-Rangel R, Pérez-Ortega J, Landero-Nájera V, Castellanos-Escamilla VA. Application of Machine Learning to Cluster Analysis of Diabetes Mortality at the Municipality Level in Mexico According to Sociodemographic Factors. Mathematics. 2026; 14(3):573. https://doi.org/10.3390/math14030573
Chicago/Turabian StyleAlmanza-Ortega, Nelva N., Carlos Fernando Moreno-Calderon, Sandra Silvia Roblero-Aguilar, Rodolfo Pazos-Rangel, Joaquín Pérez-Ortega, Vanesa Landero-Nájera, and Víctor Augusto Castellanos-Escamilla. 2026. "Application of Machine Learning to Cluster Analysis of Diabetes Mortality at the Municipality Level in Mexico According to Sociodemographic Factors" Mathematics 14, no. 3: 573. https://doi.org/10.3390/math14030573
APA StyleAlmanza-Ortega, N. N., Moreno-Calderon, C. F., Roblero-Aguilar, S. S., Pazos-Rangel, R., Pérez-Ortega, J., Landero-Nájera, V., & Castellanos-Escamilla, V. A. (2026). Application of Machine Learning to Cluster Analysis of Diabetes Mortality at the Municipality Level in Mexico According to Sociodemographic Factors. Mathematics, 14(3), 573. https://doi.org/10.3390/math14030573