1. Introduction
In recent years, the rapid growth of global trade has significantly enhanced the critical role of maritime transport within supply chain systems. While this trend has generated substantial economic value, it has also introduced environmental pressures that cannot be overlooked. Globally, the regulation of shipping emissions is increasingly shifting from regional fuel controls to market-based mechanisms, with carbon pricing emerging as a central policy instrument. A prominent example is the phased inclusion of maritime transport in the European Union Emissions Trading System (EU ETS), which began in 2024. Under this system, ships calling at EU ports are required to surrender allowances for their CO2 emissions, effectively internalizing the carbon cost into operational decision-making. This landmark policy advances the alignment of maritime emissions with the Paris Agreement framework by operationalizing a market-based carbon pricing mechanism, thereby establishing a direct and continuous economic signal that incentivizes investment in and adoption of low-carbon technologies. As core nodes of the maritime network, ports have become a significant source of greenhouse gas emissions due to their heavy reliance on fossil fuels in operations.
Therefore, promoting the green transformation of ports and implementing effective emission reduction strategies have become crucial tasks for port managers and stakeholders. Under the guidance of the “dual carbon” goals, China is actively exploring feasible pathways to incorporate the shipping industry into the cap-and-trade mechanism. In line with the national carbon market development plan, the transportation sector has initiated the establishment of a Monitoring, Reporting, and Verification (MRV) system for ship emissions, laying an institutional foundation for the participation of ports and vessels in the cap-and-trade mechanism. Meanwhile, at the local level, pilot areas, such as Shenzhen, are exploring the feasibility of incorporating emissions from ships at berth into regulatory frameworks, signaling that cap-and-trade mechanism is poised to become a significant policy tool for driving the green transition of the shipping industry. Building upon IMO regulations, China has established stringent Emission Control Areas (ECAs). Within these zones, more stringent requirements are imposed on the sulfur content of ship fuels. For instance, within China’s coastal Emission Control Areas, vessels at berth are required to use fuel oil with a sulfur content not exceeding 0.10% m/m, thereby driving the adoption of low-sulfur fuel oil and shore power in port areas [
1]. According to statistics from the Ministry of Transport of the People’s Republic of China, from 2021 to 2024, ships in the 11 provinces and municipalities along the Yangtze River Economic Belt utilized shore power for a cumulative total of over 3.631 million ship-berthing instances, approximately 41.908 million hours, and 460 million kilowatt-hours of electricity consumption. It is equivalent to replacing and saving about 108,000 metric tons of fuel oil, thereby reducing carbon dioxide emissions by approximately 347,000 metric tons [
2].
Competition among shipping companies creates a dual-mechanism influence on their emission reduction decisions, with its effects being particularly pronounced within the dynamic interplay of evolving regulatory frameworks and market preferences. In the highly competitive shipping market, companies often face intense pressure to control costs. Therefore, emission reduction technologies that require high initial capital investment are frequently perceived as competitive disadvantages in decision-making processes. This creates a “prisoner’s dilemma” that individual companies lack the incentive to pioneer investments when their competitors fail to adopt equivalent emission reduction measures, ultimately leading the industry into a deadlock of collective inertia. However, as external conditions evolve, the logic of competition is being reshaped. On one hand, mandatory regulations internalize carbon emissions as operational costs, thereby transforming advanced emission reduction technologies from cost centers into compliance advantages. On the other hand, demand originating from downstream segments of the industrial chain, such as the green premium driven by major shippers committed to supply chain decarbonization, has created new market segments, enabling emission reduction capabilities to serve as a strategic tool for acquiring premium clients, enhancing brand value, and securing more favorable financing conditions (e.g., green credit linked to ESG performance). Therefore, while competition inhibits collaborative emission reduction efforts, it is simultaneously driving leading companies to redefine forward-looking investments in emission reduction as a key strategy for maintaining long-term market leadership and building future core competitiveness. This dynamic, propelled by the combined forces of policy, market, and finance, is gradually steering the industry towards a new competition paradigm oriented around innovation and sustainable development. For instance, the global shipping giant Maersk has placed orders for more than 18 green methanol-powered vessels, with the total investment exceeding ten billion RMB. The company’s CEO explicitly stated that this is not merely an environmental initiative, but a core strategy to ensure the company maintains its market leadership over the next 5–10 years [
3].
Given the cap-and-trade mechanism and competitive environment, should vessels at berth use low-sulfur fuel oil or shore power? This study investigates this question within a port supply chain framework comprising a single port and two competing ships. In this supply chain, the port serves as the upstream entity providing services to vessels, while the ships compete with each other for a limited market share from customers. This framework deviates fundamentally from the prevailing bilateral “port-single ship” bargaining or monopoly pricing models that characterize much of the extant literature on shore power pricing. By explicitly introducing competition between two heterogeneous ships (adopting SP and LSFO respectively), our model captures a tripartite strategic interaction (port-ship-ship). This shifts the analytical focus from a simple vertical cost-sharing or pricing problem to a more complex game where technology choice, service pricing, and market share are simultaneously determined under the constraints of carbon policy and competitive pressure. To analyze this issue, this paper employs a game-theoretic approach to derive equilibria under different market leadership scenarios—specifically, a port-led Stackelberg game and a vessel-led Stackelberg game [
4]—and compares the results.
This study makes three contributions with both theoretical value and practical significance at the intersection of the cap-and-trade mechanism and shipping emission reduction technology selection. First, within a supply chain coordination framework, it systematically compares the techno-economic viability and applicable conditions of two typical emission reduction technologies—shore power and low-sulfur fuel oil—under a cap-and-trade mechanism, thereby deepening the understanding of their differential impacts in terms of operational costs, initial investment, and carbon allowance management. Secondly, through a Stackelberg game model, this study examines how key policy parameters, such as carbon pricing, shape corporate adoption strategies for carbon reduction technologies. The analysis further reveals how policy design guides emission reduction decisions among supply chain members by leveraging market signals. Most notably, this study innovatively incorporates vessel service competition into the analytical framework. It investigates how market competition pressures interact with internal corporate emission reduction incentives, thus influencing the equilibrium outcomes of technology selection. This perspective, to a certain extent, fills a gap in the existing literature. The research findings not only provide a theoretical basis for port enterprises and shipping companies to formulate differentiated and coordinated low-carbon technology investment strategies, but also offer valuable policy insights for government departments in designing a cap-and-trade mechanism that can simultaneously promote emission reduction and maintain industry competitiveness.
2. Literature Review
Against the backdrop of global climate change response and the advancement of “dual carbon” goals, the green transition of the maritime industry has become a focal point for both academia and policymakers. As critical nodes within the maritime network, the emission reduction performance of ports is crucial to the low-carbon transition of the entire supply chain. The choice for vessels at berth between using low-sulfur fuel oil or shore power constitutes a complex decision-making problem involving techno-economic feasibility, policy regulation, and market competition. The literature review in this paper will survey existing studies across the following four interrelated domains to clarify the research positioning and theoretical contributions of this work.
2.1. The Impact of Cap-and-Trade Mechanism on the Shipping Industry
Incorporating market-based mechanisms into emission reduction policies represents a prevailing trend in current discourse. Extensive research has examined the regulatory effects of cap-and-trade mechanism on high-emission industries [
5]. In recent years, scholars have begun to focus on the application prospects of cap-and-trade mechanism in the shipping industry. Existing research has primarily focused on the macro level, including examining the potential economic impacts and emission effects of integrating the shipping industry into the European Union Emissions Trading System (EU ETS) [
6,
7], as well as analyzing pathways for China to establish a Monitoring, Reporting, and Verification (MRV) system for ship carbon emissions [
8]. He et al. [
9] constructed an evolutionary game model between the government and shipping companies to analyze the synergistic effects of dynamic penalty mechanisms and carbon quota trading on the zero-carbon transition. The study revealed that dynamic mechanisms effectively drive the system toward a stable strategy. Factors such as regulatory intensity, penalty caps, and a critical carbon price threshold significantly influence corporate decision-making, with government responses lagging behind corporate behavioral changes. Zhang et al. [
10] modeled emission-reduction investment in competitive shipping logistics chains under cap-and-trade mechanism. They identify three equilibrium strategies influenced by carbon price and spillover effects. The spillover effect and participant altruism are found to critically shape the returns and overall welfare outcomes across different investment scenarios. Wang et al. [
11] studied how the establishment of emission trading system affects ship emission reduction strategies designed for sulfur emission control area.
2.2. SP and LFSO
Shore power (SP) and low sulfur fuel oil (LSFO) are the main technologies for reducing emissions from ships in port. Among them, SP, as an effective port emission reduction technology, has been widely studied [
12]. Zis et al. [
13] used a quantitative framework to assess the potential of shore power and highlighted the critical role of regulatory support for its roll-out. In the study [
14], scholars proposed a calculation method of port charges based on specific environmental conditions to encourage short-distance ships to adopt shore power technology. Reusser et al. [
15] discussed the emission effect of shore power during berthing employing a bidirectional power flow control strategy and optimization of auxiliary engine operation. In addition, Martínez-López et al. [
16] examined regulatory, economic, and environmental factors that may support the standardization of shore power in the Mediterranean region. Tan et al. [
17] analyzed the optimal capacity of shore power berthing (SPB) by incorporating ship selection behavior and examining two government mechanisms: environmental incentive (EI) and infrastructure subsidy (IS). Using a two-layer mathematical programming model, they prove that both EI and IS can promote investment in shore power berths, and the IS scheme has the most significant emission reduction effect. Gu et al. [
18] evaluated the economic and environmental impact of shore power incentives based on life cycle cost analysis and system dynamics model, and the study showed that compared with infrastructure construction subsidies, price subsidies had more advantages in overcoming economic obstacles. Bakar et al. [
19] proposed a data-driven model that combines artificial neural networks, decision trees, random forests, multiple linear regression, and extreme gradient enhancement to optimize shore power usage prediction and berthing plan. Regarding low-sulfur fuel oil (LSFO), Wang et al. [
20] constructed an evolutionary game model between the government and ships to explore the effectiveness of different policy tools (penalties, subsidies, inspections) in curbing the illegal use of high-sulfur fuel by ships in emission control regions. They reveal that simply increasing the success rate of government inspections can slow down the evolution of violations but cannot significantly reduce the final violation rate, while increasing subsidies for the use of low-sulfur fuel can effectively control the violation rate. Xing et al. [
21] conducted a systematic review of alternative marine fuels. In several studies, SP and LSFO are compared and analyzed. For example, Piccoli et al. [
22] used computational analysis to evaluate the benefits of LNG and SP in emission reduction in Switzerland. Zhou et al. [
23] conducted a comparative study on SP and LSFO under the cap-and-trade mechanism.
Existing studies focus on analyzing the technical characteristics of the two technologies and their feasibility in emission reduction and cost control. However, the comprehensive comparison between them is still limited. By comparing and analyzing the differences between SP and LSFO in economic performance and social benefits, this study aims to fill the research gap and provide more comprehensive theoretical support for related policy-making and industry development.
2.3. The Impact of Competition Among Ships
The maritime industry is the backbone of international commerce, with its competitive environment significantly influencing transportation efficiency, ecological conservation, and industry trends. Therefore, understanding the competition among ships is essential for both academic research and industry practice.
Michis et al. [
24] proposed a revenue-test model to measure the degree of competition in the ship management industry. Based on data from Cyprus (2011–2023) and employing the Panzar–Rosse H-statistic, the results indicated a market structure of monopolistic competition, with crew costs showing the highest elasticity and fleet size being the key revenue driver. Sun et al. [
25] examined horizontal cooperation among liner companies and vertical coordination with e-commerce platforms in online slot sales. Using game models, it finds that proposed contracts can achieve supply chain coordination, and horizontal cooperation can be win-win when the marginal service quality cost coefficient is sufficiently high. Gena et al. [
26] conducted an in-depth analysis of strategic approaches for strengthening the competitive advantage of national container shipping sectors. Vasiliadis et al. [
27] studied the competitive strategies and expansion modes of the three world’s major container shipping companies. They also analyzed their coping strategies for significant global challenges such as the 2008 financial crisis, the COVID-19 pandemic.
In addition, Bai et al. [
28] studied 31 major non-scheduled shipping companies, focusing on their operational risk management strategies and financial hedging mechanisms. The findings demonstrate that financial hedging serves as an efficacious risk mitigation mechanism against fuel price volatility, enabling shipping enterprises to achieve enhanced stability in operational expenditure management. Bang et al. [
29] evaluated the operational and financial efficiency of liner transport companies. Wang [
30] used game theory to build three theoretical frameworks to study the dynamics of competition between two ships in the emerging liner transport market. The results demonstrate that operational strategy is pivotal in shaping competitive dynamics within the shipping industry. Wang et al. [
31] investigated the adoption of blockchain technology by shipping firms in competitive markets, analyzing its equilibrium effects on industry dynamics. They found that applying blockchain technology could improve social welfare and consumer surplus.
2.4. Application of Supply Chain Collaboration and Game Theory in Maritime Emission Reduction
Recognizing ports and vessels as a community of shared interests, some scholars have begun to investigate emission reduction issues from the perspective of supply chain synergy [
32,
33]. Game theory, particularly Stackelberg games, has been widely applied to analyze decision-making interactions among supply chain members with dominant power [
34]. Zhu et al. [
35] integrated system dynamics and evolutionary game theory to analyze tripartite decision-making among governments, shipping companies, and ports for maritime decarbonization. Findings highlight the nonlinear impact of policy intensity, the critical role of port-shipping collaboration, and the influence of market green preference on emission reduction outcomes. Li et al. [
36] Employed a game-theoretic model to examine how government subsidies affect green technology investments in low-carbon port operations. They found that investment decisions were sensitive to subsidies, market preferences, and cost-sharing, with ports and shipping companies responding differently to these factors. Cai et al. [
37] studied a behavioral economics lens, integrating prospect theory into a game-theoretic model, to design incentive mechanisms for promoting shore power adoption among inland river ships, addressing low usage rates despite existing infrastructure. Wang et al. [
38] used an evolutionary game model to explore the interaction between local governments and shipping companies under the fixed and dynamic subsidy frameworks. They found that dynamic subsidies enable stakeholders to develop stable strategies and recommended low-sulfur refining technologies. Hua et al. [
39] studied a tailored indicator system and Fuzzy Importance-Performance Analysis, and proposed governance strategies focusing on energy monitoring and technological innovation, providing a theoretical basis for policy formulation.
However, most of these studies either perceive the supply chain as a unified entity interacting with the external environment or focus solely on vertical collaborative relationships, generally overlooking the critical reality of horizontal service competition among vessels. Such competition significantly alters vessels’ expected returns on emission-reduction investments, thereby influencing the equilibrium outcomes of the entire port supply chain. Introducing competitive factors into port-vessel supply chain game-theoretic models remains a significant and yet-to-be-filled gap in existing research.
In summary, the comparative analysis in
Table 1 highlights the core research gaps this study aims to address. First, research on the impact of shipping industry competition on emission reduction is mostly qualitative and has not been effectively integrated into supply-chain decision-making models. Second, comparisons between shore power and low-sulfur oil largely rely on static cost analysis, lacking a unified evaluation framework within dynamic policy and market settings. Furthermore, existing game-theoretic models in maritime supply chains primarily overlook horizontal competition among vessels, thereby constraining their explanatory power in real-world contexts.
To address the aforementioned research gaps, this study develops a port supply chain game model that incorporates the competition between ships within an integrated “policy-market-technology” framework. Using this model, it systematically analyzes how the cap-and-trade mechanism and vessel competition jointly drive the choice of berthing vessels between low-sulfur oil and shore power. This research not only advances the understanding of the applicable conditions for different emission reduction technological pathways but also, by examining the interaction between competition and policy, provides theoretically grounded and practically relevant decision support for both enterprises and governments.
3. Problem Statement
3.1. Problem Description
The supply chain comprises a port and two competing ships, with one adopting SP for emission abatement at berth and the other relying on LSFO to reduce emissions. Ships offer services to customers, generating revenue while incurring berthing fees paid to the port. Therefore, the total service price to be paid by the customer includes the fees charged by the port and the transportation fees charged by the ship. Implementing SP requires investment from both the ports and vessels for the necessary infrastructure, whereas LSFO primarily raises the costs for the ship alone.
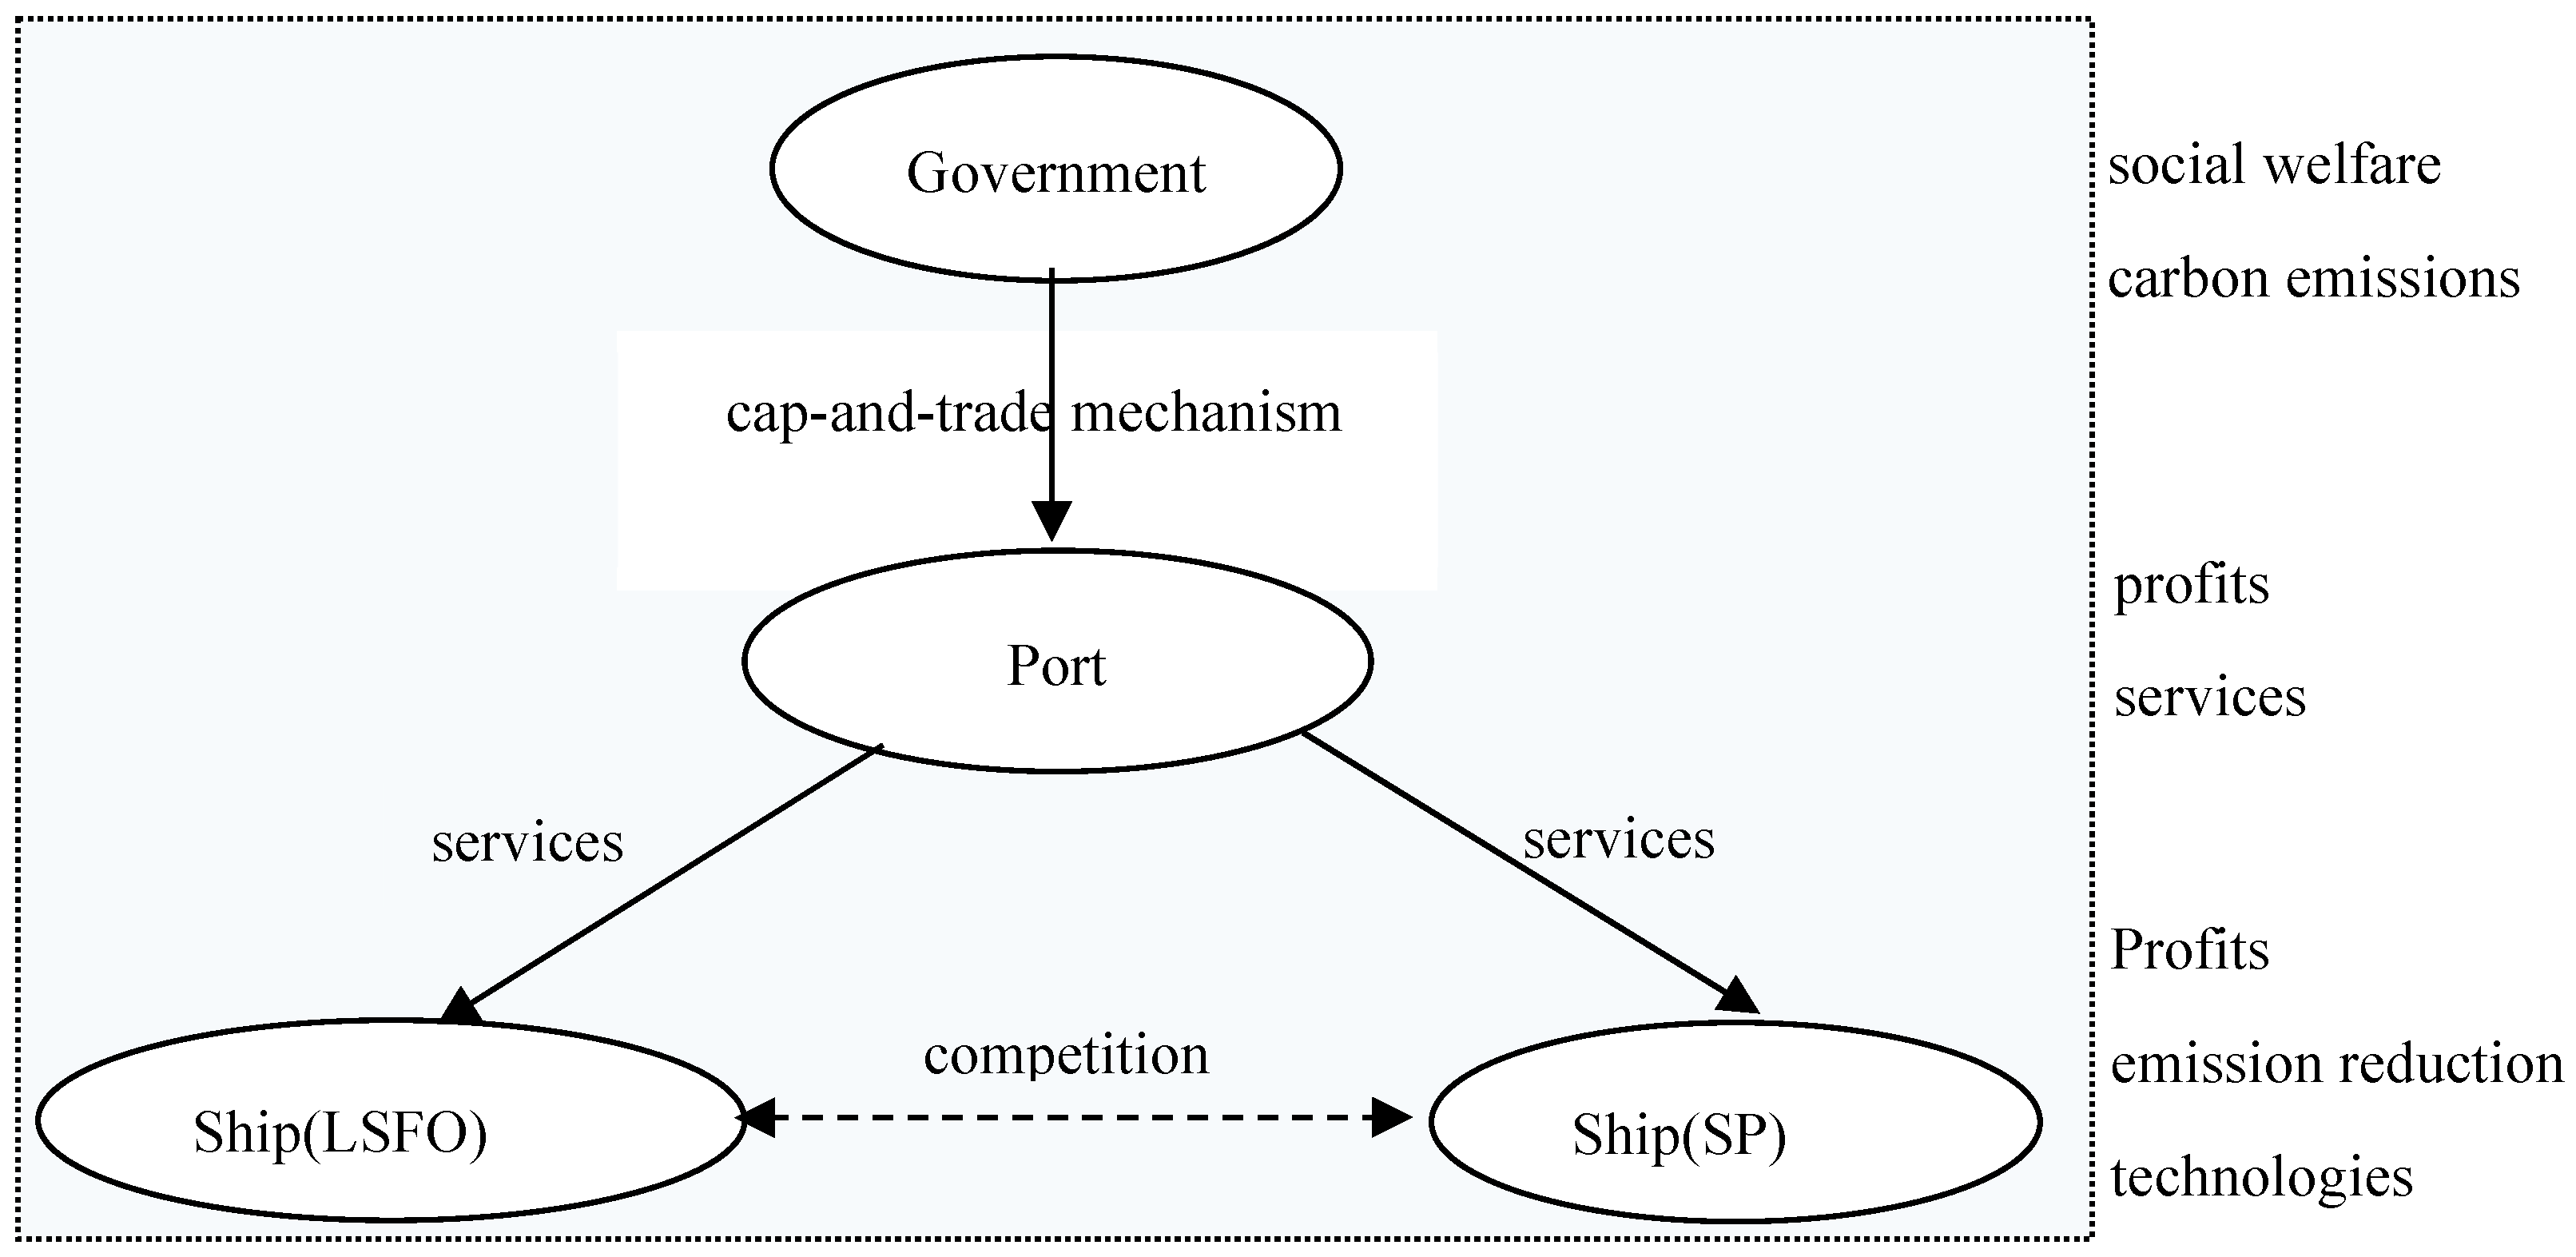
The operational and strategic interactions within this supply chain are governed by a broader regulatory framework. As illustrated in
Figure 1, the government influences the system through environmental policies, specifically a cap-and-trade mechanism which sets a carbon price. This regulatory mechanism governs the strategic choices and associated cost structures of both the port and the vessels concerning the adoption of emission-abatement technologies—namely, Shore Power (SP) or Low-Sulphur Fuel Oil (LSFO). The port, as a key player, determines its service price and chooses which emission reduction technology to support or require. The two ships engage in competition, setting their own service prices based on their chosen technology (SP or LSFO), operational costs, and the carbon price. The resultant metrics of these decisions—namely, profit levels, service volumes, and aggregate carbon emissions—jointly shape the overall social welfare, a central objective in governmental policy formulation.
3.2. Notation
Table 2 lists the associated parameters and variables used in the analysis. SP and LSFO are described by superscript
i (
i =
e,
l), and the game types (port-leading game and ship-leading game) are represented by subscript
j (where
j =
P,
S), respectively. The superscript
s,
p, and
sc represents the objects of ship, port, and supply chain, respectively.
3.3. Basic Assumptions
For the convenience of subsequent modeling and analysis, two primary assumptions are given.
Assumption 1. .
SP releases less carbon emissions compared with LSFO [23,40], i.e., . This ordering is strongly supported by lifecycle and operational emission assessments. SP, when sourced from an average or increasingly renewable grid, significantly reduces at-berth greenhouse gas and local pollutant emissions compared to burning LSFO. This is a fundamental driver for SP promotion globally and is consistently validated in comparative studies [41].
The unit operational cost for a vessel using LSFO is lower than the combined unit cost for a vessel using SP, which includes the vessel’s own cost for SP connection and the port’s infrastructure cost shared per vessel, i.e., [40]. This reflects the prevalent economic barrier to SP adoption. While LSFO mainly incurs fuel costs, SP requires substantial upfront investment in onboard equipment () and portside infrastructure (), the latter often amortized into a service fee. Even with lower electricity costs, the high capital and fixed costs typically make the per-call cost of SP higher in the short to medium term without subsidies, a well-documented challenge in the literature. This assumption captures the central trade-off: SP offers environmental superiority but faces cost competitiveness hurdles. Assumption 2 ([
42,
43])
. The function of demand is:Here, ( > 0) represents the base market potential. and are the port charge and vessel’s other operational cost components for technology i (where i ∈ {e, l}), respectively, perceived by shippers as part of the total generalized price. The parameter b denotes the substitution coefficient between the services of the two competing vessels.
The use of linear, negatively sloped demand functions is standard in analytical economics and operations research for modeling competitive markets [42,43]. It provides mathematical tractability while effectively capturing the core inverse relationship between price (here, generalized cost ) and quantity demanded. The structure models differentiated or Bertrand competition (0 < b < 1). The services provided by the two vessels are imperfect substitutes (b ≠ 1). This is realistic as shipping services can be differentiated by schedule reliability, transit time, network coverage, and, increasingly, environmental performance. The coefficient b measures the intensity of competition; a higher b indicates services are closer substitutes, leading to fiercer price competition.
3.4. Models
The carbon emissions are:
In Equation (2), the first term denotes the port’s profit from serving the ship using LSFO during berthing, in contrast the second term indicates the revenue from servicing the ship using SP, excluding the cost of providing SP, and the third term indicates the cost of carbon emissions. In Equation (3), the first item represents the revenue earned by the ship for providing services to the customers, the second term indicates the sailing cost, and the last term corresponds to the expense of using LSFO. The first term reflects the ship’s revenue from serving customers in Equation (4), the second term accounts for the sailing cost, and the final term represents the cost associated with using SP. Emissions from vessels are modeled by distinguishing between technological regimes. For SP and LSFO users, total emissions are determined by their respective per-unit-service emission coefficients, which scale linearly with the quantity of service provided. For the SP-used ship, the total emissions
are calculated as the service quantity
and the emission coefficient
(Equation (6)). Similarly, for the ship using LSFO, total emissions
equal the service quantity
multiplied by its emission coefficient
(Equation (7)). The total supply chain emissions
are aggregated as the sum of the emission contributions from both SP-adopting ship and LSFO-adopting ship, as given in Equation (8). The coefficients
and
represent the average amount of CO
2-equivalent emitted per unit of service and reflect the distinct carbon intensities of the two technologies. SP is typically associated with a lower
due to its reliance on grid electricity, while LSFO combustion results in a higher
[
23]. This linear relationship between emissions and service volume captures the proportional impact that operational output exerts on the total carbon footprint within each technological regime.
In this study, social welfare is quantified as a weighted sum of total supply-chain profit and the negative environmental impact from carbon emissions [
44]. In Equation (9), the social welfare is formally defined as a weighted sum of two principal components: aggregate economic profits and total environmental impact. Specifically, the environmental impact is quantified as
, which captures the negative social disutility associated with carbon emissions [
45]. The parameter
serves as a critical weighting coefficient that explicitly quantifies the trade-off between economic efficiency and environmental sustainability within the welfare function. This formulation enables a nuanced analysis of how carbon pricing policies and technological adoption collectively influence overall social welfare under varying market.
In practice, decisions regarding emissions reduction technologies and operational strategies are often made sequentially rather than simultaneously. For example, a port may first set its shore power service pricing and infrastructure policy, after which vessels determine their technology investment and service quantities accordingly. Conversely, in vessel-led scenarios, major shipping companies may first commit to a technology pathway, influencing port-side decisions on capacity and pricing. The Stackelberg game captures this leader-follower interaction explicitly, allowing us to examine how the party with decision-making priority can leverage its position to influence outcomes. Therefore, we employ a Stackelberg game framework to analyze the strategic interactions between ports and vessels, examining two distinct scenarios: a Vessel-led Stackelberg game and a Port-led Stackelberg game.
The model builds upon deterministic, price-sensitive demand functions for services provided by ships. Relaxation of these assumptions to incorporate stochastic demand or more complex nonlinearities would alter the resultant optimal pricing and quantity equilibrium. Stochastic demand could introduce a risk premium, potentially enhancing the relative value of stable, lower-emission technologies like SP under regulatory uncertainty. While such extensions would alter quantitative outcomes, the core strategic dynamic—the first-mover advantage inherent in the Stackelberg games—is expected to remain qualitatively robust. This is because as the leader’s ability to shape the follower’s decision space is a fundamental feature of sequential competition.
4. Results
In this part, the equilibrium outcomes of the models as mentioned above are obtained through the standard backward induction method, a widely recognized approach for solving sequential decision-making problems. After that, a comparative analysis is conducted. Furthermore, a sensitivity analysis was performed to examine the impact of key parameters on the optimal outcomes, thereby providing a basis for deriving subsequent management insights.
4.1. Solutions
We solve the above models under two different power structures by standard backward induction as shown in
Appendix A.1. The equilibrium results under the ship-leader Stackelberg scenario are:
The equilibrium results under the port-leader Stackelberg scenario are:
4.2. Analysis
This section delves into the impacts of various parameters on the outcomes, including optimal pricing strategies, profit margins, total emissions, and overall social welfare, through a comprehensive comparative and sensitivity analysis. By systematically analyzing the impact of parameter changes on each outcome, this study highlights the dynamic interrelationships within the system. The findings provide critical insights to support shipping companies in identifying optimal technologies that simultaneously satisfy economic efficiency and environmental sustainability requirements. Moreover, the findings provide policymakers with empirically grounded guidance to formulate balanced regulatory frameworks that promote economic development and advance sustainability goals. For detailed proofs of the lemmas and propositions, see
Appendix A.2.
4.2.1. Analysis of Optimal Service Pricing
The influence of operational parameters on the supply chain’s optimal service price is given in Lemma 1.
Lemma 1. For the ship using SP: increases with increases with but decreases with For the ship using LSFO: increases with , but decreases with . increases with but decreases with , .
It is evident that the pricing of both port and ships rises with their respective operational costs. The ships and port may decrease the prices when the costs of others increase to earn more profits in the supply chain. The carbon price creates a price disincentive for LSFO adoption by simultaneously decreasing the effective cost of SP utilization while increasing the comparative expense of LSFO consumption.
4.2.2. Profits Analysis
The influence of operational parameters on the optimal profits is given in Lemma 2.
Lemma 2. are concave with respect to (j = S, P).
At minimal carbon price levels, the supply chain faces low-cost pressures. However, as carbon price rises, both operational costs and service prices increase, and decrease market demand. Comparing the optimal profits under the two power structures and different technologies in the supply chain, the impact of operational parameters on optimal profits are obtained as follows.
Proposition 1. Profit within the port supply chain satisfies Proposition 1 shows that in the port supply chain, whether it is a port or a ship, it is always more profitable to be the leader than to be the follower in the game. The supply chain profits in these two Stackelberg games are identical.
Proposition 2. The profits satisfy: If then , otherwise .
Proposition 2 shows that at lower carbon price levels, ships utilizing LSFO benefit from lower overall costs, so they can achieve higher profits. Conversely, as carbon price increases, the low-emission advantage of SP becomes more significant, enabling ships using SP to secure more profits.
4.2.3. Analysis of Carbon Emissions
The influence of operational parameters on the carbon emissions is given in Lemma 3.
Lemma 3. , , and decreases with , and m (j = S, P).
As operational costs rise, the service prices within the supply chain also increase, resulting in a decline in market demand and a subsequent reduction in total carbon emissions. When carbon price grows, the supply chain’s costs increase, leading to higher service prices. The higher service price reduces market demand, decreasing the overall carbon emissions.
Comparing the carbon emissions under the two power structures and different technologies in the supply chain, the impact of operational parameters on carbon emissions is obtained as follows.
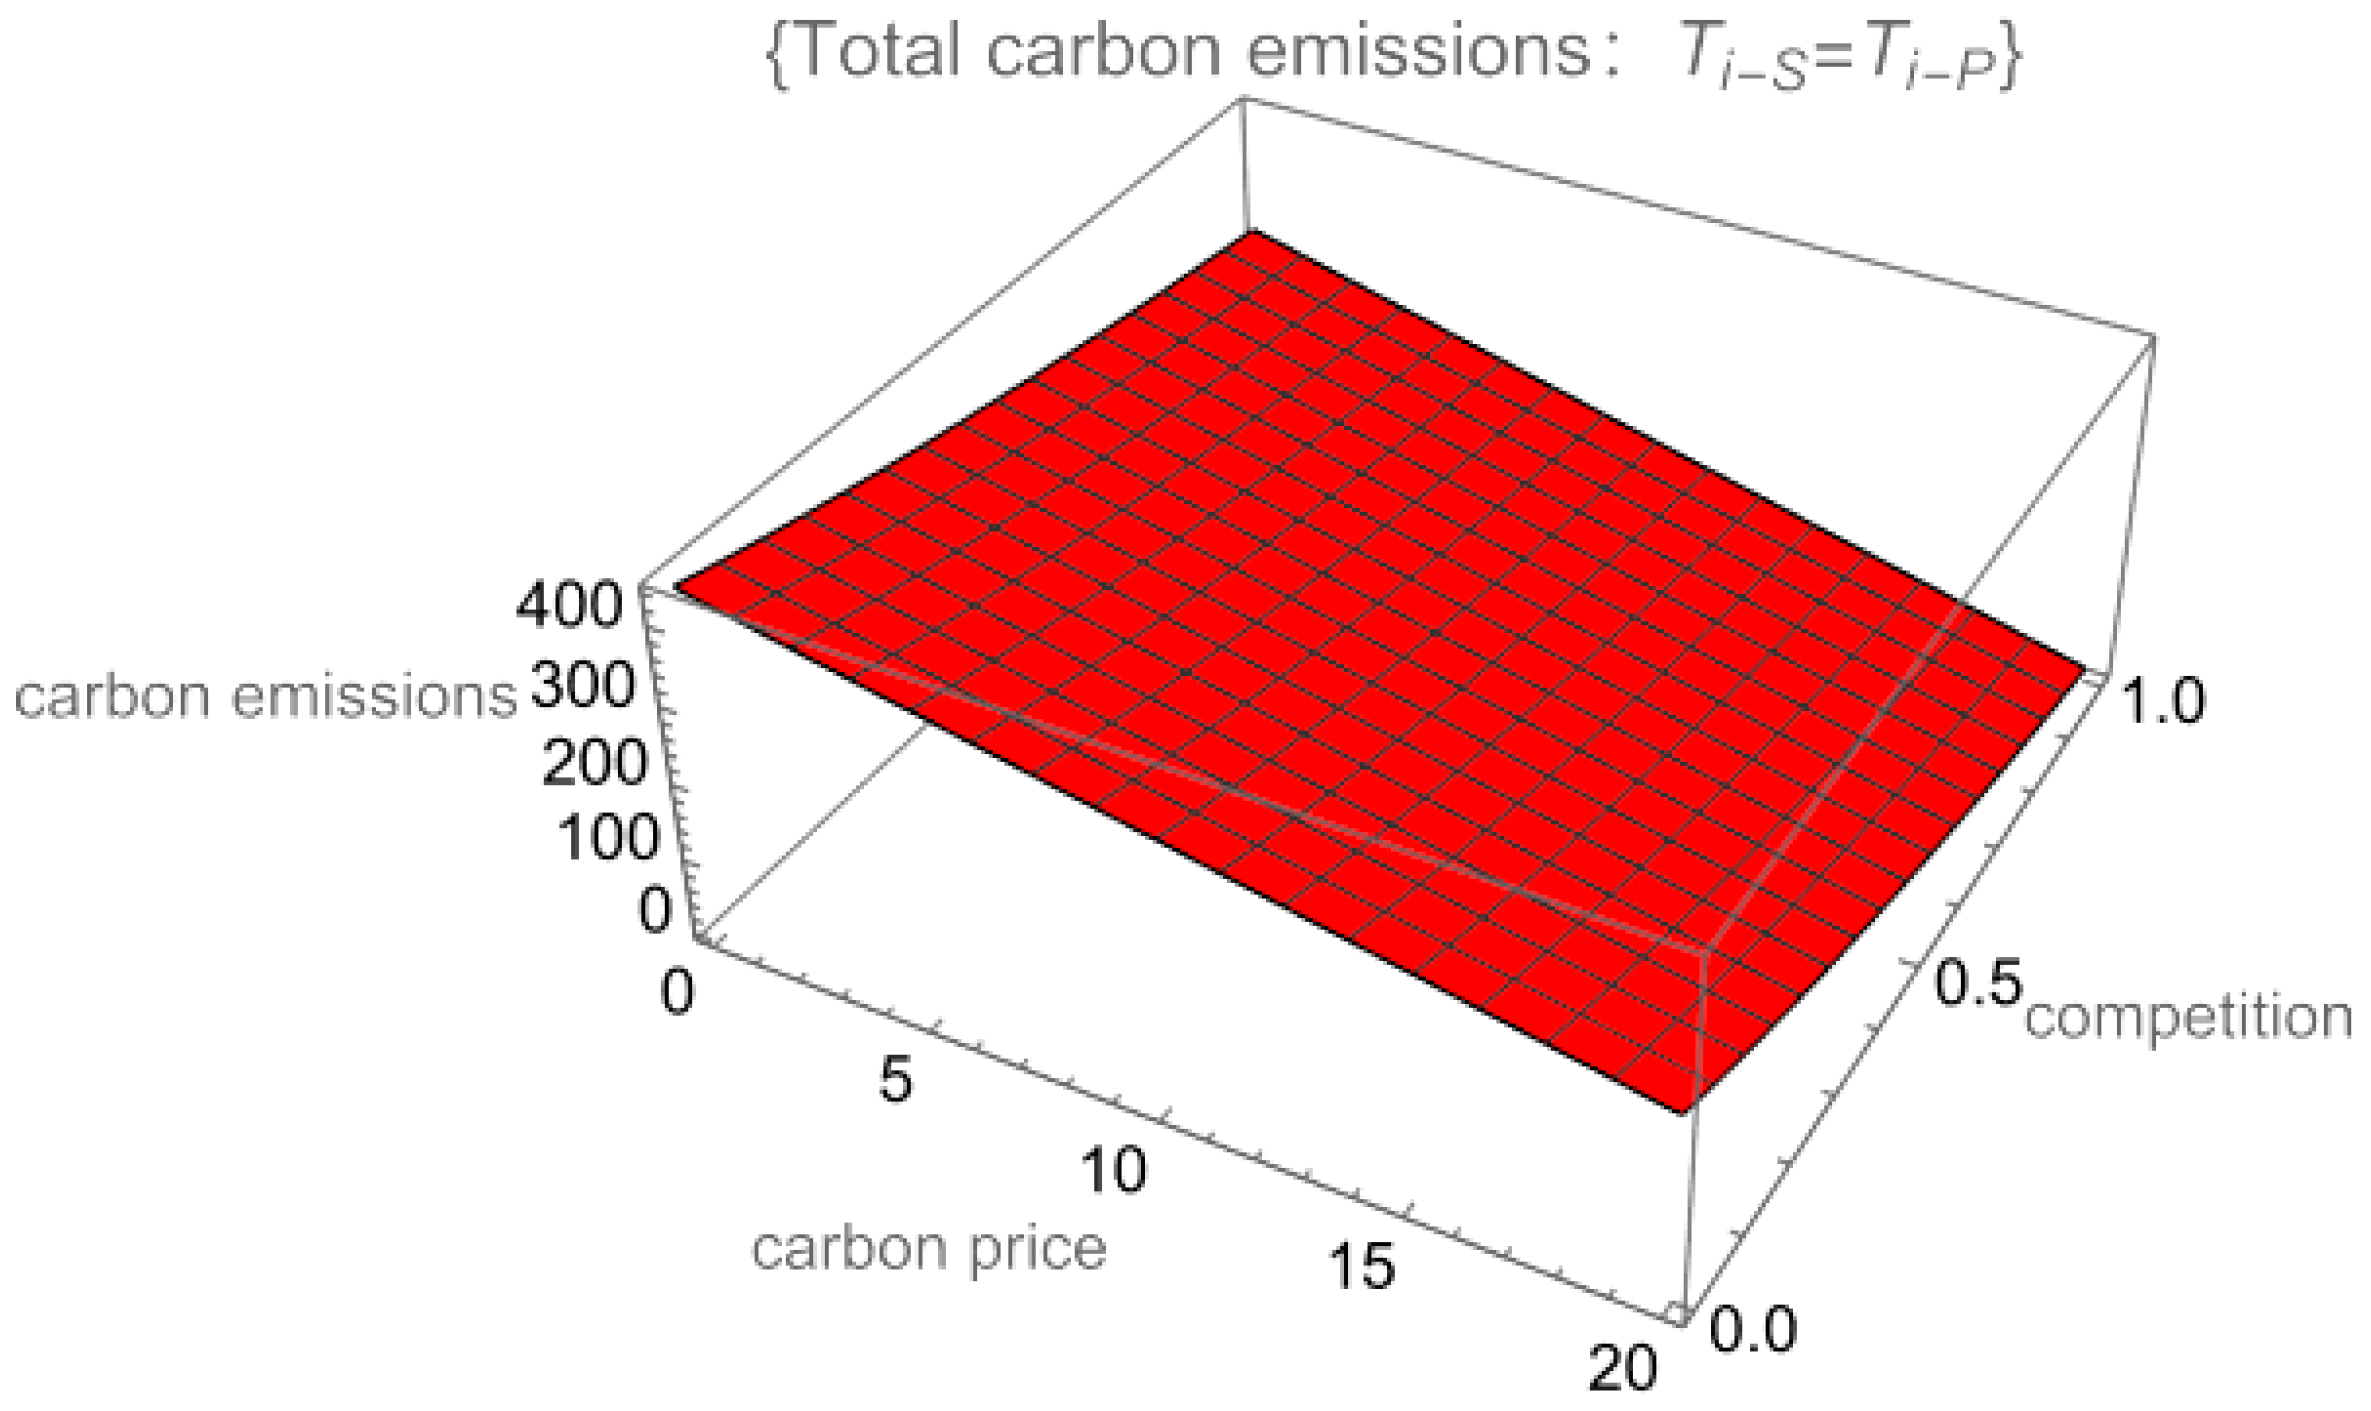
Proposition 3. The carbon emissions satisfy: Proposition 3 demonstrates that both ship-level and total supply chain carbon emissions remain identical across the two structures.
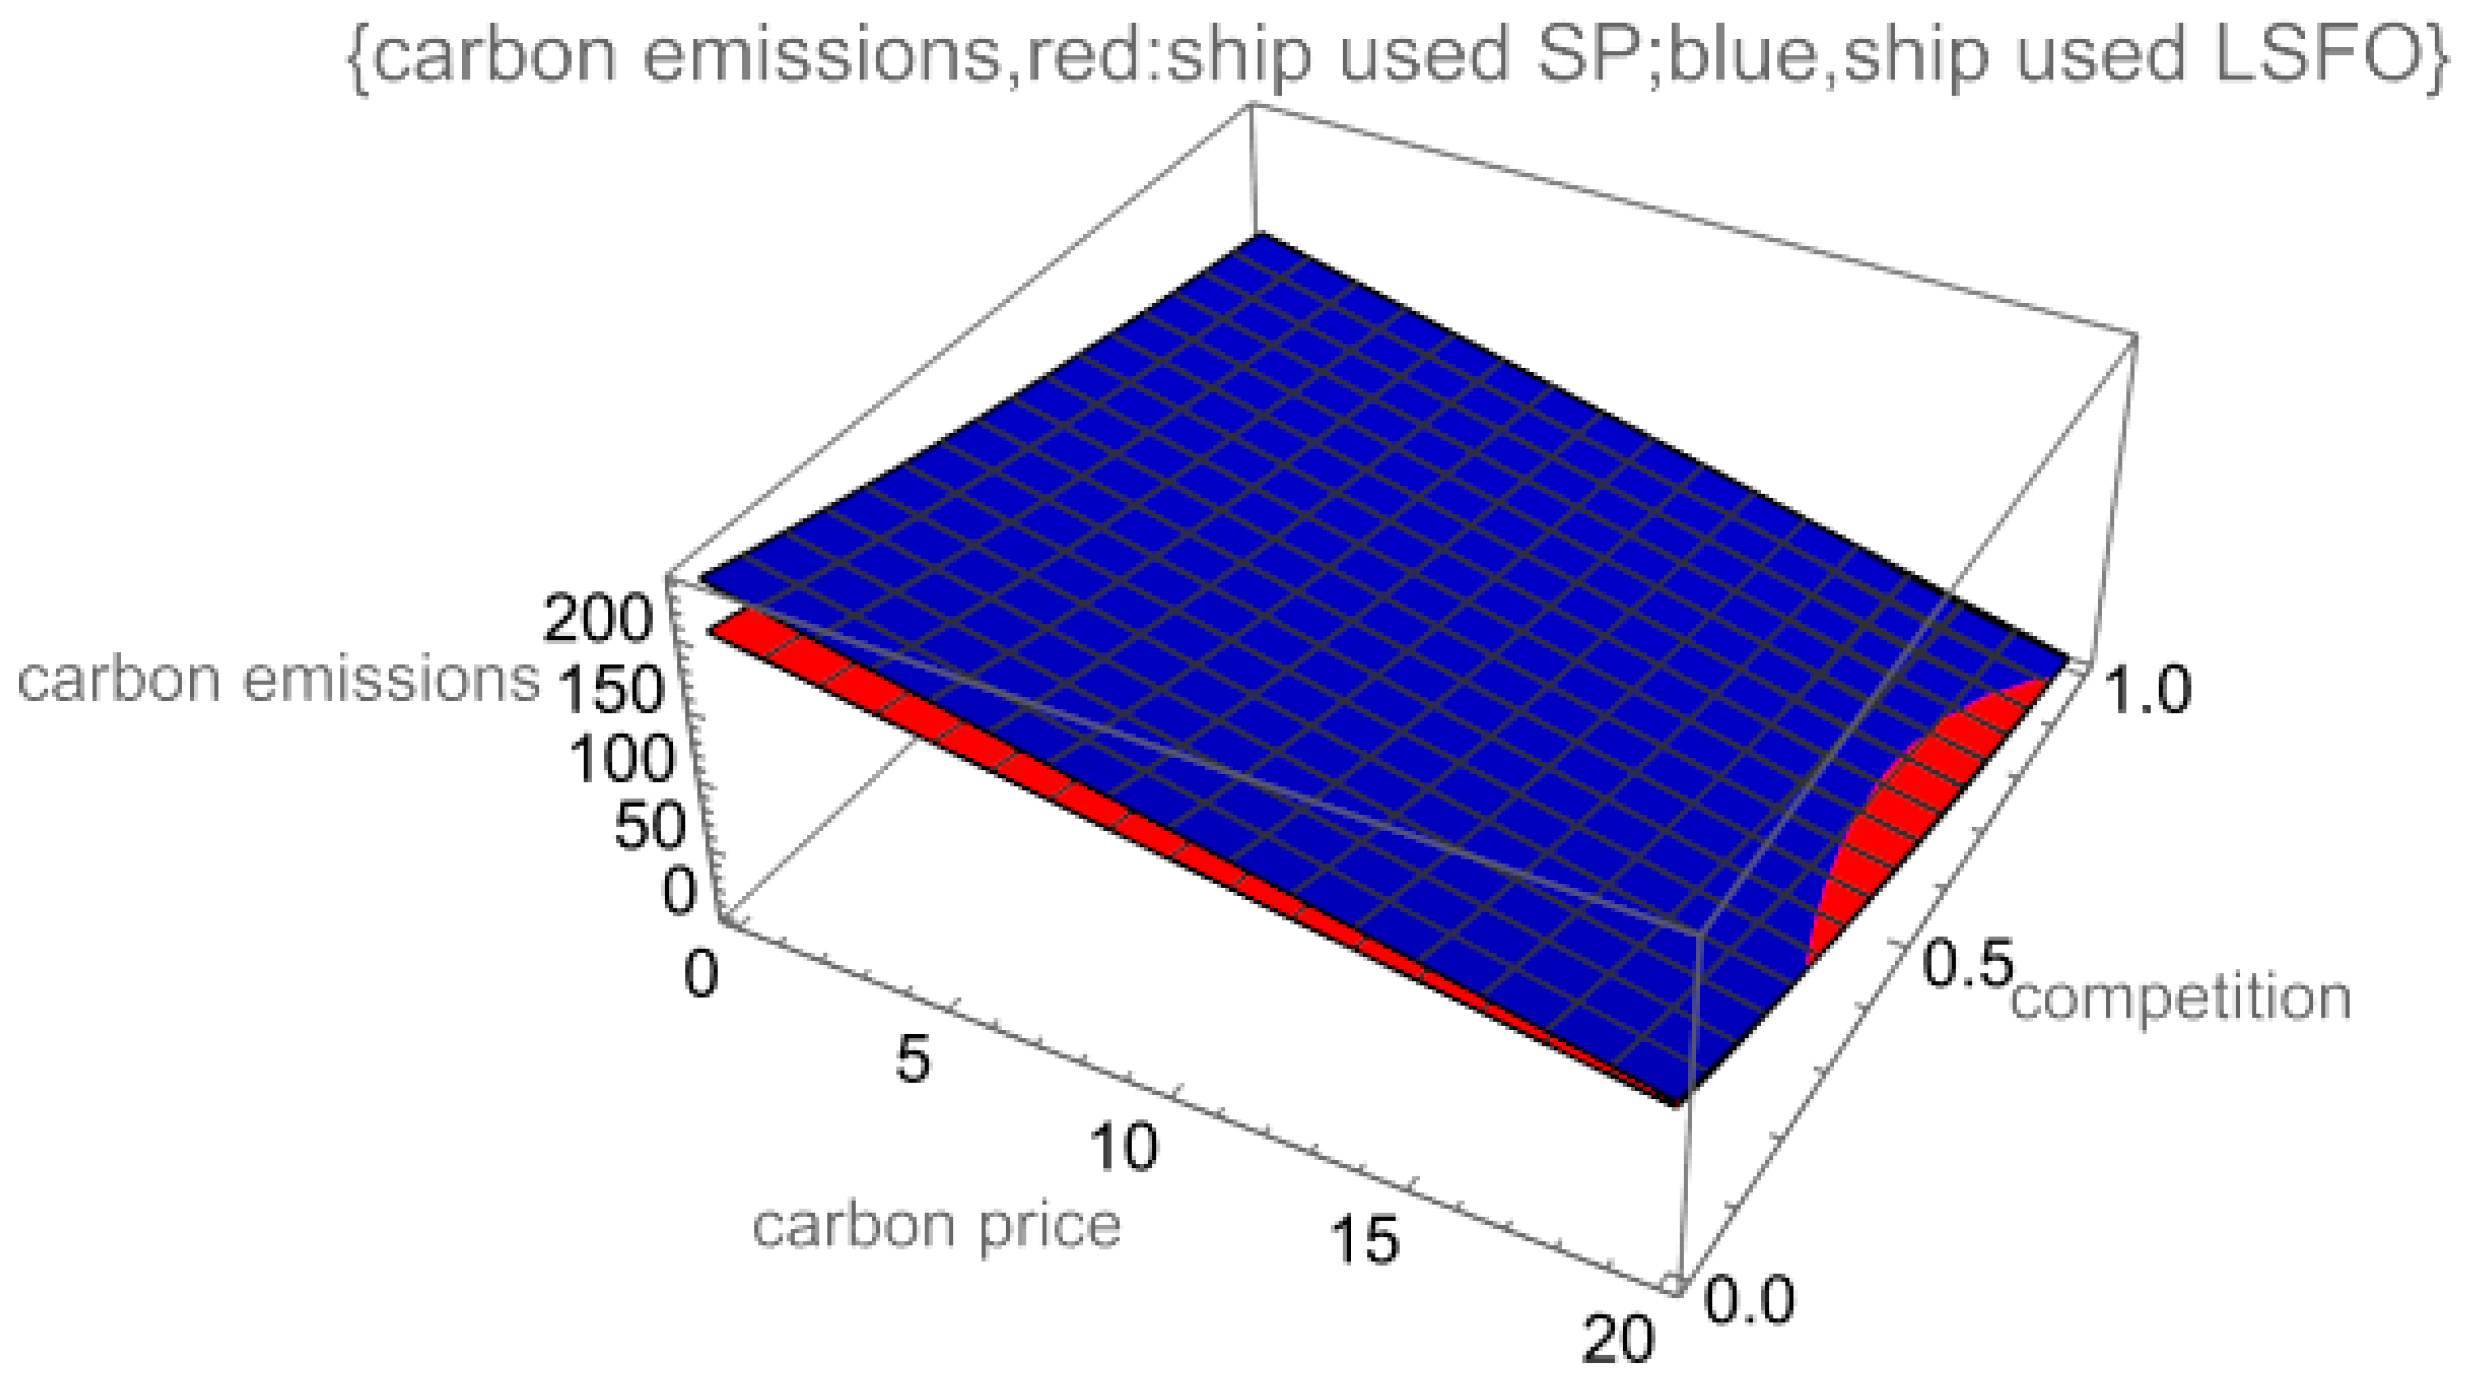
Proposition 4. The carbon emissions satisfy:then . Otherwise . Proposition 4 shows that under low carbon price conditions, ships using LSFO provide more services due to cost advantages. Since the unit carbon emissions of LSFO exceed those of SP, ships using LSFO consequently generate higher carbon emissions. With the increase in carbon price, the low emission advantage of SP gradually emerged, so the service provided by ships using SP gradually increased. As the carbon price approaches a critical threshold, the total emissions from SP-adopting vessels may ultimately exceed those from LSFO-using ships, despite SP’s lower unit carbon emissions. Because SP-equipped ships intend to provide substantially service volumes.
4.2.4. Influence of Carbon Price on Social Welfare
The influence of operational parameters on the social welfare is given in Lemma 4.
Lemma 4. When , then, (j = P, S) are convex with respect to , , , otherwise (j = P, S) are concave with respect to , , .
When , then, (j = P, S) are convex with respect to m, otherwise (j = P, S) are concave with respect to m.
Comparing the carbon emissions under the two power structures, we can get Proposition 5.
Proposition 5. The social welfare satisfies: Proposition 5 indicates that the total social welfare in the two structures is the same.
The analysis demonstrates that optimal pricing adjusts with respective operational costs, while profits are always higher for the Stackelberg leader (port or ship) than the follower, though total supply chain profit remains equal across structures. Furthermore, a high carbon price disincentivizes LSFO adoption, shifting profit advantage to SP-using ship, and reduces total carbon emissions. Notably, both total emissions and social welfare are invariant to the power structure, but the choice of two technology significantly affects emission levels depending on the carbon price threshold. The effect of competition between ships on the supply chain’s profits, carbon emissions, and social welfare is complicated. So, we use the numerical examples to illustrate in the next section.
4.3. Numerical Examples Analysis
The numerical examples are given to demonstrate the lemmas and propositions derived before. The relevant parameters used in the model are provided below [
40]:
.
4.3.1. Influence of the Carbon Price and Competition on Profits
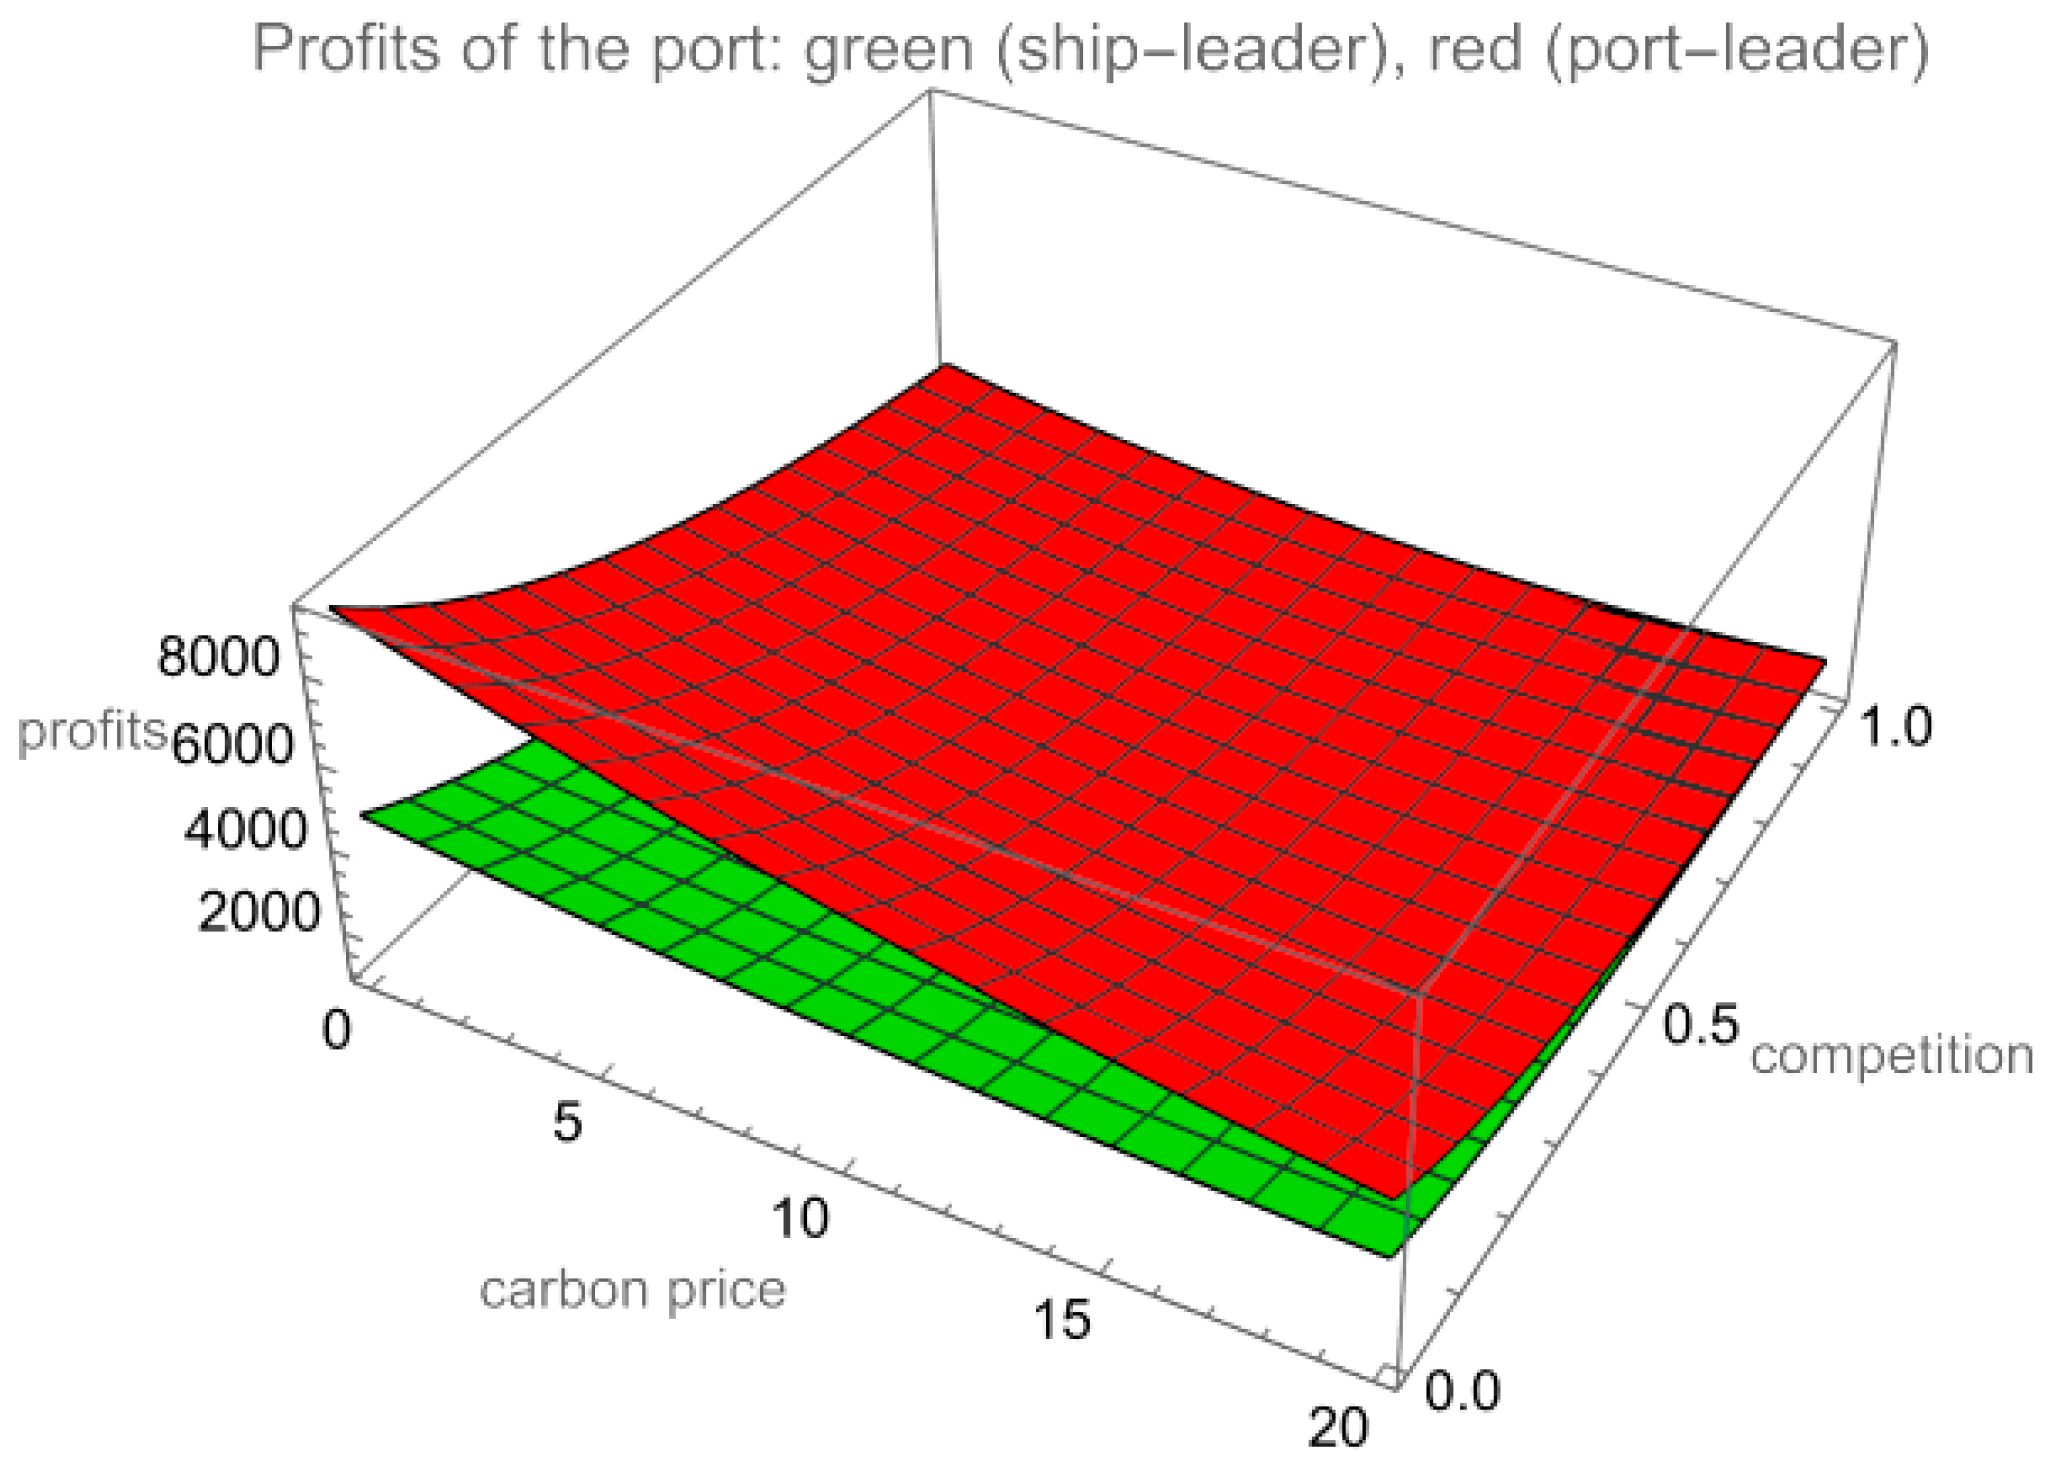
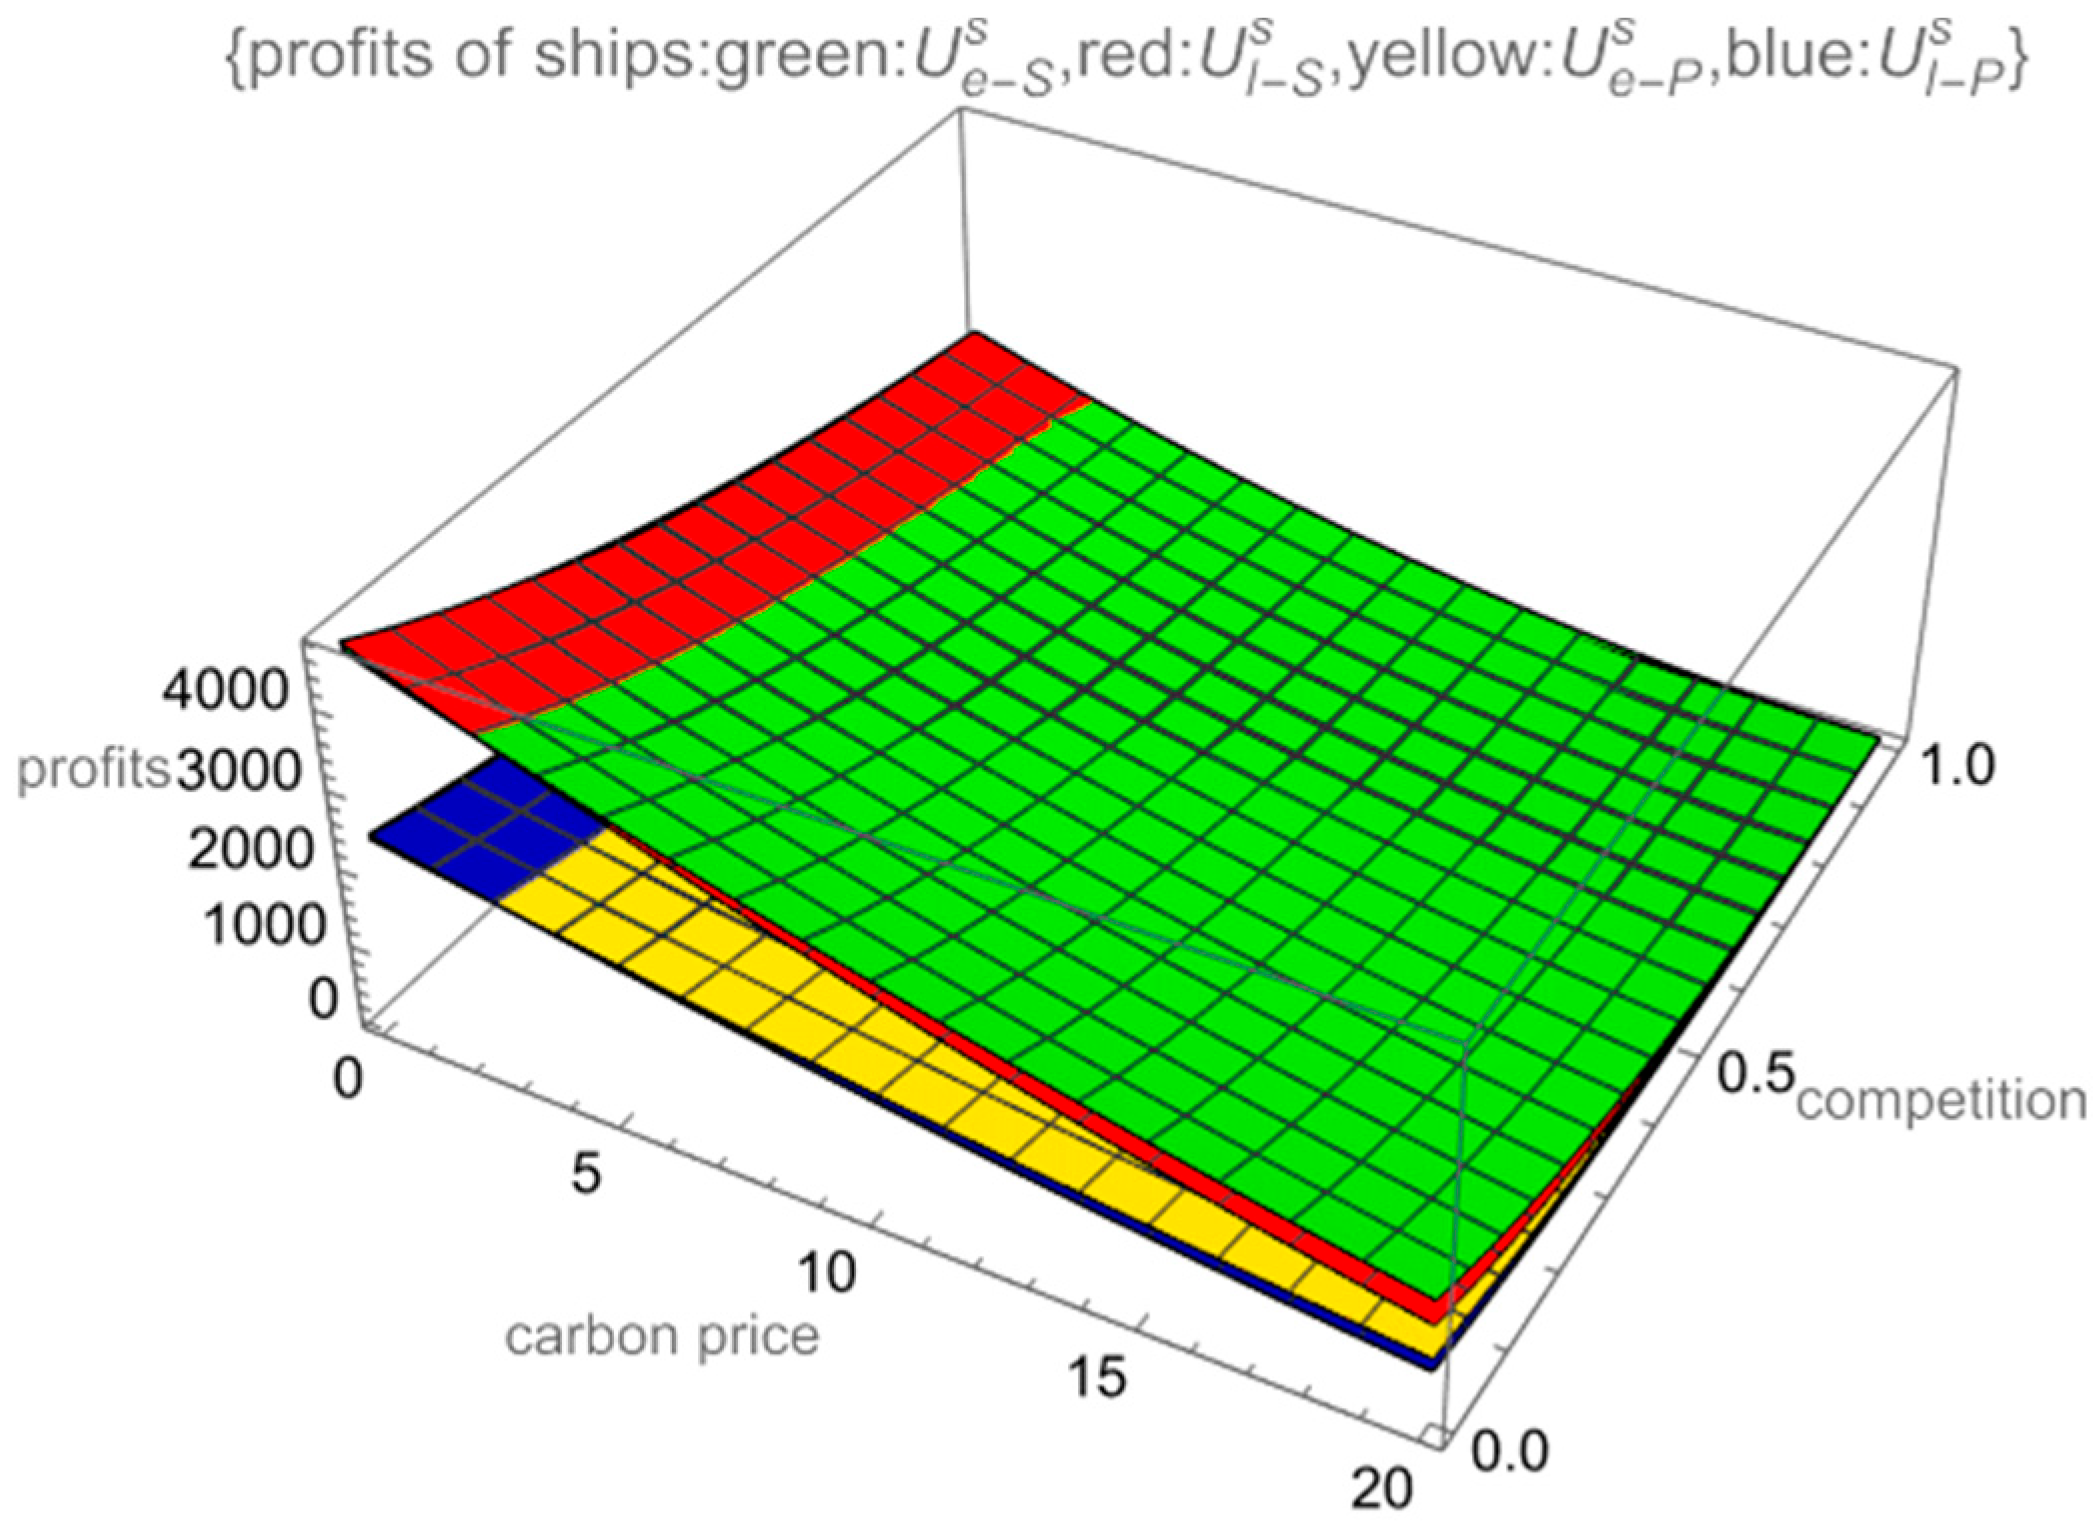
Figure 2 illustrates the port’s profits under the two power structures, while
Figure 3 depicts the variations in ship profits. As stated in Proposition 1, whether for ports or ships, profits are always lower when they act as followers compared to when they are leaders.
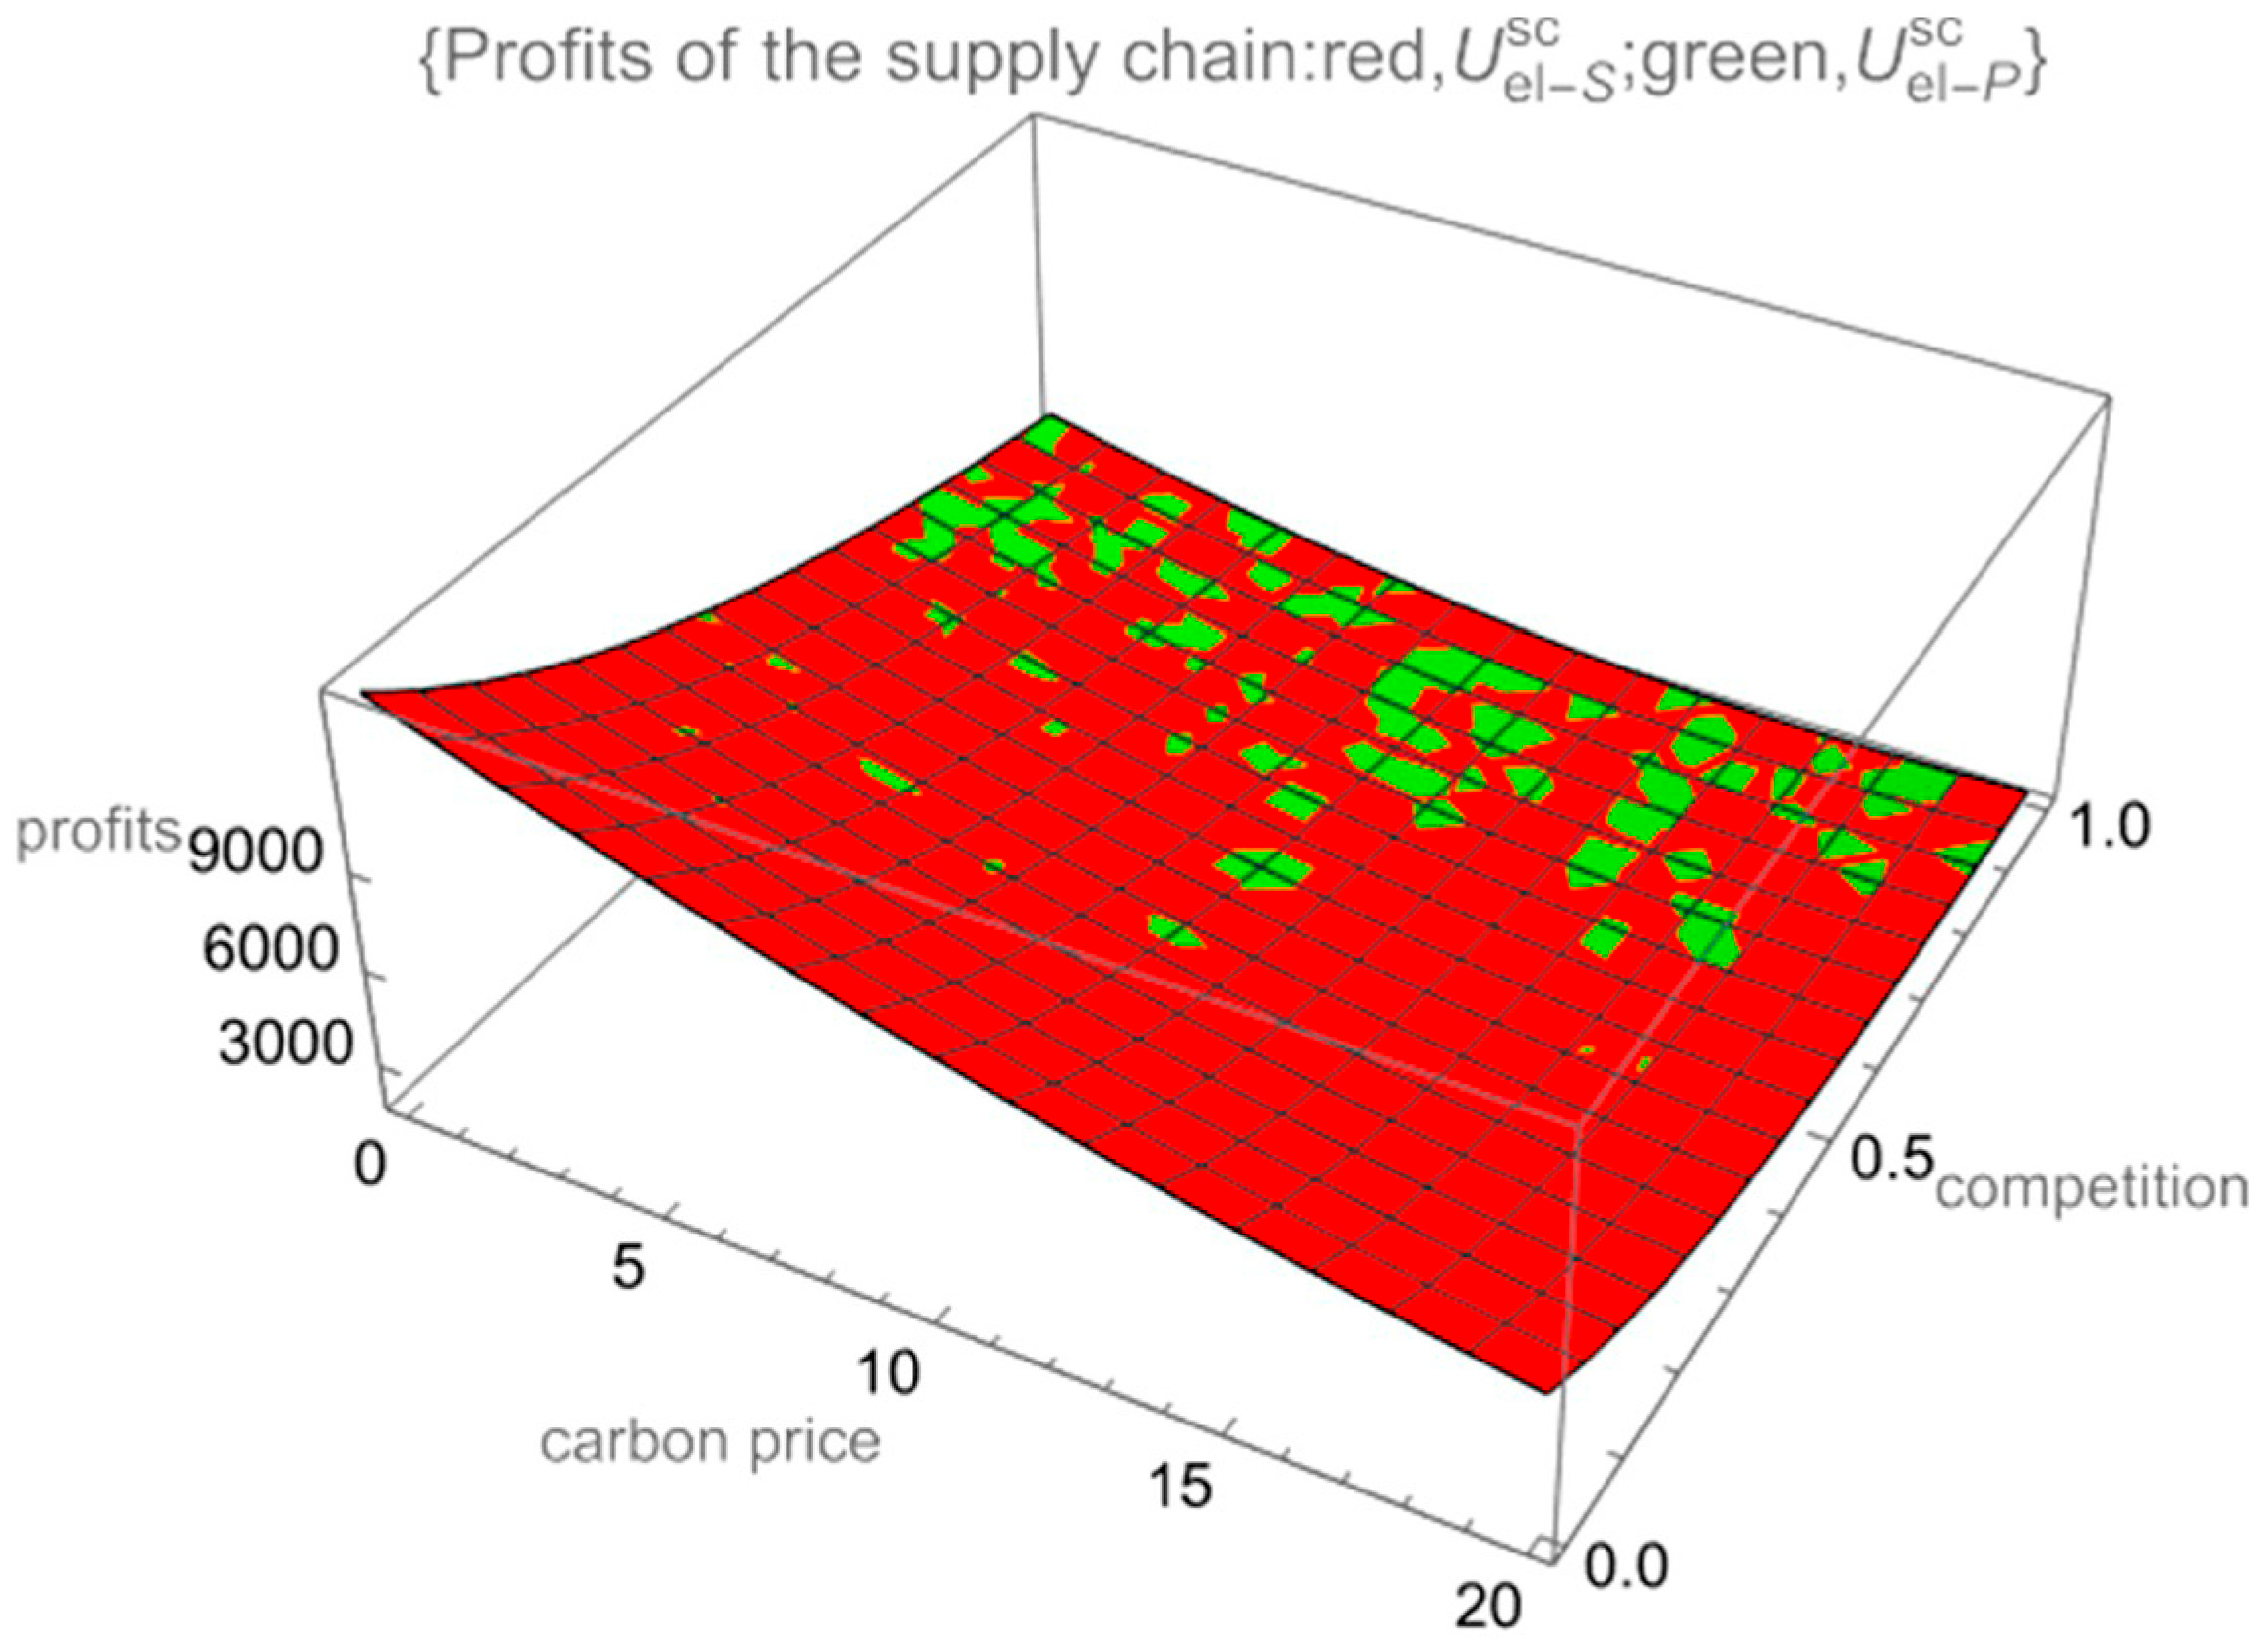
Figure 4 demonstrates that the overall supply chain profits remain the same in both game scenarios.
Under low carbon price conditions, the ship using LSFO earns more profits than that of the SP-adopting ship. As carbon price increases, SP-adopting vessels experience progressive profit growth. Beyond a critical threshold, the profits of SP-adopting vessels exceed those of the ship using LSFO because of the emission reduction advantage. So, a high carbon price helps promote SP. The intensification of competition reduces the services provided by the ships. The implementation of the cap-and-trade mechanism and intensified market competition leads to an overall decline in profitability across maritime operators. Specifically, the competitive pressure reduces profit margins for both vessel types (SP-adopting and LSFO-using ships) as well as port operations, ultimately resulting in diminished supply chain profitability. However, due to the Carbon Trading Mechanism, the profits of the ship using LSFO reduced relatively quickly.
4.3.2. Effect of Carbon Price and Competition on Carbon Emissions
Figure 5 shows when carbon price is very low, the service offered by two types of ship increases to a high level. With the increase in carbon price, the total carbon emissions of ships using shore power gradually increased, while the total carbon emissions of ships using LSFO gradually decreased. When the carbon price rises to a certain threshold, the total carbon emissions from the SP-using vessels will exceed the total carbon emissions from the LSFO-using vessels.
Figure 6 shows that the total carbon emissions in the two power structures are the same as described in Proposition 3.
Under a low carbon price, LSFO-adopting ships can provide more services and earn higher profits than SP-adopting ones, owing to their cost advantage. With the increase in carbon price, the cost of the ship using SP reduces, so the ship using SP provides more services to get more profits. Despite the lower unit emissions of SP-adopting vessels, beyond a certain threshold, the aggregate emissions surpass those of LSFO-utilizing vessels due to increased service provision. The intensification of competition will reduce the services provided by ships. Therefore, emissions from both vessel types demonstrate a concurrent reduction. This phenomenon can be attributed to competitive market dynamics driving emission abatement across all vessels. However, because of the carbon price, the carbon emission reduction speed of the ship using SP is relatively slower than that of the LSFO-adopting ship.
4.3.3. The Influence of Carbon Price and Competition on Social Welfare
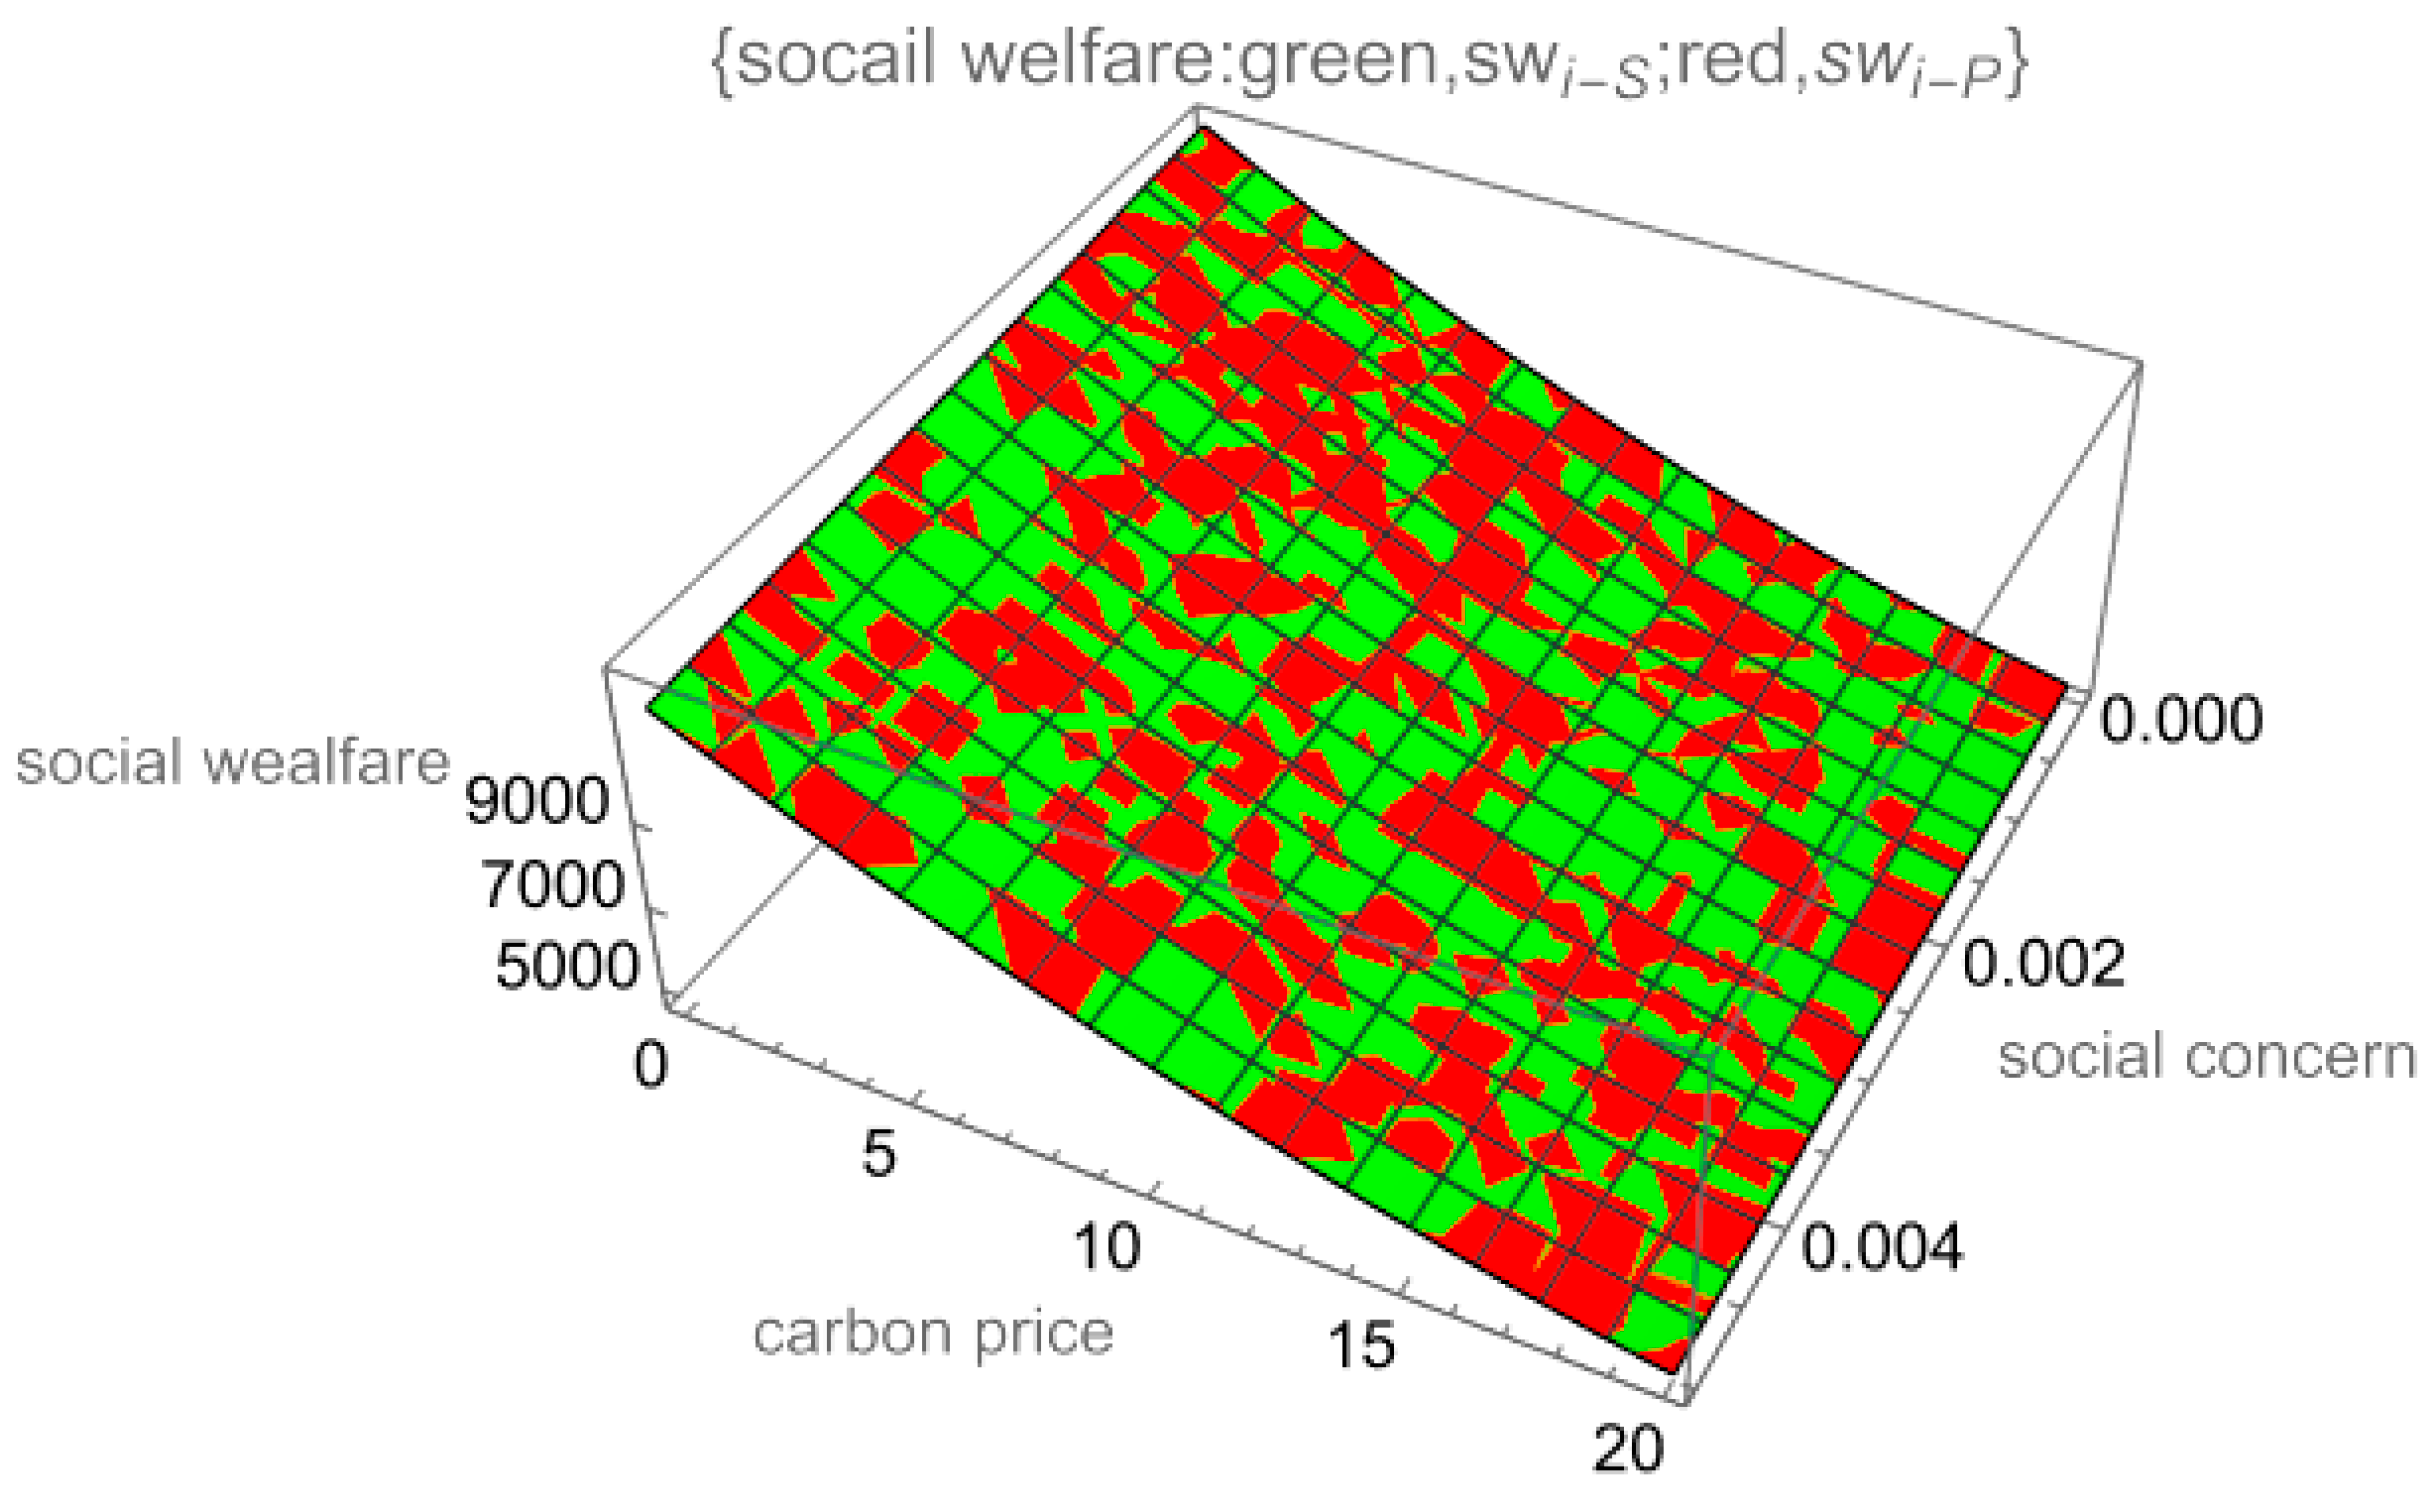
Figure 7 shows that social welfare is affected by carbon price and social concern (
b = 0.5). When the carbon price and the level of social concern are low, the volume of services offered by ships under both power structures is substantial. This leads to high profits as well as high carbon emissions, resulting in a high level of social welfare. With the increase in carbon price, the social welfare also decreases.
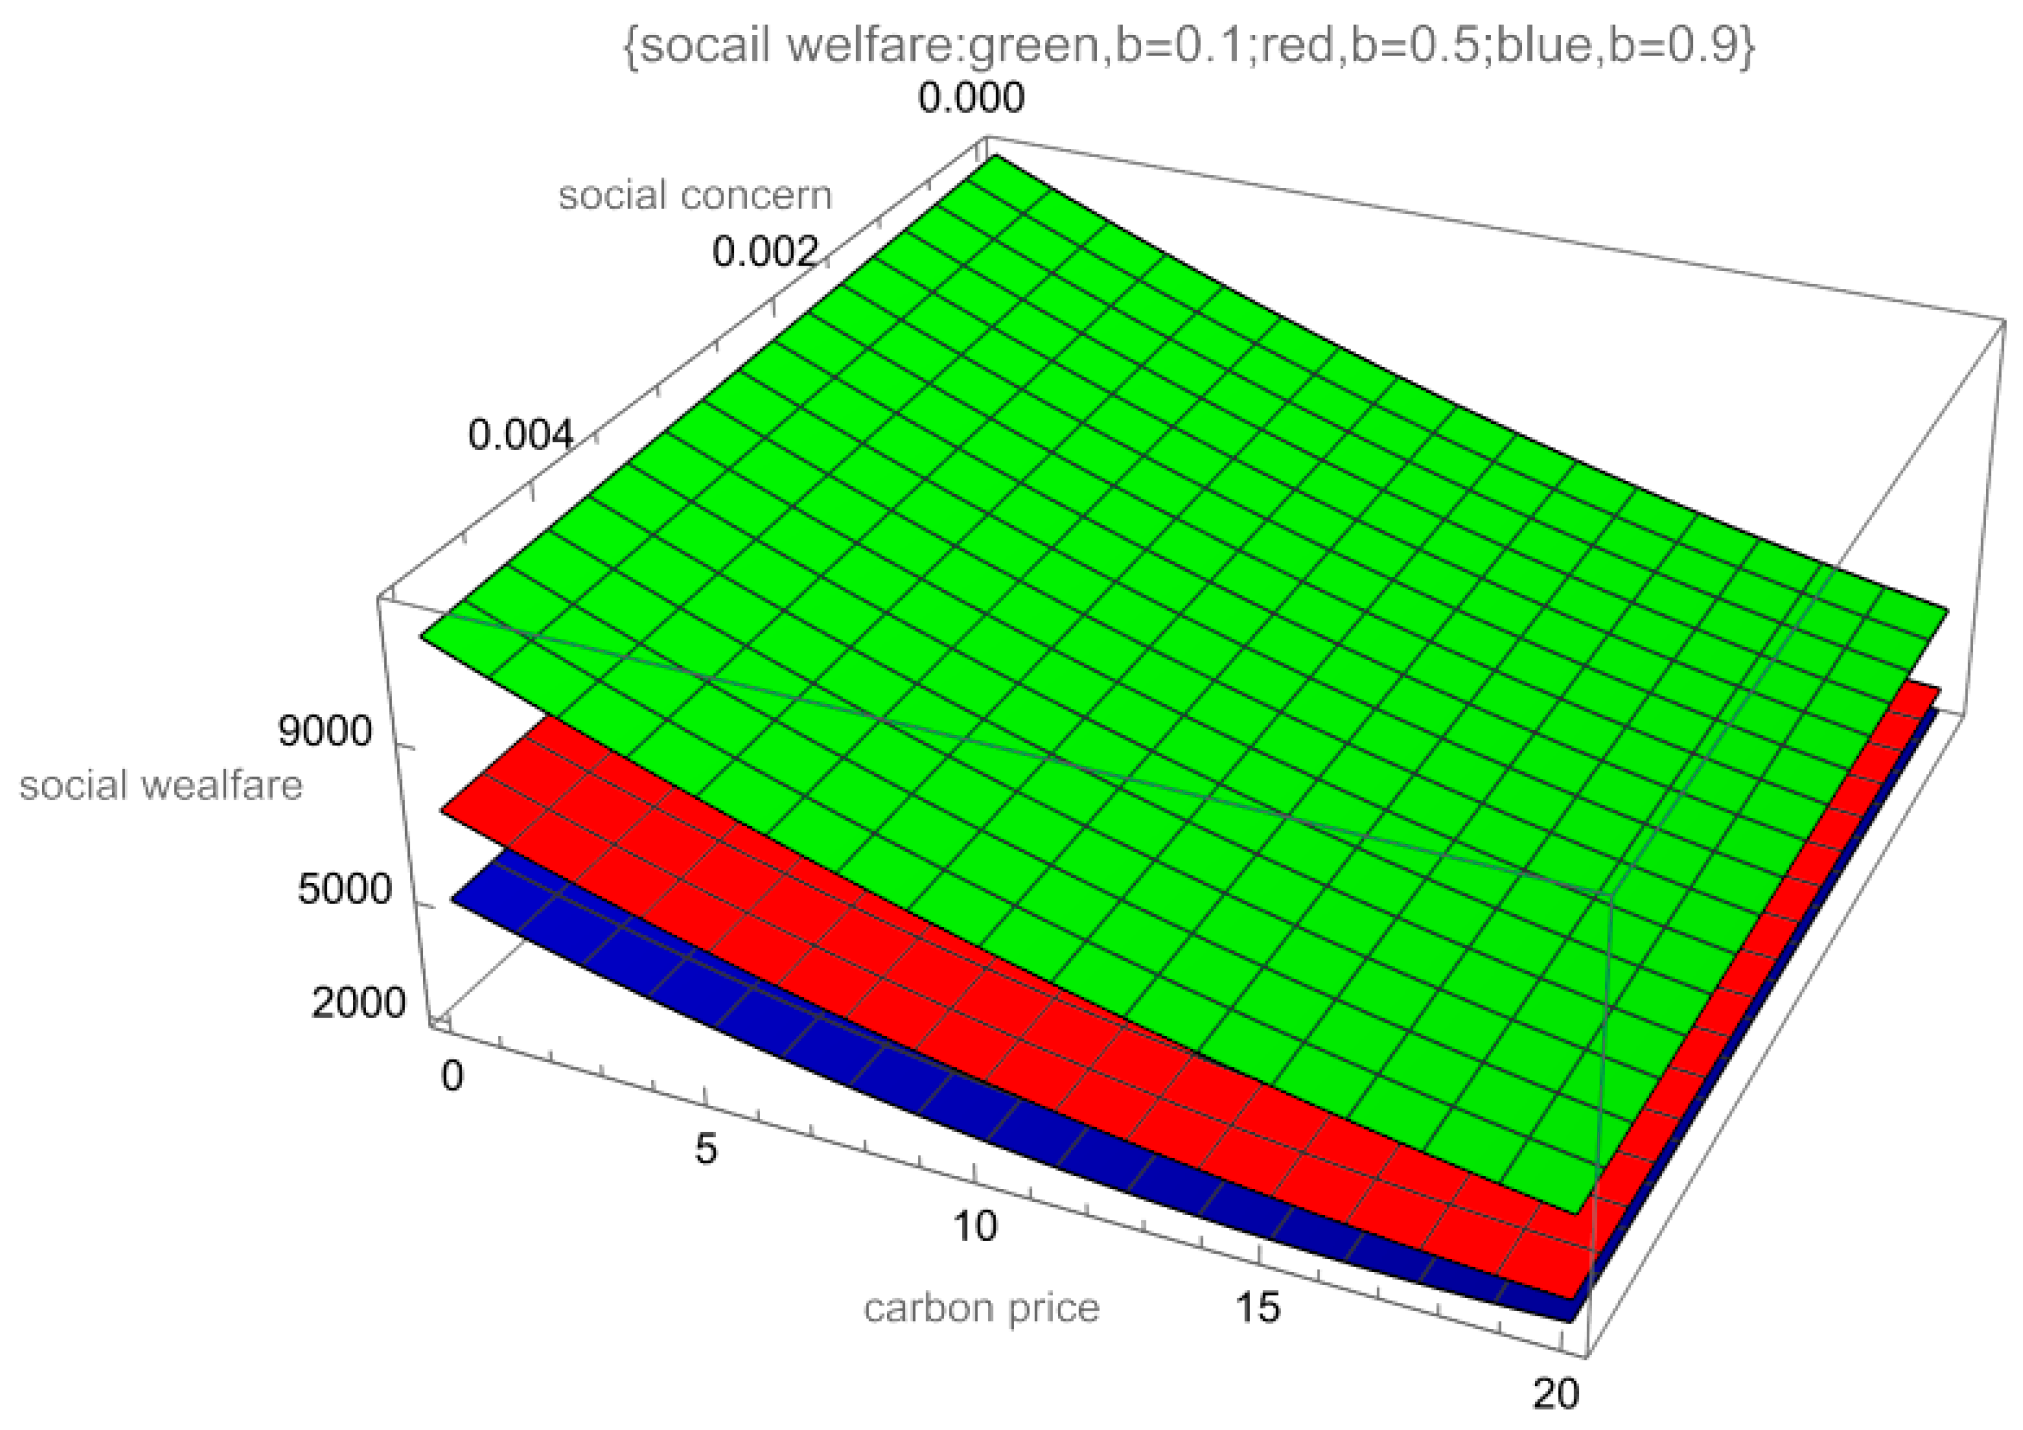
Figure 8 shows how the social welfare of the supply chain varies under different competition conditions. Here, we get three situations (
b = 0.1,
b = 0.5, and
b = 0.9). As can be seen from
Figure 6, the intensification of competition leads to the reduction of social welfare.
5. Managerial Insights and Practical Implications
The comparative and sensitivity analyses yield critical insights into how various parameters influence system performance. These results offer practical guidance for ports and shipping companies in selecting emission-reduction technologies and provide a valuable evidence base for policymakers.
5.1. Strategic Guidance for Port Authorities
Drawing on its strategic position as the infrastructure leader, the port can effectively exercise pricing power by implementing differentiated tariffs. Propositions 1 and 2 demonstrate that in port supply chain systems, the leader consistently achieves higher economic returns than the follower, regardless of whether the port or the shipping company assumes this role. Ports, as natural infrastructure leaders, should leverage this position by designing two-part tariff schemes that internalize the carbon price signal. Specifically, when the carbon price p is below the technology-switch threshold, ports can offer a reduced berthing charge for SP users to partially offset its higher operational cost. This thereby steers vessel choices toward the socially preferable technology even during the transitional cost-disadvantage phase.
Based on the strategic insights derived from this paper, the port can utilize the carbon price as a critical investment signal to guide its infrastructure planning. Investment in port infrastructure, especially for shore power systems, involves substantial fixed costs. The model indicates that such investment is justified when the carbon price surpasses a critical level defined by the cost-emission differential. Therefore, ports should treat the prevailing and forecasted carbon price as a key metric for long-term capital planning. Proactive investment in SP facilities becomes economically rational when p approaches this threshold, allowing the port to future-proof its operations and regulatory compliance.
5.2. Operational and Strategic Imperatives for Shipping Companies
Proposition 3 highlights a crucial factor in emission reduction technology selection in the maritime industry. When the carbon price is low, it is more cost-effective for ships to use LSFO at berth. Shipping companies must transition from static cost assessment to dynamic operational planning that integrates real-time carbon costs. Internal accounting systems should be adapted to evaluate the total cost of at-berth energy. Companies should establish protocols to monitor p and execute this switch.
The model confirms that intense service competition (
b→1) erodes profit margins. A strategic approach involves consolidating bargaining power. The formation of global alliances (e.g., Ocean Alliance, Gemini Cooperation) is a rational market outcome that allows members to negotiate favorable, long-term green corridor agreements with ports, potentially sharing the risks and benefits of SP infrastructure deployment and securing stable cost terms [
46].
5.3. Policy Design Recommendations for Regulators
The most direct policy instrument is the carbon price. To make SP the optimal choice for profit-maximizing shipping firms, regulators must ensure the effective carbon price meets or exceeds the critical threshold derived in Proposition 3. This threshold is calculable based on observable parameters: the marginal cost gap and the emission coefficient difference. Setting a price floor or adjusting auction reserves in an ETS to target this threshold can efficiently align private incentives with decarbonization goals.
As stated in Proposition 4, carbon emissions of the port supply chain are identical in both power structure games that reveals a policy trade-off. Fostering competition is an effective mechanism for reducing aggregate emissions, as it suppresses overall output. However, its net welfare effect is contingent upon specific conditions and may prove detrimental. Consequently, a nuanced rather than uniform application of competition policy is warranted. In highly competitive routes, the policy should focus on ensuring a sufficiently strong carbon price signal. On monopolistic or oligopolistic routes, introducing measures to enhance competition can serve as a complementary tool for emission control, provided consumer welfare implications are assessed.
The results show that SP adoption can enhance social welfare by reducing environmental externalities—even when it is not optimal. Under such circumstances, the implementation of targeted and temporary subsidies (e.g., for SP infrastructure or electricity consumption) can be justified to align private incentives with the socially optimal outcome. These subsidies should be explicitly phased out contingent on the carbon price reaching the designated threshold or on achieving a predetermined cost-reduction in SP technology, ensuring they serve as a catalyst rather than a permanent market distortion.
These insights provide valuable guidance for ports and shipping companies in making strategic decisions about leadership roles and technology adoption.
6. Conclusions and Future Research
This study examines a supply chain involving one port and two competing ships under two distinct power structure configurations. Several findings are summarized as follows:
In the supply chain, leaders consistently achieve higher profits than followers, whether the leaders are ports or ships. The overall profits of the supply chain are the same in both game scenarios.
Within supply chain games, leaders (whether a port or a carrier) consistently attain a higher profit share compared to the followers. Notably, the aggregate profits of the supply chain remain constant across the corresponding equilibrium outcomes. Compared to LSFO, SP represents a more costly yet more effective emission reduction approach. At low carbon prices, ships using LSFO are more profitable due to lower overall costs. Conversely, SP becomes the more advantageous choice when carbon prices are high. However, carbon emissions vary with carbon price levels, decreasing as carbon price rises. The study reveals that intensified competition among vessels reduces service output, thereby lowering profits, carbon emissions, and social welfare. Consequently, these outcomes provide actionable guidance for shipping operators in their technology adoption decisions and offer important considerations for governments in policy development and management strategies.
The adoption of carbon emission reduction technologies within the port supply chain is shaped in practice by a complex interplay of factors. Key considerations include the availability and allocation of port resources, vessel-specific technical and operational profiles, inter-port competitive dynamics, and uncertainties surrounding shipping market demand. This complexity poses significant challenges to the implementation of effective emission control technologies, as stakeholders must balance economic viability with environmental objectives. In light of these challenges, future research should focus on developing more comprehensive and realistic supply chain models that incorporate the interactions among multiple ports and the randomness of shipping market demand. These models offer valuable insights into how demand fluctuations, alterations in shipping schedules, and uncertainties in global trade patterns influence decision-making processes and carbon emission levels. In addition, the model can be expanded to incorporate a portfolio of more than two technological choices, including green methanol and other alternative fuels, to study complex multi-technology competition under uncertainty. Last but not least, embedding technological learning curves and cost reduction projections for SP and alternative fuels would enhance the dynamic realism of the analysis. These steps will further solidify the contribution of game-theoretic analysis to achieving the Sustainable Development Goals (SDGs) in the maritime sector.
Author Contributions
Conceptualization, Y.Z.; methodology, H.Z.; software, H.Z.; validation, Y.Z.; formal analysis, W.S. and Y.Z.; investigation, G.Z.; resources, H.Z.; writing, H.Z.; funding acquisition, Y.Z. All authors have read and agreed to the published version of the manuscript.
Funding
The study was funded by the Tertiary Education Scientific Research Project of Guangzhou Municipal Education Bureau (202235326) and Guangdong Basic and Applied Basic Research Foundation (2022A1515111213).
Data Availability Statement
The original contributions presented in this study are included in the article. Further inquiries can be directed to the corresponding author.
Conflicts of Interest
The authors declare no conflicts of interest.
Appendix A
Appendix A.1. Equilibrium Solutions of the Models
(1) Under the ship-leader Stackelberg scenario, the port’s profit is as follows:
Because
the Hessian matrix is:
Because
> 0, then
solving
,
, then
=
,
=
.
Substituting
,
into Equations (1), (3) and (4), and because
. The Hessian matrix is:
Because
, then
solving
, thus,
(2) Under the port-leader Stackelberg scenario, the profits of ships are:
.
. Because
the Hessian matrix is:
Because
> 0, then
solving
. We have:
Substituting into Equations (1) and (2), and because .
Because
> 0, then,
solving
, thus,
Appendix A.2. Proofs
Proof of Lemma 1. Taking the partial derivative of
and
with respect to different parameters:
□
Proof of Lemma 2. Taking the partial derivative of the profits of ships, port, and the whole supply chain concerning different parameters:
□
Proof of Proposition 1. Because
,
, then
, and
, then
Thus, . □
Proof of Proposition 2. Because then, Therefore, if then, , otherwise .(j = P, S). □
Proof of Lemma 3. Calculating the partial derivatives of
and
with respect to various parameters, we have:
□
Proof of Proposition 4.
then
. Otherwise
. □
Proof of Lemma 4. Calculating the partial derivatives of
with respect to various parameters:
When , then, (j = P, S) are convex with respect to , , , otherwise (j = P, S) are concave with respect to , , .
When , then, (j = P, S) are convex with respect to m, otherwise (j = P, S) are concave with respect to m. □
References
- Ministry of Transport of the People’s Republic of China. Notice of the Ministry of Transport on Issuing the Implementation Plan for Ship Emission Control Areas. Available online: https://www.gov.cn/zhengce/zhengceku/2018-12/31/content_5444672.htm (accessed on 30 December 2018).
- China Water Transport News. A “Green Revolution” in Shore Power. Available online: https://cjhy.mot.gov.cn/xw/slxw/202508/t20250829_458737.shtml (accessed on 29 August 2025).
- Qingdao Daily. Shipping Industry Decarbonization Sparks a Wave of Vessel Renewal. Available online: http://www.qingdao.gov.cn/ywdt/zwyw/202404/t20240417_7966534.shtml (accessed on 17 April 2024).
- Liu, W.; Wang, S.; Zhu, D.L.; Wang, D.; Shen, X. Order allocation of logistics service supply chain with fairness concern and demand updating: Model analysis and empirical examination. Ann. Oper. Res. 2017, 268, 177–213. [Google Scholar] [CrossRef]
- Colmer, J.; Martin, R.; Muûls, M.; Wagner, U.J. Does pricing carbon mitigate climate change? Firm-level evidence from the European Union emissions trading system. Rev. Econ. Stud. 2025, 92, 1625–1660. [Google Scholar] [CrossRef]
- Flodén, J.; Zetterberg, L.; Christodoulou, A.; Parsmo, R.; Fridell, E.; Hansson, J.; Rootzén, J.; Woxenius, J. Shiping in the EU emissions trading system: Implications for mitigation, costs and modal split. Clim. Policy 2024, 24, 969–987. [Google Scholar] [CrossRef]
- Wang, S.; Zhen, L.; Psaraftis, H.N.; Yan, R. Implications of the EU’s inclusion of maritime transport in the emissions trading system for ship companies. Engineering 2021, 7, 554–557. [Google Scholar] [CrossRef]
- Zhong, M.; Song, Z.; Jiang, W. Fleet deployment and speed optimization of liners under different carbon emission reduction policies. Navig. China 2024, 47, 111–119. [Google Scholar]
- He, Z.; Wang, D.; Li, J.; Fang, W.; Yang, Y.; Ji, M. An Evolutionary Stability Study of Zero-Carbon Transition for Ship Enterprises Considering Dynamic Penalty and Carbon Quota Trading Mechanisms. Sustainability 2024, 16, 10684. [Google Scholar] [CrossRef]
- Zhang, G.; Zhang, Z.; Yuan, H.; Chen, W. Emission-reduction investment strategies in competitive ship supply chains under carbon cap-and-trade mechanisms. Front. Mar. Sci. 2025, 12, 1546146. [Google Scholar] [CrossRef]
- Wang, T.; Cheng, P.; Wang, Y. How the establishment of carbon emission trading system affects ship emission reduction strategies designed for sulfur emission control area. Transp. Policy 2025, 160, 138–153. [Google Scholar] [CrossRef]
- Luo, C.; Zhou, Y.; Mu, M.; Zhang, Q.; Cao, Z. Subsidy, tax or green awareness: Government policy selection for promoting initial shore power usage and sustaining long-run use. J. Clean. Prod. 2024, 442, 140946. [Google Scholar] [CrossRef]
- Zis, T.P.V. Prospects of cold ironing as an emissions reduction option. Transp. Res. Part A 2019, 7, 82–95. [Google Scholar] [CrossRef]
- Martínez-López, A.; Romero-Filgueira, A.; Chica, M. Specific environmental charges to boost Cold Ironing use in the European Short Sea Shipping. Transp. Res. Part D Transp. Environ. 2021, 94, 52–63. [Google Scholar] [CrossRef]
- Reusser, C.A.; Pérez, J.R. Evaluation of the Emission Impact of Cold-Ironing Power Systems, Using a Bi-Directional Power Flow Control Strategy. Sustainability 2021, 13, 323–334. [Google Scholar] [CrossRef]
- Martínez-López, A.; Romero, A.; Orosa, J.A. Assessment of cold ironing and LNG as mitigation tools of short sea shipping emissions in port: A Spanish case study. Appl. Sci. 2021, 11, 2050–2061. [Google Scholar] [CrossRef]
- Tan, Z.; Zeng, X.; Wang, T.; Wang, Y.; Chen, J. Capacity investment of shore power berths for a container port: Environmental incentive and infrastructure subsidy policies. Ocean Coast. Manag. 2023, 239, 106582. [Google Scholar] [CrossRef]
- Gu, Y.; Yu, X. A life cycle cost analysis of different shore power incentive policies on both shore and ship sides based on system dynamics and a Chinese port case. Environ. Sci. Pollut. Res. 2024, 20, 29563–29583. [Google Scholar] [CrossRef]
- Abu Bakar, N.N.; Bazmohammadi, N.; Çimen, H.; Uyanik, T.; Vasquez, J.C.; Guerrero, J.M. Data-driven ship berthing forecasting for cold ironing in maritime transportation. Appl. Energy 2022, 326, 119947. [Google Scholar] [CrossRef]
- Wang, T.; Chen, Y.; Li, S. Evaluating government penalty policies in shipping emission control areas: An evolutionary game theory approach. Transp. Policy 2025, 171, 641–660. [Google Scholar] [CrossRef]
- Xing, H.; Stuart, C.; Spence, S.; Chen, H. Alternative fuel options for low carbon maritime transportation: Pathways to 2050. J. Clean. Prod. 2021, 297, 126651. [Google Scholar] [CrossRef]
- Piccoli, T.; Fermeglia, M.; Bosich, D.; Bevilacqua, P.; Sulligoi, G. Environmental Assessment and Regulatory Aspects of Cold Ironing Planning for a Maritime Route in the Adriatic Sea. Energies 2021, 14, 5836. [Google Scholar] [CrossRef]
- Zhou, H.; Zhang, W. Choice of Emission Control Technology in Port Areas with Customers’ Low-Carbon Preference. Sustainability 2022, 14, 13816. [Google Scholar] [CrossRef]
- Michis, A.A. On measuring competition in the ship management industry. J. Shipp. Trade 2025, 10, 8. [Google Scholar] [CrossRef]
- Sun, H.; Geng, L.; Gao, Y.; Qu, C. Cooperation and coordination strategy of the online container supply chain considering service quality competition. Res. Transp. Bus. Manag. 2025, 59, 101297. [Google Scholar] [CrossRef]
- Gena, B.; Arief, D.; Tridoyo, K.; Nimmi, Z. Competitive advantage improvement strategy of container shipping industry: Case of Indonesia. Int. J. Shipp. Transp. Logist. 2020, 12, 307–339. [Google Scholar] [CrossRef]
- Vasiliadis, L.; Gavalas, D.; Tsitsakis, C. Competitive strategies and integration expanses in the large shipping container industry during an era of consecutive global crises. Mar. Technol. Res. 2024, 6, 266413. [Google Scholar] [CrossRef]
- Bai, X.; Cheng, L.; Iris, Ç. Data-driven financial and operational risk management: Empirical evidence from the global tramp shipping industry. Transp. Res. Part E 2022, 158, 102617. [Google Scholar] [CrossRef]
- Bang, H.-S.; Kang, H.-W.; Martin, J.; Woo, S.-H. The impact of operational and strategic management on liner shipping efficiency: A two-stage DEA approach. Marit. Policy Manag. 2012, 39, 653–672. [Google Scholar] [CrossRef]
- Wang, H.; Meng, Q.; Zhang, X. Game-theoretical models for competition analysis in a new emerging liner container shipping market. Transp. Res. Part B 2014, 70, 201–227. [Google Scholar] [CrossRef]
- Wang, H.; Wang, C.; Li, M.; Xie, Y. Blockchain technology investment strategy for shipping companies under competition. Ocean Coast. Manag. 2023, 243, 106696. [Google Scholar] [CrossRef]
- Jiang, M.; Lu, J.; Qu, Z.; Yang, Z. Port vulnerability assessment from a supply Chain perspective. Ocean Coast. Manag. 2021, 213, 105851. [Google Scholar] [CrossRef]
- Li, D.; Qu, Y.; Ma, Y. Study on the impact of subsidies for overlapping hinterland shippers on port competition. Transp. Res. Part A Policy Pract. 2020, 135, 24–37. [Google Scholar] [CrossRef]
- Wang, C.; Jiao, Y.; Peng, J. Shipping company’s choice of shore power or low sulfur fuel oil under different power structures of maritime supply chain. Marit. Policy Manag. 2024, 51, 1423–1442. [Google Scholar] [CrossRef]
- Zhu, L.; Zhou, R.; Li, X.; Zheng, L. Analysis of tripartite evolutionary game for maritime supply chain collaboration considering carbon emission governance. Front. Mar. Sci. 2025, 12, 1552544. [Google Scholar] [CrossRef]
- Li, M.; Luan, J.; Li, X.; Jia, P. An analysis of the impact of government subsidies on emission reduction technology investment strategies in low-carbon port operations. Systems 2024, 12, 134. [Google Scholar] [CrossRef]
- Cai, W.; Xie, C.; Gu, Y. Enhancing Inland River Shore Power Utilization: A Game Theory and Prospect Theory Approach to Optimizing Incentive Mechanisms. Sustainability 2025, 17, 1964. [Google Scholar] [CrossRef]
- Wang, Q.; Man, S.; Wang, Y. Evolutionary game analysis between regional governments and shipping companies: Considering the impact of government subsidy on shipping companies. Mar. Pollut. Bull. 2024, 205, 116655. [Google Scholar] [CrossRef] [PubMed]
- Hua, C.; Chen, J.; Wan, Z.; Xu, L.; Bai, Y.; Zheng, T.; Fei, Y. Evaluation and governance of green development practice of port: A sea port case of China. J. Clean. Prod. 2020, 249, 119434. [Google Scholar] [CrossRef]
- Yang, L.; Cai, Y.; Wei, Y.; Huang, S. Choice of technology for emission control in port areas: A supply chain perspective. J. Clean. Prod. 2019, 240, 118105. [Google Scholar] [CrossRef]
- China Port, Management Suggestions on the Development of China’s Shore Power. Available online: http://www.escn.com.cn/news/show-430111.html (accessed on 12 June 2017).
- Qian, X.; Liu, W.; Yang, J. Game theory analysis of technology adoption timing and pricing decision in supply chain system under asymmetric Nash equilibrium. J. Intell. Fuzzy Syst. 2018, 35, 3101–3111. [Google Scholar] [CrossRef]
- Yang, L.; Cai, Y.; Zhong, X.; Shi, Y.; Zhang, Z. A carbon emission evaluation for an integrated logistics system—A case study of the port of Shenzhen. Sustainability 2017, 9, 462–485. [Google Scholar] [CrossRef]
- Benjaafar, S.; Li, Y.; Daskin, M. Carbon Footprint and the Management of Supply Chains: Insights from Simple Models. IEEE Trans. Autom. Sci. Eng. 2013, 10, 99–116. [Google Scholar] [CrossRef]
- Krass, D.; Nedorezov, T.; Ovchinnikov, A. Environmental taxes and the choice of green technology. Prod. Oper. Manag. 2013, 22, 1035–1055. [Google Scholar] [CrossRef]
- China Futures Market Daily. The Reshuffling of Shipping Alliances is Reshaping Freight Rates Beyond Market Forecasts. Available online: https://price.mofcom.gov.cn/article/yjzx/hyzx/hy/202502/62729.html (accessed on 20 February 2025).
| Disclaimer/Publisher’s Note: The statements, opinions and data contained in all publications are solely those of the individual author(s) and contributor(s) and not of MDPI and/or the editor(s). MDPI and/or the editor(s) disclaim responsibility for any injury to people or property resulting from any ideas, methods, instructions or products referred to in the content. |