1. Introduction
The socioeconomic implications of recent pandemics, including H1N1, SARS, MERS, Ebola, and COVID-19, have posed substantial challenges and emerged as top priorities in public health for governments worldwide [
1,
2,
3]. Conventional epidemiological methods rely on compartmental models that classify populations considering economic and demographic variables, as well as other factors. Regardless of their simplicity in capturing individual behaviors, these models have proven effective in informing and influencing the formation of strategies for public health [
4,
5,
6].
The majority of computational epidemiology methodologies utilize compartmental models, complex network frameworks, agent-based modeling (ABMs), or integrated hybrid techniques. While compartmental models lack realism and tractability [
4,
7,
8], as all agents interact without geo-spatial restrictions, network models address this by restricting interactions to neighboring nodes. However, they do not allow node mobility as seen in dense metropolitan areas [
9,
10]. In recent years, agent-based modeling (ABM) has emerged as an important technique for studying infectious disease outbreaks, offering a detailed and dynamic simulation of individual interactions and movements [
11,
12,
13,
14,
15].
ABMs enhance the realism of simulations compared to conventional methods, such as compartmental or network models, by enabling agents to move and interact dynamically with greater freedom. Due to their high level of realism, ABMs are highly effective in simulating complex urban settings with dense populations, where mobility patterns have a considerable impact on disease transmission [
16]. Notably, in the initial stages of the COVID-19 pandemic, ABM emerged as an effective alternative to traditional compartmental models such as SIR and SIS [
17,
18].
We further position this study within the extensive body of literature on the efficacy of travel interventions during the COVID-19 pandemic. There is a consensus that strict border closures and travel restrictions, when implemented early, were instrumental in delaying the global spread of the virus [
19,
20]. For instance, modeling studies have shown that the Wuhan travel ban delayed epidemic progression within China by 3 to 5 days but reduced international case importations by nearly 80% in the initial weeks [
19,
21]. On the other hand, Zhong et al. [
22] provided a useful synthesis showing that many early travel bans had a limited effect, reinforcing the need to consider how to optimize such policies. However, real-world evidence from island nations such as Australia and New Zealand demonstrated that strict border controls, when combined with internal lockdowns, successfully suppressed transmission dynamics [
20]. These extreme examples confirm that while travel restrictions are not a perfect solution on their own, they are a critical component of non-pharmaceutical interventions.
As the COVID-19 pandemic evolved, the debate shifted from
whether to restrict travel to
how to restrict it sustainably, balancing public health gains with socioeconomic impact. Le et al. [
23] noted that smart reopening policies could allow much travel with low risk, but specific strategies for easing restrictions are understudied. While the efficacy of total bans is well-documented, the nuanced impact of partial restrictions—specifically comparing flight frequency reduction against flight distance limitations—remains an active area of investigation that this study aims to address.
In terms of adapting ABMs to epidemic spreading, we enumerate several representative studies that were successful in adapting ABMs for computational epidemics. First, we note Parker et al.’s [
24] global-scale agent-based simulation, involving six billion individuals, which first showcased the capacity of agent-based modeling to understand pandemic spread. In our interconnected world, pandemics often transcend national boundaries, but intervention policies are commonly enforced by local circumstances at the country or city level. To this end, we find multiple localized studies. For example, Datta et al. [
25] focused on reproducing the dynamics of COVID-19 in New York only. Tatsukawa et al. [
26] created a theoretical framework to simulate epidemics based on network models and study the impact of various underlying topologies. Hoertel et al. [
27] used data at the national level in France to design an ABM to reproduce the total case ratios measured from real data. Zhuge et al. [
14] formulated an integrated model by merging agent-based modeling (ABM) with social network analysis, where agent friendships are determined by both similarity and geographical data. Although designed for general applications, this model does not incorporate agent mobility. Meanwhile, Mao et al. [
28] applied the SLIR epidemic model specifically to the H1N1 virus, constructing an ABM for the Buffalo area in the USA, drawing from local business data. Their research concludes that specific locations significantly influence the disease’s transmission. Finally, Hinch et al. [
18] developed the OpenABM-Covid-19 framework, specifically tuned for the United Kingdom, and obtained a specific
flattening the curve-type solution that does not result in subsequent infection waves. Conversely, our meta-ABM enables epidemic resurgence due to its distributed network of independent epidemic systems [
29].
Computational epidemiology has recently shifted from traditional deterministic approaches to advanced stochastic modeling approaches. In the current literature, we also find investigations of the SVIR and SIRS epidemic models with stochastic perturbations to capture environmental noise, offering a more detailed representation of transmission thresholds [
30,
31]. In addition, by incorporating adaptive treatment functions and the influence of media coverage (shown to modulate contact rates), epidemic outcomes can be significantly reshaped [
32,
33]. Although such models provide deeper insight into local population dynamics, our study aims to address a meta-population context, in which stochasticity emerges from global mobility networks rather than fluctuations in internal parameters.
The main contribution and originality of this paper lie in modeling a network of distributed epidemic systems, represented by independent agent-based models that are interconnected via agent mobility resulting from global flight data. These epidemic systems (i.e., cities) are scaled and positioned based on real geographical data, and further incorporate mobility patterns derived from the global air traffic complex network. This network, referred to by us as the meta-ABM, serves as the framework for studying the impact of travel restrictions directly applied to the global airline network. These restriction policies specifically target the limitation of flight numbers, the restriction of maximum flight distances, or a hybrid combination of both. Our conclusions are supported through repeated computer simulations in diverse agent populations, ranging from 6000 to 1.36 million agents.
Through the design of our meta-ABM, our focus is also to understand the impact that different (i) population sizes of agents, (ii) restriction policies, and (iii) the influence of simulation durations have on the progression of an epidemic outbreak. Consequently, our research aims to tackle the following key inquiries pertinent to managing the spread of epidemic outbreaks
- 1.
How do the outbreak dynamics scale with the population size of a system (e.g., country, continent, globally)?
- 2.
How do different inter-city travel restriction strategies affect the spread of an outbreak? Here, we consider cities connected solely via air traffic.
- 3.
Which type of travel restriction—applied on the global airline network—is most effective in limiting the outbreak development?
- 4.
From a computational point of view, what simulation timeframe should be considered (minimal and recommended) to reproduce representative experimental results?
Our research intends to tackle these questions to formulate a collection of qualitative guidelines for proficient epidemic control, which will have an immediate and long-term effect on society and extend to cross-disciplinary fields, including epidemiology, modeling and simulation, and public health.
The remainder of the manuscript is structured as follows: In
Section 2, we introduce the meta-ABM, agent mobility, restriction policies, the epidemic model, and its parameters. In
Section 3, we describe the experimental configuration and analyze the outcomes of the simulation, focusing on restriction policies and agent population. In the
Section 4, we summarize the achieved results and their interpretation, outline the study’s limitations, and suggest directions for forthcoming studies.
2. Materials and Methods
In what follows, we detail the meta-ABM parameters and construction, the agent mobility and epidemic diffusion mechanisms, the restriction policies, and the epidemic model used as a support for instantiating our ABM and the epidemic context.
2.1. Modeling Considerations and Problem Statement
First, we define a network model , where represents the collection of all cities in the global airline network (i.e., considered nodes in the network), and , which represents the collection of direct flights in this network (i.e., considered edges in the network). In this study, the network nodes do not represent individuals, but cities—with a corresponding airport—in the global airline network. Each edge represents a real-world direct flight between two cities. The flights are undirected, weighted edges, where each flight weight is equal to the number of daily flights between the two connected cities (i.e., in both directions). As an illustration, consider the scenario where there are twelve daily flights connecting London and New York; in this case, the corresponding flight weight would be .
Each city node in the network G is modeled as an independent epidemic system, specifically, as an agent-based model composed of individual agents, where each agent interacts according to a local epidemic model, independent of all other epidemic models in all other cities. Without any inter-city travel, epidemic outbreaks would remain contained within each city. However, we consider incorporating agents’ mobility over the network G of distributed cities. To this end, we ensure that a number of randomly selected agents from each city travel (i.e., instantly, without considering travel times) to other cities to which direct connections exist. The number of traveling agents is proportional to each flight’s weight . As such, we obtain a probabilistic population mixing that reproduces global air traffic and allows epidemics to spread.
The entire population P of agents within the system is the sum of all city populations , expressed as . Due to simulation performance considerations, we scaled down the population of each city proportionally. Lastly, an infectious outbreak is triggered by assigning several initially infected agents in random or specific cities.
Overall, an epidemic simulation on the meta-ABM consists of (i) an initialized airline network G (consisting of interconnected cities, each consisting of a local ABM), (ii) several initially infected agents , and (iii) an optional travel restriction policy on the inter-city air travel. By running simulations over a total period T, we track relevant epidemic dynamics, such as the total infected case ratio, the peak infected ratio, and the mortality rate at the macro-scale of the simulated complex system.
2.2. Construction of the Meta-Agent-Based Model Using the Global Airlines Network
In this paper, we utilize openly available data sourced from openflights.org (
https://openflights.org/data.php, accessed on 15 September 2025). Despite the Flight Database receiving its last update in June 2014 and the Airport Database in January 2017, the data remains sufficiently relevant, covering all continents and the majority of cities. Within the Flight Database, accessible online as
routes.dat, there are 67,663 flight routes and 14,110 airports. Nevertheless, numerous remote and isolated airports lack flight information.
Following the parsing of the complete dataset, the network construction using Java (v. 11.0.28), and the network visualization in Gephi [
34], we obtain a giant component consisting of 6072 airports and 18,931 unique flights.
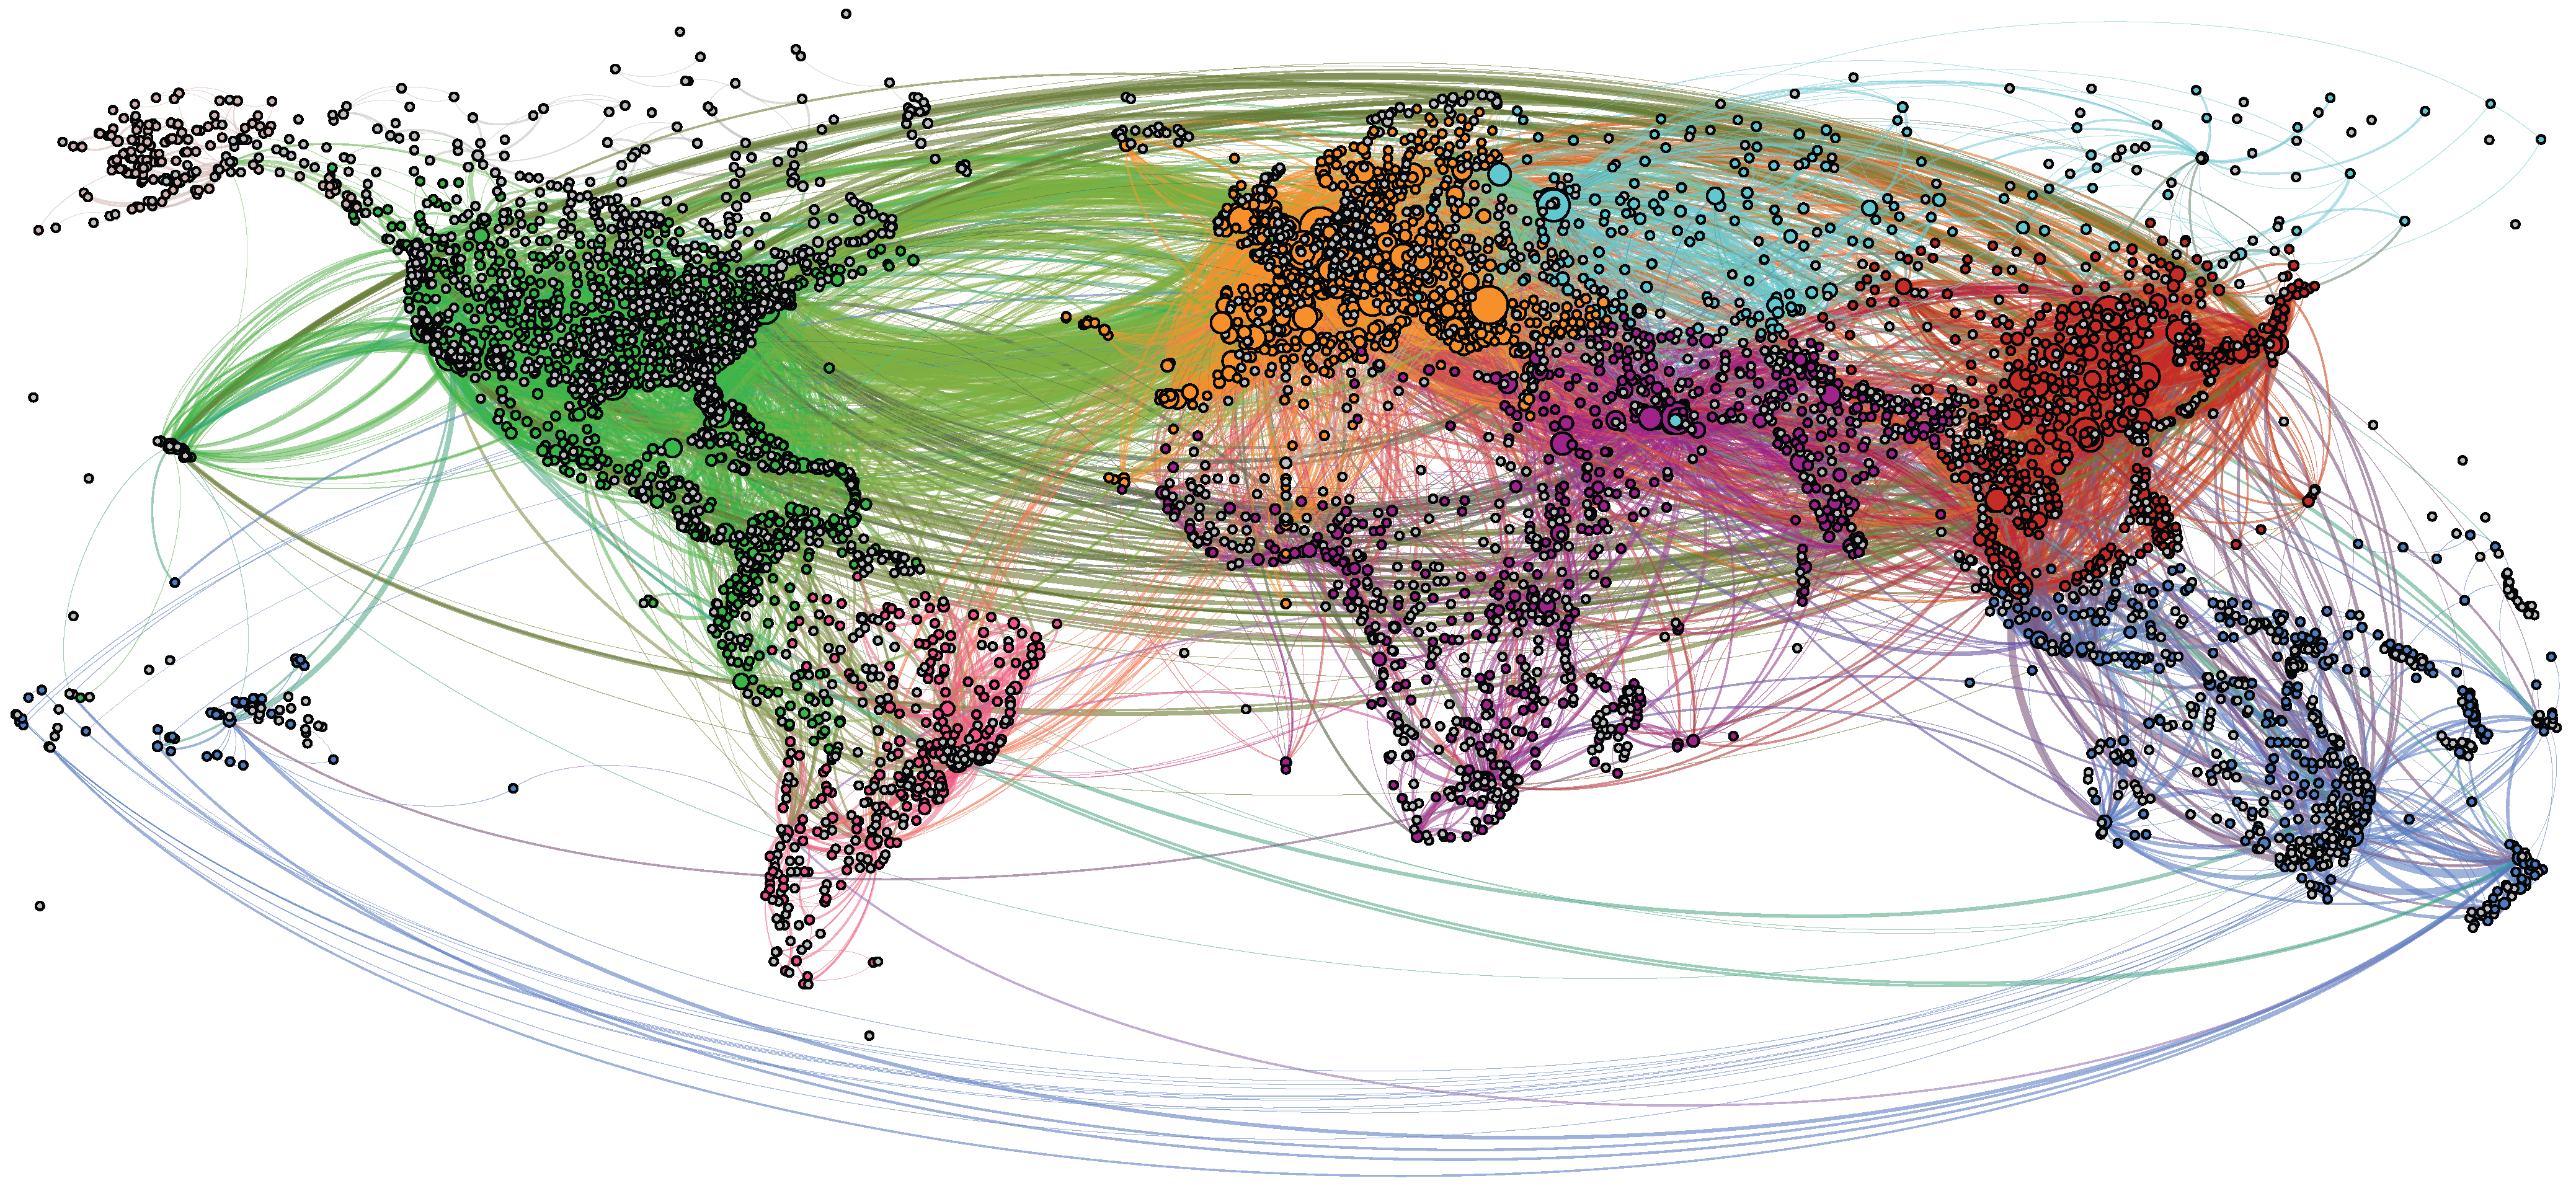
We generate an overview of the connected airline network in
Figure 1 using Gephi 0.9.2. [
34]. The high density of airports, represented as black dots, suggests the coastline and the shape of continents; the curved lines represent the airline connections. The colors used in
Figure 1 correspond to the seven main communities detected using Gephi’s integrated modularity algorithm, based on the Louvain method [
35], and roughly correspond to the seven continents.
We find the following top three airports in terms of the highest node degree (i.e., number of unique flight destinations): Amsterdam (code: AMS, with 248 destinations), Frankfurt (FRA, with 244 destinations), and Paris (CDG, with 235 destinations). In terms of weighted node degree (i.e., the actual number of outbound flights per day), the top three airports are as follows: Atlanta (code: ATL, with 1826 inbound and outbound flights per day), Chicago (OHR, with 1108 flights per day), and London (LHR, with 1051 flights per day). We cross-checked these data with other, more up-to-date sources, including Google queries, and our daily flight numbers are slightly lower, but within the same range.
As a well-established fact, the topology of the airport network corresponds to a scale-free network structure [
36,
37], where the majority of airports experience fewer than 10 daily flights. In our analysis, we calculated an average of 22.51 destinations per airport. However, only 403 airports, comprising 6.64% of the total, have 23 or more distinct destinations per day.
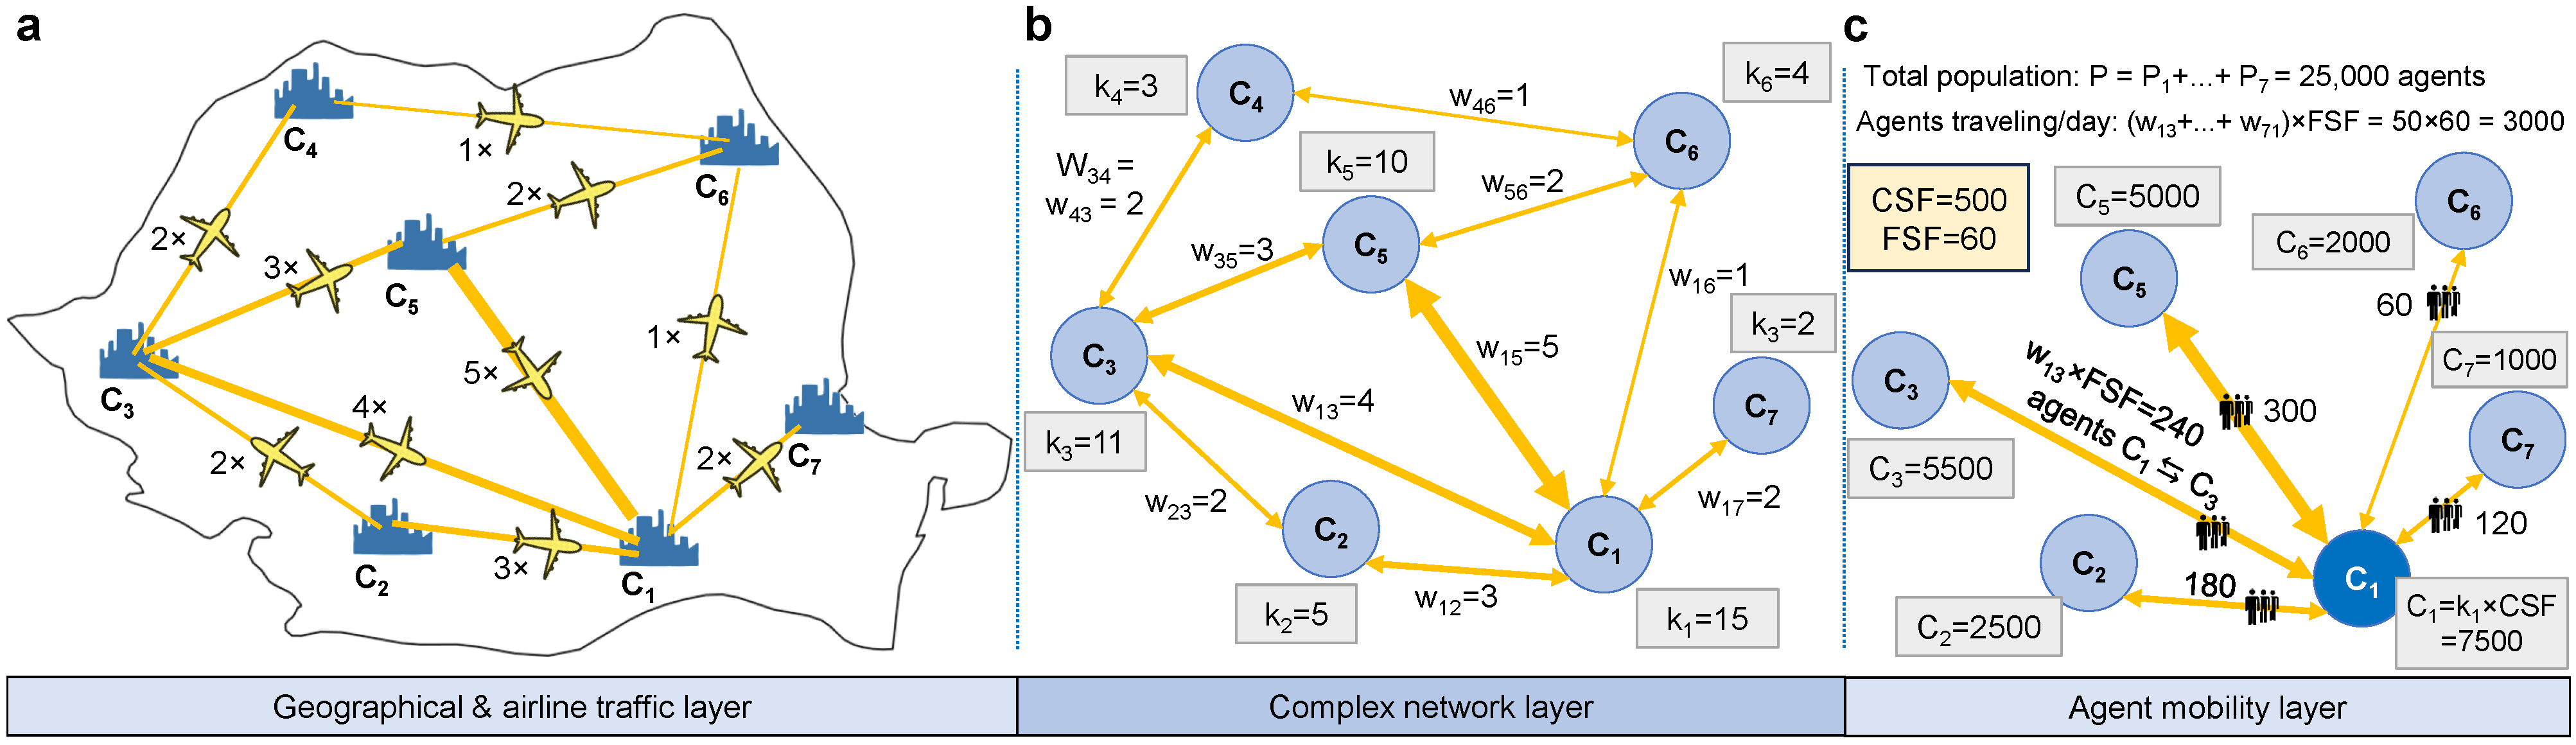
Figure 2 shows the steps required to initialize a meta-ABM, using a scaled-down example consisting of seven cities. In
Figure 2a, we represent the geographical layer where each city
to
is defined by its real-world position given by longitude (x), latitude (y), and elevation; this information is used to calculate the Haversine distance between two cities. The connections between cities are based on existing flights; their daily frequency is suggested in
Figure 2a using the multiplier symbol (×) next to the yellow airplane icon, and the thickness of each yellow line.
In
Figure 2b, the complex network layer projects the information onto the network
, where we compute the weighted node degree
for each city
. Note that, since
G is an undirected network,
such that
, and
is equal to the sum of all flights to adjacent cities
. Furthermore, the weights
of each edge
correspond to the number of flights between cities
and
.
Figure 2c exemplifies the computation of the number of agents traveling per day from each city. Every city
is initialized with a pre-computed number
of agents; namely, the population of a city
is scaled with its number of flights (i.e., node degree
) multiplied by a scaling factor
(city scaling factor). In the chosen example, we define
, which means that for every flight an airport has, there will be 500 agents added to the city population. In
Figure 2c, city
has a population of
agents. The total population of the meta-ABM in the above example is calculated as
= 25,000 agents.
2.3. Epidemic Diffusion Based on Global Mobility Patterns
Each city is instantiated as a local ABM (consisting of the set of agents ) with an independent SICARQD epidemic model that runs only on agents within the city .
An airborne infectious outbreak typically begins with the inclusion of a very small number of initially infected agents in a few random or targeted cities. Since each city has its own epidemic model, the vast majority of cities in the meta-ABM network would remain untouched by the outbreak; therefore, no global pandemic would develop in our simulations. In other words, in the absence of inter-city travel, individual cities would remain isolated, preventing infected agents from reaching uninfected cities. Consequently, the agent mobility mechanism stands out as a pivotal aspect of our meta-ABM, playing a crucial role in shaping epidemic dynamics at the macro-scale.
In light of these premises, we make the following considerations regarding agent travel between cities. The number of traveling agents between each pair of connected cities and —per simulation iteration—is kept constant throughout the simulation. This number is given by each weight (i.e., the number of flights per day) multiplied by the flight scaling factor .
In
Figure 2c, we define
, which means that for every outbound flight from a city
to another city
, there are 60 randomly selected agents traveling in one direction and another 60 random agents traveling back. For example, in
Figure 2c, the city
has an edge weight
towards the city
, which means that the number of agents traveling between the two cities is
.
Hence, starting with only a few initially infected agents
in a single targeted city
will spark an infectious outbreak only within
. Subsequently, as more agents contract the infection, the probability of them traveling to other uncontaminated cities
increases. As a consequence, this sequence triggers infectious outbreaks in destination cities, thereby extending the reach of the epidemic. Given the scale-free nature of the airline network [
36,
37], reaching a single hub airport is sufficient for the infection to proliferate on a global scale from then on.
Based on the described mechanism, which is original compared with other state-of-the-art models, we aim to desynchronize epidemic waves between distributed cities. Consequently, our meta-ABM aims to reproduce highly realistic resurgent epidemics on a macro-scale, as seen in recent outbreaks around the world [
29,
38].
2.4. Implementing Mobility Restrictions Policies
We designed our meta-ABM to help better understand the impact of mobility restrictions imposed on the global airline network. Thus, we identify the number of traveling agents between infected and uninfected cities as a primary factor contributing to a global pandemic. Consequently, restricting travel numbers appears to be an intuitive and scientifically supported approach for mitigating the consequences of a pandemic. In particular, travel restrictions were widespread during the COVID-19 pandemic, and their effects were evidently acknowledged [
4,
21,
39]. Next, we detail the considered restriction policies on our meta-ABM, as such:
- 1.
No restrictions policy—used as a comparison baseline when no flights are canceled, therefore, the number of traveling agents remains at the highest value.
- 2.
Reduce flight frequencies policy—implemented by reducing the number of flights based on the following flight restriction ratios . The scenario where corresponds to the no restrictions policy.
- 3.
Limit maximum flight distance policy—implemented by canceling any flights above a specific maximum distance threshold . The values used for are 500 km, 1000 km, 2000 km, 5000 km, 10,000 km.
- 4.
Hybrid restrictions policy—implemented by simultaneously increasing the flight restriction ratio and decreasing the maximum flight distance threshold to moderate values. The combinations of parameters used are active flights, combined with {2000, 5000, 10,000} km maximum flight distance.
Note that when implementing restriction 2, if there is a connection between two cities, we do not reduce the number of flights below , ensuring that the cities remain connected. For instance, if two cities are initially linked by 4 daily flights, the ratio will decrease their frequency to the nearest integer greater than zero: 2 (50%), 1 (25%), and 1 (10%). On the contrary, when applying restriction 3, cities will become disconnected if the flight distance exceeds the permitted threshold .
2.5. The SICARQD Epidemic Model
SICARQD was developed in 2023 by the authors [
40], as an augmentation of their previous SICARS model [
41], specifically tailored to investigate centralized and decentralized restriction policies during the early COVID-19 pandemic. SICARS, initially conceived as an edge removal framework for complex networks, stands apart from conventional compartmental models [
41]. In general, epidemic models featuring complex patient states extend the traditional SIR model [
42], and focus on analyzing the effectiveness of interventions, such as isolation, vaccination, or quarantine strategies during an epidemic outbreak.
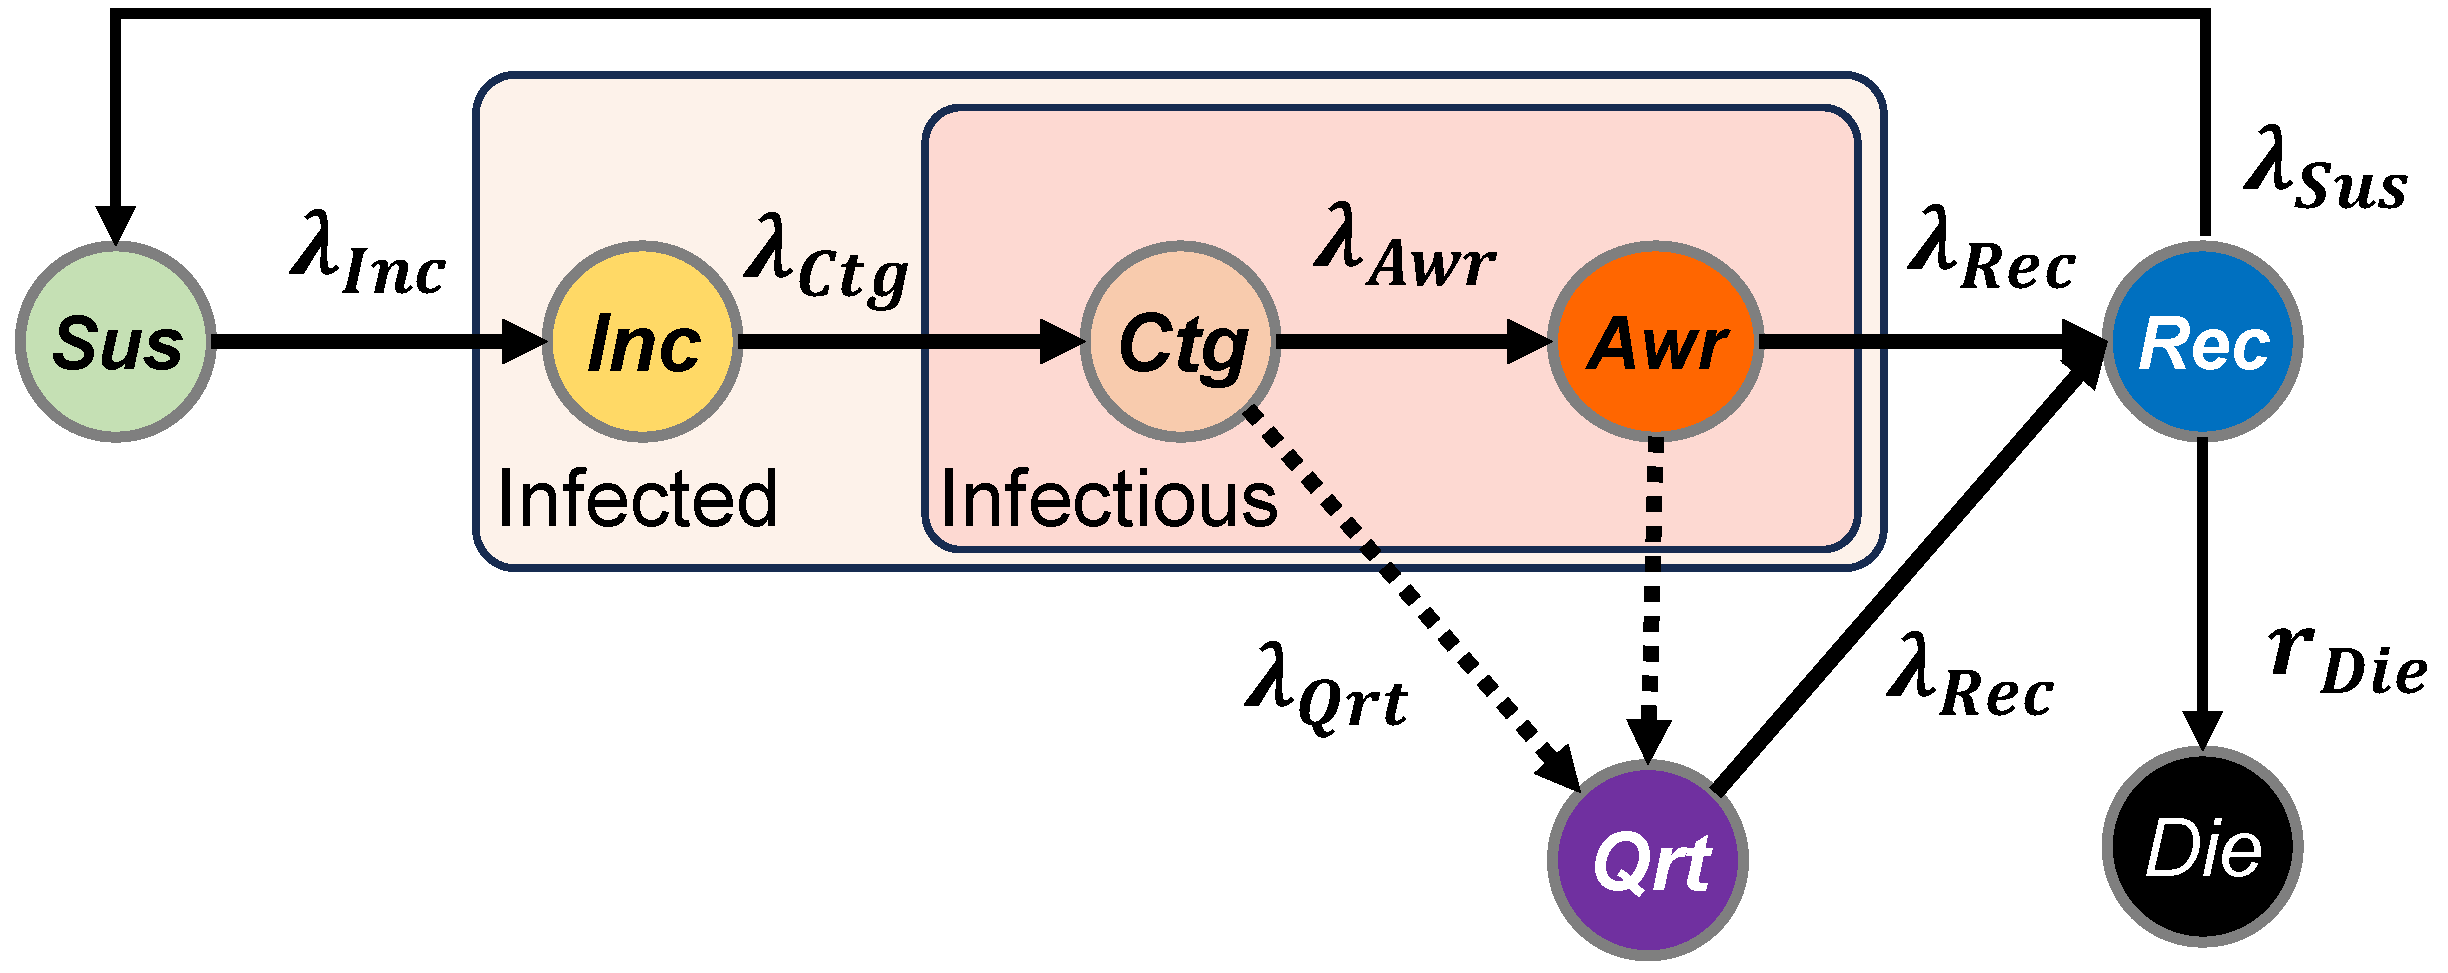
In SICARQD, we examine seven unique states of patients, namely susceptible
, incubating
, contagious
, aware
, recovered
, dead
, and quarantined
. We further detail the epidemic model used in
Figure 3, where the states of the patients are illustrated along with their associated transition rates
. The transitions between states are determined by the following rates:
The rate at which susceptible agents become incubating —may only happen in the proximity of an infectious agent ( or ). Agents in the incubation phase do not transmit the infection to other agents.
The rate at which incubating agents become contagious —the transition after a specific time spent in the state. Agents in the state are contagious, but do not show symptoms (i.e., low chances of self-quarantine).
The rate at which contagious agents become aware —after a specific time spent in the state. Agents in the state are contagious and present symptoms (i.e., self-quarantine is likely).
The rate at which aware agents become recovered —after a specific time spent in the or states. During this transition, it also assessed whether an agent acquires temporary immunity (), or whether the agent dies (), according to the mortality rate .
The rate at which individuals who have recovered transition back to being susceptible , following a defined duration of recovery.
The rate at which infectious agents are moved to quarantine —the agents in will not infect other susceptible agents and will transition to according to , and to according to .
Figure 3.
Diagram of the SICARQD epidemic model and the transition rates between states: susceptible state (not infected), incubating (infected but not yet contagious), contagious (contagious without symptoms), aware (contagious with symptoms), recovered (not infected, temporarily immune), dead (permanently removed), and quarantined (infected but temporarily removed). The relapse rate determines the possibility for agents to revert from back to .
Figure 3.
Diagram of the SICARQD epidemic model and the transition rates between states: susceptible state (not infected), incubating (infected but not yet contagious), contagious (contagious without symptoms), aware (contagious with symptoms), recovered (not infected, temporarily immune), dead (permanently removed), and quarantined (infected but temporarily removed). The relapse rate determines the possibility for agents to revert from back to .
The SICARQD epidemic model is configurable to any airborne virus characterized by person-to-person transmission through proximity mechanisms, including viruses like seasonal flu or H1N1. In this context, we customize the simulation setup according to the characteristics of the SARS-CoV-2 virus by incorporating infectious parameters derived from recent studies. Specifically, we adopt the validated parameters in [
40] that were calibrated for large-scale ABMs in the context of COVID-19.
This research seeks to construct a qualitative general-purpose model in contrast to models specifically designed for particular datasets, regions, or periods [
18,
25,
27,
28]. In this regard, we utilized averaged fixed infectious parameters in our experiments, which is consistent with the approach adopted by several other agent-based modeling (ABM) methodologies [
11,
12,
13,
43]. The SICARQD model’s parameters are outlined in
Table 1. The following sources corroborate each parameter: infection rate [
42,
44], incubation period [
45,
46], delay in the onset of symptoms [
44,
45], contagious duration [
47,
48], mortality ratio [
47,
49], and immunity period [
50,
51].
To quantify and compare the dynamics of each epidemic outbreak simulation, each running for a total duration of T, where the simulation time is , we introduce the following singular measures:
The total infected ratio
—represents the total number of new infection cases scaled by the overall agent population
P. Note that
may exceed 1, given a high enough relapse rate
, as patients experience multiple infections during the duration of the simulation.
where
is the total number of transitions, of any agent
, from susceptible
to incubating
, normalized in relation to the overall count of agents within the system.
The peak infected ratio
—represents the peak (maximum) count of infected agents during any given time period
, normalized by the total agent population. Infected agents are those in either of the states
,
,
, or
.
where we monitor the count of patients in each infected state, namely
,
,
,
, at any given time
t.
The crude mortality ratio
—represents the overall (aggregate) death count normalized for the entire agent population:
where
is the total number of transitions of any agent
, from recovered
to dead
, adjusted according to the overall count of agents within the system. Recovered agents may originate either from the
or
states.
By adopting the three introduced measures (), we are able to quantitatively compare the effects of various restriction policies applied to the meta-ABM.
2.6. Simulation Setup
Table 2 enumerates the input and output parameters examined in each simulation. The objective is to discern how each meta-ABM parameter influences the dynamics of an epidemic outbreak. It is important to mention that, to simplify the simulation outcomes, certain parameters remain constant.
We keep the following simulation parameters fixed: the number of initial infected nodes , the city scaling factor , and the flight scaling factor ; the total simulation time is kept in most scenarios at iterations (equivalent to ≈13.7 years), except when we investigate the impact of a variable simulation time.
Although our SICARQD originally supports the implementation of patient-variable relapse rates and quarantine policies for symptomatic agents [
40], we do not integrate quarantine and relapse into our experimental setup, as it would complicate the interpretation of our results, and is beyond the scope of this paper; our focus is on reproducing resurgent epidemics and influencing outbreaks through travel restrictions implemented at the macro-scale.
Regarding the total agent population
P, we create instances of several real-world regions of varying sizes to more effectively observe the influence of a larger population and a more interconnected network. For this purpose, we establish the following population systems, as outlined in
Table 3, which will be further referenced by using their ‘System-ID’.
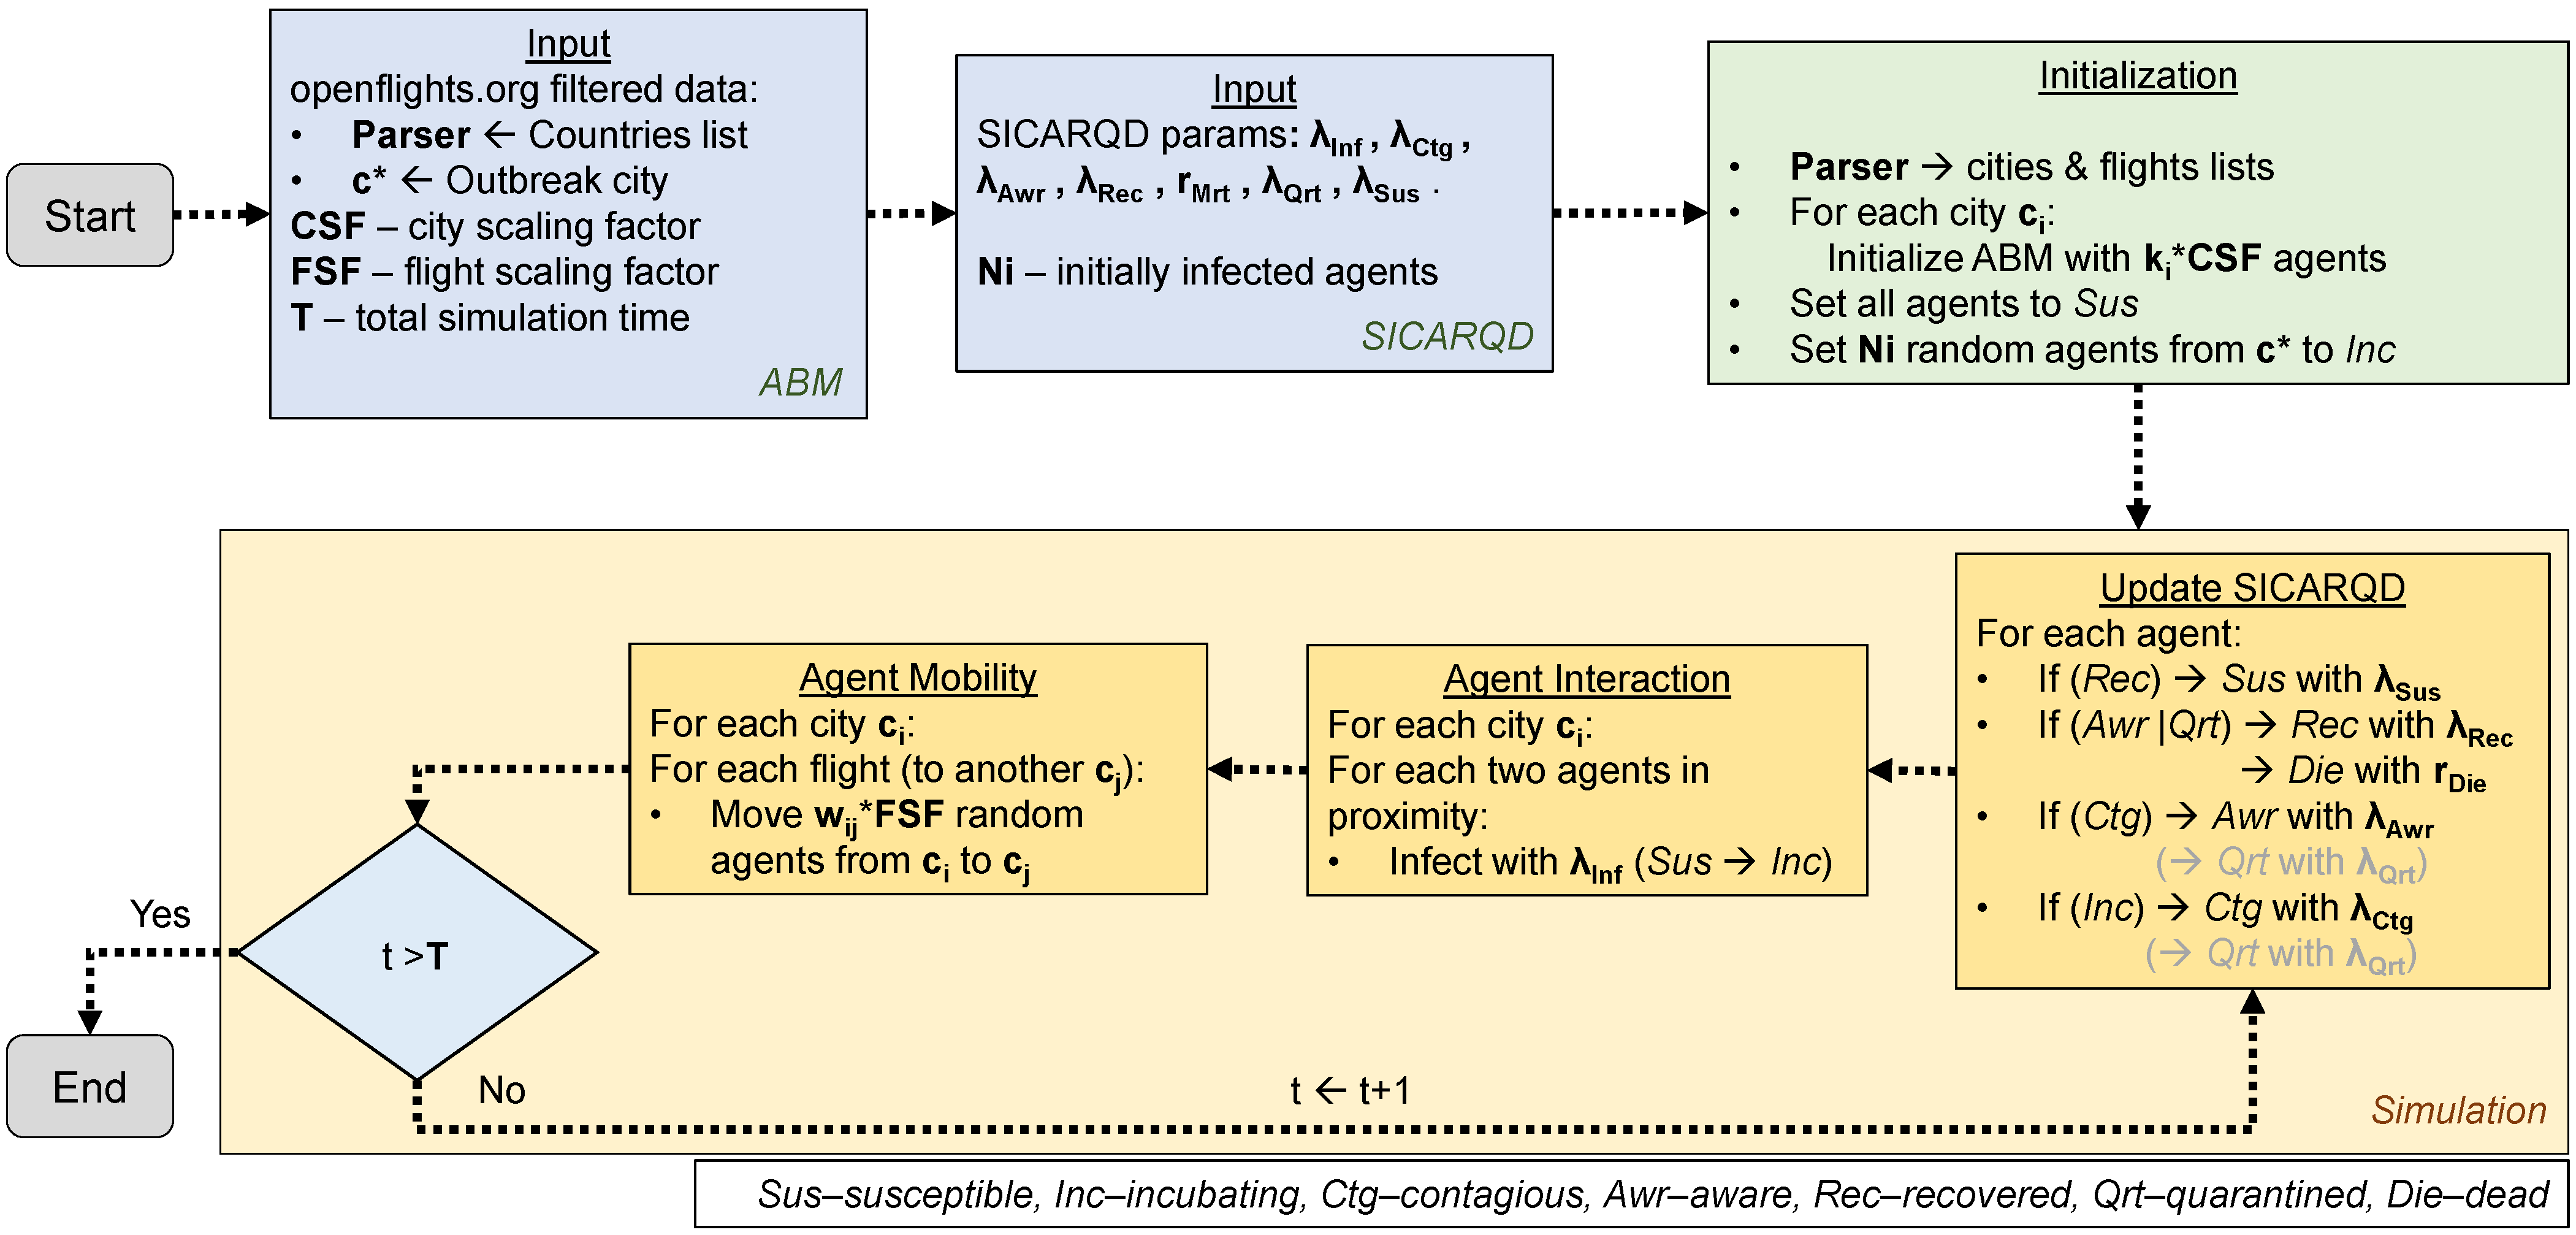
Based on the modeling and simulation terminology introduced, we provide a diagram of the meta-ABM setup and the simulation steps.
Figure 4 suggests that the initial input parameters are configured for the meta-ABM as well as the SICARQD epidemic framework. Subsequently, the meta-ABM undergoes initialization, encompassing all cities (based on the provided countries list) and connecting edges (flights). Each city
is created as an ABM consisting of
agents, all designated as susceptible
, except a specified number
of randomly selected agents from an outbreak city
, which were set to initiate infectious spread. During the simulation phase, a sequence of three steps is repeatedly executed while the simulation time
t does not exceed
T: (i) the infection status of each individual is updated, (ii) agents within each city interact and transmit the infection if they are in proximity, and (iii) several
random agents are selected to travel along each edge, from a city
to another adjacent city
. The cases where agents may become quarantined
are grayed out in
Figure 4 (panel “Update SICARQD”) because quarantine is not enabled in our simulation setup, as previously explained.
Finally, we synthesize this section under a mathematical formulation of the meta-ABM in
Appendix A, which describes how the restriction policies are applied and how each simulation iteration is executed.
3. Results
In what follows, we discuss the results of the simulations in relation to the experimental framework depicted in
Figure 4. These results are based on the meta-ABM input variables described in
Table 2 and the epidemiological parameters specified in
Table 1.
Therefore, we perform several discrete event computer simulations in which a single model parameter is modified in each iteration: (i) the agent population
P in the model (based on the seven population systems introduced in
Table 3, (ii) the travel restriction policy (implicitly the parameters
and
), and the total simulation time
T. In terms of restriction policies, for the
no restrictions policy, we do not apply any reduction of flight frequencies (i.e.,
); for the
reduce flight frequencies policy, we alternate
(according to
Table 2); for the
limit maximum flight distance policy, we alternate the threshold
{500, 1000, 2000, 5000, 10,000} km (according to
Table 2); for the
hybrid restrictions policy, we alternate both restriction parameters as follows,
, respectively
{2000, 5000, 10,000} km.
To maintain statistical validity, all experimental results are reported as the mean values derived from 10 repeated simulations, except 5 repetitions for 1366 K, in consistent settings. In total, we performed 7 (population systems) (restriction ratios for the four policies) (iterations, multiplied by 5 for 1366 K) experiments, representing 168 distinct simulation scenarios. Hence, we will concentrate more on comparative graphical representations of the numerical simulations, rather than providing very large tables of results.
All experiments were conducted on an Intel Core i7-9700 server (8 cores, 3–4.7 GHz), producing the following average runtimes per simulation for the larger population systems: 2 h 15 min for 328 K, 5 h 45 min for 648 K, and 12 h 30 min for 1366 K. Therefore, we limited the number of experimental repetitions to 10 for each setting, and only 5 repetitions for 1366 K. The entire suite of results was gathered in slightly more than one month of near-constant execution.
3.1. Impact of Agent Population on the Epidemic Outbreak
We start by addressing the first research question enumerated in the Introduction section (see page 2), namely, given that all other simulation parameters are kept fixed, how does an increasing population affect the total infected ratio , the peak infected ratio , and the mortality ratio .
In
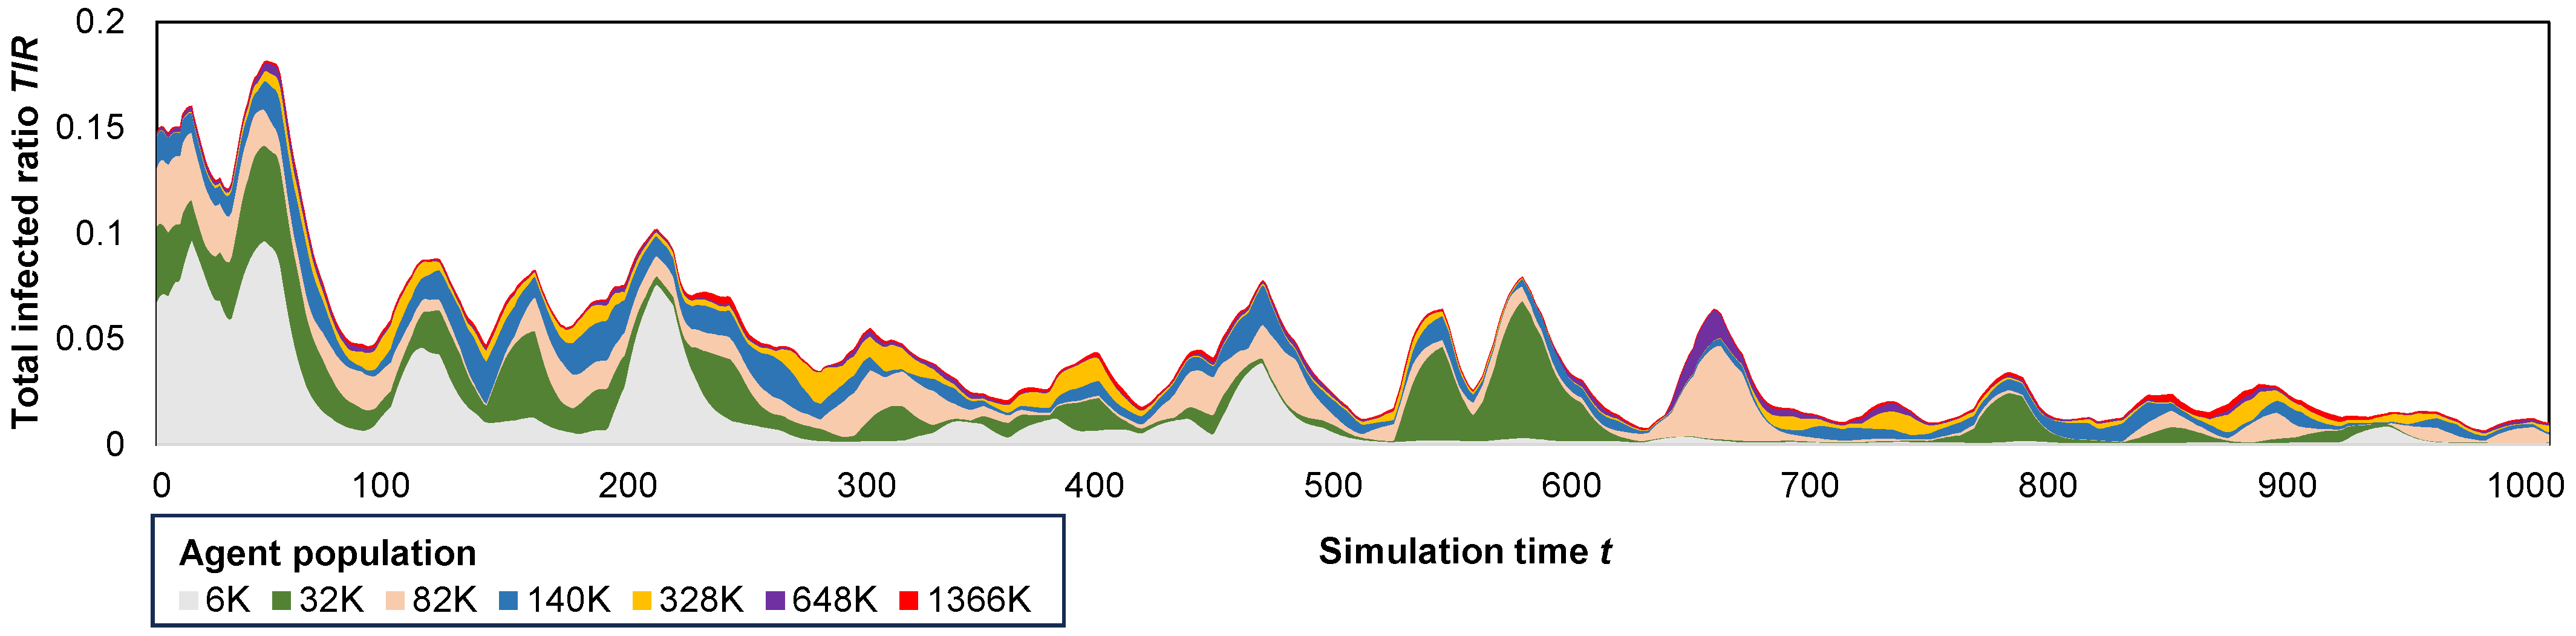
Figure 5, we underline the influence of the total agent population
P on the overall dynamics of an epidemic. Although the epidemic runs for the total duration of
iterations, we chose to zoom in and present the first snippet of 1000 iterations for better visualization.
Smaller population systems (6 K–82 K) are observed to lead to more pronounced epidemic waves ( = 5–10%) but shorter-lived outbreaks, typically lasting less than 600 days. In contrast, larger population systems (328 K–1366 K) result in less frequent waves, substantially smaller in magnitude (), yet with longer-lasting outbreaks exceeding 1000 days. A plausible explanation is that smaller population systems, being more interconnected, exhibit a higher sensitivity to the initial outbreak, developing faster herd immunity, even though they have higher fatality rates.
Additionally, in
Figure 6 we observe that larger population systems result in smaller relative epidemic sizes, as indicated by
. For instance, in the smaller 6 K–32 K models, more than 7% of the agents become infected per year (corresponding to 96% during the entire simulation period), while in the larger 648 K–1366 K models, only 1–2%/yr (14–28% total) of the agents are affected. Regarding the COVID-19 pandemic, the average total infected ratio
achieved in the largest population is consistent with the real data, particularly compared to the WHO data reporting 9.6% [
52]. With an increase in the agent population, it may be possible to attain even closer results with real-world data.
Next, in
Table 4, we summarize the parameters of the epidemic dynamics (
) for each population in two scenarios, when the
no restrictions policy is applied, respectively, when the number of flights is reduced to 50% (
). With the
reduce flight frequencies policy,
is reduced to ≈48–62% compared to the
no restrictions policy; the mortality ratio
is also reduced to ≈49–63% for larger populations (≥328 K).
3.2. Impact of Simulation Time on the Epidemic Dynamics
Next, we address the question of how different simulation timeframes affect the measured epidemic dynamics. To this end, we performed repeated simulations in the 328 K population system, using the no restrictions policy, where we set the total simulation time to T = {500, 1000, 1500, 2000, 2500, 3000, 3500, 4000, 4500, 5000} iterations. These values correspond to a real time of 1.4 to 13.7 years (obtained by dividing each T by 365).
Table 5 shows how each epidemic output parameter scales with simulation time
T. As expected, the longer a simulation runs, the higher the total infected ratio becomes as more infections occur. Similarly, for the mortality ratio and epidemic waves, which we measure manually. The peak infected ratio
does not scale proportionally with a longer simulation time, as it represents a maximum value over the entire simulation period.
Given the observation that the output parameters scale with
T, we chose to convert them to their normalized, or yearly averages. For this, we provide in the last three columns of
Table 5 the corresponding yearly percentages (%), and in our study, we will also use the yearly values for
and
, and the absolute value for
.
Figure 7 highlights the importance of running simulations for enough time until the measured parameters converge. In other words, if the simulation time is too short, we would obtain higher values for our epidemic parameters; if the simulation time is too long, we waste computational time. Specifically, in all situations in
Figure 7a–c, the yearly parameter values of
,
, respectively, as well as
waves, decrease linearly and converge after
3500–4000 total iterations.
The convergent total infected ratio is
%/year, the mortality ratio is
%/year, and the yearly number of waves is
/year. Based on these values, we also infer the infection fatality rate
, which is lower than the real case fatality rate
measured for COVID-19 in 2020 [
53]. However, the simulation-based IFR measured here may not be compared to the real COVID-19 data since the exact quantity of infectious cases remains unknown, and we utilize the
as a substitute. Given that confirmed case counts under-represent the real-world number of infectious cases, the estimated
is expected to be lower, but within the same order of magnitude as the simulation-based
.
In conclusion, we further rely on a total simulation time of iterations for all subsequent simulations, as it ensures the convergence of all measured parameters. In addition, we will use the normalized yearly values for each parameter that scales with T.
3.3. Impact of Travel Restriction Policies
We further address the second and third research questions, namely, how do different travel restrictions between cities affect the resurgence of an outbreak, and which restriction policy may be the most effective in limiting the reach and intensity of the outbreak.
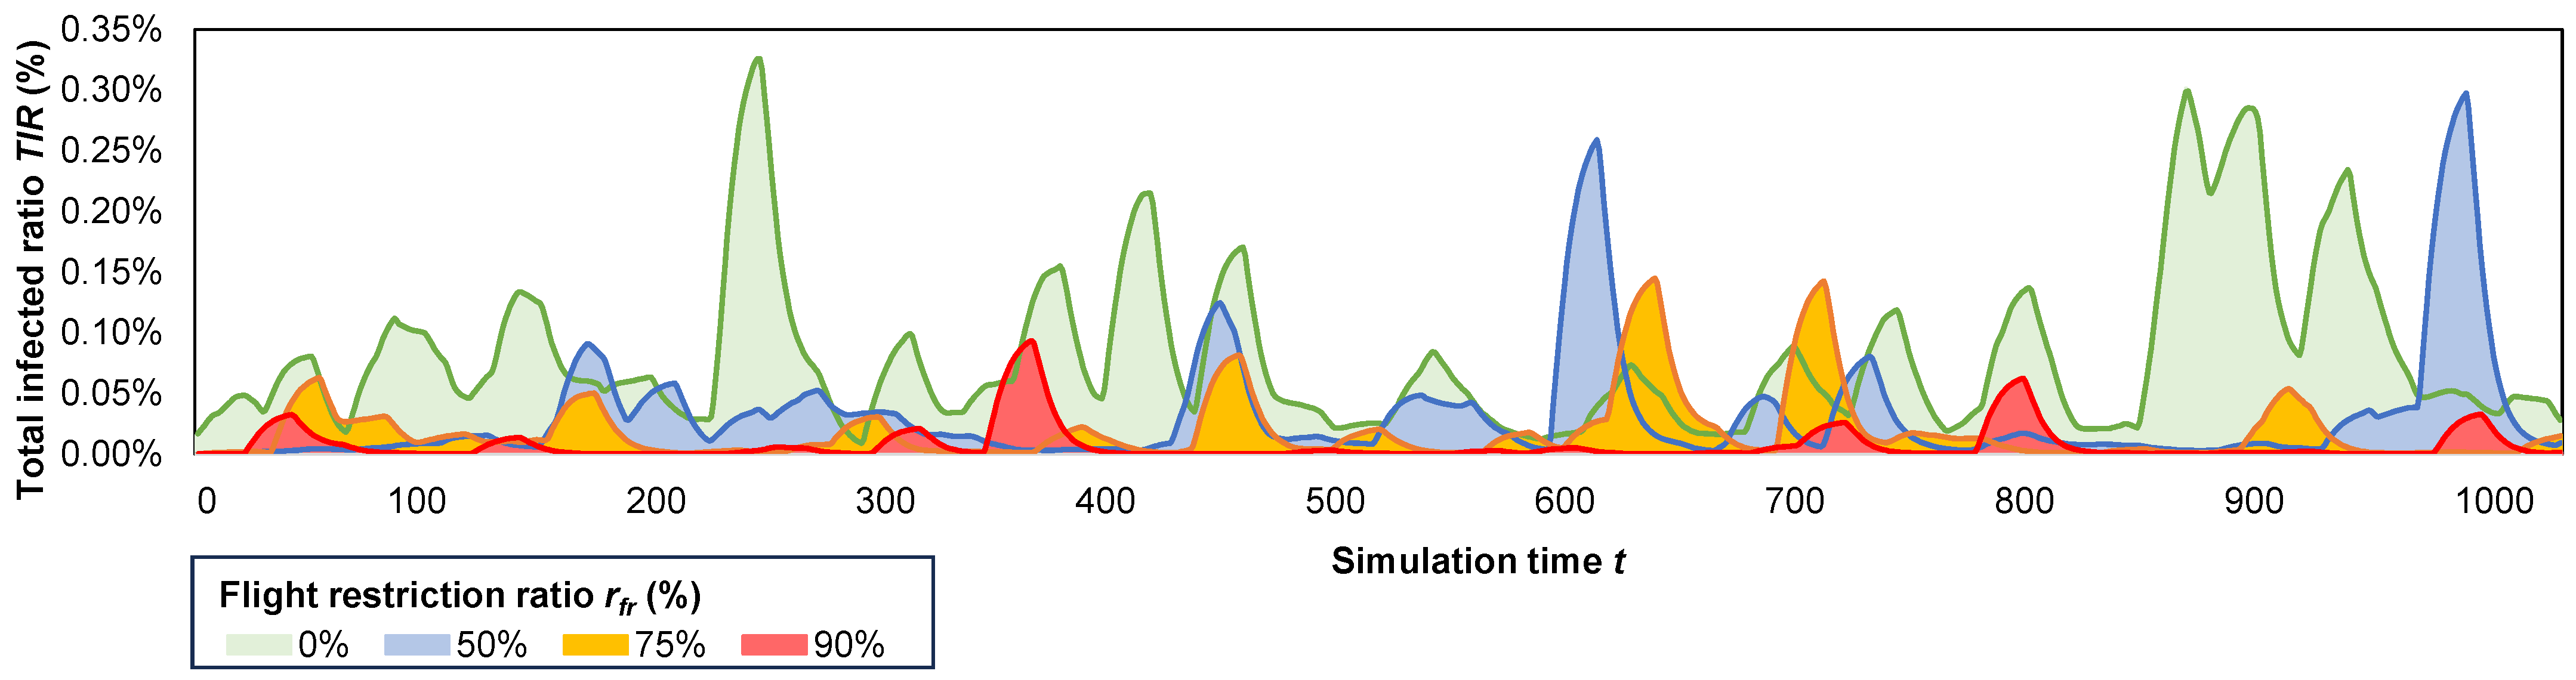
Therefore, in terms of epidemic resurgence, we present a visualization of several overlapping epidemic outbreaks, as depicted in
Figure 8, under the
reduce flight frequencies policy. In this context, we illustrate, using the largest population system (1366 K), our model’s ability to replicate resurgent epidemic waves. Notably, our meta-ABM model distinguishes itself from most
flattening the curve solutions [
4,
18], as it recreates the highest epidemic waves later in the simulation, rather than solely reproducing an initial major wave.
In
Figure 8, we observe the highest number of waves (
), and maximum wave amplitude (
%) when no flights are restricted (
, green epidemic). Conversely, the simulated epidemic is considerably less intense when 90% of flights are restricted (red epidemic), generating only seven smaller waves with
. Increasing the number of restricted flights (from 0% to 90%) results in a decrease in the total infected ratio from 14.2% to 8.8%, 4.2%, and 2.7%, respectively (yearly ratios: 1%, 0.64%, 0.31%, 0.25%); a reduction in the peak infected ratio from 0.45% to 0.33%, 0.31% and 0.23%, respectively; and a decrease in the mortality ratio from 0.48% to 0.30%, 0.14% and 0.09%, respectively.
Next, in
Table 6, we conduct a comparison between the two restriction policies (based on
and
) in terms of the measured
. It is evident that, across all restriction policies (where at least 25% of flights are restricted), the policy based on
proves to be more effective in maintaining a lower
. The percentage reductions in
, compared to the
no restrictions policy, are presented in columns four and five, while the reduction ratio between
and
is provided in the last column of
Table 6. As a result, we observe reductions in
of up to
times higher when the
reduce flight frequencies policy is applied, compared to the
limit maximum flight distance policy.
Next, we examine the efficacy of a hybrid restriction policy formed by combining the two aforementioned policies.
Table 7 presents the measurements for the total infected ratio
(%) resulting from the combination of
= 0.25–0.75 and
= 2000–10,000 km. When compared to the
no restrictions policy, we observe that the reduction in flight frequency (through
) proves more effective in reducing
compared to restricting the maximum flight distance (through
).
We analyze the effectiveness of the two policies, in lines 5 and 7 in
Table 7, i.e., 75%–10,000 km and 50%–5000 km. The second hybrid policy yields a
higher by 14–26%. The key distinction between the two policies lies in the fact that the first policy allows longer distance flights (within 10,000 km) and is also more effective in reducing
, at the cost of fewer flights per day. Similarly, we analyze the hybrid policies on lines 9 and 11, 75%–5000 km, respectively, 50%–2000 km. The second policy produces a higher
by 25–46%. Once again, the distinction between the two policies lies in the fact that the first allows most medium-haul flights (within 5000 km), while also proving more effective in reducing
.
If an
ideal hybrid restriction policy were devised, it would maximize the flight range but reduce the flight frequency. Taking into account the global context, governments could consider adopting the 67/75%–10,000 km policies (lines 4/5 in
Table 7) for a moderately severe pandemic or the 67/75%–5000 km policies (lines 8/9) for a more severe pandemic. The former policy has the potential to decrease the total infected ratio by approximately 17–47% compared to the unrestricted scenario. Adopting the latter, stricter policy can result in a reduction in the total infected ratio by approximately 34–52% compared to the
no restrictions policy.
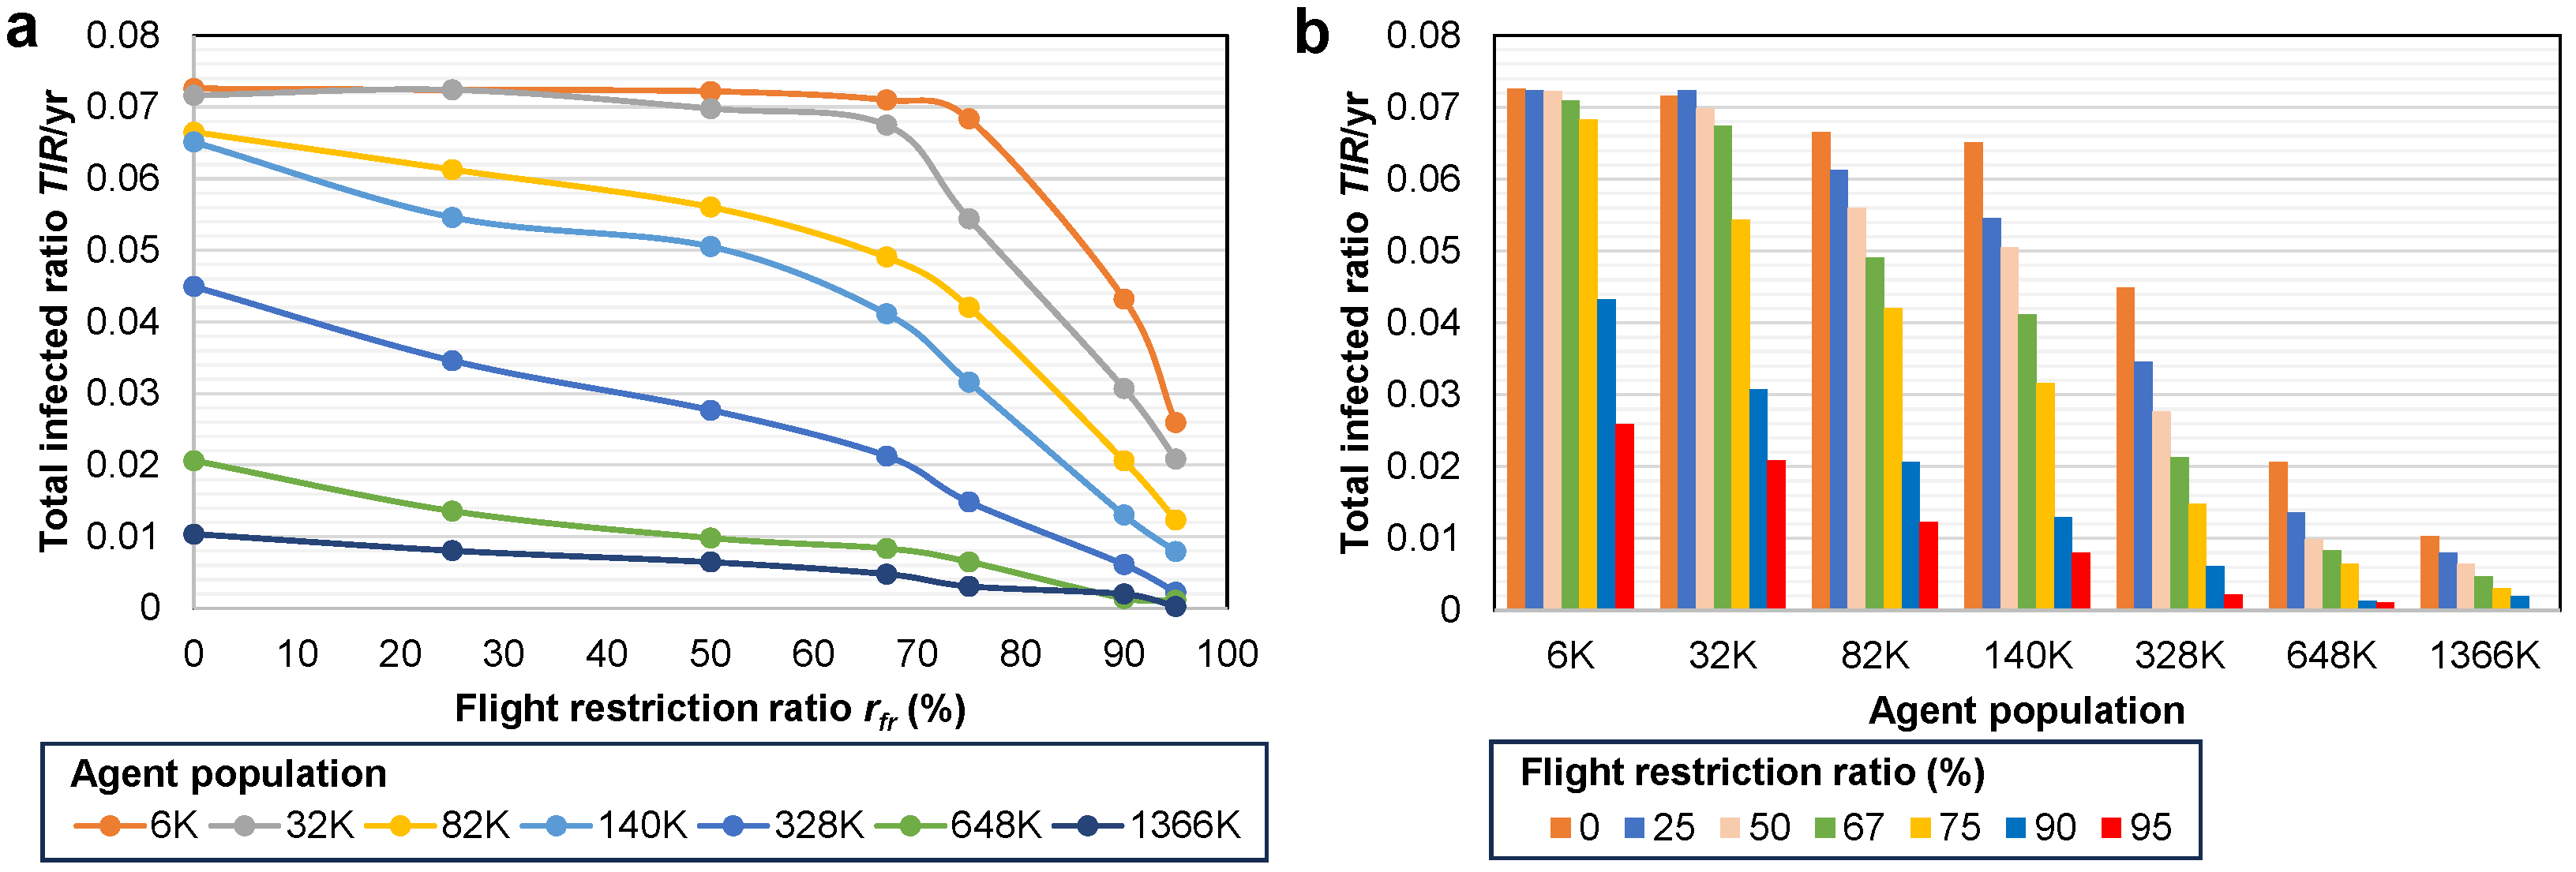
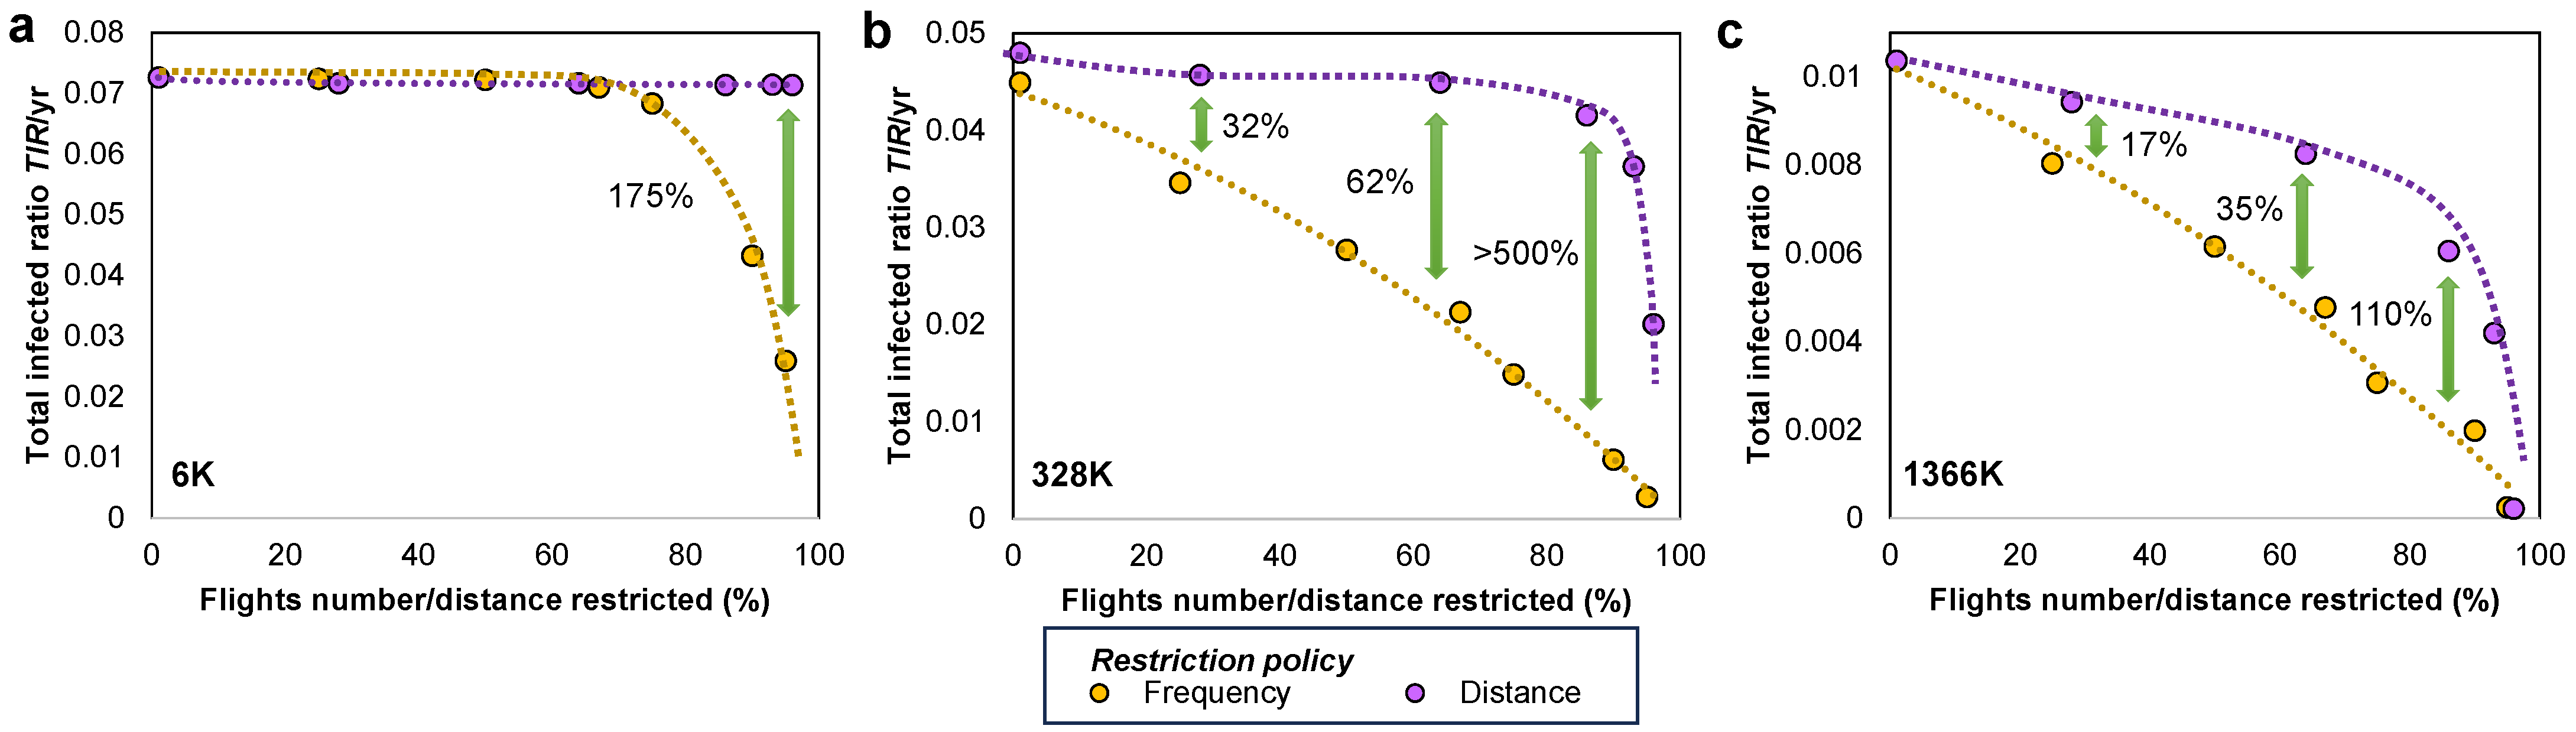
Finally, we conduct a comparative analysis of the efficacy of the two proposed restriction policies in mitigating an epidemic outbreak. To achieve this, we overlay the results for the two ratios (
and
) on the X-axis of
Figure 9, representing the percentage of restricted flights. In the case of the flight restriction ratio
, the number of restricted flights is directly calculated as
%. For the maximum distance threshold
, the number of restricted flights is measured through simulation. By overlapping the two sets of X-axis points for the two restriction policies, we can observe the downward trend of the total infected ratio
in
Figure 9.
We added the smallest (6 K) and largest (1366 K) population systems in
Figure 9 to show the change in effectiveness between the two restriction policies. Namely, for smaller populations, the
limit maximum flight distance policy reduces
insignificantly, regardless of the distance threshold
. Similarly, the
reduce flight frequencies policy manages to reduce
only after more than 75% of flights have been canceled. However, the results on the 6K population hold mostly theoretical value, since in real settings, systems can hardly be confined to such small populations. When moving to larger networks, such as 1366 K, we notice that both restriction policies are effective in reducing
, but the frequency-based policy (
) is more effective.
The limit maximum flight distance policy determines only a slow linear reduction in up to an 80% reduction in flights; the reduction in becomes significant only after more than 80% of flights are canceled. Nevertheless, in practical terms, this policy would become very restrictive and have socioeconomic drawbacks.
The reduce flight frequencies policy determines a much faster, linear, proportional decrease of with increasing . The reductions in are 17–110% higher (i.e., better) compared to the other distance-based policy (in the largest population). In practical terms, this policy could prove much less restrictive and have little socioeconomic impact.
4. Discussion and Conclusions
Agent-based modeling (ABM) has been shown to be a robust tool in computational epidemiology for the understanding and control of infectious outbreaks [
17,
18]. In contrast to comparable methods such as compartmental models or complex network-based approaches, ABM has the ability to consider the stochastic aspects of human behavior and mobility. This capability allows ABM to generate computer-based simulations that are highly realistic, particularly in densely populated environments [
12,
13,
14,
41].
This research presents a meta-agent-based model (meta-ABM) that leverages data from the global airline complex network to establish a configurable framework for monitoring epidemic dynamics. The scientific novelty lies in modeling a network of distributed epidemic systems, represented by independent agent-based models, which are interconnected via agent mobility resulting from data on global flights. Moreover, we incorporated the SICARQD epidemic model [
40], for each airport node to produce complex infectious dynamics in populated agent systems. The resulting meta-ABM allows us to study the impact of travel restrictions applied to the global airline network. These restriction policies specifically target the limitation of flight frequency (based on the
ratio), the restriction of the maximum flight distance (based on the
threshold), or a hybrid combination of both (based on both parameters). We quantify simulations based on the measured total infected ratio
, peak infected ratio
, and the crude mortality ratio
.
In
Section 1, we outlined four research questions our study aims to answer. Thus, we used computer simulation to understand how the dynamics of an epidemic are impacted by the population of a system, the enforced restriction policies, and the simulation duration. We answer the four questions as follows.
- 1.
In terms of population size, we constructed several instances of our meta-ABM, with total populations ranging from 6 K to 1.36 M agents (see
Table 3). Supporting results on this topic can be found in
Section 3.1. We conclude that smaller population systems experience more pronounced epidemic waves (with a
5–10%) but shorter-lived outbreaks, typically lasting less than 600 days. Conversely, larger population systems exhibit less frequent waves, substantially smaller in magnitude (with a
%), yet the outbreaks last longer, over 1000 days, on average. Larger populations result in smaller relative epidemic sizes, as indicated by
. For example, in smaller populations, over 96% of agents become infected throughout the simulation, while in larger populations, only 14–28% become infected. The obtained
, achieved in the largest population, is of the same order of magnitude as the real data of the WHO reporting an incidence of 9.6% [
52].
- 2.
In terms of imposing travel restrictions on the global airlines network, we tested the following policies: no restrictions, reducing flight frequencies, limiting flight distances, and a hybrid between the latter two. Supporting results on this topic can be found in
Section 3.3. It becomes evident that the highest number of epidemic waves and the maximum wave amplitude occur when no flights are restricted. As the number of restricted flights increases from 0% to 90%, there is a corresponding decrease in
from 14.2% to 2.7%. In addition, there is a reduction in
from 0.45% to 0.23%, and a decrease in
from 0.48% to 0.09%. Overall, when flight reduction policies are enforced,
is reduced to ≈48–62% compared to without restrictions; the mortality ratio
is also reduced to ≈49–63% for larger populations.
- 3.
In terms of the most effective travel restriction, we provide supporting results in
Section 3.3. The policy based on flight frequency reduction (
) is found to be more effective in maintaining a lower
. Our study notes reductions in
of up to
times higher when the flight frequency is reduced, compared to limiting the maximum flight distance. An ideal hybrid restriction policy should aim to maximize the flight range but reduce the flight frequency. Specifically, we suggest the 75%–10,000 km policy for a moderately severe pandemic (
reduced by 17–47%), or the 75%–5000 km policy for a more severe pandemic (
reduced by 34–52%).
- 4.
In terms of the simulation time recommended to produce representative experimental results, we performed simulations using a total simulation time of
T = 500–5000 iterations (days). Supporting results on this topic can be found in
Section 3.2. As the simulation time increases, the
,
, and the number of epidemic waves also increase due to more infections occurring. However, the
does not scale proportionally with longer simulation times. It becomes constructive to normalize the output parameters with time and express them as yearly averages. Simulation time is crucial, as running simulations for too short a duration could yield higher values for epidemic parameters, while excessively long simulation times would lead to computational time being wasted. In particular, the values of the yearly parameters for
,
, and epidemic waves decrease linearly and converge after
3500–4000 total iterations.
A noteworthy contribution of this paper is the ability of our introduced meta-ABM to
qualitatively replicate epidemic waves, mirroring those observed in real COVID-19 datasets in terms of amplitude, frequency, and resurgence. In particular, our meta-ABM model distinguishes itself from many
flattening the curve-type solutions [
4,
7,
8,
18], since it recreates higher epidemic waves later in the simulation, rather than only reproducing an initial major wave.
One of the main conclusions of our analysis is that the distance-based restriction policy (based on ) exhibits a slow and insignificant decrease in up to an 80% reduction in flights, followed by a more abrupt decrease in after more than 80% of flights are canceled (i.e., km). On the contrary, the frequency-based policy () leads to a much faster, linear, proportional decrease in with increasing ; we consider this policy to be potentially less restrictive and to have a smaller socioeconomic impact. The reduction in is 17–110% higher compared to the distance-based policy.
Our findings regarding the superiority of flight frequency reduction over distance limitations contribute new granularity to the existing literature on mobility restrictions. Previous large-scale network analyses have largely focused on the binary removal of edges (i.e., complete flight bans) or the reduction of total mobility volume without distinguishing between the range and the repetition of travel. For example, recent agent-based studies have suggested that the frequency of return trips often drives epidemic speed more linearly than travel distance alone [
54]. Our results corroborate this by demonstrating that reducing flight frequency offers a more predictable, linear control over the total infected ratio (
), whereas distance-based restrictions only become effective at drastic thresholds (>80% cancellation) that sever global connectivity. This distinction is relevant; while Sun et al. [
55] noted that most countries reduced connectivity too late to prevent viral entry, our model suggests that a ‘capacity reduction’ strategy (frequency-based) could have been a more sustainable alternative to the ‘diversity reduction’ strategy (cutting long-haul links) often observed in policy responses. Also, Russel et al. concluded that stricter travel bans yield diminishing returns, especially where local transmission is already high [
56]; importantly, they advise that only countries with low incidence or near outbreak tipping points might benefit significantly from travel restrictions. This remark complements our work by highlighting when travel bans matter; our meta-agent model can simulate those low-incidence scenarios in which importations are critical. Like [
56], we find limited additional impact of travel bans in high-incidence settings, aligning with their quantitative analyses.
This study has various limitations, which are outlined below. First of all, we maintain the model at city-level granularity, rather than going deeper, e.g., at neighborhood-, street-, or household-level with various properties; instead, we aimed at creating a meta-network of ABMs at a global scale. One of our previous studies developed a network-based hierarchical population model [
29] that examined the impact of population granularity. Second, all cities are considered equal and differ only by agent population, based on the number of outgoing flights and the interconnecting flights. We kept this simplification to enable a global-scale network study. Third, we assume homogeneity among all agents, since they are not classified into any demographic, professional, cultural, or other distinct groups. However, the meta-ABM may be further enhanced to integrate a variety of personal characteristics, based on additional data. Fourth, we only model the cities having airports in the global population network and only connect cities via air traffic. In other words, we simplified the inter-city agent mobility to flights only; we do not use data on car/bus/train traffic, as it would prove very challenging to obtain such data for every city around the world. One of the advantages of modeling cities independently is the ability to simulate the ABMs in parallel on different processor threads, greatly improving execution times.
In conclusion, our observations are of immediate relevance in the current COVID-19 pandemic and potential applicability to prospective epidemics exhibiting comparable airborne transmission characteristics. Although we confirm the accuracy of our meta-ABM specifically for epidemic modeling, it also offers potential applications in the fields of social physics, political science, and environmental science. For example, we may study the effect of different quarantine, vaccination [
57], and immunization strategies for viral outbreaks [
58]. Similarly, our meta-ABM could be utilized to examine strategies associated with opinion insertion and competitive dynamics in social networks [
59,
60]. Also, our meta-ABM could be adapted to study polarization in overlapping communities of oscillating political preferences [
61,
62].
The main conclusion of our study and the key takeaway for public health policy is that our findings suggest that reducing flight frequency is more effective than limiting flight distances in controlling epidemic spread. Specifically, when limiting flight distances, a significant reduction in the infected ratio is observed only when more than 80% of flights are canceled, roughly equivalent to a maximum 2000 km flight range, resulting in a negative socioeconomic impact. Conversely, when reducing flight frequency, decreases faster and is linearly proportional to the reduction in flight frequency. This second policy may impose fewer constraints and result in a much lower socioeconomic burden.
We are confident that this research possesses considerable potential to influence computational epidemiology, public health, computer science, and mathematical modeling by tackling essential scientific and social issues [
1,
3]. Future research paths can incorporate a broadening of the scope of the meta-ABM to account for a more extensive global population. This could involve integrating additional sources of traffic information between urban areas, introducing various types of agents characterized by distinct needs-based mobility patterns, refining epidemic parameters to fit regional contexts and globally significant viral strains, and improving SICARQD to model the implementation of vaccination campaigns.