1. Introduction
Ride-hailing platforms connect passengers and drivers through mobile applications and have become an important component of urban mobility. As markets mature, customer retention and platform reputation increasingly depend on reliability, responsiveness, pricing, payment access, navigation, application performance, and the quality of interactions during a trip. Evidence from Vietnam and Pakistan confirms that perceived service quality is closely related to satisfaction and loyalty [
1,
2]. Recent studies also emphasize the importance of driving quality on digital platforms and the multidimensional character of customer-perceived ride-hailing service quality [
3,
4]. These relationships need not be identical across countries. Payment infrastructure, regulation, market maturity, local transport alternatives, and user expectations can cause the same feature to operate as a basic requirement in one market and a differentiator in another.
Questionnaire-based frameworks such as SERVQUAL provide structured measurement but require researchers to specify relevant service dimensions before data collection [
5]. Online reviews offer a complementary source because users describe emerging complaints and market-specific needs in their own language [
6]. Recent aspect-based analyses of e-hailing reviews and broader reviews of sentiment and topic modeling in transportation further demonstrate the value of user-generated text for service diagnosis [
7,
8]. Kano-oriented review analytics distinguish gains associated with positive performance from dissatisfaction caused by failure [
9,
10,
11], while importance-performance analysis translates attribute evidence into resource-allocation priorities [
12]. Neutral and weakly directional reviews may also contain useful requirement information [
13]. However, many review-based applications rely on sentiment ratios, means, or deterministic quadrants. Such rules do not quantify uncertainty and often compress positive, negative, and weakly directional evidence into one signed score.
The statistical structure creates three further problems. First, one-to-five-star ratings are ordered rather than interval-scaled, so linear regression can impose an unjustified equal distance between adjacent categories [
14,
15,
16]. Second, national sample sizes are highly unequal. Complete pooling can allow the largest market to dominate, whereas independent country estimates can be unstable for sparse attributes. Random-effects synthesis provides a middle ground by combining comparable country estimates while retaining heterogeneity [
17,
18]. Third, several attributes occur in only two or three countries. Their heterogeneity parameters are weakly identified, which makes regularization and explicit prior sensitivity essential [
19]. Global-local shrinkage priors such as the horseshoe are valuable in genuinely high-dimensional sparse regressions [
20,
21]; the present second stage is instead low-dimensional and attribute-specific, so regularization is placed directly on each heterogeneity scale.
The proportional-odds model is not the only possible ordinal-response specification. Latent-variable formulations provide a general basis for Bayesian ordinal analysis [
22], while Bayesian nonparametric ordinal regression [
23], ordered-probit Bayesian additive regression trees [
24], and adaptive polynomial-chaos expansions [
25] can represent nonlinearities and interactions. These approaches are useful benchmarks, but they target flexible prediction rather than the low-dimensional, country-comparable intensity contrasts required by the present second stage. The empirical analysis therefore tests linearity with matched spline competitors instead of claiming that a linear link is the only adequate ordinal model.
Three-component evidence representations are related algebraically to intuitionistic fuzzy membership, non-membership, and residual mass [
26,
27,
28]. In the present data, however, the components are reconstructed deterministically from signed topic scores rather than obtained as calibrated fuzzy memberships from a language model. The residual component therefore cannot be interpreted as a probability of neutrality, hesitation, mixed sentiment, or epistemic uncertainty. Its defensible role is to reveal an occurrence-intensity reparameterization: whether an attribute is recorded is separated from how strongly positive or negative the score is. This distinction also exposes a testable restriction in the earlier shared-baseline model: weak positive and weak negative evidence need not have the same occurrence association.
This study therefore contributes an integrated analytical framework, not a wholly new fuzzy or Bayesian method. It combines (i) a piecewise-defined rank transformation, (ii) separate positive and negative occurrence baselines, (iii) country-specific cumulative-logit models, (iv) covariance-preserving bivariate Bayesian synthesis with an LKJ-regularized correlation structure [
29], and (v) posterior classification and intensity-based priorities with prevalence uncertainty. Model restrictions, nonlinear rank effects, raw-score scaling, complete pooling, proportional and partial proportional odds, mapping reclassification, sampling caps, time windows, and heterogeneity priors are evaluated explicitly; formal checks of the proportional-odds assumption follow established diagnostic principles [
30]. A multilingual semantic audit based on cross-lingual representations provides an additional check on topic-to-attribute mapping [
31]. A simulation study then examines bias, interval coverage, heterogeneity recovery, Kano-state accuracy, and ranking stability under small K, imbalance, sparse occurrence, and proportional-odds violations.
The empirical application uses DiDi reviews from Chile, Mexico, Japan, Australia, Russia, and China. These countries are the markets available in the supplied dataset and are not treated as a probability sample of global ride-hailing markets. The remainder of the paper presents the data and model, reports the empirical and simulation results, and discusses the implications and limitations of the integrated framework.
2. Materials and Methods
2.1. Data Source, Analytical Sample, and Attribute Mapping
The data consist of DiDi app reviews (version 8.0) obtained through Qimai Data and supplied as six country-specific workbooks. Available fields include review date, one-to-five-star rating, review title and text, and topic-specific signed sentiment scores. After exact within-country text deduplication, 85,373 unique reviews remained. To align temporal coverage, the primary analysis uses every review observed from 1 January 2019 through 31 December 2024, yielding 30,042 reviews. The complete all-period corpus is retained as a sensitivity analysis. This choice avoids treating an arbitrary 4000-review cap as the primary estimator and prevents differences in historical coverage from being hidden in a secondary check.
The supplied upstream workflow used language-specific normalization and topic extraction, and each topic was mapped to a harmonized service attribute from its keyword distribution and semantic content. The signed topic score equals positive sentiment probability minus negative sentiment probability. Variables computed from the observed rating, including standardized ratings, reliability weights, and rating-adjusted scores, are excluded to prevent outcome leakage. Its assignments were compared with the frozen codebook using percent agreement and nominal Cohen’s kappa, with a 10,000-resample topic-level bootstrap interval (see
Table 1).
Table 2 shows the full and common-window sample sizes. China remains the largest national sample, but it cannot determine the other countries’ rating thresholds because each country is modeled separately before cross-country synthesis.
The harmonized mapping is reproduced in
Table 3 so that every cross-country comparison can be traced to its national topic.
Appendix A reports the secondary semantic audit and the sensitivity analysis for its only disagreement. Competitive products, driver service attitude, and vehicle type occur in only one country and are reported as national evidence rather than included in the eight-attribute synthesis.
2.2. Piecewise Rank Evidence and Its Algebraic Interpretation
Let s
kij denote the signed score for attribute j in review i from country k. A zero score is treated operationally as no recorded signed evidence. This rule does not imply that every zero is a structural absence; it may also reflect near-neutral probabilities, rounding, or a topic that was not activated by the upstream pipeline. The occurrence indicator is
The rank intensity q is explicitly defined at zero and non-zero scores. For zero scores,
For non-zero scores, the magnitude is ranked within the same country-topic group:
Here N
+kj is the number of non-zero scores in the group, and ties receive their average rank. The transformation removes dependence on the original score scale without claiming that q is a calibrated sentiment probability. In prediction experiments, the empirical mapping is estimated on each training fold and applied to its held-out fold.
Equation (4) yields positive intensity, negative intensity, and residual rank mass. For z = 0, all three values equal zero. For z = 1, they satisfy
Equation (5) makes the model boundary explicit: the three-component representation contains no information beyond occurrence, direction, and rank intensity. It is an interpretable reparameterization that distinguishes whether evidence is recorded from how strongly positive or negative it is.
2.3. Country-Specific Ordinal Model and Baseline Restriction Test
Because ratings are ordinal, a separate cumulative-logit model is fitted in each country. Country-specific thresholds accommodate differences in rating conventions. For threshold m in {1,2,3,4},
A larger linear predictor shifts probability toward higher ratings. The selected linear predictor assigns distinct occurrence baselines to positive and negative evidence:
The coefficient θ
+kj is the incremental association of increasing positive rank intensity after positive occurrence is established. The coefficient θ
−kj is the corresponding negative-intensity association; a negative value represents rating damage. The earlier shared baseline is the nested restriction.
The restriction is tested against Equation (7) by summed likelihood-ratio and AIC comparisons. The linear-rank specification is also compared with raw maximum-normalized intensity, rank quartiles, and a three-degrees-of-freedom natural spline. The country coefficients and the full inverse-Hessian covariance matrix are retained. No standard-error floor is imposed.
2.4. Covariance-Preserving Bivariate Bayesian Synthesis
For an attribute observed in at least two countries, the positive and negative intensity contrasts are synthesized jointly. Let the two-element country estimate and its transformed inverse-Hessian covariance matrix be
Unlike two separate meta-analyses, Equation (9) retains the covariance generated by estimating both contrasts from the same country model. The random-effects stage is
The pooled mean
contains the positive and negative cross-country intensity contrasts. The heterogeneity scales receive half-normal priors with scale 1 in the primary analysis, and the correlation matrix receives an LKJ(2) prior [
29].
The half-normal scale of 1 is calibrated to the latent-logit scale: most prior mass lies below approximately two units, while larger heterogeneity remains possible. Sensitivity analyses use half-normal scales 0.25, 0.5, 2, and 4 and a half-t distribution with three degrees of freedom. For K = 2 or K = 3, the correlation and heterogeneity posteriors are expected to be prior-sensitive; they are therefore treated as descriptive rather than stable population quantities.
2.5. Posterior States and Intensity-Based Priority Indices
For consistent interpretation, the negative cross-country contrast is sign-reversed. Reward and penalty strengths are
Directional support is evaluated from the joint posterior at the prespecified 0.95 cutoff:
Table 4 translates the two posterior probabilities into reproducible Kano-style states.
Country-level positive and negative prevalences receive Jeffreys Beta posteriors and are averaged equally across contributing countries:
Equation (16) is evaluated draw by draw, so its intervals include both coefficient and prevalence uncertainty. The indices are not probabilities and are not restricted to [0, 1]. They summarize direction-specific intensity priorities, not the total counterfactual contribution of an attribute. Rank-one and top-three probabilities are obtained from the same posterior draws.
2.6. Validation, Sensitivity Analyses, and Simulation Design
Model validation separates the main restriction, transformation, and functional-form questions. First, Equation (8) is tested. Predictor transformation and functional form are then separated in a matched 2 × 2 comparison: rank versus maximum-normalized raw intensity, each modeled with either a linear term or a three-degrees-of-freedom natural spline while retaining separate positive and negative occurrence baselines. A grouped-percentile model is an additional sensitivity check. Predictive performance is evaluated using three repeats of stratified five-fold cross-validation, with the rank mapping fitted only on each training fold. Second, a complete-pooling proportional-odds model with country-fixed effects is compared with the sum of country-specific likelihoods. Third, Brant tests formally assess proportional odds; numerical failures caused by sparse threshold cells are reported rather than treated as evidence for the assumption.
A targeted partial proportional-odds robustness analysis then relaxes only intensity terms with a within-country Benjamini–Hochberg-adjusted Brant p-value below 0.05. The selected terms enter the nominal component of the cumulative-logit model while all remaining effects retain common slopes. Perfectly separated nuisance terms are removed identically from both members of a country comparison; this affects the China subsidy-positive occurrence and intensity pair, neither of which is selected for relaxation. Proportional and partial proportional-odds specifications are compared by likelihood-ratio test, AIC, three-repeat five-fold validation, and the average change in expected rating when an active intensity moves from its first to third quartile.
Sampling sensitivity is evaluated with 100 independently seeded, rating-stratified replications of the 4000-review country cap. The complete all-period corpus is compared with the common-window primary sample. Prior sensitivity covers five half-normal scales and a half-t prior. The standard error audit reports the number of first-stage contrasts that would have been changed by the former 0.05 floor.
The simulation study crosses four true directional states with six data conditions: balanced K = 6, imbalanced K = 6, K = 3, K = 2, sparse occurrence, and a moderate proportional-odds violation implemented through an intensity-dependent latent-logistic scale. Each state-condition combination uses 50 individual-level replications, giving 200 replications per condition. The true heterogeneity scale is 0.5. A separate eight-attribute experiment uses 300 replications per condition to evaluate IRI and IDI rank correlations and top-three recovery. Outcomes include bias, RMSE, 95% interval coverage, heterogeneity bias, state accuracy, and ranking stability.
3. Results
3.1. Model-Restriction and Functional-Form Comparisons
The shared occurrence-baseline restriction is rejected. Across the six country models, separating positive and negative baselines improves the summed log likelihood from −16,056.9 to −15,935.9. The likelihood-ratio statistic is 241.9 with 31 degrees of freedom and summed AIC declines from 32,347.7 to 32,167.8. The importance of this change is also numerical: under a shared baseline, all 613 positive China-subsidy observations in the common window have five-star ratings, producing complete separation and an unstable intensity estimate. The separate positive occurrence baseline absorbs this level shift, leaving the subsidy intensity contrast finite but highly uncertain.
Table 5 separates predictor transformation from functional form. With a linear effect, raw intensity has slightly higher cross-validated QWK than rank intensity, identical MAE to three decimals, and a 66.8-point higher AIC. With a natural spline, rank intensity outperforms raw intensity in AIC, QWK, and MAE. The rank spline has the lowest AIC and highest QWK, but it uses 124 more parameters than the linear-rank model and has slightly worse MAE and accuracy. Thus, neither transformation nor linearity is uniformly superior across predictive criteria. The linear-rank model remains the inferential specification because it yields one comparable reward and one comparable penalty contrast per country; the spline models are retained as functional-form checks, not treated as evidence that the three-component representation is uniquely necessary.
A complete-pooling model with country-fixed effects has a summed AIC of 37,164.7, compared with 32,167.8 for the country-specific likelihoods. This large likelihood loss indicates that common slopes and nearly common threshold shifts are inadequate. The two-stage approach retains the better-fitting national ordinal structures and pools only the comparable intensity contrasts.
Country-specific repeated-validation diagnostics are reported in
Appendix A,
Table A1. Russia has high accuracy (0.829) but near-zero QWK (0.015), confirming that predictions largely reproduce its dominant one-star category rather than recover ordinal separation. Australia and China show the strongest ordinal agreement, whereas Japan has the largest MAE. These differences motivate reporting country-level diagnostics rather than relying only on a six-country average.
3.2. Formal Proportional-Odds Diagnostics
Formal tests in
Table 6 reject proportional odds for the four countries with numerically valid omnibus statistics. Chile and Australia produce invalid negative omnibus chi-square values because some threshold-specific sparse cells make the Brant covariance approximation unstable; these are reported as failures, not as non-rejections. After Benjamini–Hochberg adjustment, 9 of 57 estimable intensity terms violate the common-slope restriction, concentrated in China and Japan. The country coefficients should therefore be interpreted as average latent-logit associations. The simulation study quantifies the resulting loss in state accuracy under moderate violations.
The targeted partial proportional-odds results are reported in
Appendix A,
Table A2. Six negative-intensity terms are relaxed in China and three intensity terms in Japan. Relative to matched proportional-odds comparators, the partial models improve AIC by 314.7 points in China and 134.7 points in Japan. These in-sample gains do not translate into material repeated-validation gains: China QWK is 0.909 under both models, and Japan QWK is 0.543 under both after rounding. Accuracy and MAE are likewise nearly unchanged. For every one of the nine relaxed terms, the average expected-rating shift from the first to third active-intensity quartile has the same direction under the proportional and partial models. The scalar proportional-odds contrasts are therefore retained for cross-country synthesis as average associations, while threshold constancy is not claimed.
3.3. Joint Cross-Country Effects and Posterior States
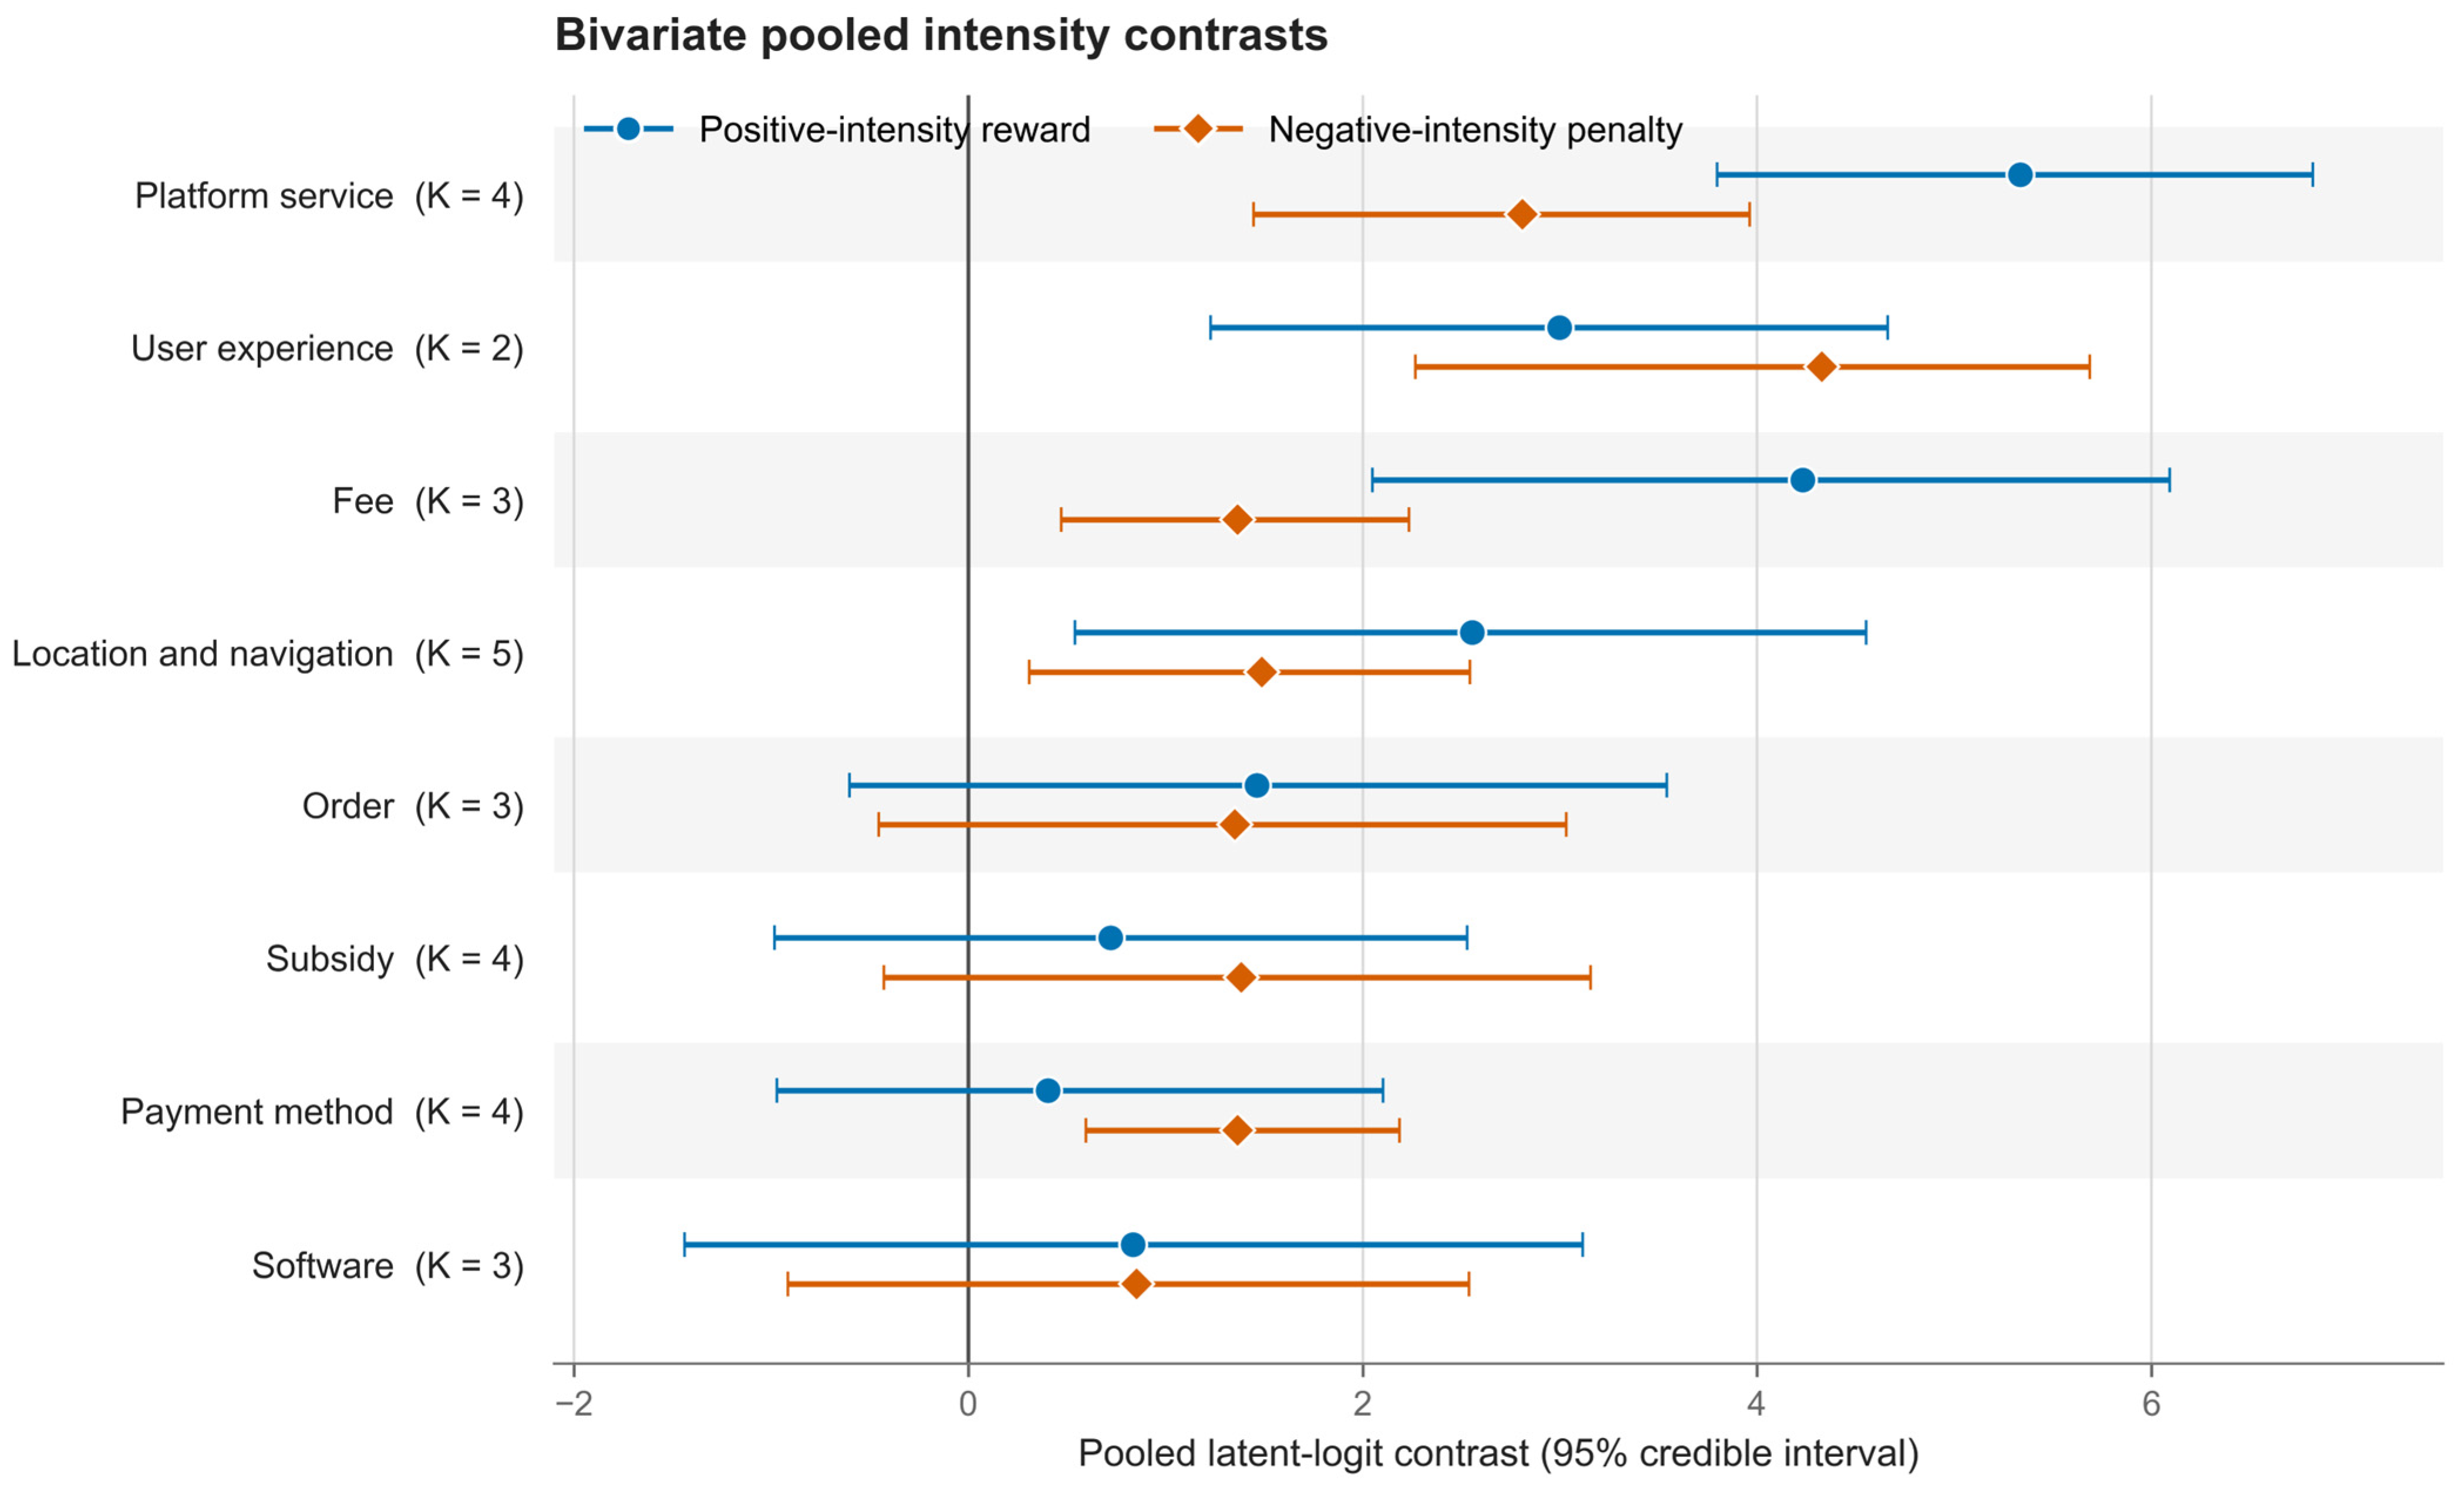
Table 7 reports the joint bivariate posterior. Platform service and fee show clear two-sided associations. Location and navigation is also one-dimensional but has wider heterogeneity. User experience has strong reward and penalty support, although only Australia and China contribute. Payment method is must-be: penalty support is 99.6%, whereas reward support is only 70.3%. Order, software, and subsidy do not meet either two-sided or one-sided 0.95 rules and are classified as mixed or uncertain. This changes the earlier subsidy conclusion and is a direct consequence of testing the shared-baseline restriction rather than assuming it.
The secondary semantic audit agrees with the frozen mapping for 30 of 31 topics. The only disagreement concerns Russia Topic1: its price, tariff, amount, cost, and charge keywords support Fee rather than Competitive products. Reassigning this topic increases the fee synthesis from three to four countries. The fee reward decreases from 4.232 [2.050, 6.092] to 2.660 [0.429, 4.777], and the penalty decreases from 1.366 [0.471, 2.235] to 1.027 [0.238, 1.831], but both directional probabilities remain 98.9%, and the one-dimensional state is unchanged (
Appendix A,
Table A4). The classification is therefore robust, whereas exact priority magnitudes remain conditional on the mapping.
The prevalence-adjusted intensity priorities in
Table 8 answer different questions from the directional states. Platform service is the leading risk priority, with a 90.8% rank-one and 98.4% top-three probability. Fee, payment method, and order form a close second risk tier rather than a defensible, fixed ordering. User experience has the largest differentiation potential, with an 87.0% rank-one probability, followed by platform service. Its interpretation remains limited to Australia and China. Payment method combines must-be classification with the lowest IDI, illustrating why preventing failure and investing for differentiation are distinct decisions.
Table 9 summarizes between-country heterogeneity and reward-penalty dependence. Location and navigation and software have the largest reward-side heterogeneity, while subsidy has the largest penalty-side heterogeneity. Every correlation interval includes zero, and the intervals are especially broad for K = 2 or K = 3. The bivariate model is still important because it propagates the within-country covariance, but the random-effect correlation itself is not treated as a stable substantive finding.
Figure 1 displays the pooled intensity contrasts underlying
Table 7,
Table 8 and
Table 9. The dispersion of the national estimates makes clear why pooled means should be accompanied by heterogeneity and coverage information.
3.4. Prior, Standard-Error, Sampling, and Temporal Sensitivity
Table 10 confirms that sparse-K classifications depend on heterogeneity regularization. The half-normal scale 2 and half-t(3,1) specifications retain all primary states, whereas the very tight scales alter order, software, and subsidy, and the very wide scale alters user experience, fee, and location and navigation. Stable interpretation is therefore strongest for platform service and payment method; K = 2 or K = 3 attributes remain explicitly prior-sensitive.
The standard-error audit found that none of the 62 directional contrasts had an estimated standard error below 0.05; the minimum was 0.20. The former floor therefore had no legitimate role in the selected model and has been removed rather than defended. In 100 repeated 4000-review capped samples, all eight states matched the full-window analysis in 94% of replications; the mean agreement was 7.92 of 8. Individual state stability ranged from 96% to 100%. Median rank correlations were 0.976 for IRI and 0.833 for IDI, showing that differentiation ranks are more sampling-sensitive than failure-prevention ranks.
Using all 85,373 reviews from the complete observation periods preserves all eight states. The largest absolute pooled-effect change is 0.616. Posterior-mean priority ranks have Spearman correlations of approximately 0.905 for IRI and 0.881 for IDI relative to the common-window analysis. Thus, the principal states and leading priorities persist, but intermediate rankings remain temporally sensitive and should not be presented as fixed global positions.
3.5. Simulation Results
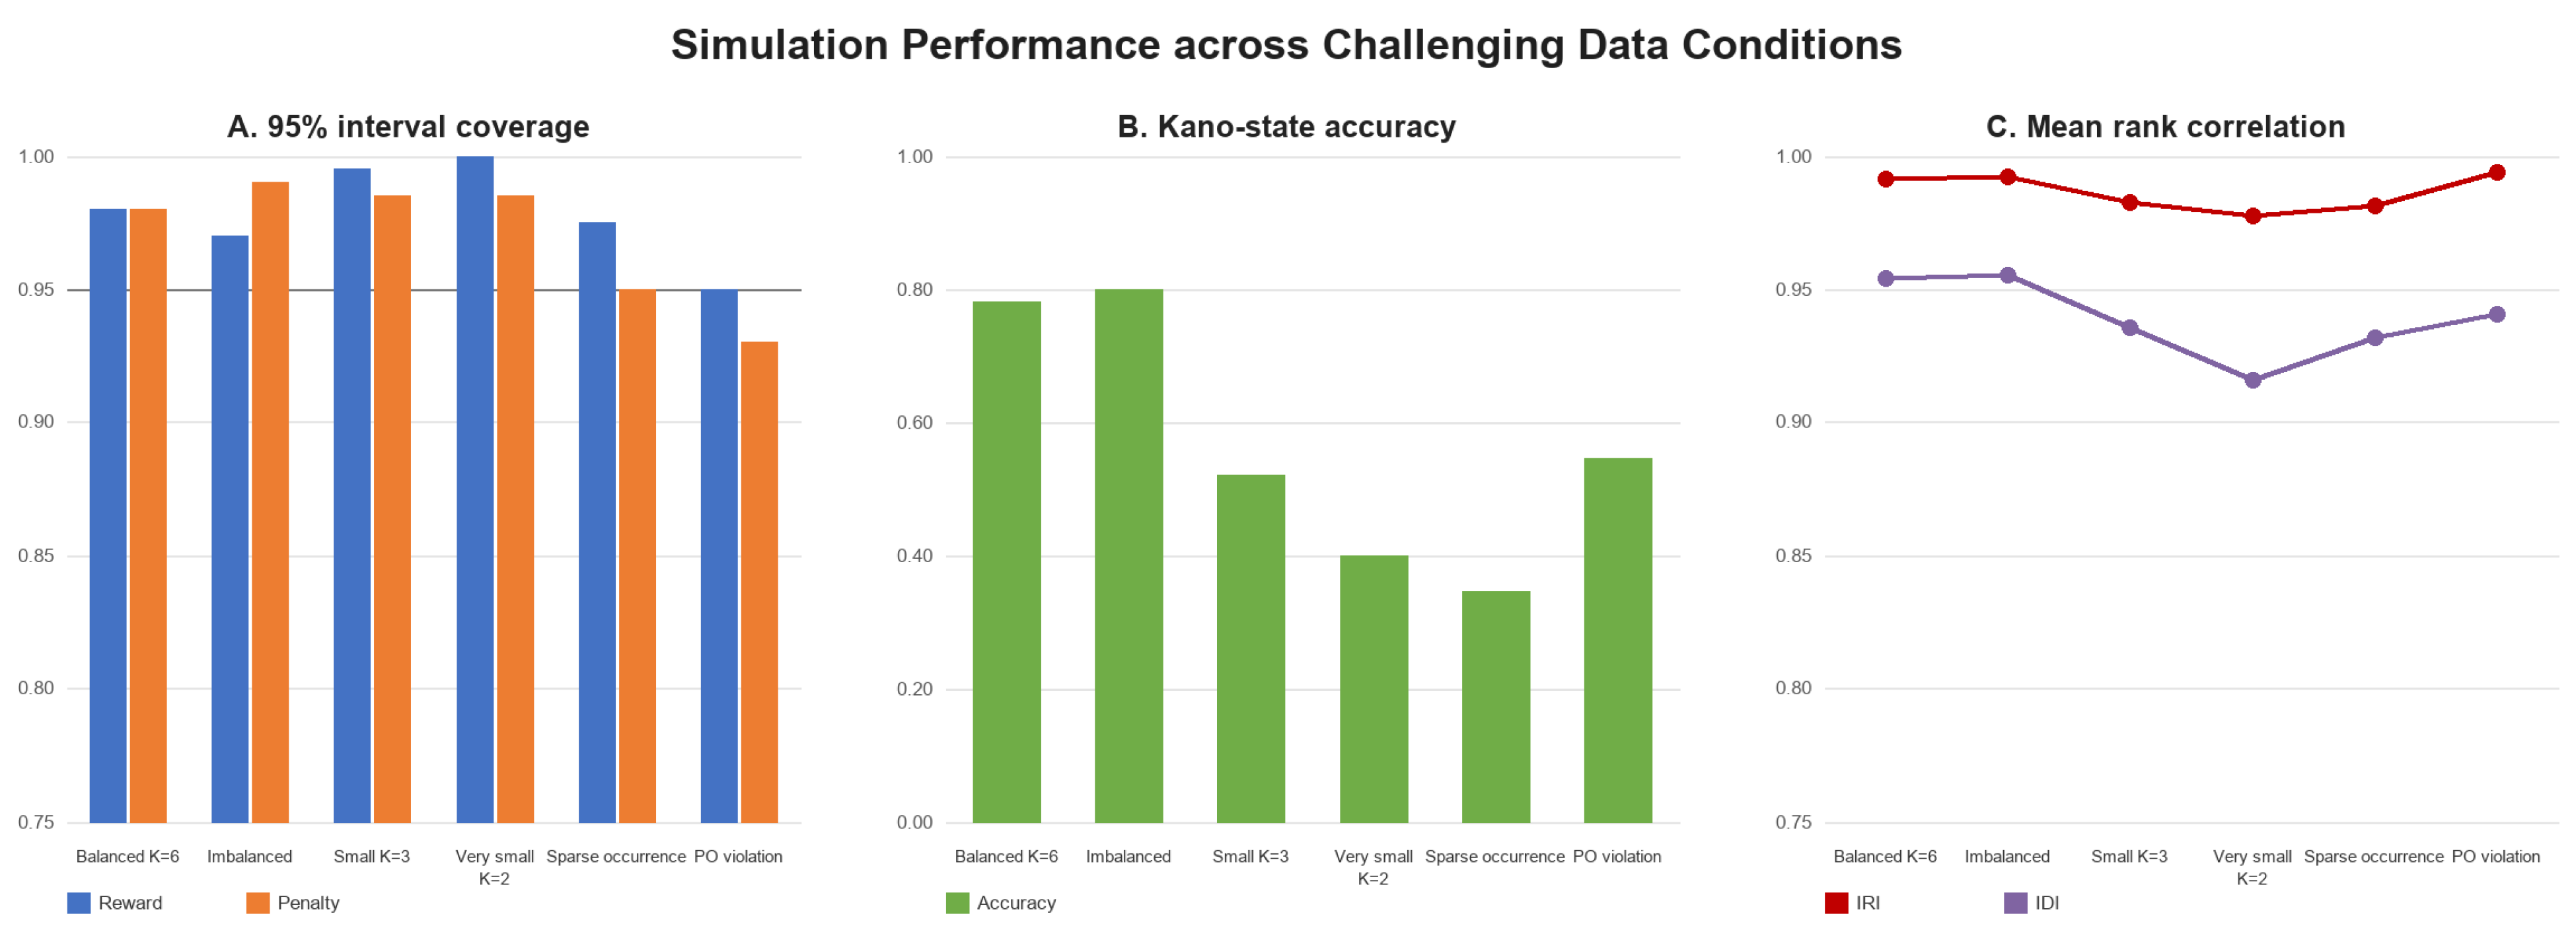
Table 11 and
Figure 2 show that interval estimation and categorical state assignment behave differently. Reward coverage ranges from 0.950 to 1.000 and penalty coverage from 0.930 to 0.990, but state accuracy declines from 0.780 in the balanced K = 6 condition to 0.520 at K = 3, 0.400 at K = 2, and 0.345 under sparse occurrence. A moderate proportional-odds violation increases reward and penalty bias to −0.151 and −0.209 and reduces state accuracy to 0.545. Heterogeneity is overestimated most clearly under small K and sparse occurrence, with mean bias around 0.16–0.23.
Ranking is more stable than categorical classification in the simulation because the leading attributes are well separated. Mean IRI rank correlation remains between 0.977 and 0.994, while mean IDI correlation ranges from 0.916 at K = 2 to 0.955 in the balanced and imbalanced K = 6 conditions. These results do not guarantee empirical rank correctness; rather, they show that posterior states near a 0.95 boundary are more fragile than broad priority tiers.
4. Discussion
Testing the shared-baseline restriction materially changes the analysis. Weak positive and weak negative evidence do not have to share the same association with an overall star rating. The separate-baseline model fits better and prevents a completely separated positive-occurrence pattern from being misallocated to intensity. Subsidy consequently moves from a one-dimensional finding in the earlier specification to mixed or uncertain evidence. This is not a loss of a result; it is a correction of an unsupported restriction. The matched nonlinear comparison leads to a more nuanced conclusion. Rank splines improve AIC and QWK but not MAE or accuracy, while the linear raw and linear rank models trade a small QWK difference against a larger AIC difference. Linear rank intensity is therefore retained as an interpretable scalar summary for cross-country synthesis, not asserted as an exact response function or a uniquely necessary transformation.
Flexible latent-variable, nonparametric, tree-based, and polynomial-chaos ordinal models could represent nonlinearities and interactions more fully. A single hierarchical ordinal model with partially pooled country slopes is another coherent alternative to the two-stage design. Such models may improve prediction, but they would require additional choices about cross-country thresholds, nonlinear effect summaries, and sparse-attribute pooling. The present two-stage approach is retained because its country-specific likelihoods and scalar intensity contrasts are auditable and directly interpretable; the empirical comparisons establish usefulness and robustness, not the necessity or universal superiority of this framework.
The empirical findings suggest a tiered service strategy. Platform service is the clearest cross-market failure-prevention priority and also has strong differentiation value. Payment method is primarily a reliability requirement: negative experiences are consistently damaging, while additional positive intensity does not meet the reward threshold. User experience has the highest differentiation potential but only Australia and China contribute, so the conclusion should not be generalized to all six markets. Fee and location and navigation show two-sided evidence, whereas order, software, and subsidy require local validation. The posterior top-three probabilities are more defensible for management than a fixed one-to-eight ordering.
The bivariate stage retains within-country reward-penalty covariance, addressing a limitation of separate meta-analyses. Nevertheless, the posterior correlation remains weakly identified when an attribute is present in only two or three countries. The wide correlation intervals and expanded prior sensitivity demonstrate that a sophisticated joint model cannot create information that is absent from the country coverage. The simulation reaches the same conclusion: coefficient intervals can retain nominal or conservative coverage while a hard 0.95 Kano rule has low state accuracy. Accordingly, sparse-K states are presented as exploratory and accompanied by continuous posterior probabilities.
The formal Brant diagnostics also prevent overconfidence. Proportional odds is rejected in four countries and cannot be evaluated reliably in two. The targeted partial proportional-odds models confirm substantial threshold heterogeneity in China and Japan through lower AIC, but their repeated-validation metrics are essentially unchanged, and all nine average marginal directions agree with the proportional models. This supports using the pooled slopes as interpretable average associations, not exact effects at every rating threshold. A future one-stage multilevel partial proportional-odds model could pool the threshold-specific functions directly when a larger and less sparse country set can support the additional parameters.
Several limitations remain. The study is observational, so its coefficients are associations and not causal intervention effects. The six markets are not globally representative. The upstream topic and sentiment pipeline cannot be reproduced end to end because exact checkpoints, scraping code, and original independent mapping annotations were not retained. The secondary AI-assisted mapping audit is reproducible, and its sole disagreement is sensitivity-tested, but it is not a substitute for prospective human double coding. Zero scores have an operational rather than uniquely semantic interpretation. Mapping uncertainty is examined by reclassification rather than embedded probabilistically in the model. Cross-attribute posterior covariance is not included in ranking, and the simulation ranking design uses deliberately separated leading priorities. Finally, common-window analysis improves temporal comparability but does not remove changes in platform operations or user composition within 2019–2024. These limitations motivate prospective data collection with archived multilingual models, independent human mapping coders, time-varying effects, and additional countries.
5. Conclusions
This study presents an integrated two-stage Bayesian ordinal framework for cross-country service prioritization from multilingual online reviews. The revised model defines rank intensity at zero, states the algebraic equivalence of the three-component representation, separates positive and negative occurrence baselines, retains within-country reward-penalty covariance in a bivariate random-effects synthesis, propagates prevalence uncertainty, and renames the managerial summaries as intensity-based indices. The primary analysis uses the complete common-window sample rather than a single capped sample, and all major assumptions are examined through model comparison, repeated validation, formal and partial proportional-odds comparisons, prior sensitivity, repeated sampling, temporal analysis, a secondary semantic mapping audit, reclassification sensitivity, and simulation.
Platform service is the most stable failure-prevention priority, payment method is penalty-driven, and user experience offers the largest differentiation potential in Australia and China. Fee and location and navigation show two-sided evidence. Order, software, and subsidy remain uncertain after the baseline restriction is relaxed. More broadly, the results show that posterior states and managerial ranks should be reported as graded evidence. Small K, sparse occurrence, prior choice, time coverage, and proportional-odds violations can leave interval estimation apparently adequate while substantially reducing categorical state accuracy.