1. Introduction
Driven by the widespread adoption of cloud computing technologies, an increasing number of computational tasks generated by users, intelligent devices, and emerging applications are being offloaded to cloud platforms for execution and management. Owing to its elastic resource provisioning, large-scale storage capacity, and service-oriented architecture, cloud computing has become a fundamental technology supporting numerous fields, including big data processing [
1], artificial intelligence [
2], the Internet of Things [
3], and smart manufacturing systems [
4]. As cloud infrastructures continue to expand in both scale and complexity, efficiently coordinating heterogeneous computing resources has emerged as a major challenge. Task scheduling is a key component of cloud computing systems because it determines how computational workloads are assigned to available virtual machines and processing resources. An effective scheduling strategy aims to improve overall system performance by reducing task completion time, enhancing resource utilization, balancing workloads among computing nodes, lowering energy consumption, and minimizing operational expenses. Consequently, the design of efficient and intelligent cloud task scheduling approaches has attracted considerable attention from both academic researchers and industrial practitioners.
A variety of techniques have been developed to tackle cloud task scheduling problems over the past decades. Conventional optimization approaches, such as mathematical programming models [
5], dynamic programming techniques [
6], and heuristic scheduling rules [
7], have achieved satisfactory results in relatively simple scheduling scenarios. However, practical cloud scheduling problems typically involve large-scale search spaces, complex non-linear relationships, and discrete combinatorial characteristics. These properties substantially increase the difficulty of obtaining high-quality solutions using conventional optimization methods. Furthermore, as cloud computing environments become increasingly dynamic and resource-intensive, the limitations of traditional approaches become more apparent. The computational burden of these methods often grows rapidly with problem size, reducing their applicability to large-scale scheduling tasks. In addition, their search mechanisms may lack sufficient flexibility to effectively explore complex solution spaces, which increases the likelihood of premature convergence and suboptimal scheduling outcomes. As a result, developing more efficient and scalable optimization techniques has become essential for modern cloud task scheduling applications.
To address the shortcomings of conventional optimization methods, metaheuristic algorithms have emerged as an effective alternative for solving complex cloud scheduling problems. Owing to their population-based search mechanisms and reduced dependence on gradient information, these approaches are well suited for high-dimensional and non-linear optimization tasks [
8]. In recent years, numerous studies have explored the application of metaheuristic techniques to cloud resource management and task scheduling. For instance, Meena Malik et al. employed the Lateral Hyena–Particle Swarm Optimization algorithm to enhance virtual machine utilization in cloud environments [
9]. Maria Yousef et al. developed a hybrid scheduling framework by integrating the Genetic algorithm with the Salp Swarm algorithm, enabling a more effective coordination between global exploration and local exploitation during the search process. Their approach achieved improvements in both task allocation quality and execution efficiency [
10]. Similarly, Poria Pirozmand et al. introduced an enhanced particle swarm optimization method for cloud resource allocation, which improved scheduling efficiency and enabled a larger number of tasks to be completed within a limited time budget [
11]. Although these studies have demonstrated the advantages of metaheuristic optimization in handling large and complex search spaces, several limitations remain. Many existing algorithms still experience a rapid loss of population diversity during the optimization process, which may lead to premature convergence and reduced search effectiveness. Moreover, insufficient adaptability in balancing exploration and exploitation often restricts their ability to consistently obtain high-quality solutions for challenging optimization problems. These issues motivate the development of more robust and efficient optimization strategies for cloud task scheduling applications.
The well-established No Free Lunch (NFL) theorem suggests that no single optimization algorithm can consistently achieve the best performance across all classes of optimization problems [
12]. In other words, the effectiveness of an optimization method is closely related to the characteristics of the target problem. This observation has motivated extensive research on enhancing existing metaheuristic algorithms through the incorporation of problem-specific mechanisms and adaptive search strategies. By tailoring algorithmic behaviors to particular application requirements, it is often possible to improve search efficiency, solution quality, and convergence stability. Several studies have demonstrated the effectiveness of this research paradigm in practical optimization applications. For example, Xie et al. developed an elite-guided RIME algorithm for three-dimensional UAV path planning, which exhibited strong path generation capability under multiple terrain environments [
13]. In the field of mobile robot navigation, Cui et al. proposed a Multistrategy Adaptive Ant Colony Optimization (MAACO) algorithm to improve path planning performance. The reported results showed notable improvements in both path quality and maneuvering efficiency [
14]. Likewise, Cao et al. introduced a Synergistic Zebra Optimization Algorithm (SZOA) for microgrid scheduling and incorporated advanced management concepts into the optimization framework. Their method effectively coordinated economic objectives with low-carbon operational requirements, providing a practical solution for intelligent microgrid management and sustainable energy utilization [
15]. These successful applications indicate that appropriately designed enhancement strategies can substantially strengthen the performance of metaheuristic algorithms in specific optimization domains. Therefore, developing effective improvement mechanisms remains an important and promising direction for advancing optimization techniques and expanding their practical applicability.
Among recently developed metaheuristic approaches, the Human Urbanization Algorithm (HUA) has gained considerable interest due to its inspiration from the dynamic urbanization process observed in human societies. By simulating the migration and development behaviors associated with urban growth, HUA constructs a population-based search framework capable of exploring complex optimization landscapes. Existing studies have shown that HUA can achieve competitive performance on a range of benchmark optimization tasks and possesses a relatively strong ability to explore the global search space. Despite these advantages, the original HUA still exhibits several limitations that may restrict its performance when addressing challenging optimization problems. First, the initialization mechanism may not always generate a sufficiently diverse population, which can reduce the coverage of the search space during the early optimization stage. Second, the exchange and utilization of useful information among individuals are relatively limited, potentially weakening the efficiency of collective search behavior. Furthermore, as the optimization process progresses, the algorithm may gradually lose its ability to maintain an effective coordination between exploration and exploitation. This phenomenon can increase the risk of stagnation in local optima and ultimately affect the accuracy and stability of the obtained solutions [
16].
Although HUA provides a hierarchical exploration–exploitation framework, its original search mechanisms are not fully aligned with the characteristics of large-scale cloud task scheduling. The task-to-VM assignment problem produces a high-dimensional combinatorial search space containing many closely competing allocation patterns. Under this condition, the single-capital guidance mechanism of HUA may cause candidate schedules to concentrate rapidly around one allocation pattern and reduce the diversity required to explore alternative VM assignments. Moreover, the original city radius rule does not explicitly respond to the heterogeneous resource requirements of tasks, the differences among VM configurations, or the changing search requirements at different evolutionary stages. The random citizen-generation mechanism also lacks a directed cooperative refinement process, making it difficult to improve small but important differences among execution time, workload distribution, and monetary cost. Therefore, a scheduling-oriented reformulation of the guidance, adaptive regulation, and local refinement mechanisms of HUA is necessary. EHUA addresses these limitations through fitness-weighted multihub guidance, city-specific supply–demand radius regulation, and neighboring-city cooperative exploitation with decreasing Gaussian perturbation.
To further exploit the optimization potential of HUA in complex search environments, an enhanced framework, termed EHUA, is developed and applied to global optimization and cloud task scheduling problems. Rather than treating elite guidance, adaptive control, neighborhood cooperation, and Gaussian perturbation as entirely new search principles, EHUA reformulates and coordinates these mechanisms within the adventurer–city–citizen structure of HUA. This design aims to alleviate the excessive dependence on a single capital, the insufficient adaptability of city radius regulation, and the limited refinement capability of the original citizen search process. The main contributions of this study are summarized as follows:
An enhanced HUA framework, named EHUA, is developed to improve population diversity, adaptive search regulation, local refinement, and convergence reliability. The methodological contribution lies primarily in the HUA-specific reformulation and coordinated integration of multiple search mechanisms rather than in a simple combination of generic operators.
A logistics-hub-guided adaptive exploration mechanism is designed for the adventurer search stage. Instead of relying exclusively on a single capital, the proposed mechanism constructs a virtual logistics hub through the fitness-weighted aggregation of multiple high-quality city centers and combines it with global best guidance. This formulation reduces excessive search bias toward one solution and broadens the coverage of promising regions.
A dynamic supply–demand redistribution mechanism is introduced to regulate the search radius of each city according to its relative fitness and the current evolutionary stage. Unlike conventional adaptive schemes that apply a common scalar parameter to the entire population, this mechanism generates city-specific search ranges and supports a gradual transition from broad exploration to local refinement.
A cooperative logistics delivery exploitation mechanism is developed for citizen-level refinement. The search direction is jointly determined by neighboring elite cities and global best information, while an iteration-dependent Gaussian perturbation is incorporated to preserve stochastic search ability in the early stage and improve refinement precision in the later stage.
The performance of EHUA is systematically evaluated on the CEC2014 and CEC2020 benchmark suites. Convergence curves, box-plot distributions, numerical statistics, Wilcoxon signed-rank tests, Friedman rankings, and ablation experiments are employed to assess optimization accuracy, repeatability, statistical significance, and the contribution of the individual enhancement mechanisms. The results demonstrate strong overall competitiveness, although EHUA does not rank first on every individual benchmark function.
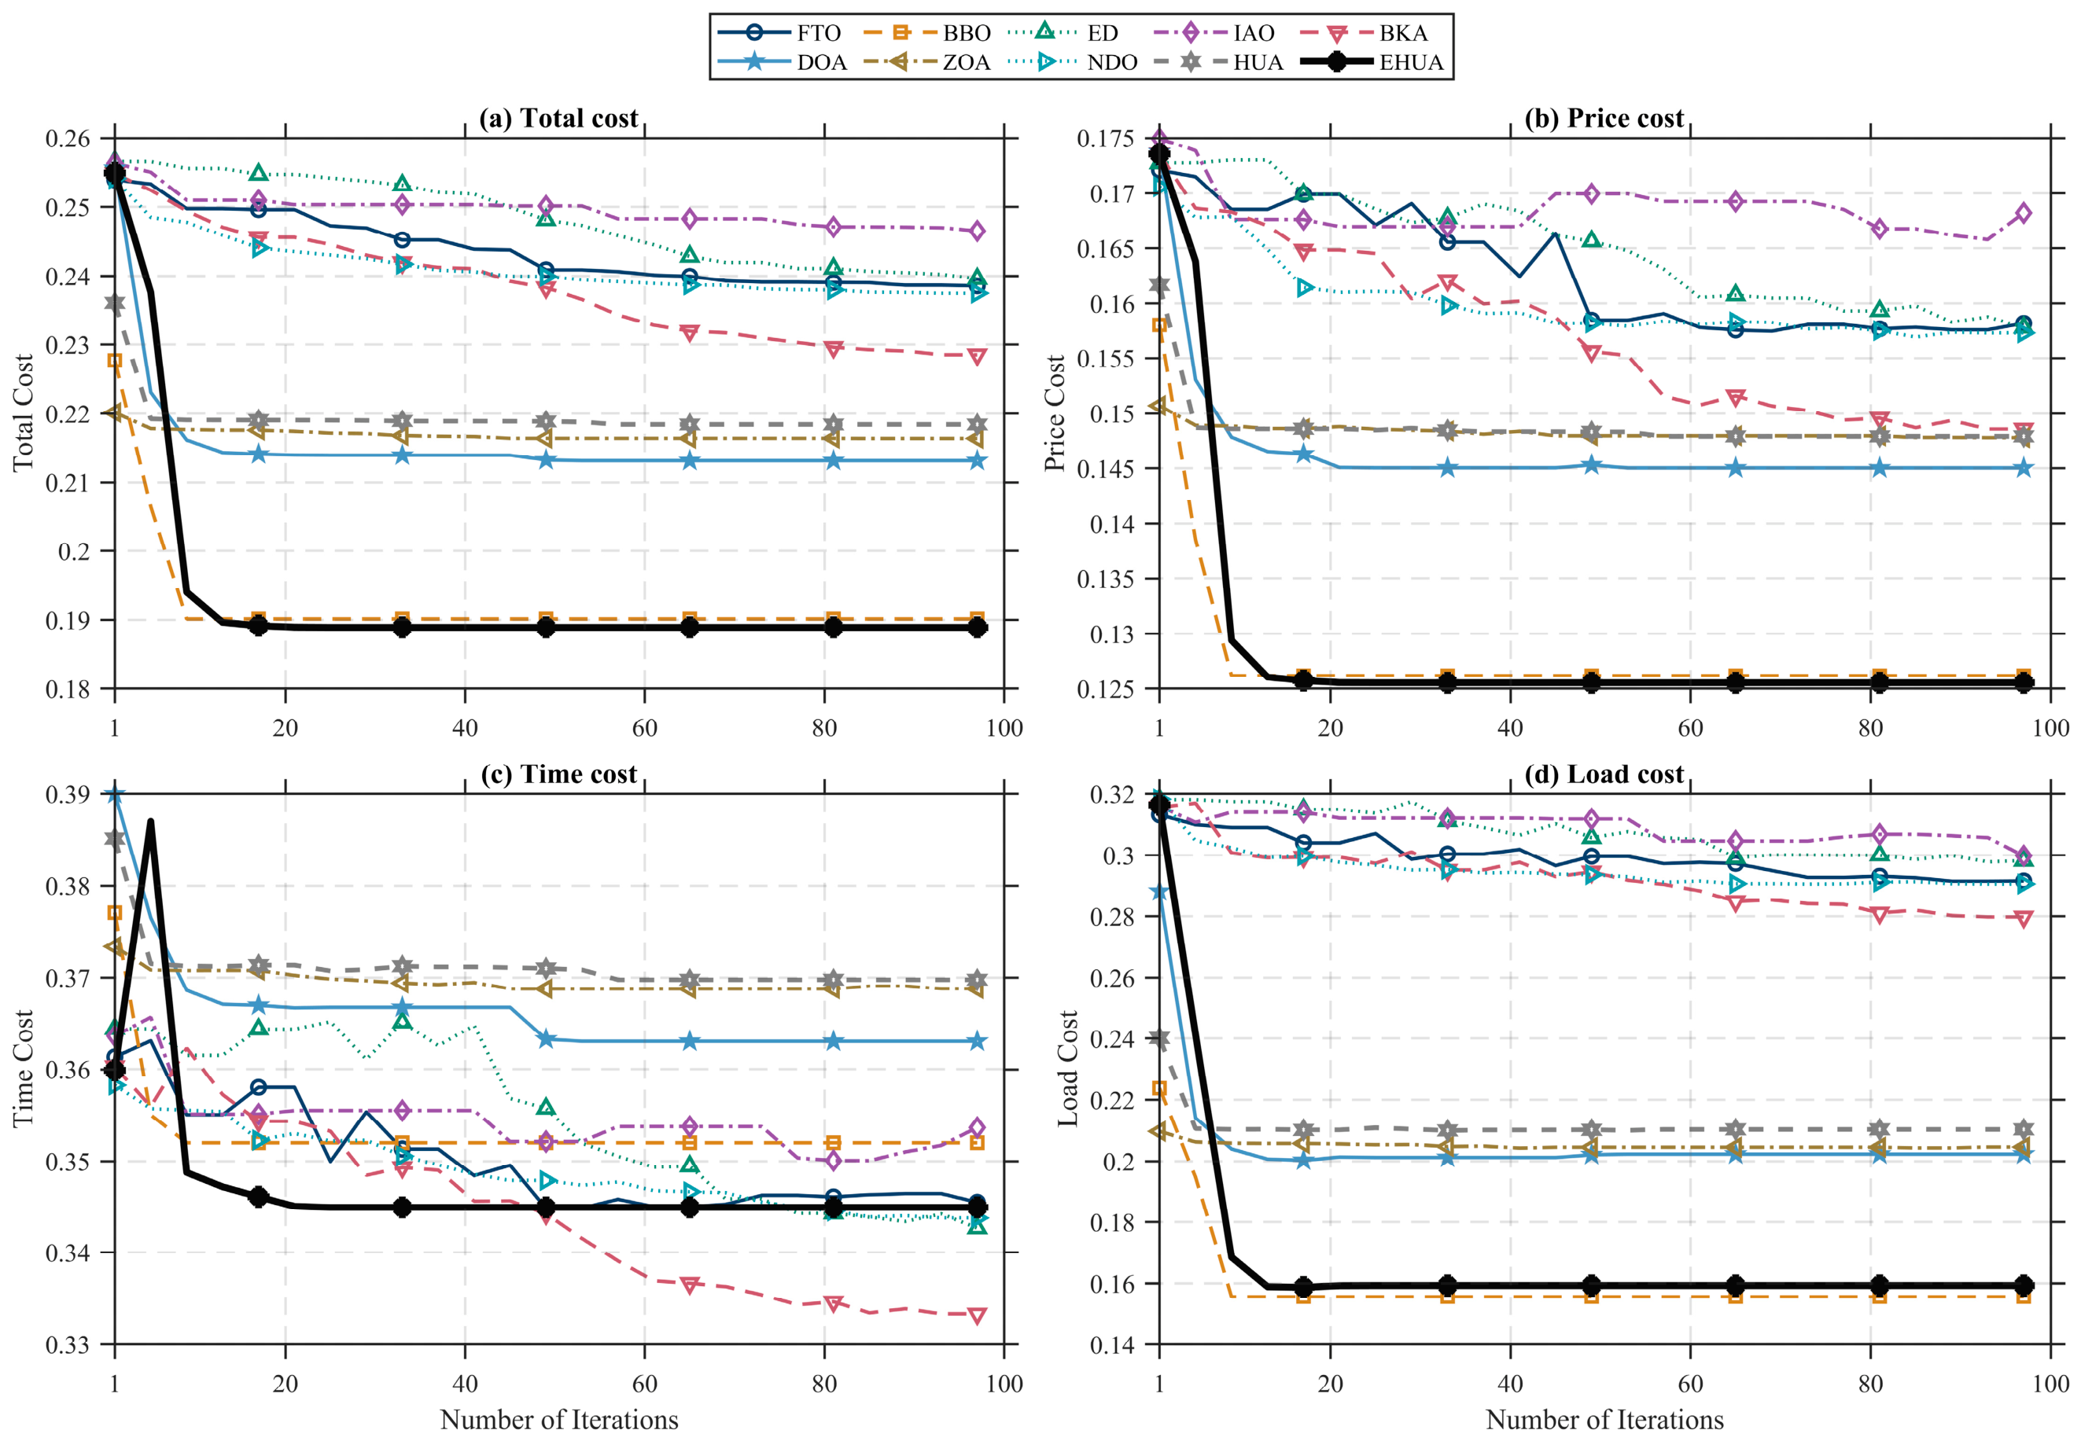
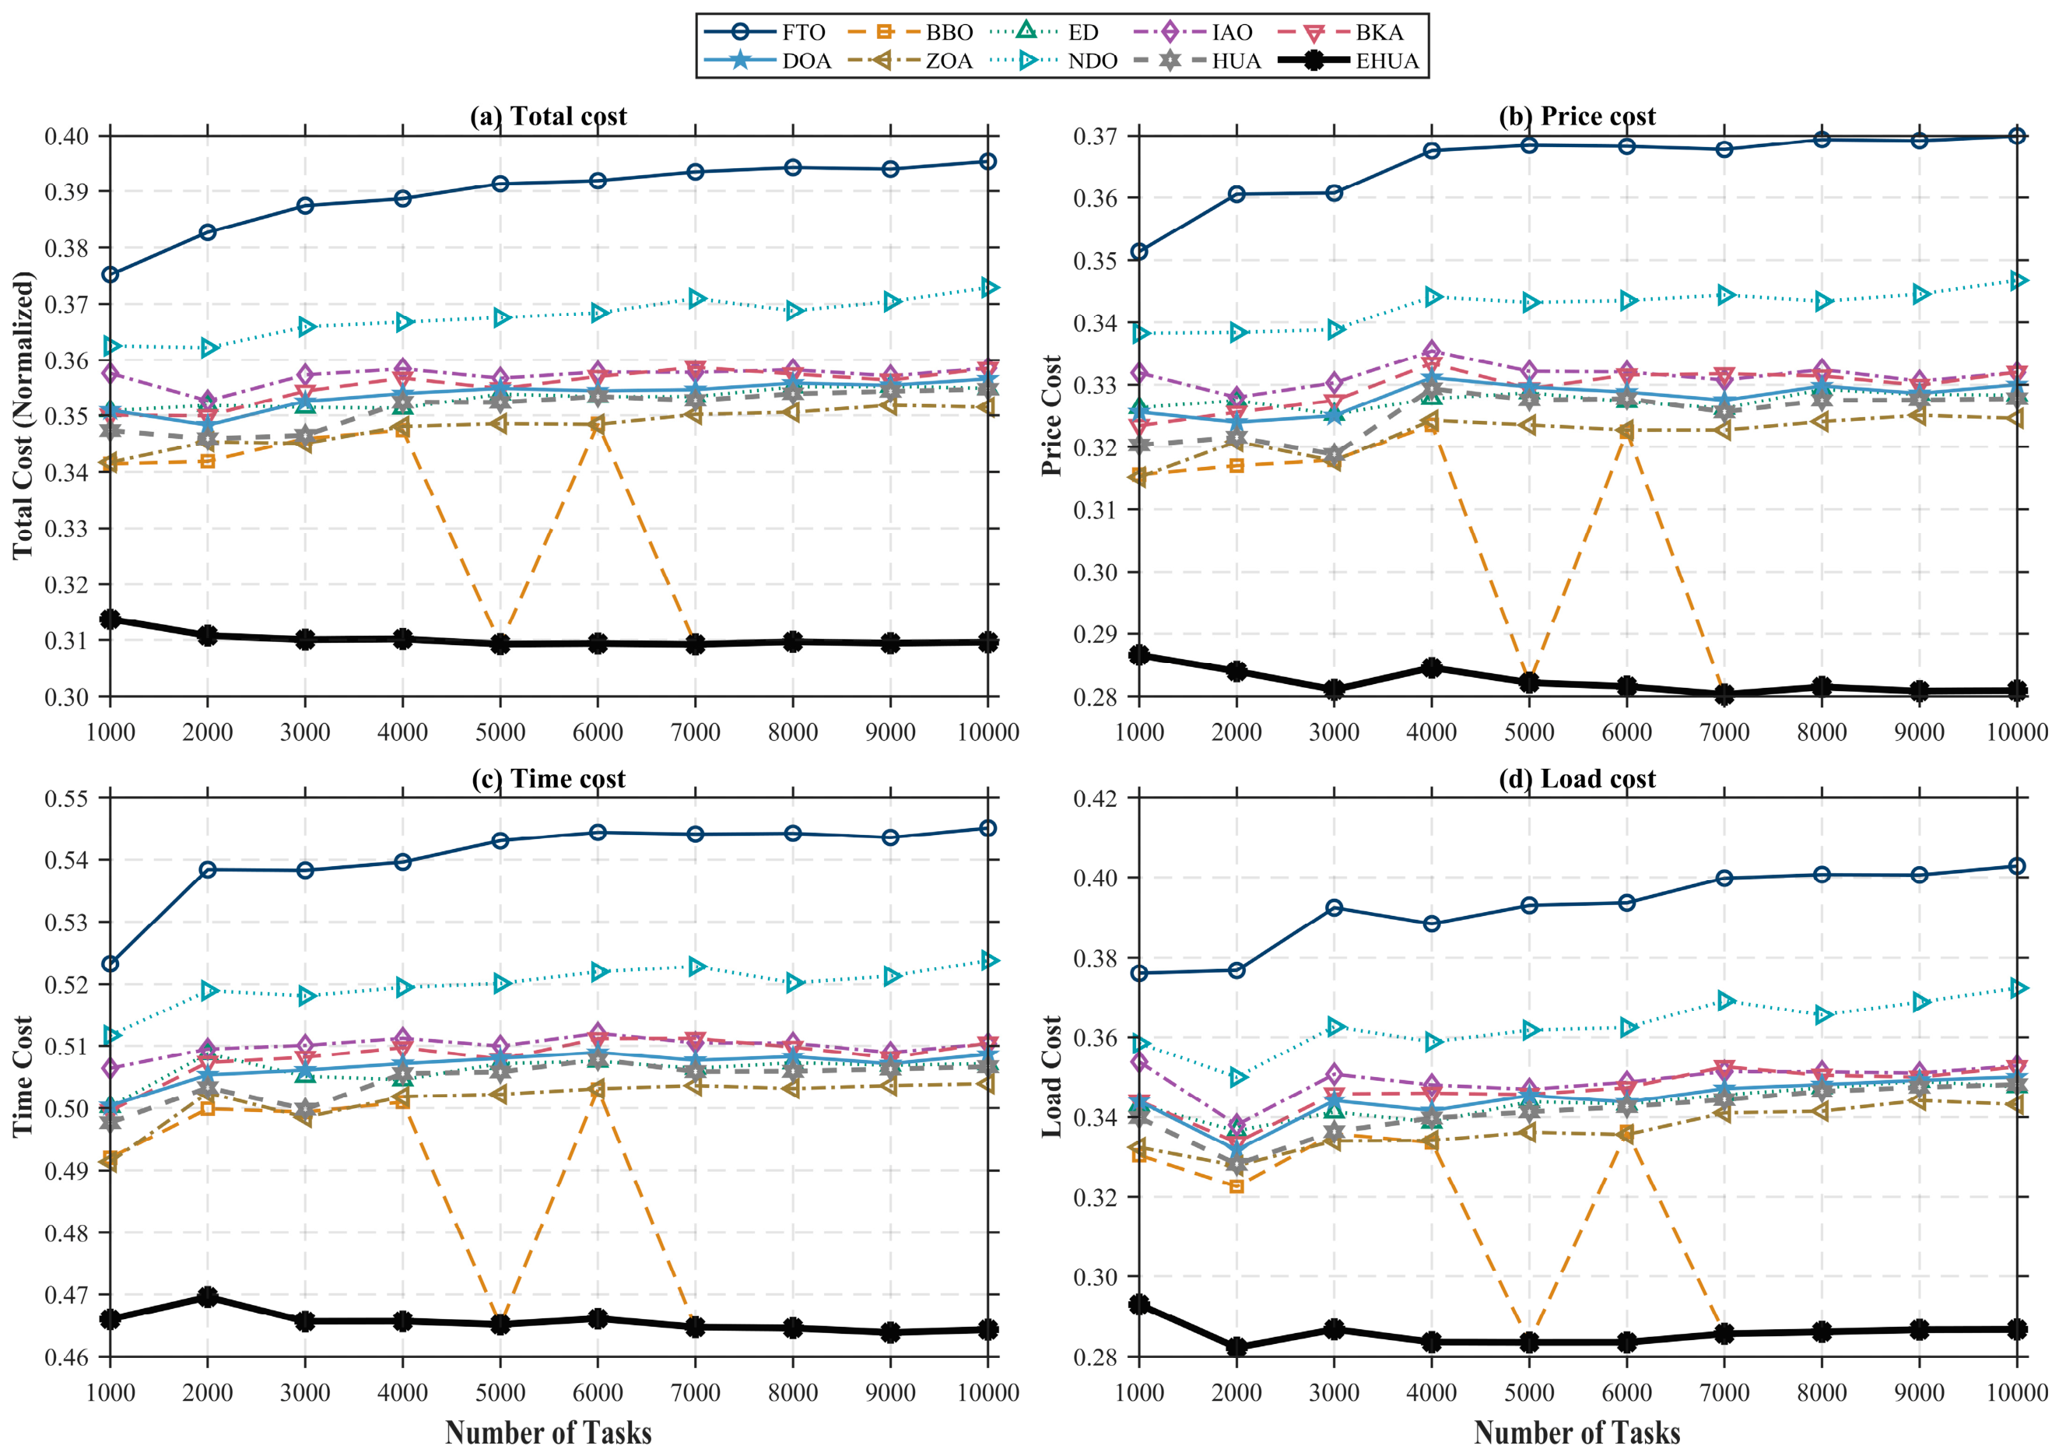
The practical applicability and scalability of EHUA are investigated through cloud task scheduling experiments under small-scale and large-scale workload conditions. Multiple scheduling indicators, including comprehensive cost, monetary cost, execution time, and load cost, are considered. The experimental results show that EHUA generally achieves lower comprehensive scheduling costs and a favorable balance among the individual objectives, while maintaining stable performance as the number of tasks increases.
The remainder of this manuscript is organized as follows.
Section 2 introduces the original Human Urbanization Algorithm and discusses its main limitations.
Section 3 presents the proposed EHUA framework, the three coordinated enhancement mechanisms, and their differences from related conventional search operators.
Section 4 reports the benchmark experiments and statistical analyses on the CEC2014 and CEC2020 test suites.
Section 5 formulates the cloud task scheduling problem and evaluates the applicability of EHUA under different workload scales. Finally,
Section 6 summarizes the main findings, discusses the limitations of the present study, and outlines possible directions for future research.
2. Human Urbanization Algorithm (HUA)
2.1. Inspiration from Human Urbanization Behavior
The Human Urbanization Algorithm (HUA) is a population-based metaheuristic optimization algorithm inspired by the urbanization behavior of human societies. The algorithm simulates the process of human exploration, migration, concentration, and city formation during the development of civilization. In the urbanization process, humans continuously search for suitable living environments, migrate toward promising regions, and gradually form population centers and modern cities. HUA models these behaviors mathematically and transforms them into an optimization mechanism for solving complex numerical optimization problems.
The core idea of HUA is to divide the search process into two complementary stages: global exploration and local exploitation. In the global search stage, “adventurers” explore unknown regions to discover promising areas. In the local exploitation stage, “citizens” perform intensive searches around city centers to refine the obtained solutions. The interaction between these two stages enables HUA to maintain a balance between exploration and exploitation during the optimization process.
In HUA, the search space is regarded as the world map, candidate solutions correspond to human locations, cities represent promising regions, and the capital denotes the best solution obtained so far. Through continuous migration and city updating mechanisms, the population gradually converges toward the global optimum.
2.2. Mathematical Model of HUA
Assume that the optimization problem is defined in an
-dimensional search space, and the population size is
. Each adventurer is represented by a position vector:
where
denotes the value of the
-th dimension of the
-th adventurer. The initial population is randomly generated within the search boundaries according to:
where
and
are the lower and upper bounds of the search space, respectively, and
is a random number uniformly distributed within
.
After initialization, the fitness value of each adventurer is evaluated, and several superior individuals are selected as city centers. Among all city centers, the best one is defined as the capital, which represents the global best solution.
2.3. Adventurer Exploration Mechanism
In the first stage of HUA, adventurers search for suitable locations to establish city centers. Their movement behavior is influenced by both their current positions and the capital position. The position updating equation is expressed as:
where
denotes the current position of the
-th adventurer at iteration
,
represents the capital position,
is a random number within
,
is a control parameter related to city diversification and intensification.
This equation allows adventurers to simultaneously preserve historical search information and move toward promising regions guided by the capital. Consequently, the algorithm can effectively enhance global exploration ability.
After generating new candidate positions, all adventurers are sorted according to their fitness values. If an adventurer discovers a location better than the current city center, the city center is updated accordingly.
2.4. City Boundary Model
In HUA, each city has a specific search boundary. The boundary determines the region in which citizens can move and search. Three types of city boundary models are considered in the original HUA, including circular, rectangular, and square boundaries.
For the circular boundary model, an adventurer is considered inside the city if:
where
is the
-th dimension of the
-th city center,
is the radius of the
-th city.
For the square boundary model, the following condition should be satisfied:
Compared with circular and rectangular boundaries, the square model requires lower computational complexity and memory consumption. Therefore, it is adopted in the original HUA.
2.5. City Radius Updating Strategy
The radius of each city is dynamically adjusted during the optimization process. The city radius is calculated as:
where
denotes the population of the
-th city,
represents the difference factor between the city and the capital,
is the population size of the city.
The difference factor is defined as:
where
and
denote the fitness values of the city center and the capital, respectively.
To dynamically regulate the search process, the parameter
is updated according to:
where
is the current iteration number,
is a control parameter,
denotes the city population.
This mechanism creates a wave-like variation behavior for the city radius, enabling the algorithm to alternate between diversification and intensification during the search process.
2.6. Citizen Distribution Mechanism
After determining city centers and city boundaries, citizens are randomly distributed around each city center according to the following equation:
where
denotes the
-th citizen in the
-th city,
represents the center of the
-th city,
is a random number uniformly distributed within
,
is the city radius.
This strategy enables citizens to perform local exploitation around city centers, thereby improving the fine-search capability of the algorithm.
After evaluating all citizens, the best citizen in each city replaces the previous city center. Subsequently, all city centers are sorted again, and the best city center is updated as the new capital.
2.7. Overall Procedure of HUA
The overall optimization procedure of HUA can be summarized as follows:
Randomly initialize adventurers in the search space.
Evaluate the fitness values of all adventurers.
Select several superior individuals as city centers and determine the capital.
Update adventurer positions according to the capital-guided exploration equation.
Calculate city radii and determine city boundaries.
Generate citizens around city centers for local exploitation.
Update city centers and the capital according to fitness values.
Repeat the above steps until the termination criterion is satisfied.
Through the collaborative interaction between adventurer exploration and citizen exploitation, HUA achieves a dynamic balance between global exploration and local exploitation.
2.8. Limitations of the Original HUA
Although HUA demonstrates competitive optimization performance, several limitations still exist:
The adventurer updating mechanism strongly depends on the capital, which may reduce population diversity during later iterations.
The random citizen distribution strategy lacks adaptive exploitation capability, resulting in insufficient local refinement accuracy.
The city radius updating mechanism may cause unstable search behavior in complex multimodal problems.
The balance between exploration and exploitation is mainly controlled by random parameters, which may lead to premature convergence.
Therefore, to further improve the optimization capability of HUA, this paper introduces several enhancement strategies to strengthen population diversity, adaptive search ability, and local exploitation performance in the subsequent sections.
3. Enhanced Human Urbanization Algorithm (EHUA)
Although HUA has exhibited satisfactory optimization performance on various benchmark problems, its effectiveness may decline when dealing with complex multimodal and high-dimensional optimization tasks. One limitation arises from the adventurer evolution mechanism, which places excessive emphasis on the capital city position. Such a search pattern may accelerate population concentration and consequently weaken solution diversity as the optimization process progresses. In addition, the radius adjustment mechanism of cities lacks sufficient adaptability to different search stages, making it difficult to maintain an effective coordination between exploration and exploitation. Furthermore, citizen evolution mainly relies on random movements within predefined city regions, which may restrict local search efficiency and increase the probability of stagnation in suboptimal regions.
To enhance the optimization capability of HUA, this study develops an Enhanced Human Urbanization Algorithm (EHUA) by drawing inspiration from the collaborative resource allocation process of modern logistics networks. In practical logistics systems, transportation hubs, distribution centers, and routing mechanisms interact dynamically to achieve efficient resource distribution and adaptive scheduling. Guided by this concept, three complementary mechanisms are integrated into the original HUA framework. These mechanisms include a logistics-hub-guided adaptive exploration mechanism, a dynamic supply–demand redistribution mechanism, and a cooperative logistics delivery exploitation mechanism. Through the coordinated operation of these components, EHUA aims to strengthen search diversity, improve adaptive search behavior, and enhance exploitation efficiency, thereby achieving a more balanced and effective optimization process. Although these mechanisms are related to several commonly used search concepts, their formulations and functional roles are specifically redesigned according to the adventurer–city–citizen structure of HUA. Although direct extensions of HUA remain relatively limited in the published literature, the elementary concepts underlying the proposed mechanisms, including elite guidance, adaptive parameter regulation, population-difference-based cooperation, and Gaussian stochastic search, have been investigated in other metaheuristic frameworks. Therefore, the contribution of EHUA should not be interpreted as the first introduction of these individual operators. To clarify its methodological position,
Table 1 compares EHUA with the original HUA and several representative algorithms that employ conceptually related search mechanisms.
As shown in
Table 1, EHUA shares several elementary search concepts with existing metaheuristics, but its formulation and integration structure are different. APSO performs population-level parameter adaptation within the PSO velocity model, whereas EHUA generates city-specific radii according to relative fitness and evolutionary progress. SDO treats supply–demand behavior as the central population evolution model, while EHUA uses the supply–demand state specifically to regulate city search regions. DE constructs trial solutions from differences among population vectors, whereas EHUA derives a cooperative direction from neighboring elite cities. Similarly, Gaussian stochastic search is well established in CMA-ES and several improved swarm optimizers, but EHUA superimposes a decreasing Gaussian perturbation on a deterministic direction jointly determined by neighboring-city cooperation and global best attraction. Therefore, the methodological contribution of EHUA lies in the coordinated reformulation of these concepts within the adventurer–city–citizen hierarchy rather than in claiming that the individual operators are fundamentally new.
Although
Table 1 clarifies the conceptual relationship between EHUA and representative related optimizers, a direct equation-level comparison is also necessary to reveal how the mathematical search process of the original HUA is modified. Therefore,
Table 2 compares the principal HUA and EHUA formulations in terms of guidance information, adventurer exploration, city radius regulation, citizen exploitation, and stochastic refinement.
As shown in
Table 2, the mathematical modification of EHUA is not limited to introducing additional random terms. At the adventurer level, the single-capital update of HUA is replaced by a dual-guidance displacement determined by a fitness-weighted logistics hub and the global best solution. At the city level, the original fitness-ratio radius rule is replaced by a normalized supply–demand state and an explicit interpolation between global and local search ranges. At the citizen level, random distribution around a city center is replaced by a cooperative direction derived from neighboring elite cities and global best attraction, together with a gradually decreasing Gaussian perturbation. These equation-level differences demonstrate how the three mechanisms respectively modify the exploration, adaptive regulation, and exploitation stages of HUA.
3.1. Logistics-Hub-Guided Adaptive Exploration Strategy
In the original HUA, adventurers update their positions mainly according to the capital position. Although this mechanism accelerates convergence speed, the population gradually loses diversity as the iteration proceeds, thereby increasing the risk of premature convergence. In real logistics supply chains, transportation scheduling does not solely depend on a single logistics center. Instead, multiple logistics hubs collaboratively guide transportation routing and dynamically allocate transportation resources according to regional demands. Inspired by this mechanism, a logistics-hub-guided adaptive exploration strategy is proposed.
To establish the proposed guidance framework, a number of high-quality city centers are first identified from the current population and collectively organized into a logistics hub set:
where
denotes the number of elite logistics hubs and
represents the
-th elite individual. Based on the hub set, a virtual logistics hub center is generated through a weighted aggregation of elite solutions:
The contribution of each elite individual is controlled by an adaptive weighting coefficient
, which is assigned according to its relative fitness performance:
where
denotes the fitness value of the
-th elite individual and
is a small constant to avoid division by zero.
After obtaining the weighted logistics hub center, the position evolution rule of adventurers is modified as follows:
where
denotes the current position of the
-th adventurer,
represents the weighted logistics hub center,
denotes the global best position,
and
are random coefficients within
.
Compared with the original HUA, which relies primarily on a single capital city to guide the search process, the proposed mechanism introduces information from multiple elite regions simultaneously. Such a collaborative guidance pattern effectively mitigates excessive search bias toward a single solution and encourages broader exploration of promising areas. Consequently, the population maintains higher diversity throughout the evolutionary process, leading to enhanced global exploration capability and improved search robustness.
3.2. Dynamic Supply–Demand Redistribution Strategy
The original HUA adjusts the city radius mainly according to the population size and fitness value. However, the radius updating mechanism lacks adaptive regulation capability during different optimization stages. In practical logistics supply chains, supply–demand relationships continuously change with transportation conditions and regional demands. Logistics systems dynamically redistribute transportation resources according to environmental feedback to maintain operational balance. Inspired by this phenomenon, a dynamic supply–demand redistribution strategy is introduced into EHUA.
First, the supply–demand factor is defined as:
where
denotes the fitness value of the
-th city,
and
denote the best and worst fitness values of the current population, respectively. Then, the city radius updating equation is redesigned as:
where
is the adaptive contraction coefficient,
is the random expansion coefficient,
is a uniformly distributed random number within
.
In the present implementation, is fixed at throughout all experiments. This parameter introduces a small stochastic expansion term to prevent an excessively rapid contraction of the city radius. It is deliberately kept at a relatively small value so that the random expansion does not dominate the fitness-dependent contraction controlled by . Since serves as a secondary diversity-preserving coefficient, the sensitivity analysis focuses on , which directly controls the principal radius-contraction behavior. The same value of is used for all benchmark functions, dimensions, and cloud scheduling experiments.
In the early optimization stage, the population diversity is relatively high, and larger city radii encourage broad exploration of the search space. As the optimization process proceeds, superior cities gradually reduce their search radii to enhance local exploitation capability, while inferior cities maintain relatively large search ranges to preserve diversity. Furthermore, an adaptive balance factor is introduced:
where
denotes the current iteration number,
denotes the maximum number of iterations. Accordingly, the final city radius updating equation becomes:
This mechanism enables EHUA to dynamically transition from global exploration to local exploitation during different optimization stages, thereby improving convergence accuracy and search stability.
3.3. Cooperative Logistics Delivery Exploitation Strategy
Although the original citizen search mechanism can perform local exploitation around city centers, the search behavior mainly relies on random perturbations, which limits exploitation accuracy in later iterations. In logistics supply chains, delivery vehicles usually cooperate with neighboring distribution centers to optimize transportation routes and improve delivery efficiency. Inspired by this collaborative delivery mechanism, a cooperative logistics delivery exploitation strategy is proposed.
First, neighboring elite cities are selected to establish cooperative delivery relationships:
where
denotes the number of neighboring elite cities. Then, the cooperative delivery direction is calculated as:
where
denotes the current city center. Based on the collaborative delivery direction, the citizen updating equation is designed as:
where
denotes the neighborhood cooperation coefficient,
denotes the global exploitation coefficient. To further enhance local exploitation capability, a Gaussian perturbation mechanism is introduced:
where
denotes the adaptive perturbation factor,
represents the standard Gaussian distribution. The Gaussian perturbation factor gradually decreases with the iteration process:
where
denotes the initial perturbation amplitude. The proposed cooperative logistics delivery exploitation strategy enables neighboring elite cities to collaboratively guide citizen search behaviors while maintaining adaptive local perturbation capability. Consequently, EHUA achieves stronger exploitation capability and higher convergence accuracy in complex optimization problems.
In the present implementation, the neighborhood size and the two directional coefficients are fixed as
,
, and
, respectively. A compact neighborhood containing three elite cities is adopted to retain directional local information without excessively smoothing the cooperative direction or introducing substantial computational overhead. The coefficients
and
are assigned equal values so that neighboring-city cooperation and global best attraction make balanced contributions to citizen refinement, preventing either guidance source from dominating the update process. These secondary coefficients are kept unchanged for all benchmark functions, dimensions, and cloud scheduling experiments. The initial Gaussian perturbation amplitude is set to
, as determined by the sensitivity analysis presented in
Section 4.7.
Table 3 shows the meaning and default values of each parameter.
The parameters , , and are selected for sensitivity analysis because they correspond to the three principal enhancement mechanisms of EHUA. The remaining parameters control secondary search intensities and are fixed throughout the experiments. In general, and primarily regulate exploitation strength, and maintain stochastic diversity, and , , and determine the extent of elite and neighborhood information utilization.
3.4. Computational Complexity Analysis
Assume that denotes the population size, is the problem dimension, represents the maximum number of iterations, is the number of city centers, denotes the number of elite logistics hubs, and is the number of neighboring elite cities used in the cooperative exploitation mechanism. In addition, let denote the computational cost of evaluating the objective function for one candidate solution.
During initialization, generating candidate solutions requires , while evaluating their fitness values requires . Therefore, the initialization complexity is .
In each iteration, the logistics-hub-guided adaptive exploration mechanism first ranks the candidate solutions to identify the elite city centers. The ranking operation requires , while constructing the weighted logistics hub from elite solutions requires . Updating the adventurer positions and evaluating the newly generated solutions require and , respectively. The dynamic supply–demand redistribution mechanism calculates the relative fitness states and updates the search radii of the cities. Since these quantities are calculated once for each city, its computational cost is , or when dimension-dependent radius operations are considered. For the cooperative logistics delivery exploitation mechanism, the neighborhood-selection cost must also be included. In the present implementation, the Euclidean distance between each pair of city centers is calculated to identify the nearest elite cities. Computing the complete pairwise distance matrix requires . If all distances are fully sorted for every city, the corresponding selection operation requires . Alternatively, when a partial-selection method is used to extract only the smallest distances, this term can be reduced to approximately . After the neighboring cities have been identified, calculating the cooperative delivery directions requires , while updating and evaluating the citizens require and , respectively.
Accordingly, when full sorting is adopted, the total computational complexity of EHUA can be expressed as
. Ignoring the initialization term, the iterative complexity becomes
(
. If partial neighbor selection is employed instead of full sorting, the complexity can be written as
(
. Since
, the worst-case complexity may reach
when the number of city centers grows proportionally with the population size. Therefore, the neighborhood cooperation mechanism can increase the theoretical complexity order compared with the original HUA. Nevertheless, in the present implementation, both
and
are set substantially smaller than
, and
remains fixed throughout the optimization process. Consequently, the additional computational overhead remains controlled while enabling more informative neighborhood cooperation and stronger local refinement.
Table 4 shows the actual execution times of the various algorithms, as presented below.
As shown in
Table 4, EHUA maintains relatively low computational costs across all benchmark settings and consistently ranks among the most efficient algorithms. On CEC2014, EHUA requires 0.93 s and 1.50 s under the 30- and 50-dimensional settings, respectively, ranking second only to the original HUA. Compared with HUA, the additional runtime is only 0.04 s at 30 dimensions and 0.02 s at 50 dimensions, corresponding to increases of approximately 4.49% and 1.35%. On CEC2020, EHUA records execution times of 0.21 s and 0.31 s for the 10- and 20-dimensional cases, respectively. Although these values are approximately 40.00% and 40.91% higher than those of HUA, the absolute increases are only 0.06 s and 0.09 s because the baseline execution times are very small. EHUA also remains considerably faster than FTO, BBO, ED, IAO, BKA, ZOA, and NDO in most settings and is close to DOA on CEC2020. The moderate additional cost mainly arises from fitness-weighted logistics hub construction, neighborhood selection, cooperative direction calculation, and Gaussian perturbation. Overall, the computational overhead of EHUA is limited and acceptable, particularly considering its improvements in optimization accuracy, convergence behavior, and robustness.
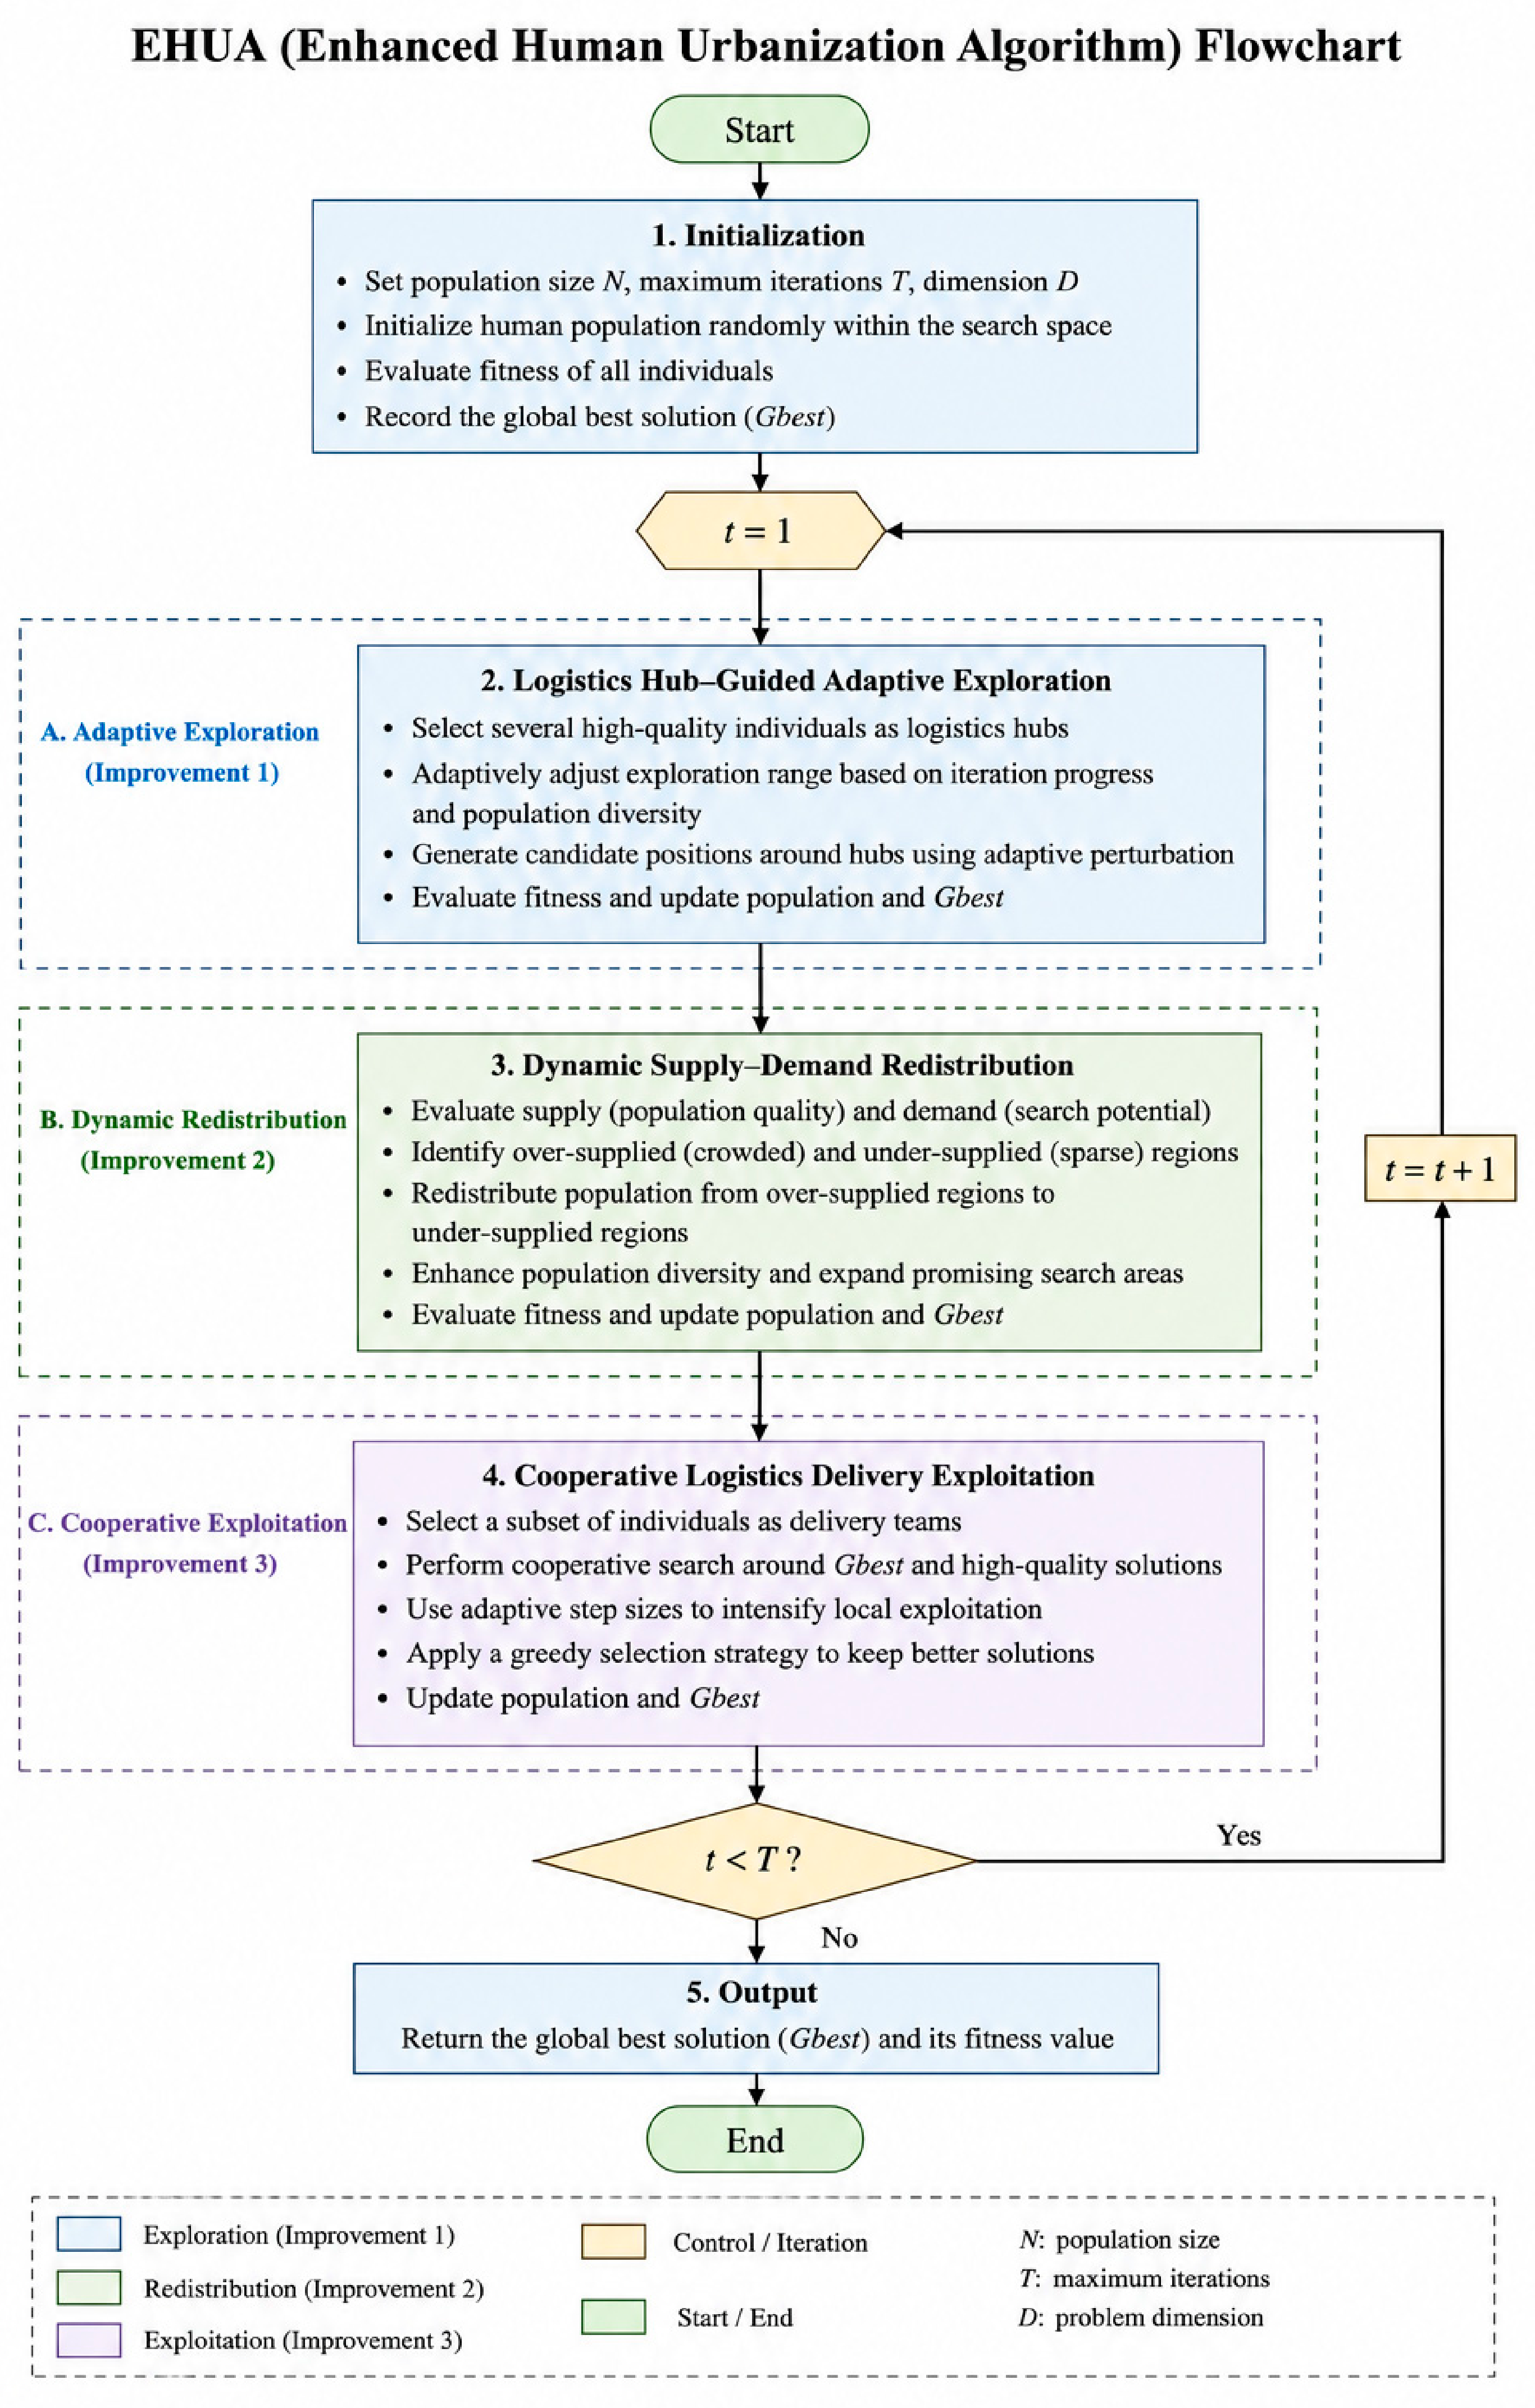
3.5. Framework of EHUA
The overall framework of EHUA can be summarized as follows:
Initialize adventurers randomly in the search space.
Evaluate the fitness values of all individuals.
Construct logistics hub guidance centers using elite city centers.
Update adventurer positions using the logistics-hub-guided adaptive exploration strategy.
Dynamically adjust city radii using the supply–demand redistribution strategy.
Generate citizens around city centers.
Perform cooperative logistics delivery exploitation with Gaussian perturbation.
Update city centers and the global best solution.
Repeat the above procedures until the termination condition is satisfied.
Through the collaborative interaction among the proposed three enhancement strategies, EHUA effectively strengthens the balance between global exploration and local exploitation, thereby achieving superior optimization performance in complex optimization problems.
Figure 1 shows the execution flowchart of EHUA.
4. Analysis of Global Optimization Experiments
This section presents a comprehensive evaluation of the proposed EHUA on the IEEE CEC2014 and IEEE CEC2020 benchmark suites. First, the benchmark functions, experimental configuration, and comparison methods are introduced. Subsequently, extensive comparative experiments are carried out to assess the effectiveness of EHUA against several representative metaheuristic optimization algorithms. To provide a more objective evaluation, multiple statistical analyses are employed to examine the optimization accuracy, convergence characteristics, stability, and overall competitiveness of the proposed method.
To ensure consistency and impartiality in the experimental evaluation, all algorithms were configured with the same population size of 50 individuals and a maximum iteration budget of 1000 generations. Each benchmark function was independently optimized 30 times to obtain statistically reliable results and reduce the influence of stochastic factors. All simulations were performed using MATLAB R2023a on a workstation equipped with an Intel Core i7-10700F processor operating at 2.90 GHz and 8 GB of memory.
4.1. Global Optimization Benchmark Suite
To comprehensively evaluate the optimization performance of the proposed EHUA, the IEEE CEC2014 [
22] and IEEE CEC2020 [
23] benchmark test suites are adopted in this study. These benchmark suites are widely recognized as standard evaluation platforms for metaheuristic optimization algorithms and have been extensively utilized in the literature to assess the effectiveness, robustness, and convergence behavior of newly developed optimization methods. Due to their diverse landscape characteristics and varying levels of optimization difficulty, they provide a reliable basis for comparing different algorithms under unified experimental conditions.
The IEEE CEC2014 benchmark suite is composed of 30 representative optimization functions that cover several categories of search landscapes, including unimodal, multimodal, hybrid, and composition problems. These function categories provide different evaluation perspectives for optimization algorithms. In particular, unimodal functions primarily emphasize convergence behavior and solution refinement capability, whereas multimodal functions focus on the ability of an algorithm to perform effective global search and avoid premature trapping in local optima. In addition, hybrid and composition functions integrate multiple landscape characteristics and complex variable interactions, thereby creating significantly more challenging optimization environments for performance evaluation.
To further examine the applicability of EHUA to more complex optimization scenarios, the IEEE CEC2020 benchmark suite is also considered in this study. Compared with CEC2014, the CEC2020 test suite contains optimization problems with more complicated landscape structures, stronger inter-variable dependencies, and a higher degree of search difficulty. Such characteristics make it an effective platform for assessing the convergence efficiency, robustness, and adaptive search capability of advanced metaheuristic algorithms.
Both CEC2014 and CEC2020 have been extensively adopted as standard evaluation platforms in the fields of evolutionary computation and swarm intelligence. The combination of these two benchmark suites enables a comprehensive investigation of algorithmic performance from multiple perspectives, including optimization accuracy, convergence behavior, solution stability, and scalability. Therefore, they are selected as the primary experimental benchmarks for validating the effectiveness of EHUA.
Based on these benchmark environments, a series of comparative experiments are performed, and the obtained results are analyzed against those of several representative state-of-the-art metaheuristic algorithms. Through these comparisons, the optimization capability and competitiveness of the proposed EHUA can be systematically evaluated.
4.2. Competitor Algorithms and Parameter Setting
To assess the effectiveness of EHUA from multiple perspectives, including solution quality, convergence behavior, and search stability, a comparative study is conducted against nine representative metaheuristic optimization algorithms. The selected reference methods include the Fourier Transform Optimizer (FTO), Beaver Behavior Optimizer (BBO), Enterprise Development (ED), Information Acquisition Optimizer (IAO), Black-Winged Kite Algorithm (BKA), Dream Optimization Algorithm (DOA), Zebra Optimization Algorithm (ZOA), Newton Downhill Optimizer (NDO), and the original Human Urbanization Algorithm (HUA). These algorithms were chosen because they represent different search mechanisms and have demonstrated competitive performance in recent optimization studies. The parameter configurations adopted for all comparison methods are listed in
Table 5 for reference.
All statistical indicators were calculated from the unrounded final objective values obtained in 30 independent runs. Before each run, the random-number generator was independently initialized, and all algorithmic states were reset. No rounding, objective-value clipping, or post-processing was applied before calculating the mean and standard deviation. A standard deviation is reported as zero only when all 30 final values are numerically identical at double precision. For the near-zero cases in which the mean coincides with the known shifted optimum of the corresponding CEC function, all runs reached the optimum within a tolerance of .
4.3. Evaluation on the CEC2014 Global Optimization Test Suite
This section comprehensively evaluates the optimization performance of the proposed EHUA on the CEC2014 benchmark suite with problem dimensions of 30 and 50 and compares its performance against nine state-of-the-art optimization algorithms. The corresponding experimental results are reported in
Table 6 and
Table 7, where “mean” and “std” represent the mean and standard deviation obtained from 30 independent runs, respectively. These statistical indicators are employed to assess both the optimization accuracy and robustness of the compared algorithms.
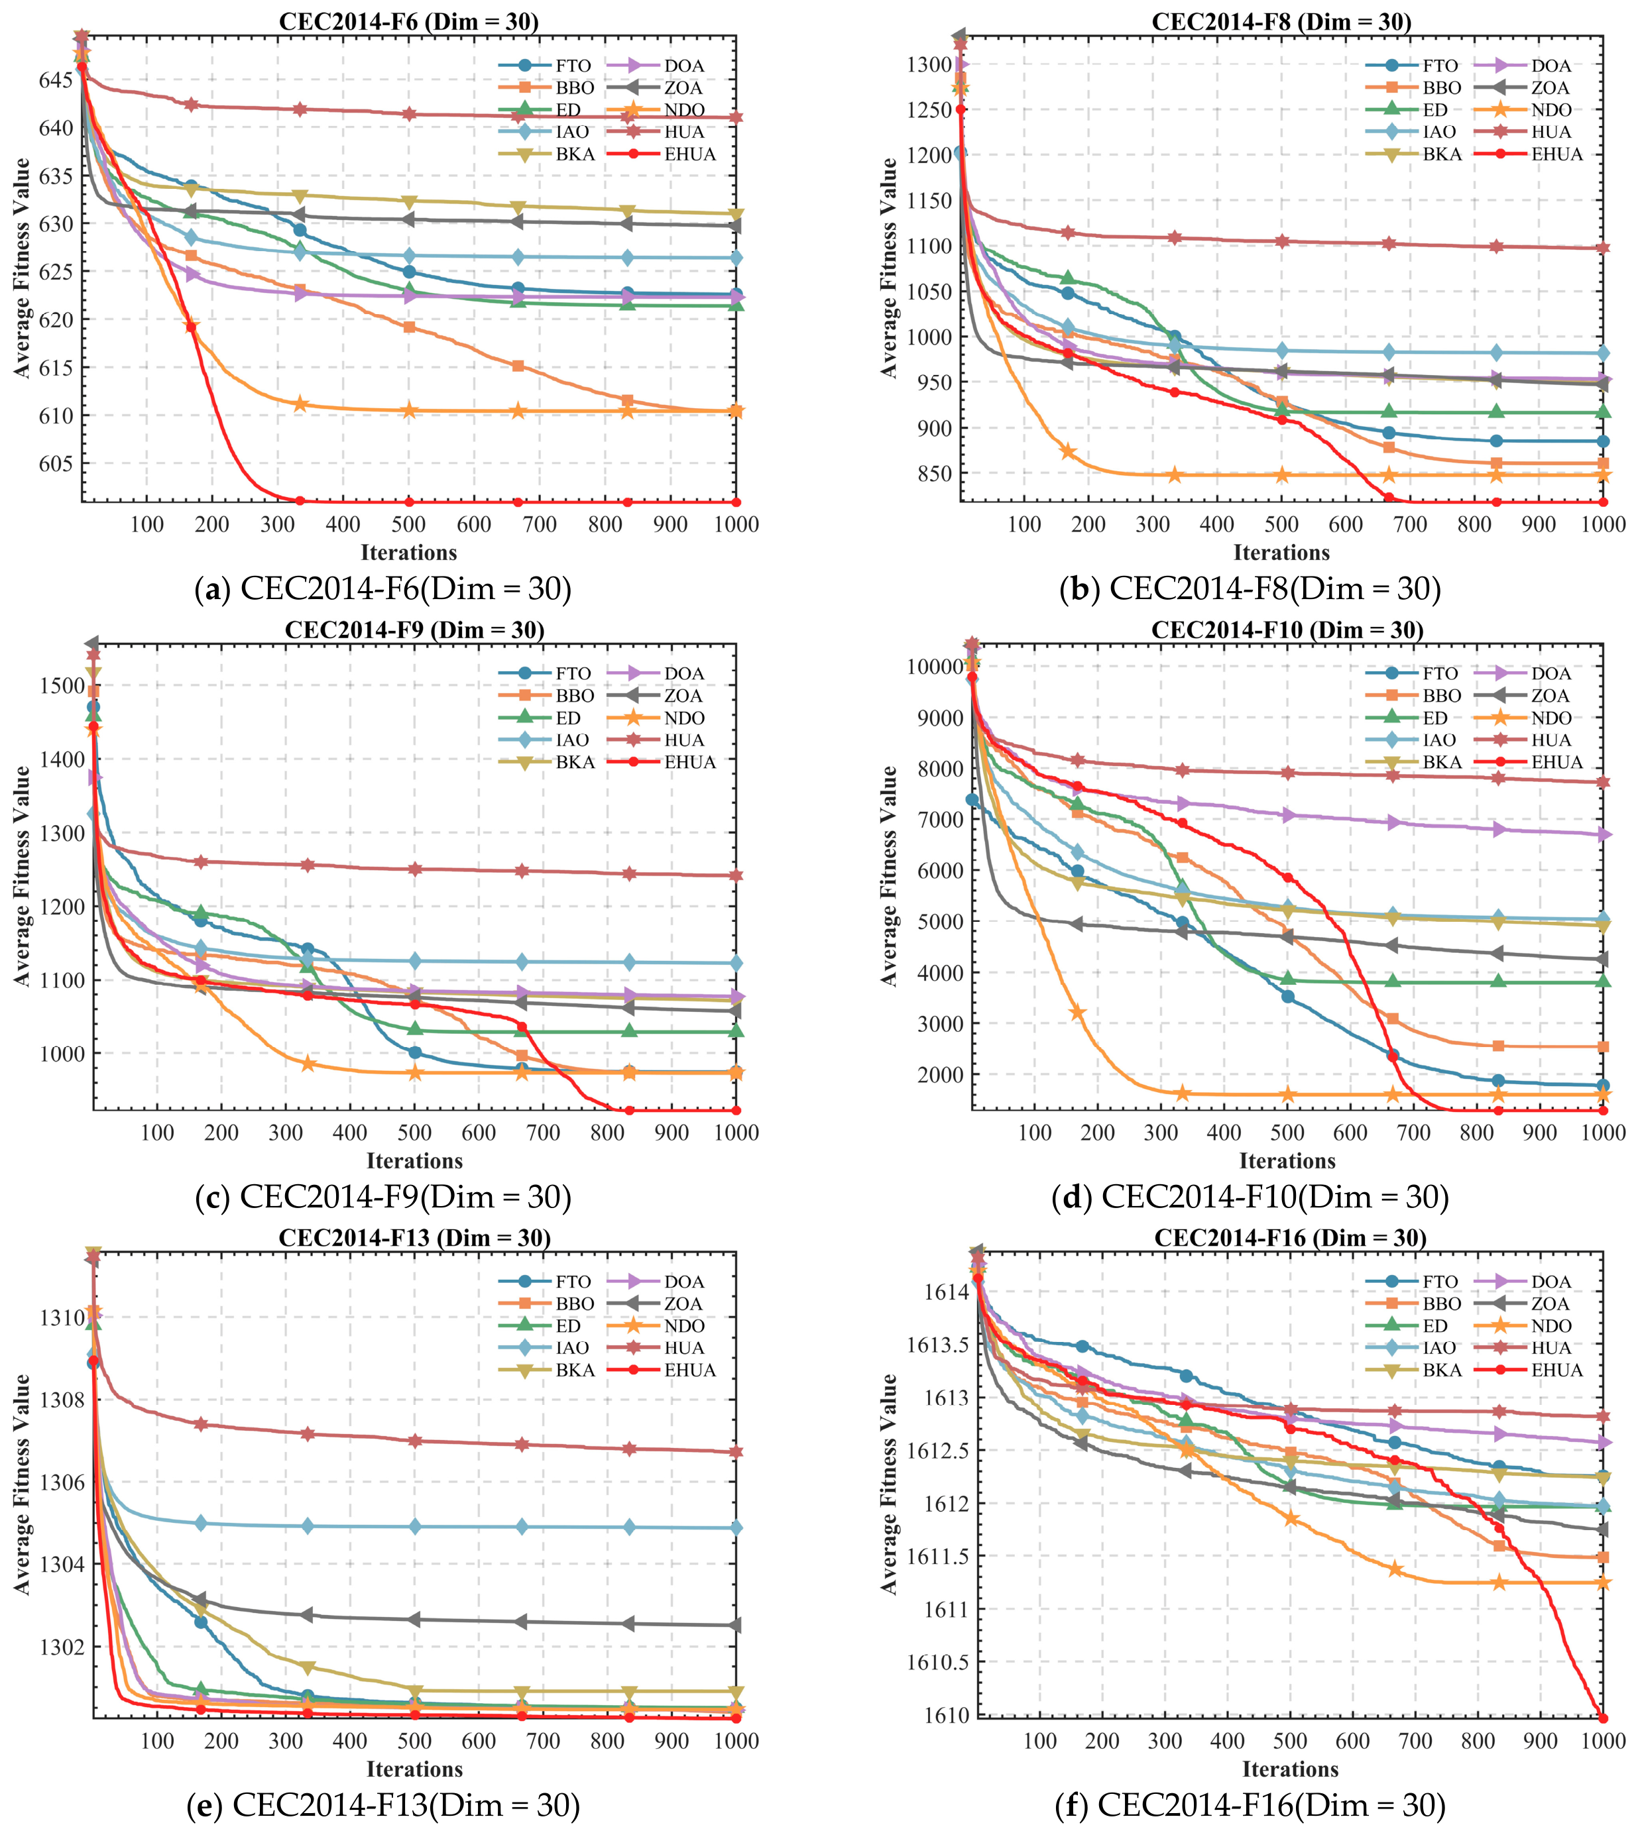
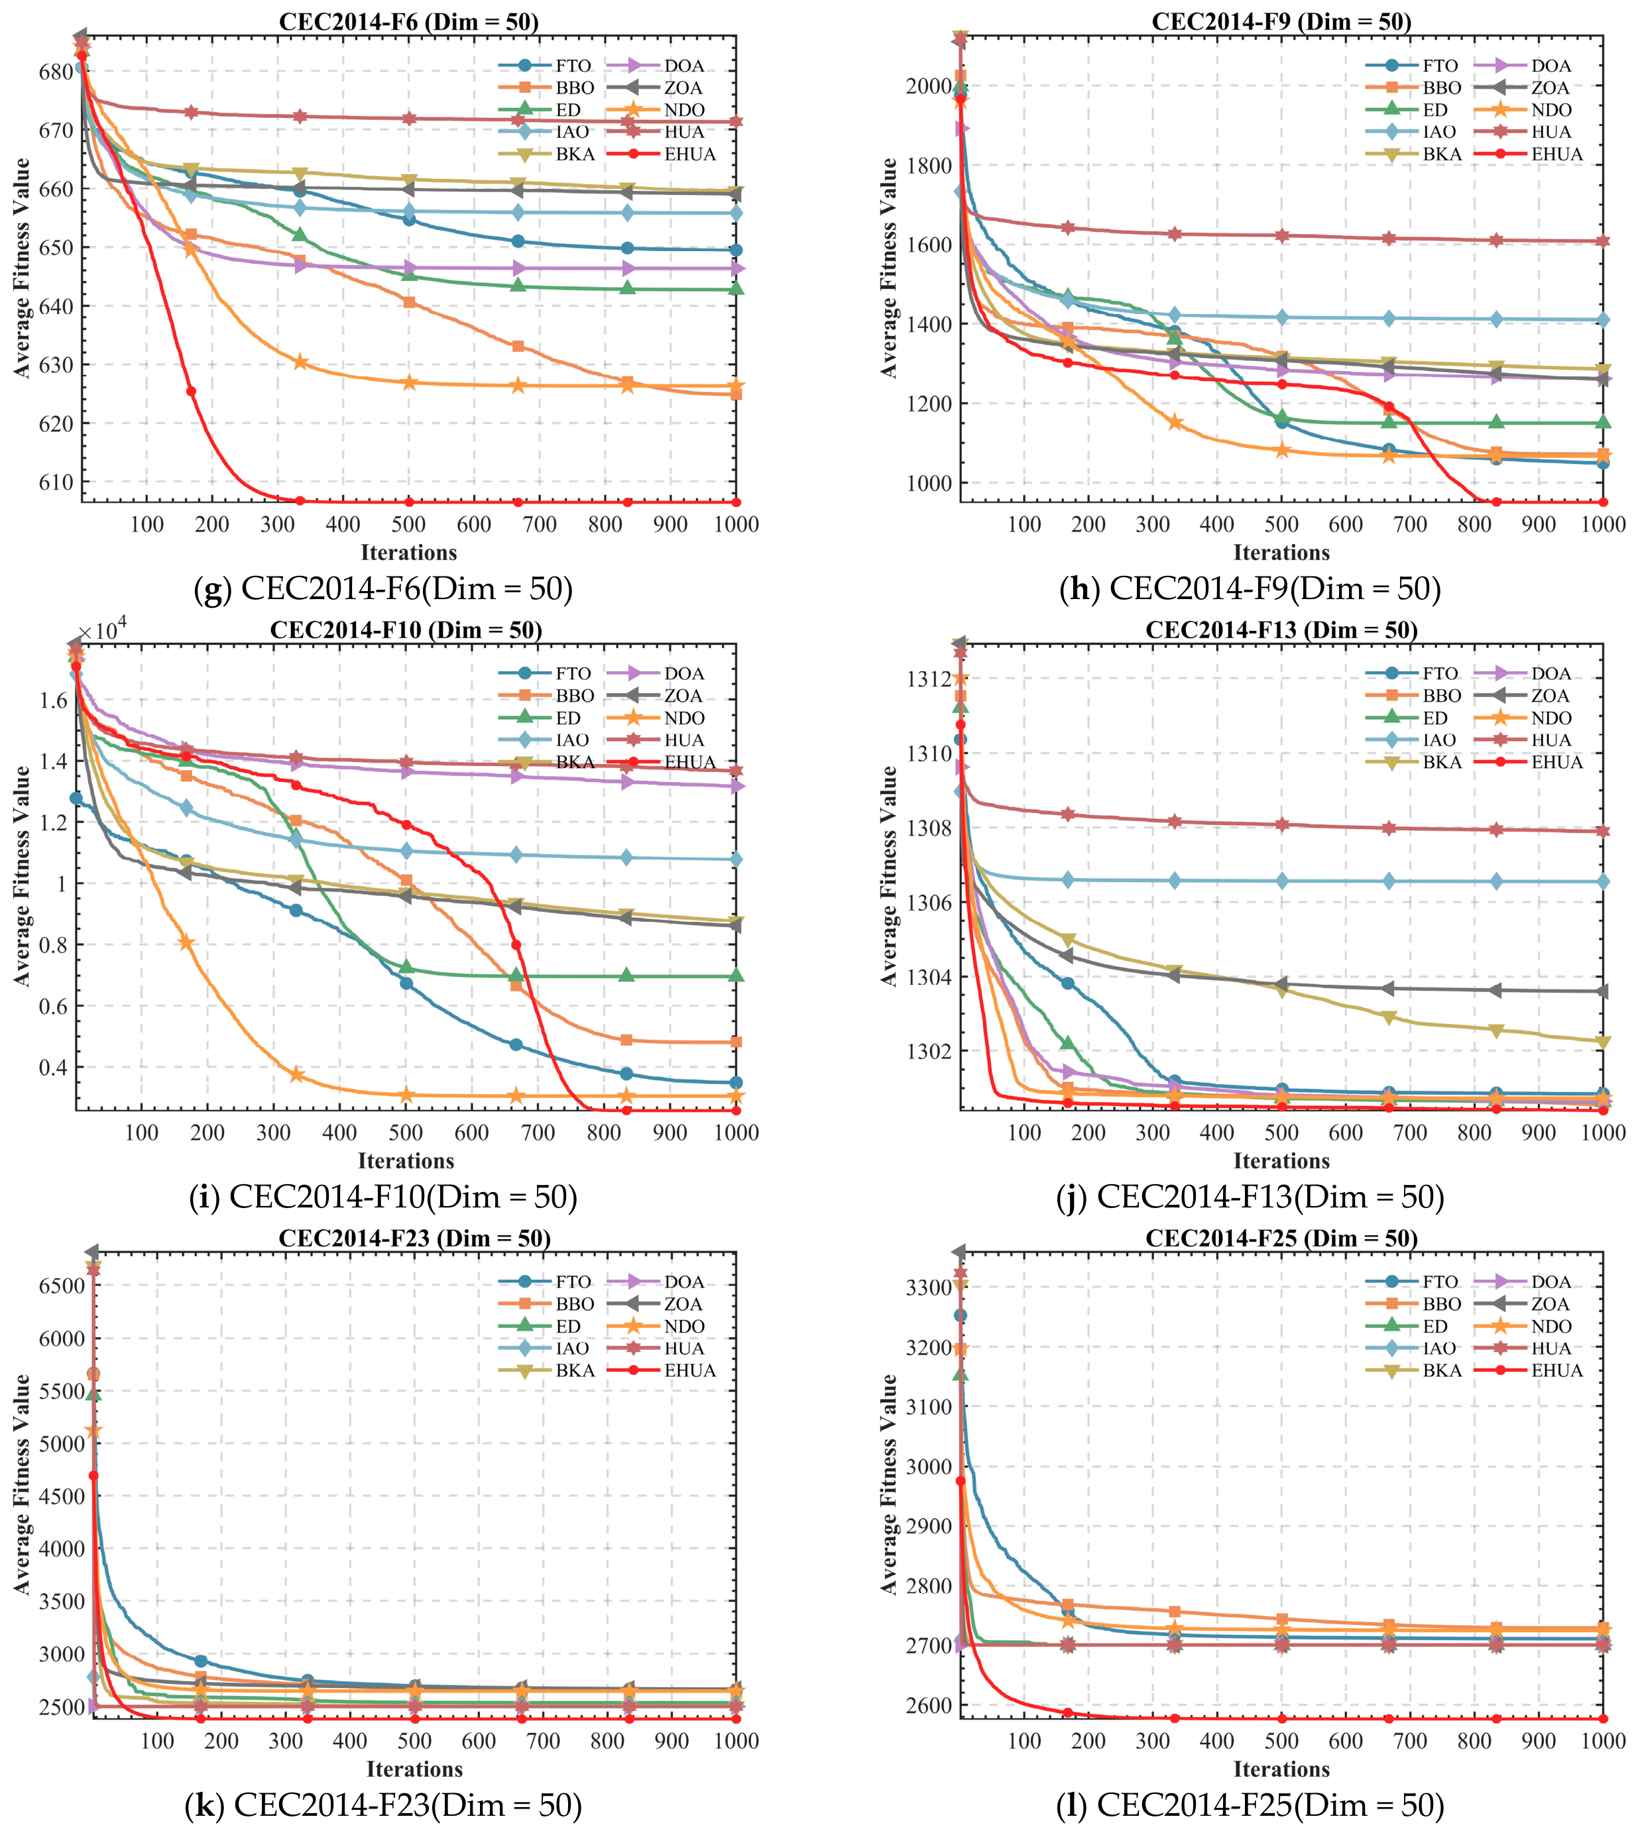
To provide a more intuitive comparison of the search behaviors and convergence characteristics of the competing algorithms, the convergence curves of all ten algorithms are illustrated in
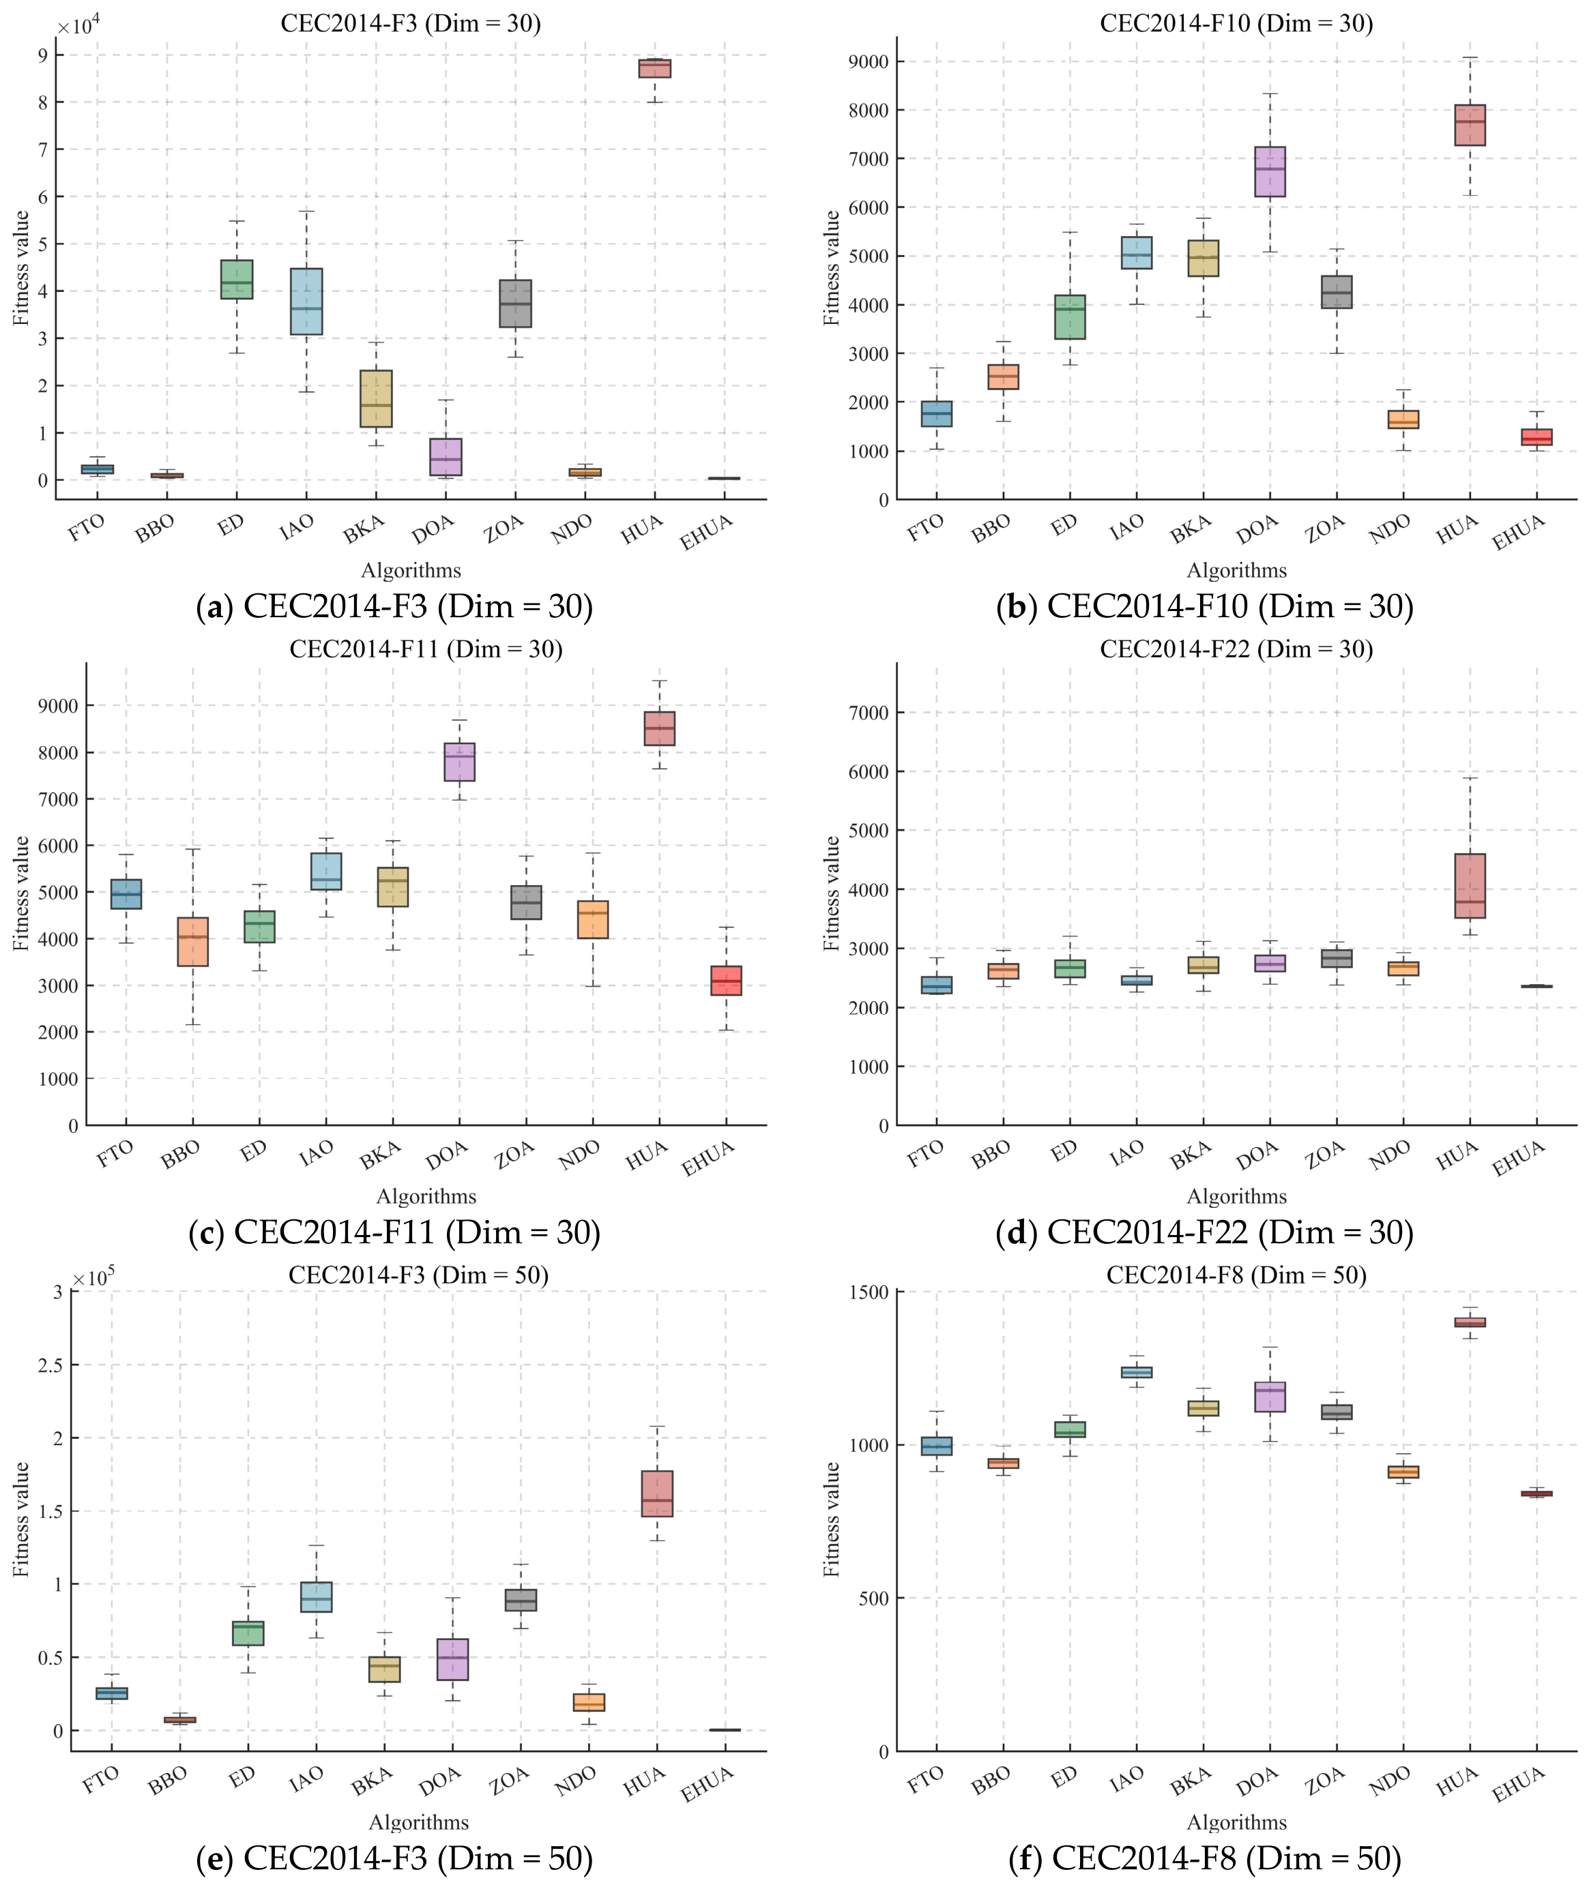
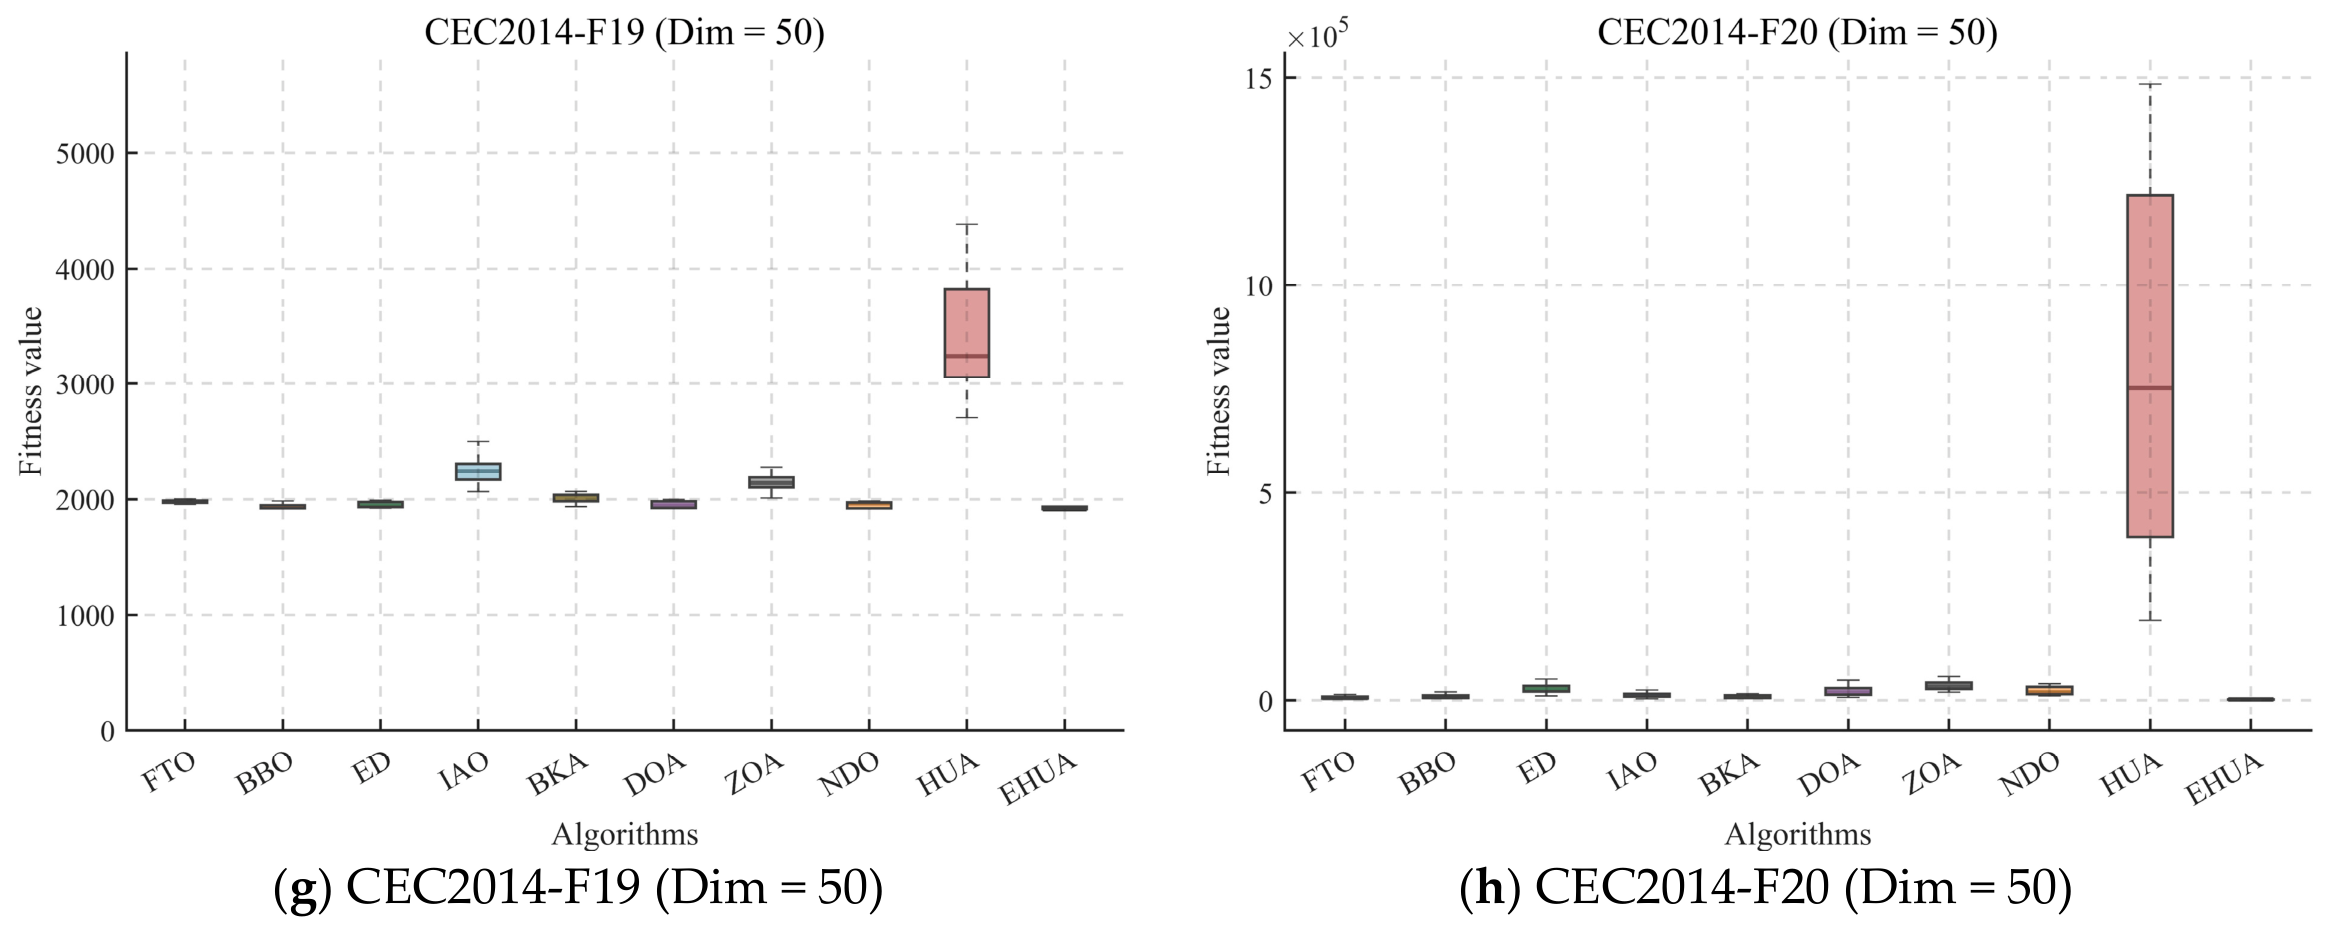
Figure 2. In addition, to further investigate the stability and distribution of the optimization results across multiple independent runs, box plots of the experimental results are presented in
Figure 3. Together, these analyses offer a comprehensive evaluation of the convergence performance, solution quality, robustness, and reliability of the proposed EHUA.
Figure 2 illustrates the convergence behaviors of the compared algorithms on representative CEC2014 benchmark functions under the 30- and 50-dimensional settings. In the 30-dimensional experiments, EHUA achieves the lowest final fitness values on the displayed functions F6, F8, F9, F10, F13, and F16. On F6 and F13, EHUA rapidly approaches high-quality regions during the early search stage, whereas on F9, F10, and F16, it continues to improve the candidate solutions during the middle and later iterations after several competing algorithms have already stagnated. Under the 50-dimensional setting, EHUA also obtains the best final results on the representative functions F6, F9, F10, F13, F23, and F25. In particular, the convergence curves on F9, F10, and F25 show that EHUA maintains continuous refinement in the later optimization stage and eventually reaches lower fitness levels than the other methods. Although the increase in dimensionality causes noticeable performance deterioration for several competing algorithms, EHUA retains favorable convergence trends and competitive search accuracy. These observations indicate that the proposed logistics-inspired mechanisms enhance population diversity, delay premature convergence, and improve the coordination between global exploration and local exploitation.
Figure 3 presents the box-plot distributions obtained from 30 independent runs on representative CEC2014 functions. EHUA generally produces lower median fitness values and relatively compact result distributions on the selected functions, demonstrating favorable optimization accuracy and repeatability. On F3 under both dimensional settings, the results generated by EHUA are highly concentrated near the best-known region, while several comparison algorithms exhibit considerably higher medians and wider distributions. Similar advantages can be observed on F10, F11, F22, F8, F19, and F20, where EHUA typically shows narrower interquartile ranges and fewer extreme deviations. By contrast, the original HUA and several other methods display larger boxes, longer whiskers, or more dispersed solutions on some functions, indicating greater sensitivity to random initialization and a higher probability of unstable convergence. Combined with the convergence curves in
Figure 2, the box-plot results demonstrate that EHUA not only achieves favorable convergence accuracy but also maintains relatively consistent optimization performance across repeated executions.
As reported in
Table 6, EHUA achieves the lowest mean fitness values on 20 of the 30 CEC2014 functions under the 30-dimensional setting, demonstrating strong overall competitiveness across different problem categories. Particularly notable advantages are observed on several unimodal, multimodal, and hybrid functions. For example, EHUA obtains a mean value of
on F1, which is substantially lower than
for FTO,
for DOA, and
for the original HUA. On F17, EHUA achieves
, whereas the best competing result is
, and HUA produces
. Favorable mean results are also obtained on F18, F20, and F21. In addition, EHUA exhibits relatively small standard deviations on several functions, indicating consistent outcomes across the independent runs; however, these deviations are interpreted together with the corresponding mean values rather than being treated alone as evidence of solution quality. EHUA does not rank first on every test function. In particular, several competing algorithms obtain lower mean fitness values on F24 and F25, and EHUA is also less competitive on several composition functions, including F27–F30. These observations show that the relative effectiveness of EHUA depends on the landscape characteristics of individual functions. Therefore, the results support the strong overall competitiveness of EHUA rather than universal superiority across all benchmark problems.
When the dimensionality increases to 50, EHUA again achieves the lowest mean fitness values on 20 of the 30 benchmark functions, indicating that its search capability remains effective in the enlarged solution space. It ranks first on F1–F4, F6–F11, F13, F15, F17–F23, and F25. In particular, EHUA obtains on F23, compared with the best competing value of , corresponding to an improvement of approximately 2.40%. On F25, EHUA reaches , whereas the best competing algorithms obtain , representing an improvement of approximately 4.44%. The standard deviation of EHUA on F23 is . Based on the unrounded results from the independent runs, this near-zero value indicates that the final objective values differ only at the numerical precision level; nevertheless, it is interpreted jointly with the corresponding mean value and is not used independently to establish optimization superiority. Strong mean-performance advantages are also observed on F1, F3, F17, F20, and F21, confirming the effectiveness of EHUA on several difficult high-dimensional functions. However, EHUA remains less competitive on some composition functions, including F24 and F26–F30. Overall, the numerical results demonstrate that EHUA provides favorable optimization accuracy, repeatability, and scalability across a broad range of CEC2014 problems, while also revealing several complex landscapes on which further improvement remains necessary.
4.4. Evaluation on the CEC2020 Global Optimization Test Suite
To further validate the effectiveness of EHUA on more challenging optimization tasks, experiments are conducted on the IEEE CEC2020 benchmark suite with problem dimensions of 10 and 20. The numerical results are summarized in
Table 8 and
Table 9, where the average objective value (mean) and standard deviation (std) are calculated from 30 independent executions. These statistical measures are adopted to evaluate the optimization capability and result consistency of the competing algorithms. Furthermore, convergence curves and box-plot analyses are employed to provide additional insights into the search dynamics and stability characteristics of different methods.
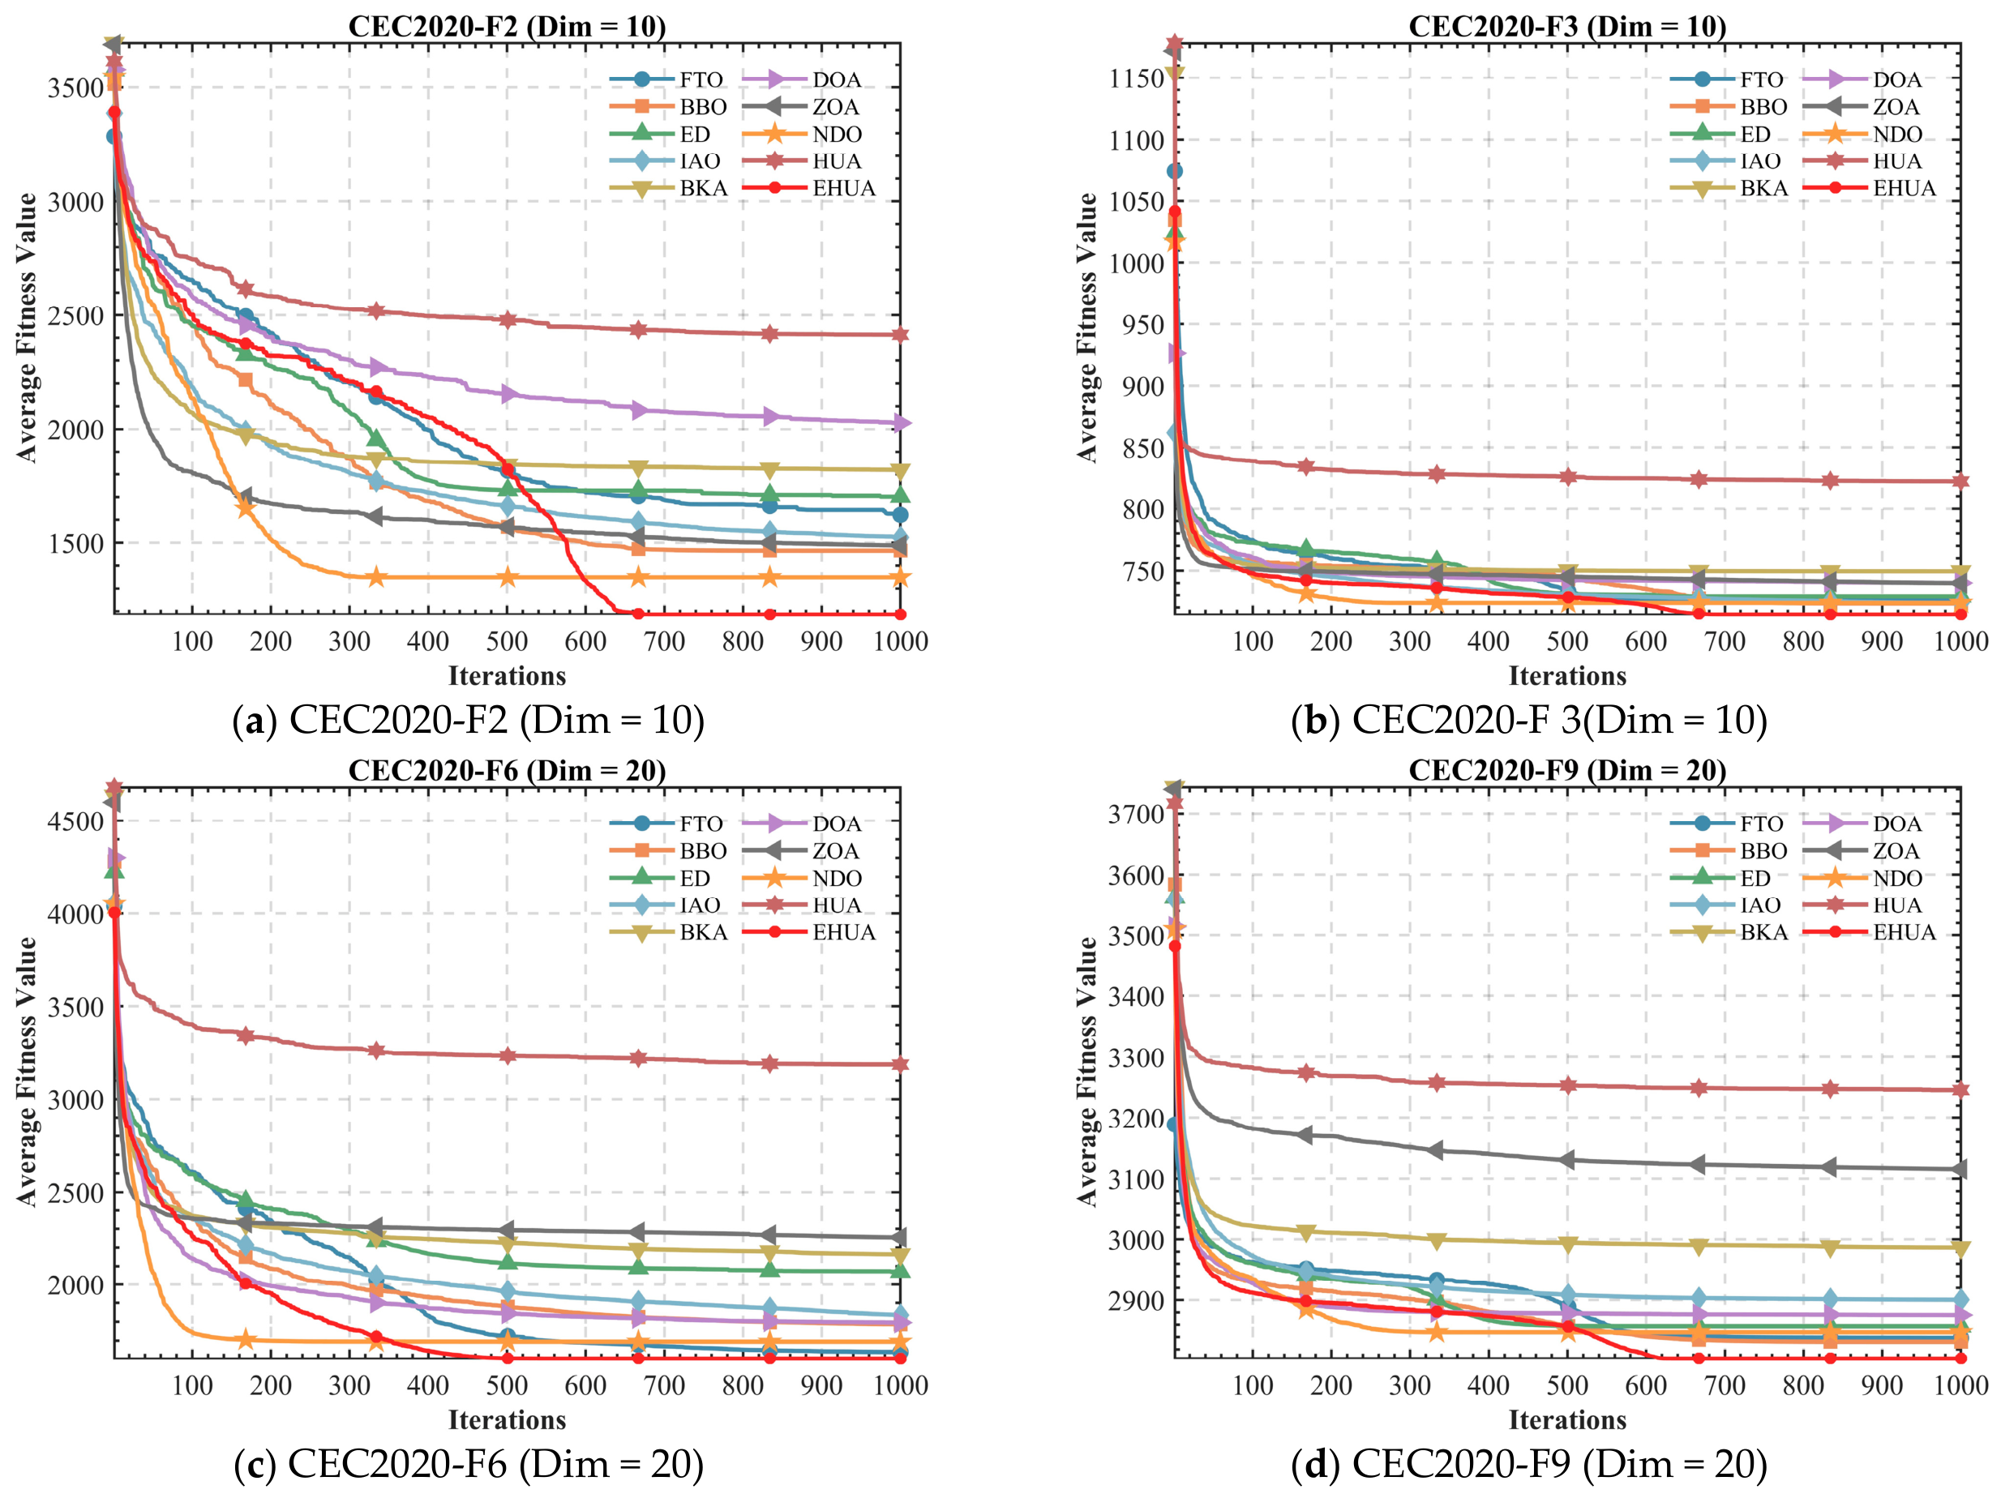
Figure 4 compares the convergence processes of the algorithms on four representative CEC2020 functions. For F2 under the 10-dimensional setting, EHUA does not obtain the lowest fitness value during the early iterations; however, it continues to refine the solution after several competing algorithms have entered stagnation and eventually reaches the lowest final mean value of
. On F3, EHUA rapidly approaches a high-quality region during the initial search stage and subsequently maintains gradual improvement, yielding a final mean value of
. Similar convergence characteristics are observed in the 20-dimensional experiments. On F6, EHUA combines a rapid initial decrease with stable later-stage refinement and obtains the lowest mean value of
. On F9, its convergence curve remains below those of the competing methods during the later iterations and finally reaches
. By contrast, the original HUA stagnates at relatively high fitness levels on all four representative functions. These convergence profiles indicate that EHUA benefits not only from effective early exploration but also from sustained exploitation in the middle and later stages, which reduces premature stagnation and improves final solution accuracy.
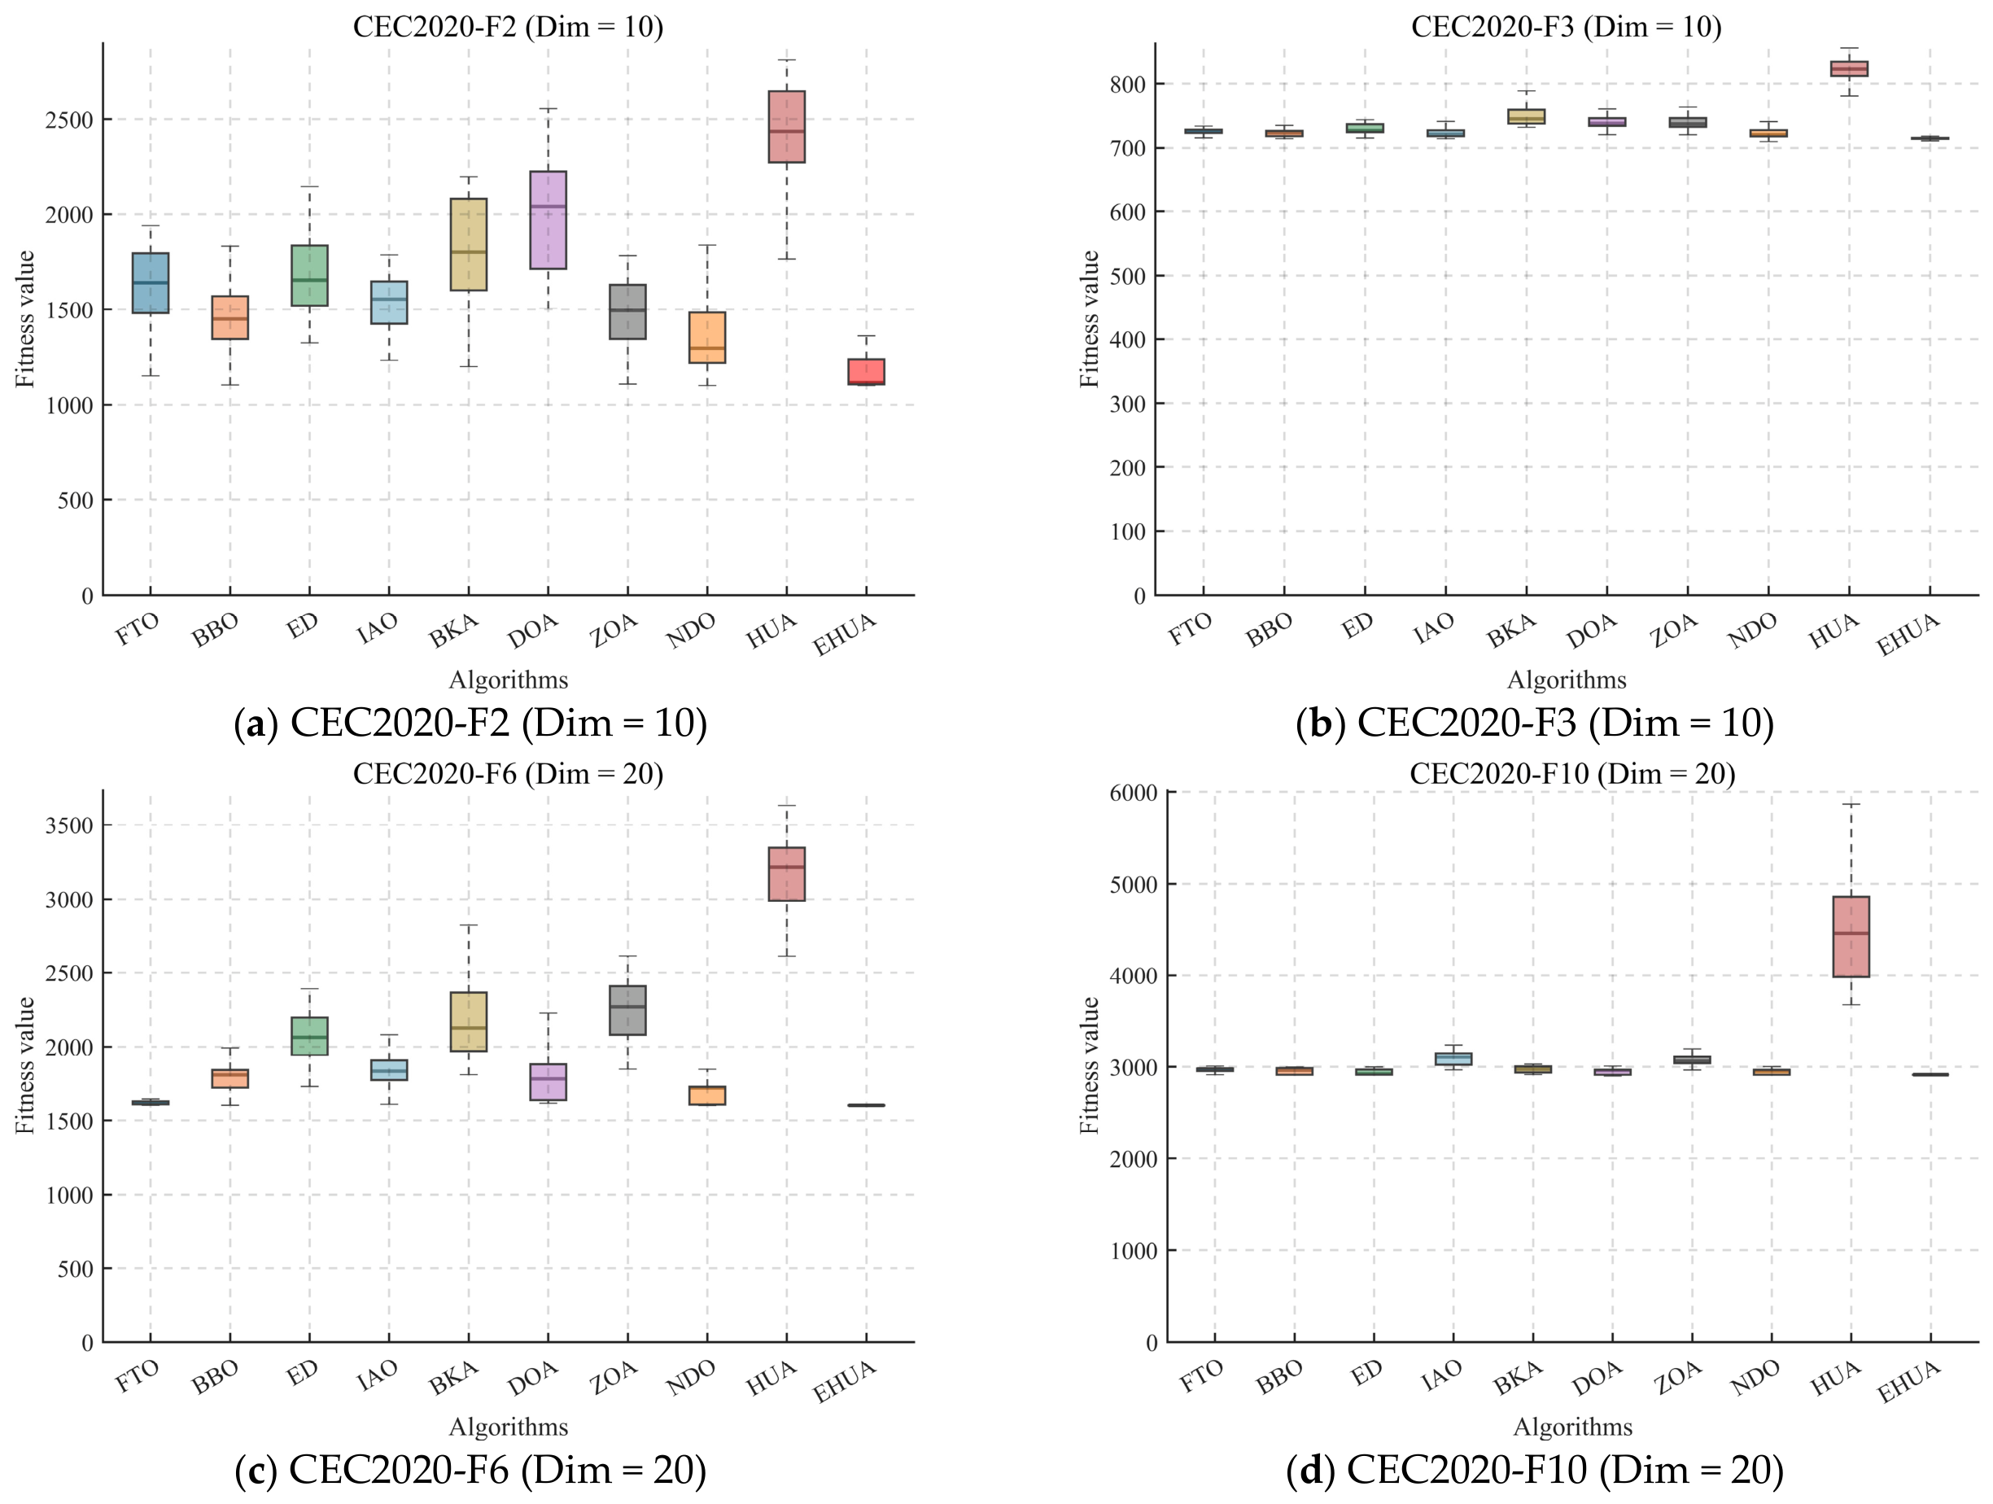
Figure 5 further examines the distributions of the results obtained from 30 independent runs. On F2 with
, EHUA produces the lowest median and a relatively compact interquartile range, whereas HUA and several competing algorithms exhibit higher central values and wider result distributions. On F3, the EHUA results are concentrated near
, with a standard deviation of only
, confirming its strong repeatability on this function. Under the 20-dimensional setting, similarly concentrated distributions are observed for EHUA on F6 and F10. In particular, EHUA obtains standard deviations of
and
, respectively, while HUA records much larger values of
and
. The narrow boxes and short whiskers of EHUA therefore indicate that its favorable mean performance is not produced by a small number of exceptional runs but is maintained consistently across repeated executions. The box-plot results complement the convergence analysis by confirming improved accuracy and reduced sensitivity to stochastic variation.
The numerical results in
Table 8 show that EHUA achieves the lowest or tied-best mean fitness value on 8 of the 10 CEC2020 functions under the 10-dimensional setting, demonstrating strong overall competitiveness across different problem landscapes. On F1, both EHUA and IAO reach the known optimum of
, while the standard deviation reported for EHUA is zero. Examination of the unrounded results confirms that the 30 independent runs produced numerically identical final values at double-precision accuracy; therefore, this zero deviation reflects repeatable convergence rather than table rounding. Clear advantages are also observed on F2, where EHUA obtains
, compared with
for the second-best NDO and
for the original HUA. EHUA further ranks first on F3–F7 and F10. For example, its mean values on F5 and F7 are
and
, respectively, both lower than those of the nearest competitors. In addition, EHUA records the smallest standard deviation on eight functions, indicating consistent performance across repeated runs; however, these deviations are interpreted jointly with the corresponding mean values rather than being used alone as evidence of solution quality. EHUA does not rank first on F8 and F9, where FTO and IAO obtain the best mean results, respectively. Thus, the 10-dimensional results demonstrate strong overall competitiveness rather than uniform superiority on every individual function.
As the dimension increases to 20, the advantage of EHUA becomes more consistent. According to
Table 9, EHUA obtains the lowest mean fitness value on all 10 CEC2020 functions and also records the smallest standard deviation in each case. On F2, EHUA achieves
, compared with
for the second-ranked NDO. On F5, its mean value of
is substantially lower than the nearest competing result of
obtained by IAO. Similarly, EHUA reaches
on F7, whereas IAO obtains
. Zero or near-zero standard deviations are observed on F1, F8, and F10. These values were calculated from the unrounded results of 30 independent runs and indicate that the final objective values are identical or differ only at the numerical precision level. Nevertheless, such small deviations are interpreted together with their corresponding mean values and known optima, since repeatability alone does not necessarily imply superior solution quality. In contrast, the original HUA exhibits more pronounced performance degradation as the dimension increases, producing larger mean values and greater result variation on functions such as F1, F5, F7, and F10. Taken together, these results indicate that the logistics-hub-guided exploration, dynamic supply–demand redistribution, and cooperative delivery exploitation mechanisms improve population diversity and solution refinement, enabling EHUA to maintain favorable optimization accuracy and repeatability in the more complex 20-dimensional search space.
4.5. Statistical Analysis
Due to the population-based and stochastic nature of metaheuristic optimization algorithms, performance evaluations based solely on descriptive statistics, such as mean and standard deviation values, may not fully reflect the actual differences among competing methods. Variations observed in experimental results can be influenced by random initialization and probabilistic search behaviors, making it necessary to employ additional statistical tools to determine whether the observed performance gaps are meaningful. Consequently, statistical analysis plays an important role in assessing the consistency, robustness, and effectiveness of optimization algorithms from a more rigorous perspective.
To provide a more comprehensive evaluation of EHUA, two widely adopted non-parametric statistical methods are employed in this study, namely the Wilcoxon signed-rank test and the Friedman mean rank test. The Wilcoxon signed-rank test is utilized to examine pairwise performance differences between EHUA and each comparison algorithm, thereby identifying whether the observed improvements are statistically significant. Meanwhile, the Friedman mean rank test is conducted to analyze the overall ranking performance of all algorithms across the benchmark functions. By combining these complementary statistical measures, a more objective assessment of the competitiveness and reliability of EHUA can be obtained.
4.5.1. Wilcoxon Signed-Rank Test
The Wilcoxon signed-rank test is a non-parametric statistical approach frequently adopted to examine performance differences between optimization algorithms [
32]. Compared with conventional parametric methods, this test does not rely on assumptions regarding data normality, making it particularly suitable for analyzing the stochastic outcomes produced by metaheuristic optimization techniques. Due to its effectiveness in identifying meaningful performance differences, the Wilcoxon test has been extensively employed in evolutionary computation and swarm intelligence studies as a standard statistical validation tool.
To further assess the effectiveness of EHUA, pairwise Wilcoxon signed-rank tests are performed between EHUA and each competing algorithm across all benchmark functions. In the present study, the significance threshold is set to 0.05. A p-value below this threshold indicates that the observed difference between two algorithms is unlikely to have occurred by chance and can therefore be regarded as statistically significant. By incorporating this statistical analysis, the experimental evaluation extends beyond numerical comparisons and provides a more rigorous assessment of algorithm performance.
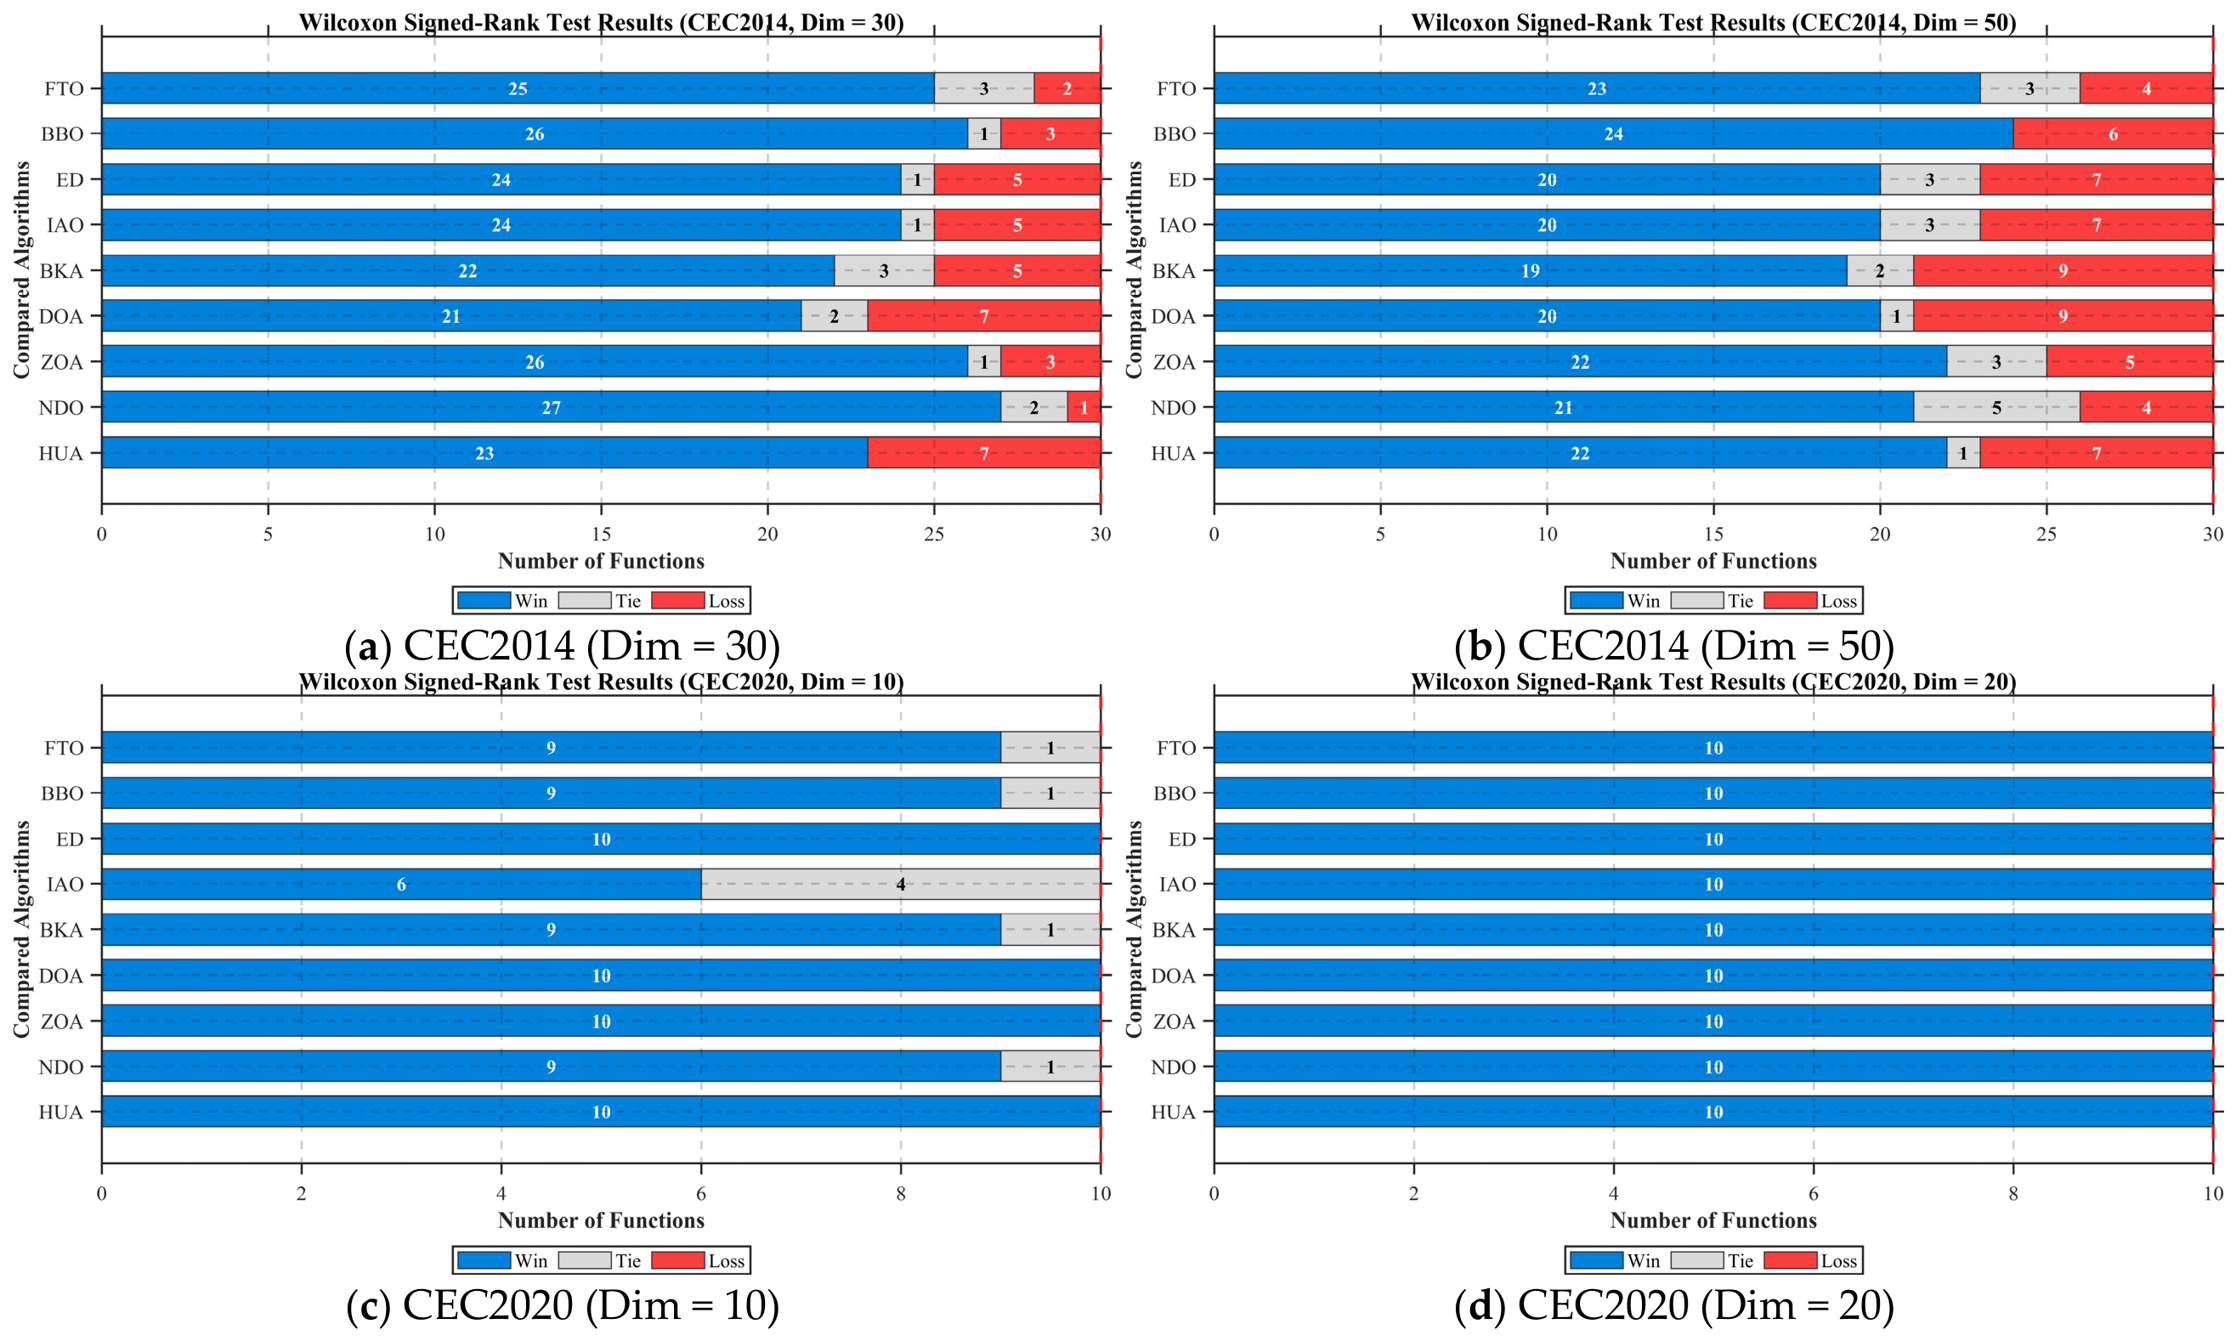
Figure 6 presents the win–tie–loss results obtained using the Wilcoxon signed-rank test at the 0.05 significance level. On the 30-dimensional CEC2014 benchmark, EHUA achieves more statistically significant wins than losses against all comparison algorithms. In particular, it records 27/2/1 against NDO, 26/1/3 against both BBO and ZOA, and 25/3/2 against FTO. Compared with the original HUA, EHUA obtains 23 wins and seven losses, indicating that the proposed enhancement mechanisms substantially improve the overall optimization capability of the original algorithm, although the advantage is not observed on every function. When the dimensionality increases to 50, EHUA continues to maintain a favorable win–tie–loss distribution, achieving 24/0/6 against BBO, 23/3/4 against FTO, and 22/3/5 against ZOA. Nevertheless, the number of losses increases for several algorithms, particularly BKA and DOA, suggesting that some high-dimensional CEC2014 functions remain challenging for EHUA. More pronounced advantages are observed on the CEC2020 benchmark. Under the 10-dimensional setting, EHUA achieves complete wins against ED, DOA, ZOA, and HUA, while obtaining nine wins and one tie against FTO, BBO, BKA, and NDO; even against IAO, it records six wins and four ties without any loss. Under the 20-dimensional setting, EHUA achieves 10 wins, zero ties, and zero losses against all nine competing algorithms. Overall, the statistical results confirm the strong competitiveness and robustness of EHUA across different benchmark suites and dimensional settings, while also showing that its superiority on CEC2014 is broad but not universal.
4.5.2. Friedman Mean Rank Test
The Friedman mean rank test is a non-parametric statistical technique commonly employed to compare the relative performance of multiple optimization algorithms across a collection of benchmark problems [
33]. In contrast to pairwise statistical methods, the Friedman test evaluates all candidate algorithms simultaneously by ranking their performance on each benchmark function and subsequently calculating an average ranking score. Owing to its independence from distributional assumptions and its suitability for analyzing stochastic optimization results, the Friedman test has become a standard tool for performance assessment in evolutionary computation and swarm intelligence studies.
To obtain a more comprehensive understanding of the relative performance of EHUA, the Friedman mean rank test is conducted in this work. For each benchmark function, all competing algorithms are ordered according to their optimization results, with lower ranking values corresponding to better performance. The average ranking score across all test functions is then computed to characterize the overall competitiveness of each algorithm. Through this ranking-based analysis, the effectiveness of EHUA can be evaluated from a broader statistical perspective beyond direct numerical comparisons.
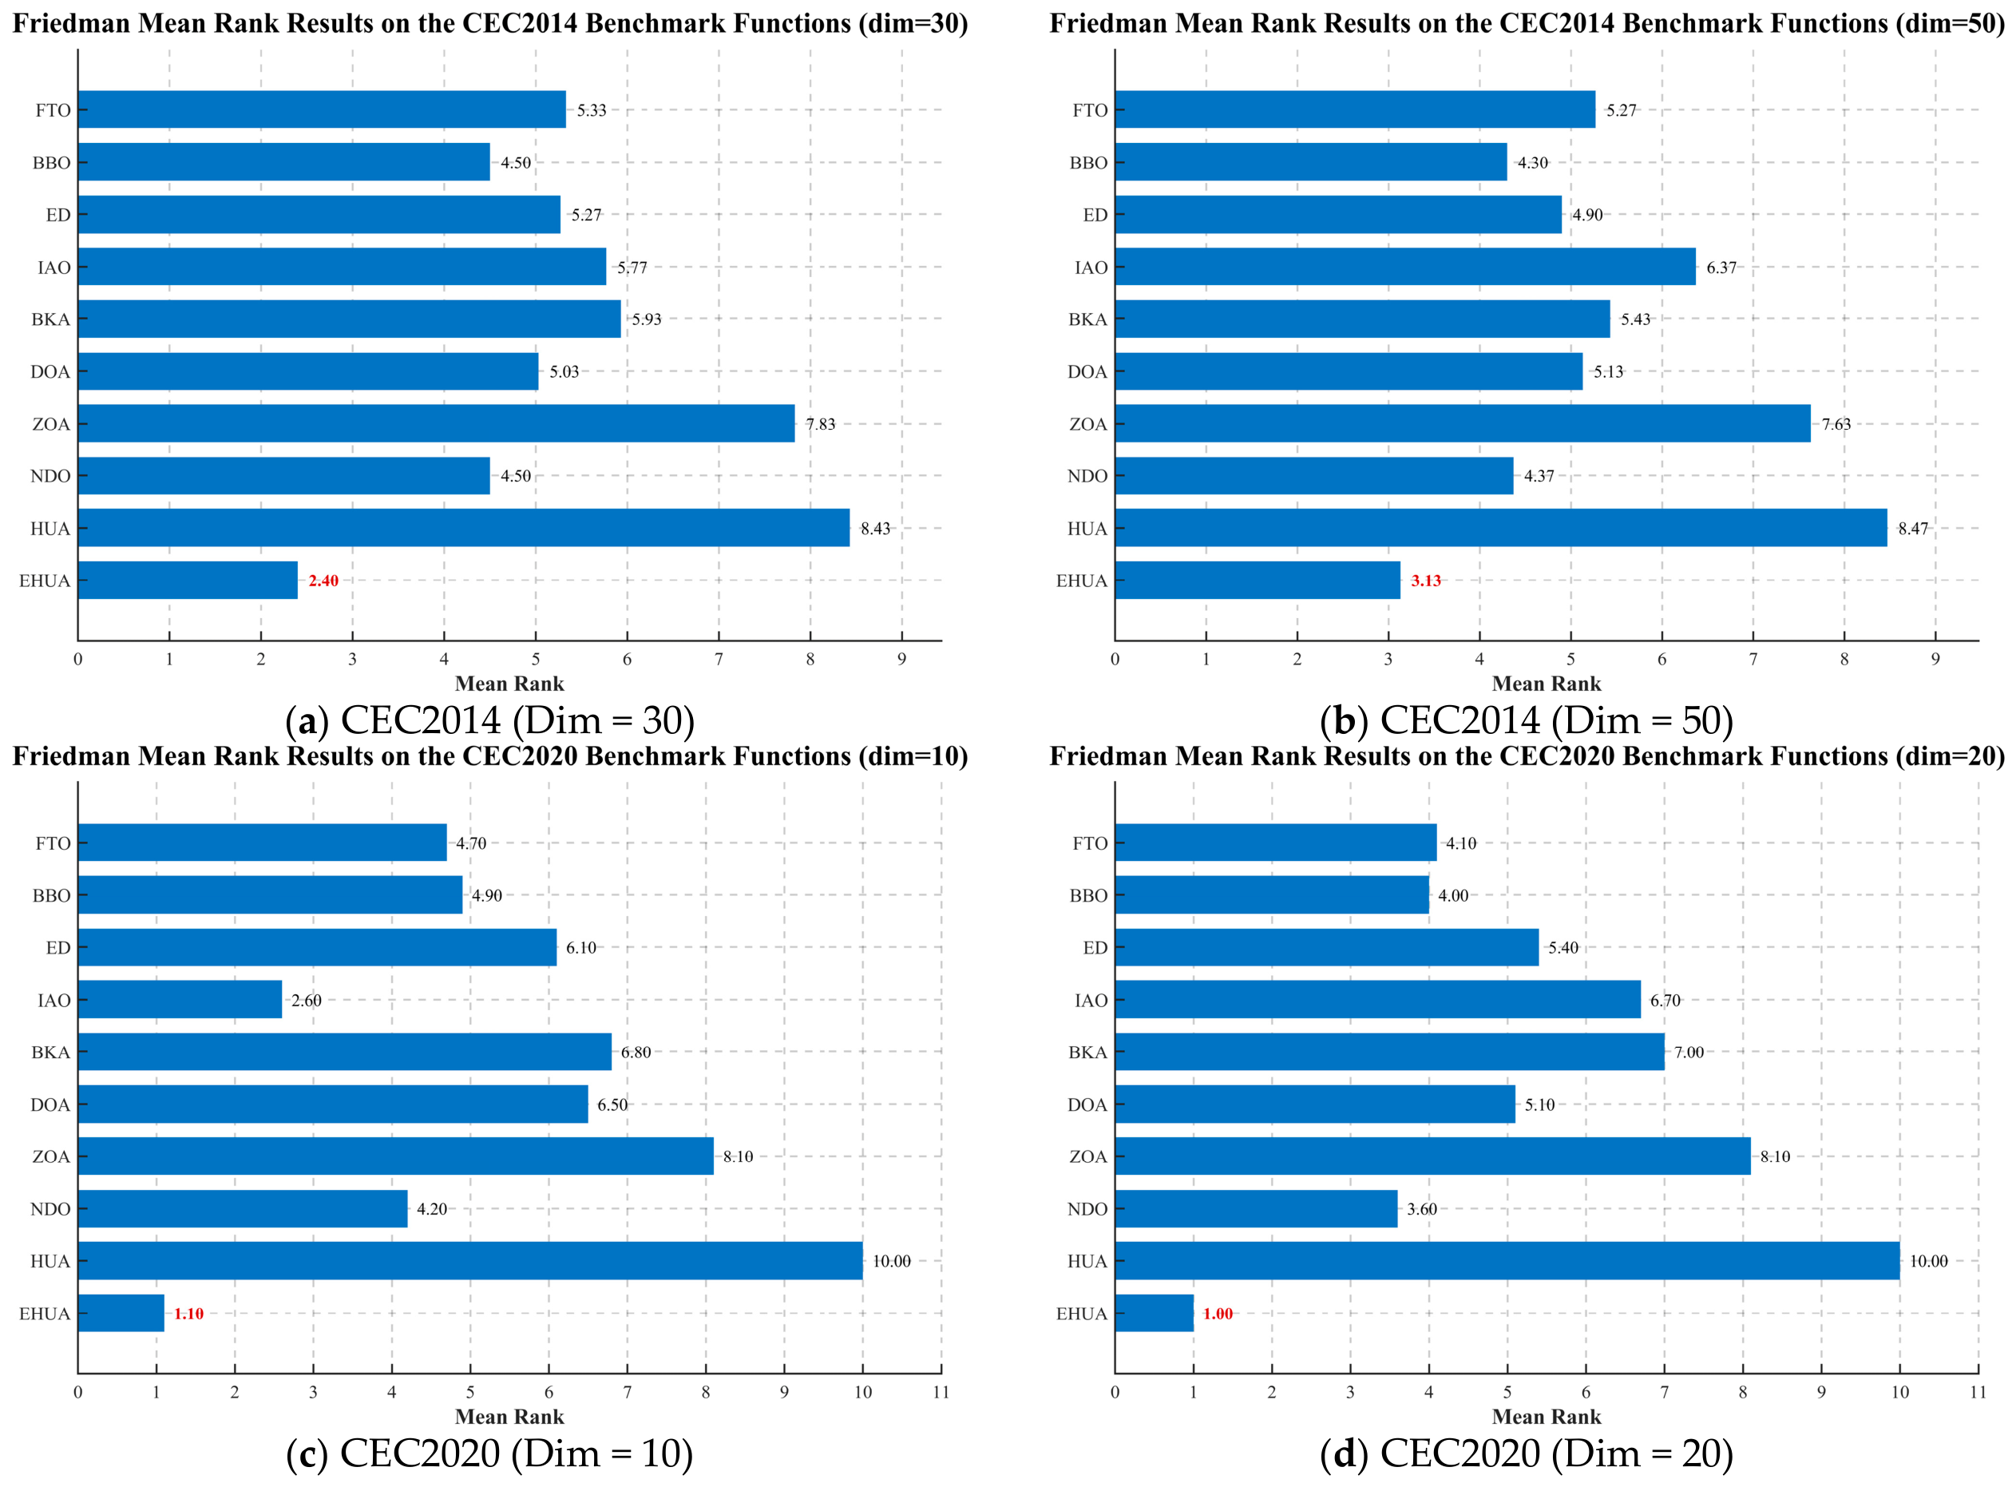
The Friedman ranking results for the CEC2014 and CEC2020 benchmark suites are presented in
Figure 7. It is evident that EHUA consistently occupies the leading position under all experimental settings. On the CEC2014 benchmark suite, EHUA achieves average ranks of 2.40 and 3.13 in the 30-dimensional and 50-dimensional cases, respectively, maintaining a clear advantage over the remaining algorithms. On the CEC2020 benchmark suite, the ranking performance of EHUA is further improved, yielding mean ranks of 1.10 and 1.00 for the 10-dimensional and 20-dimensional scenarios, respectively. These results indicate that EHUA attains the highest ranking on nearly all benchmark functions. By comparison, the original HUA records substantially larger ranking values, ranging from 8.43 to 10.00, reflecting a noticeably weaker optimization capability.
Another noteworthy observation is that the ranking performance of EHUA remains highly stable as the problem dimension increases. Such behavior demonstrates that the proposed algorithm possesses strong scalability and maintains its effectiveness under increasingly complex optimization conditions. The consistently favorable ranking results across both benchmark suites indicate that EHUA performs reliably on a wide variety of optimization landscapes, including unimodal, multimodal, hybrid, and composition functions. Consequently, the Friedman analysis provides further statistical support for the competitiveness, robustness, and adaptability of EHUA in addressing challenging global optimization problems.
4.6. Ablation Study Analysis
For a multistrategy metaheuristic algorithm, comparisons with other algorithms can demonstrate its overall competitiveness, but they cannot clearly determine whether the observed performance improvement is produced by each individual strategy or by their cooperative interaction. Therefore, an ablation study is necessary to evaluate the independent and combined contributions of the logistics-hub-guided adaptive exploration strategy, the dynamic supply–demand redistribution strategy, and the cooperative logistics delivery exploitation strategy introduced in EHUA. By selectively removing each mechanism and comparing the resulting variants with the original HUA and the complete EHUA, the effects of different strategies on population diversity, exploration–exploitation balance, convergence accuracy, and optimization stability can be quantitatively examined. Such an analysis not only reveals the functional role and complementarity of each enhancement mechanism but also excludes the possibility that the overall improvement is caused merely by stochastic variation, thereby strengthening the interpretability, reliability, and methodological credibility of the proposed EHUA framework. In this subsection, we describe an ablation study on EHUA; the specific experimental results are presented below.
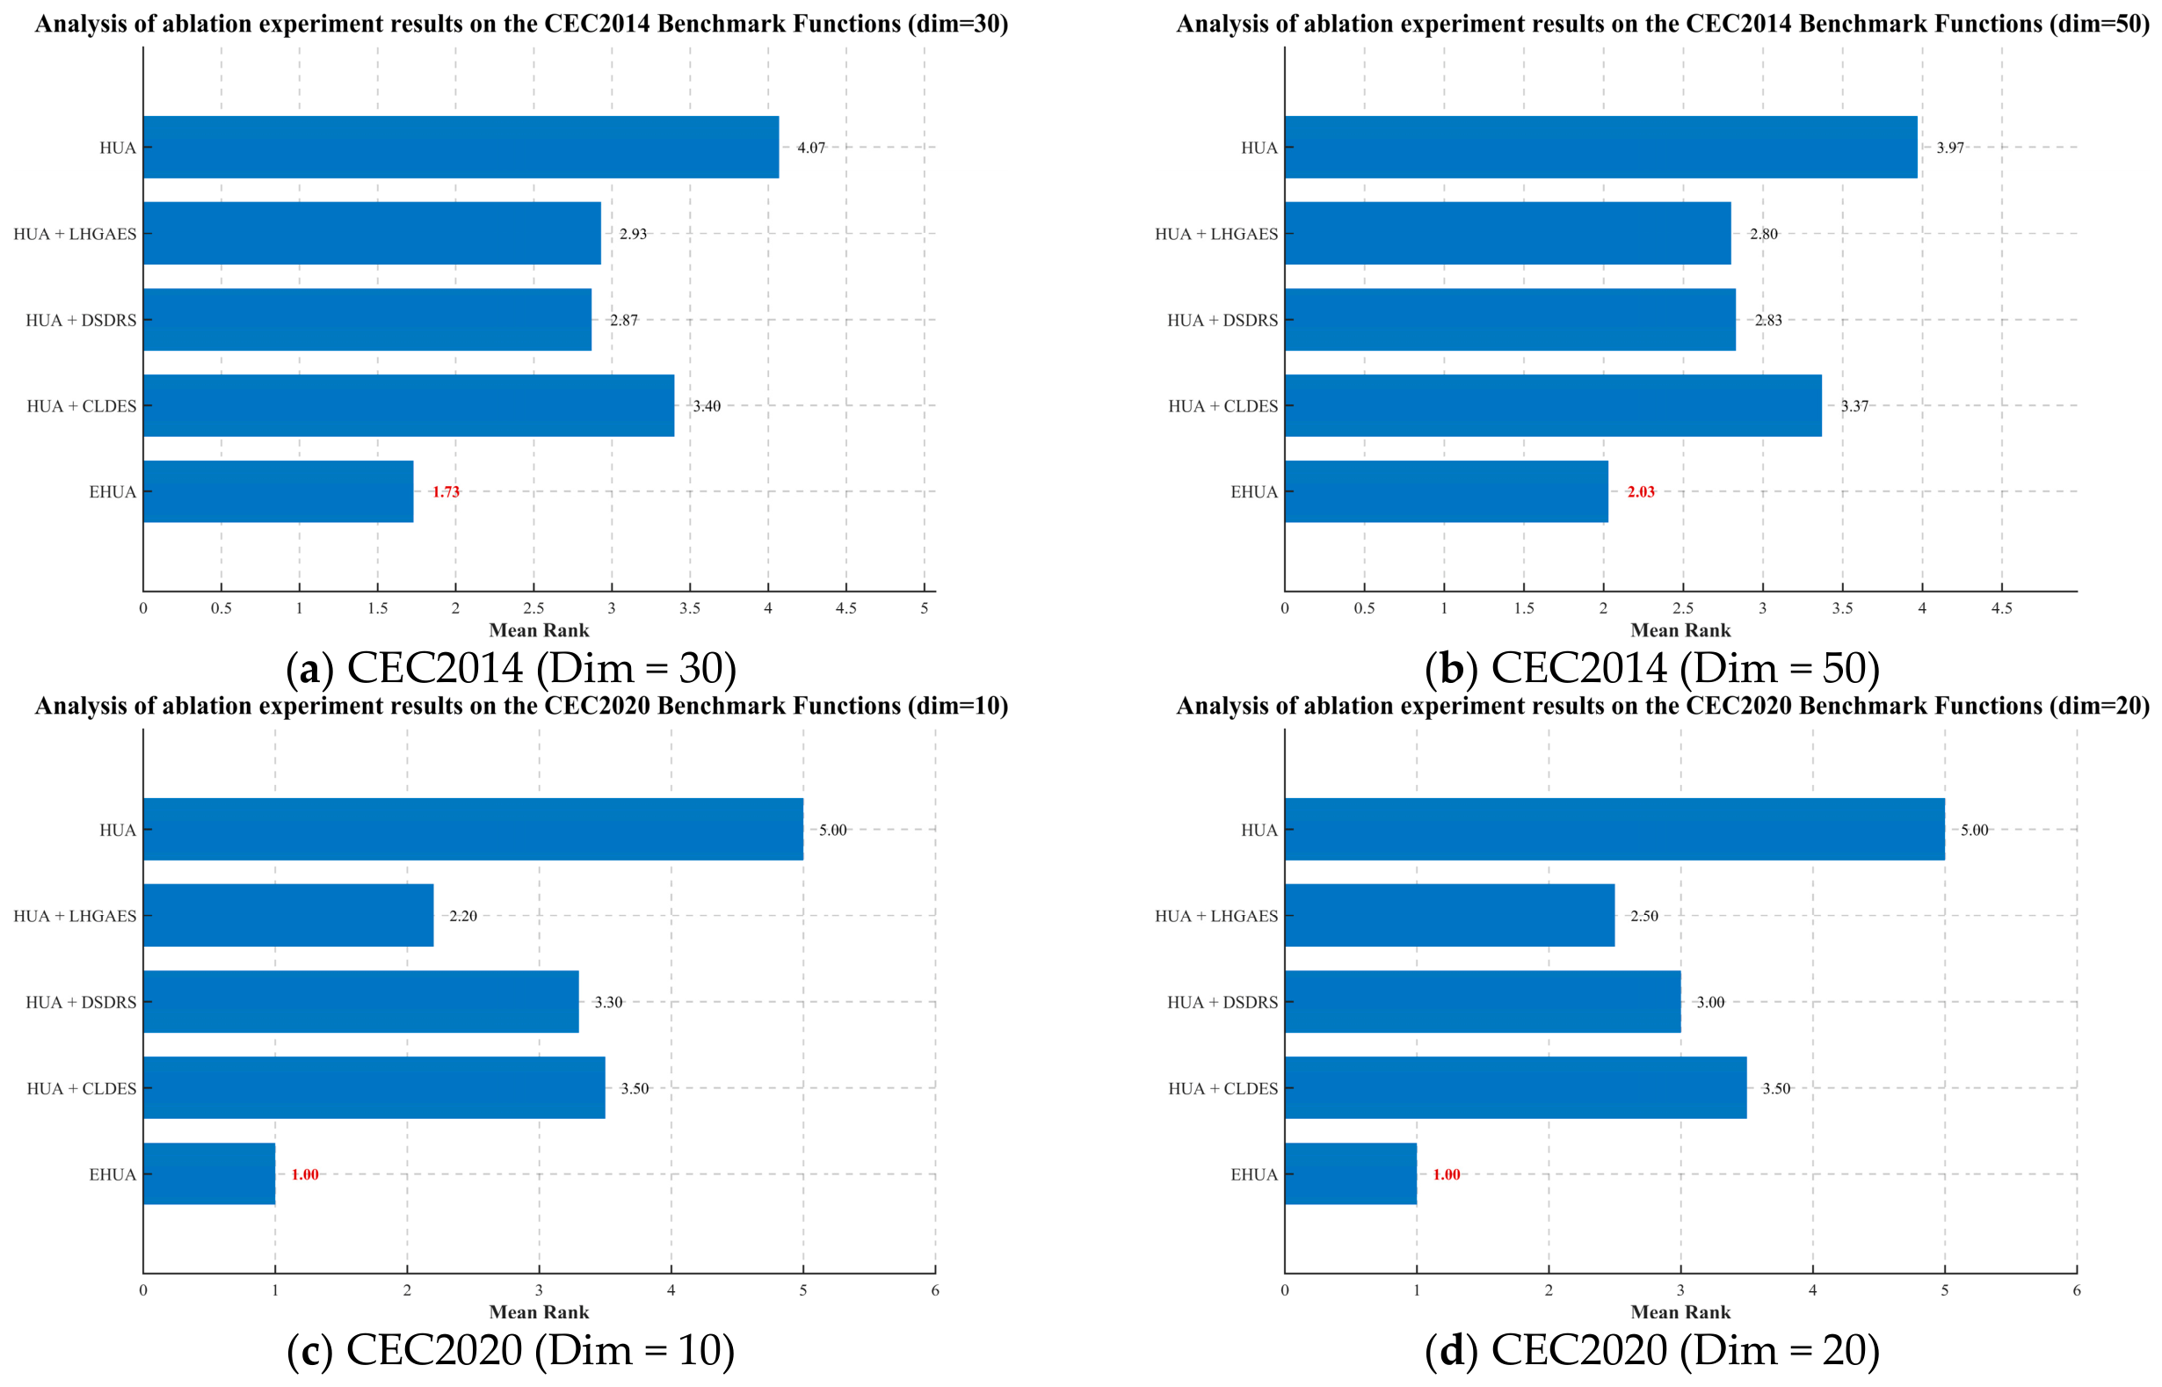
As illustrated in
Figure 8, the complete EHUA consistently achieves the lowest mean rank across all four ablation scenarios, confirming the effectiveness and complementarity of the three proposed enhancement strategies. On the CEC2014 benchmark, EHUA obtains mean ranks of 1.73 and 2.03 under the 30- and 50-dimensional settings, respectively, which are substantially lower than those of the original HUA, namely 4.07 and 3.97. Compared with HUA, the mean ranks are reduced by approximately 57.49% and 48.87%, respectively. Although the individual variants HUA + LHGAES, HUA + DSDRS, and HUA + CLDES all outperform the original HUA, none of them achieves the same overall performance as the complete EHUA. In particular, the best single-strategy variants obtain mean ranks of 2.87 and 2.80 on the 30- and 50-dimensional CEC2014 tests, whereas EHUA further reduces these values to 1.73 and 2.03. A more pronounced advantage is observed on the CEC2020 benchmark, where EHUA ranks first with a mean rank of 1.00 under both the 10- and 20-dimensional settings, while the original HUA obtains a mean rank of 5.00. Among the individual strategies, LHGAES provides the most evident improvement on CEC2020, achieving mean ranks of 2.20 and 2.50, whereas DSDRS and CLDES also contribute positively to the overall optimization performance. These results demonstrate that each proposed strategy improves HUA from a different perspective, while their coordinated integration produces a stronger synergistic effect, enabling EHUA to maintain a better balance between global exploration, adaptive search regulation, and local exploitation across different benchmark suites and dimensional settings.
4.7. Parameter Sensitivity Analysis
For metaheuristic algorithms, parameter settings can directly influence population diversity, convergence speed, search stability, and the balance between global exploration and local exploitation. Inappropriate parameter values may lead to excessive randomness, premature convergence, or insufficient local refinement, even when the underlying search mechanisms are well designed. Therefore, parameter sensitivity analysis is essential for evaluating the robustness of an algorithm, identifying the relative influence of its key control parameters, and determining suitable default settings for subsequent experiments. In this subsection, the effects of representative EHUA parameters are systematically investigated under different configurations while the remaining parameters are kept unchanged, thereby providing a clearer understanding of their influence on solution quality and convergence behavior. The experimental results are shown below.
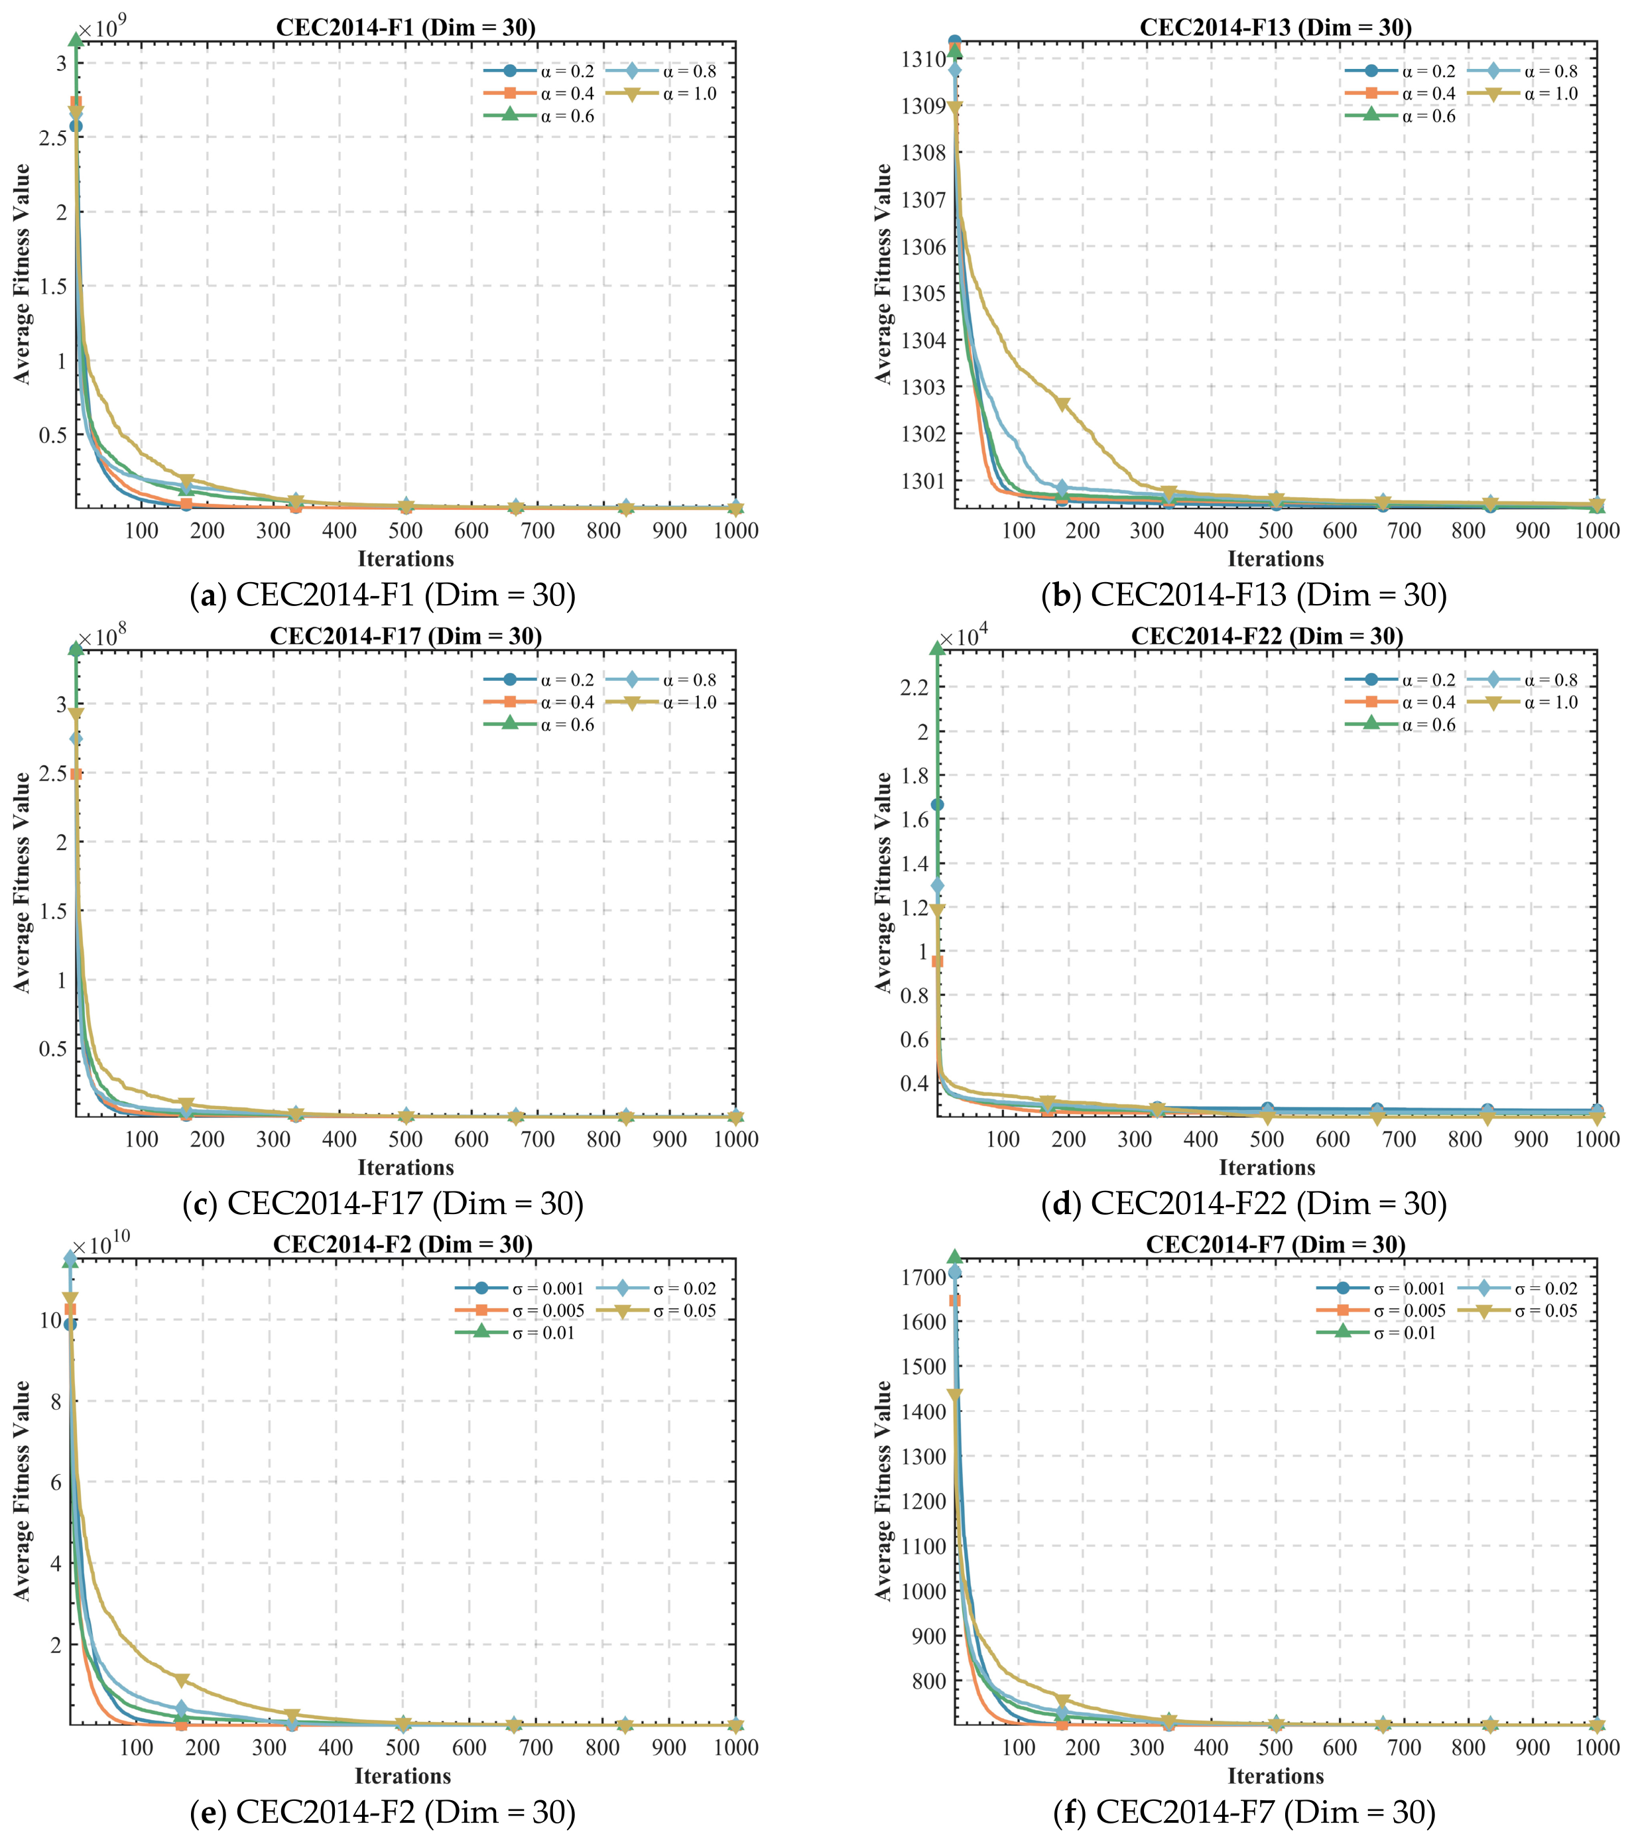
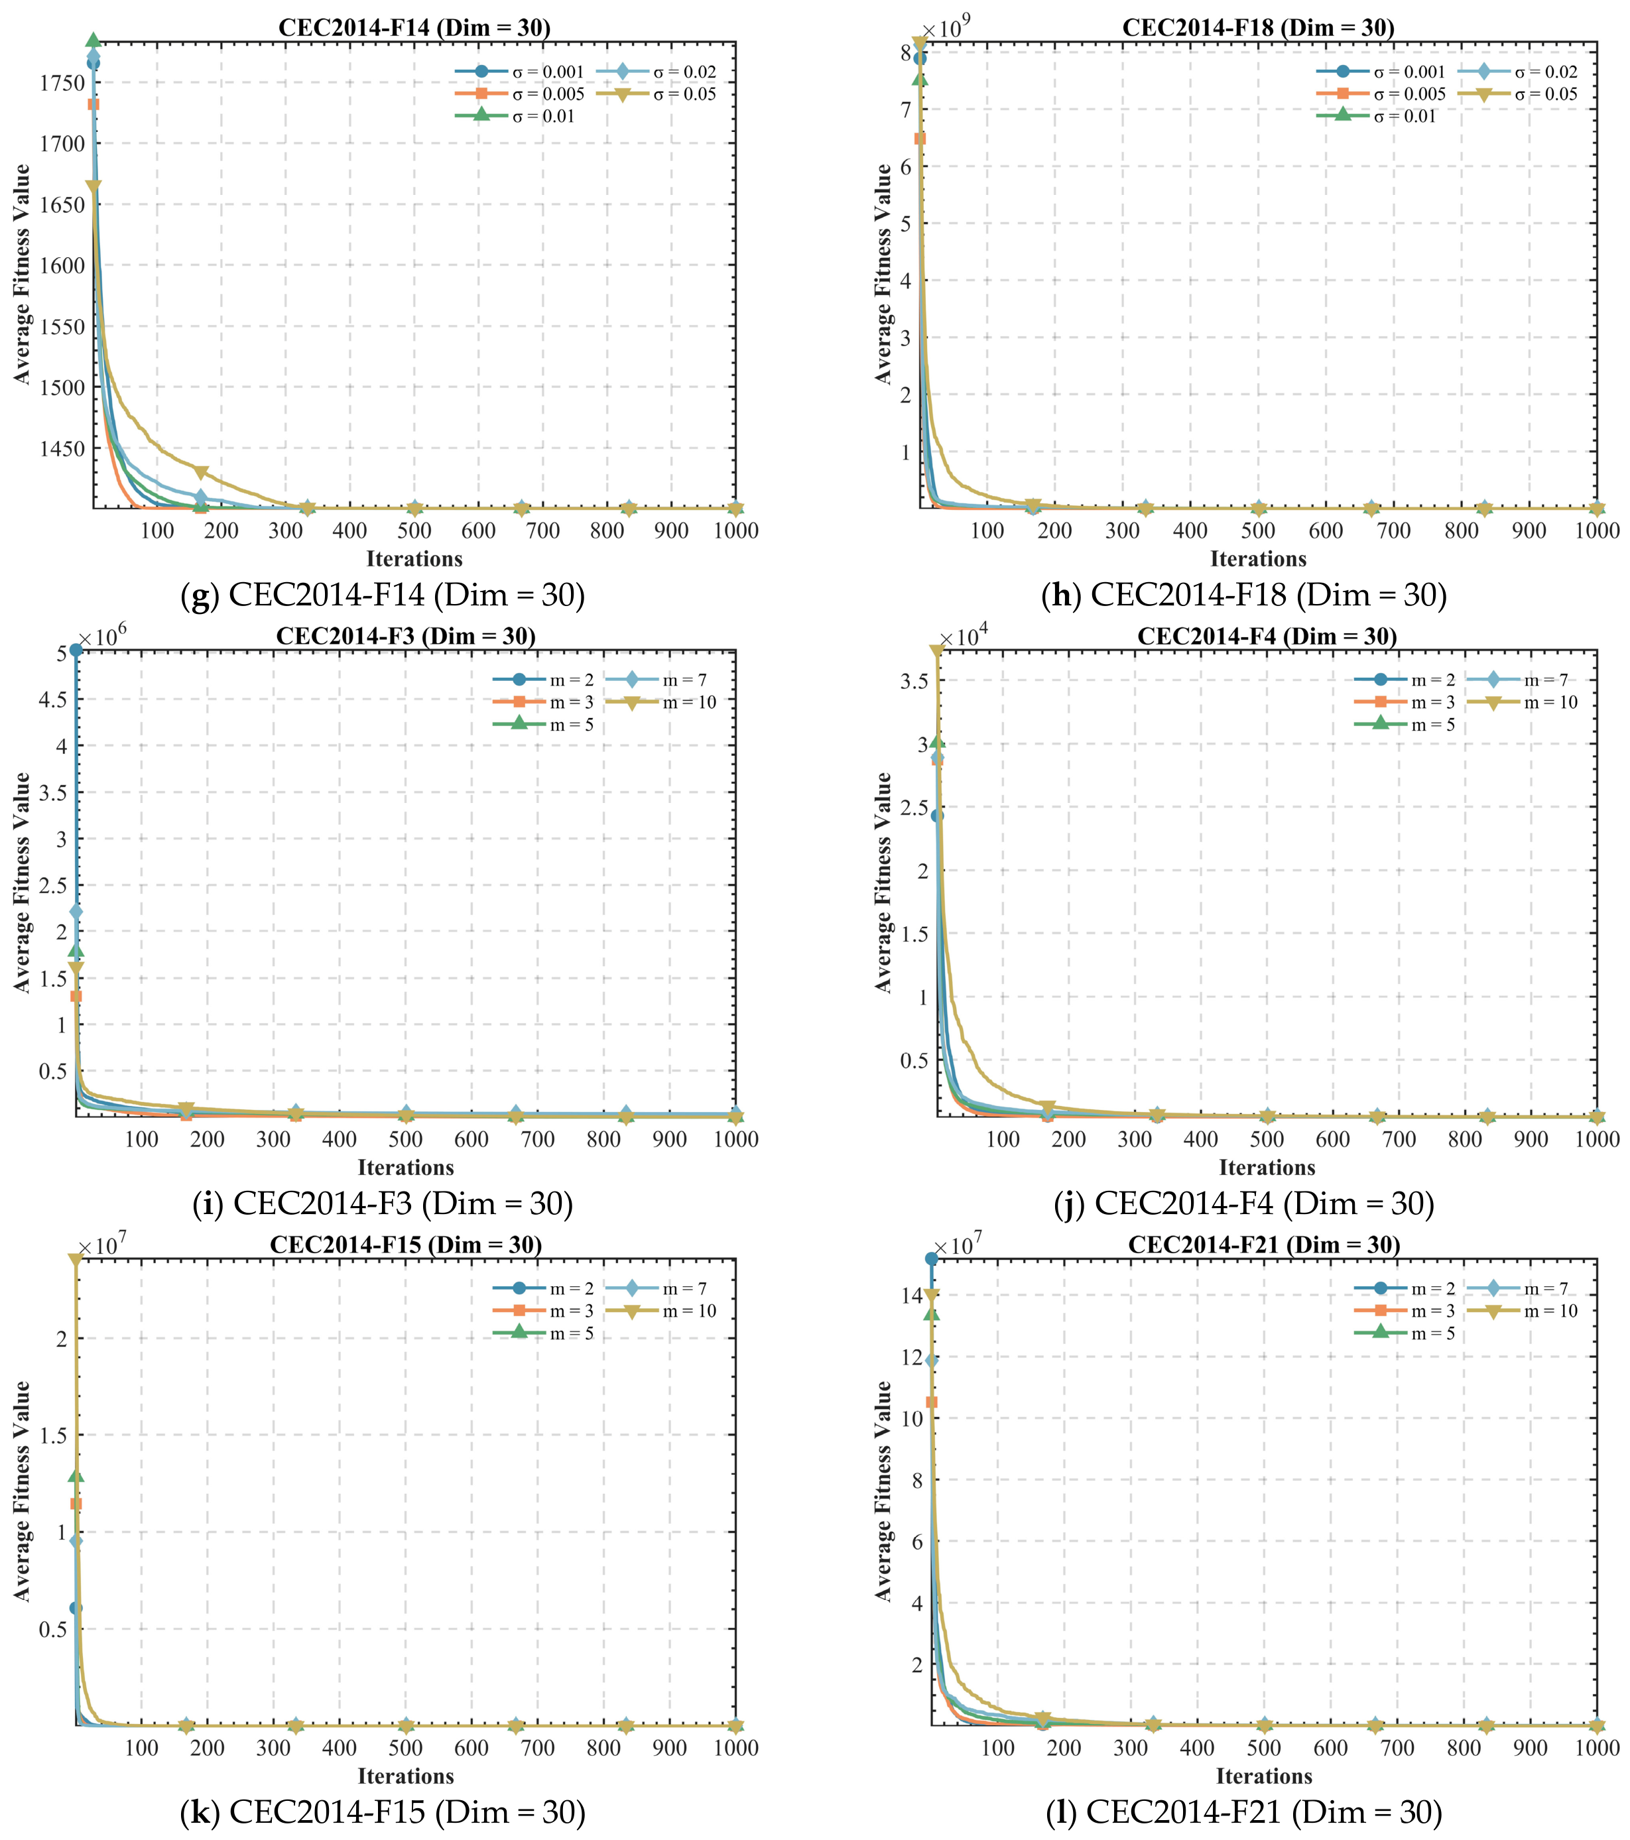
As shown in
Figure 9, the three key parameters of EHUA exert different influences on convergence speed and solution refinement.
Figure 9a–d illustrate the effect of the adaptive radius contraction coefficient
. Across F1, F13, F17, and F22, excessively small or large values generally weaken the search efficiency. When
, the city radius contracts relatively slowly, which preserves exploration but delays local refinement. In contrast,
causes overly strong radius contraction and produces noticeably slower convergence on several functions, particularly F1, F13, and F17. The setting
exhibits the most favorable overall convergence behavior, reaching low fitness regions more rapidly and maintaining competitive final accuracy. The result indicates that a moderate contraction intensity provides a better balance between maintaining a sufficiently broad search range and progressively strengthening exploitation.
Figure 9e–h present the influence of the initial Gaussian perturbation coefficient
. The setting
generally achieves the fastest fitness reduction on F2, F7, F14, and F18, while
also provides competitive performance on some functions. A very small perturbation may be insufficient to help the population escape unfavorable local regions, whereas an excessively large perturbation, such as
, introduces strong random fluctuations and delays convergence. Although the differences among several settings become smaller during the later iterations, the convergence trajectories show that
provides the most effective compromise between stochastic exploration and precise local refinement.
The influence of the number of elite logistics hubs
is shown in
Figure 9i–l. Among the five tested values,
demonstrates the best overall performance on F3, F4, F15, and F21, with relatively rapid convergence and favorable final fitness values. When
, the limited number of guidance sources may restrict the use of high-quality population information. Increasing
to 7 or 10 does not lead to further improvement; instead, aggregating too many elite individuals tends to smooth or dilute the directional information supplied by the most promising city centers, thereby slowing the search process. Moreover, a larger hub set introduces additional computational overhead. Therefore,
offers an appropriate balance between guidance diversity, search direction quality, and computational efficiency.
Overall, the sensitivity results indicate that EHUA is affected by its parameter configuration, but moderate settings consistently produce stable search behavior across different problem landscapes. Based on the convergence results in
Figure 9,
,
, and
are selected as the recommended default values for the subsequent experiments. These values should be regarded as suitable settings for the benchmark conditions considered in this study rather than universally optimal parameters for all optimization problems.
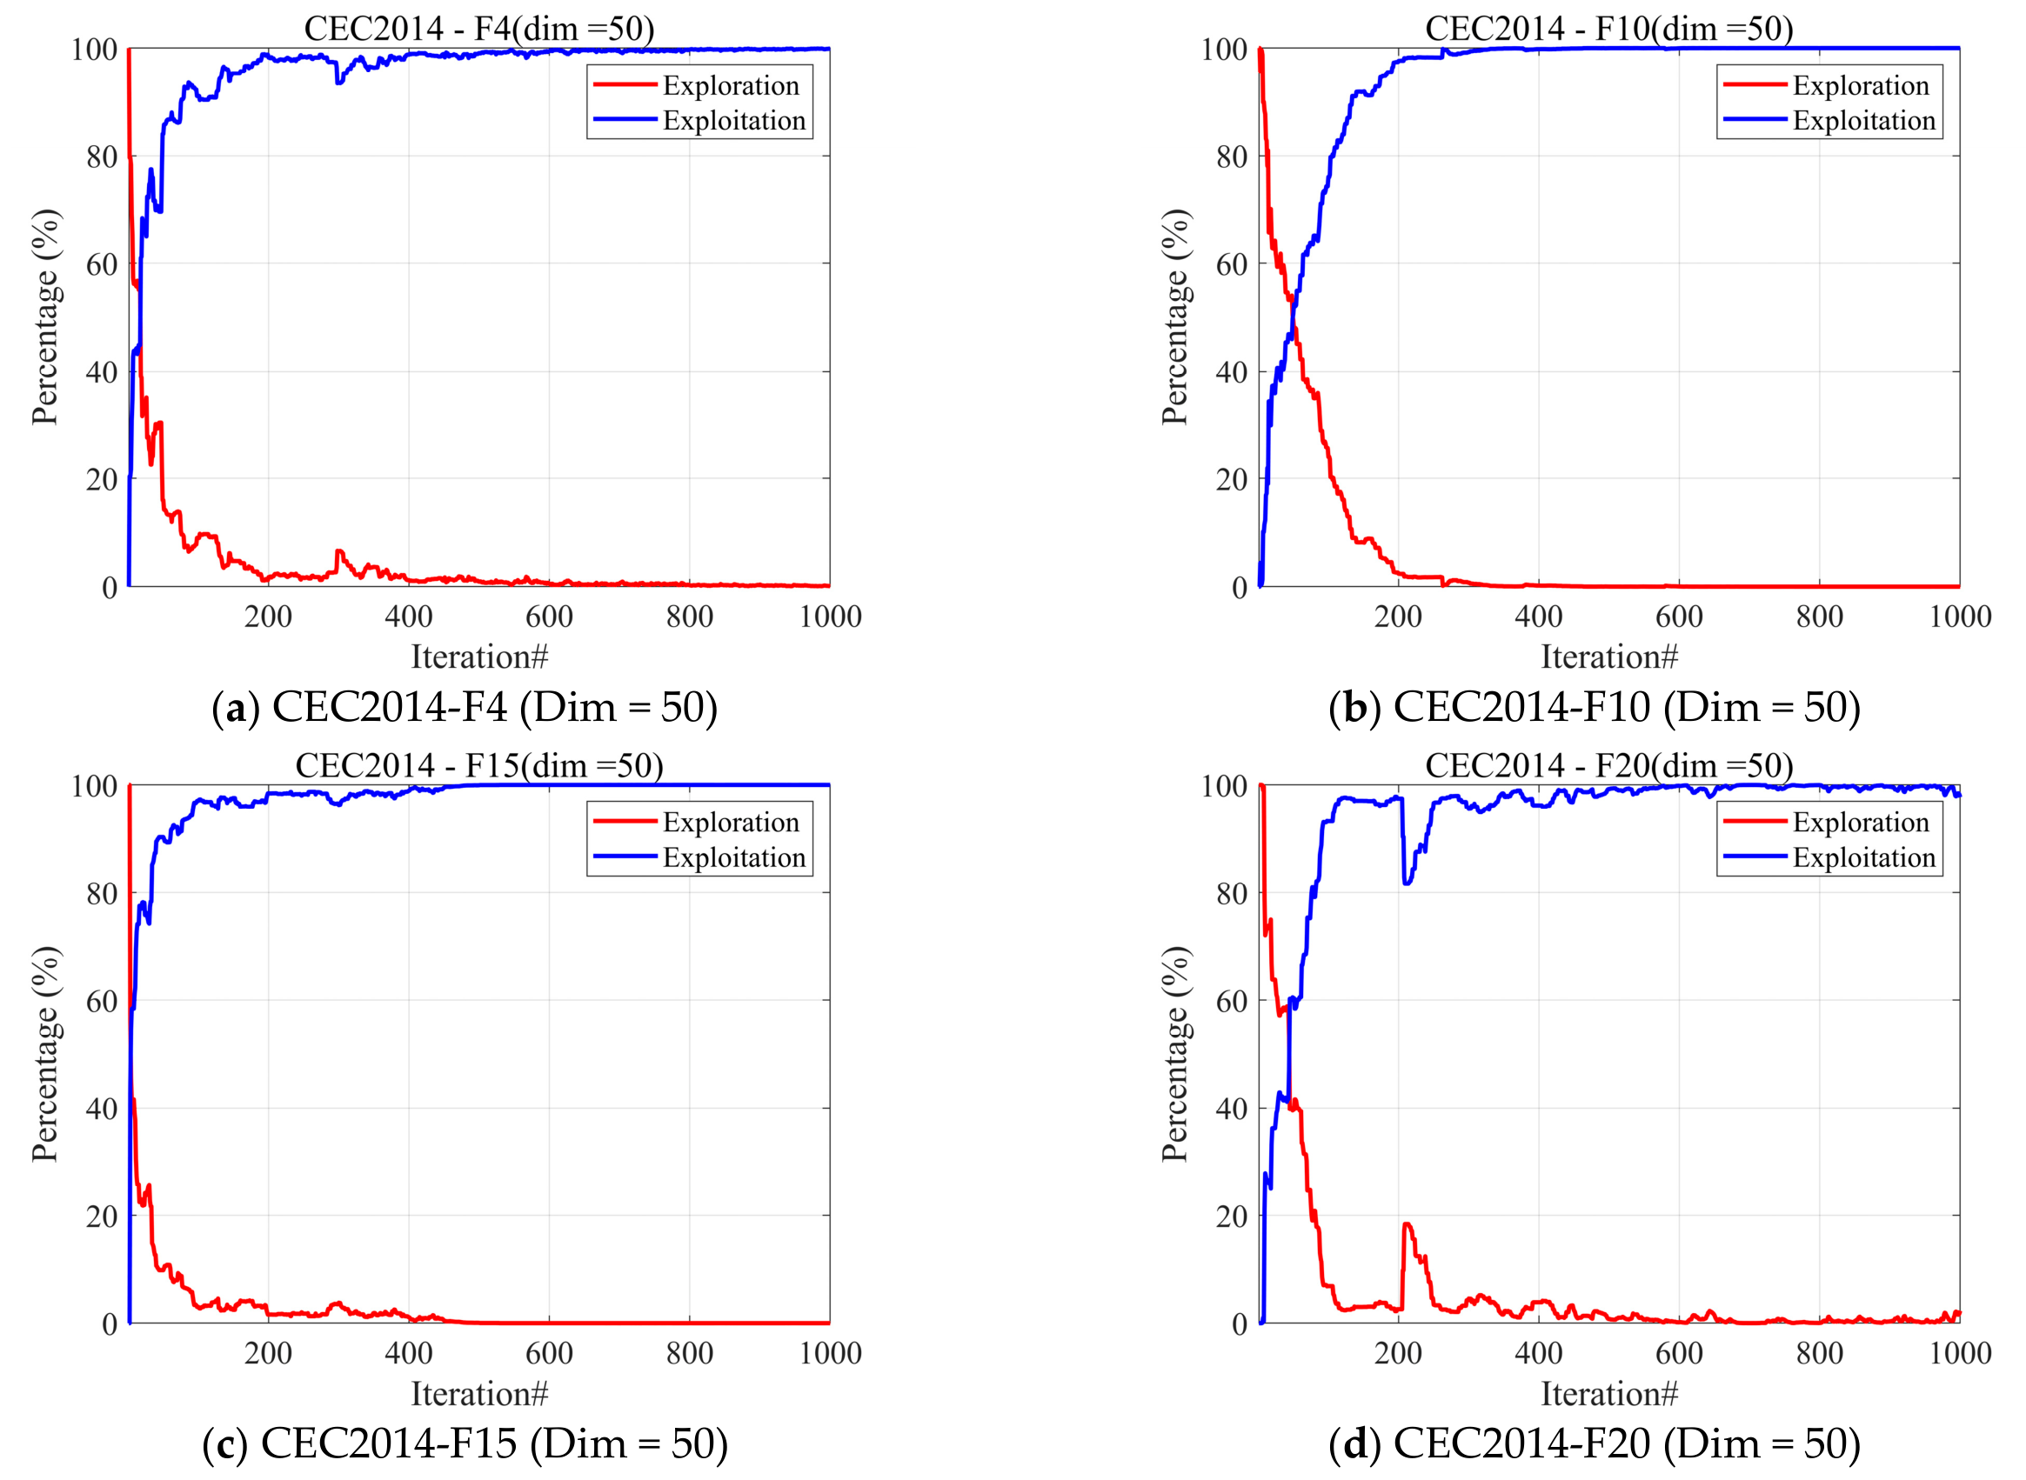
4.8. Exploration–Exploitation Analysis
Maintaining an appropriate balance between global exploration and local exploitation is essential for the performance of metaheuristic algorithms. Excessive exploration may delay convergence and prevent accurate solution refinement, whereas excessive exploitation may cause rapid population concentration and premature convergence. Although the preceding convergence, ablation, and parameter sensitivity experiments provide indirect evidence of the search behavior of EHUA, a quantitative analysis is required to directly examine how its exploration and exploitation tendencies evolve during the optimization process.
In this study, population diversity is adopted to quantify the exploration–exploitation behavior of EHUA. A widely distributed population generally indicates stronger exploration because candidate solutions cover a broader region of the search space. In contrast, a concentrated population represents stronger exploitation because individuals search intensively around promising regions. Let the population at iteration
be expressed as
where
is the population size and
denotes the position of the
-th candidate solution in a
-dimensional search space. The diversity of the
-th dimension is calculated as
where
denotes the median position of the population in the
-th dimension. The overall population diversity is then defined as
Let the maximum diversity observed during the complete optimization process be
where
is the maximum number of iterations. The exploration and exploitation percentages at iteration
are calculated as
where
is a sufficiently small positive constant used to avoid division by zero. Accordingly,
A high exploration percentage indicates that the population remains dispersed and maintains broad search coverage, whereas a high exploitation percentage indicates that candidate solutions have concentrated around promising regions for detailed refinement. For each benchmark function, the exploration and exploitation percentages are recorded during every iteration and averaged over 30 independent runs to reduce the influence of stochastic fluctuations. The experimental results are shown below.
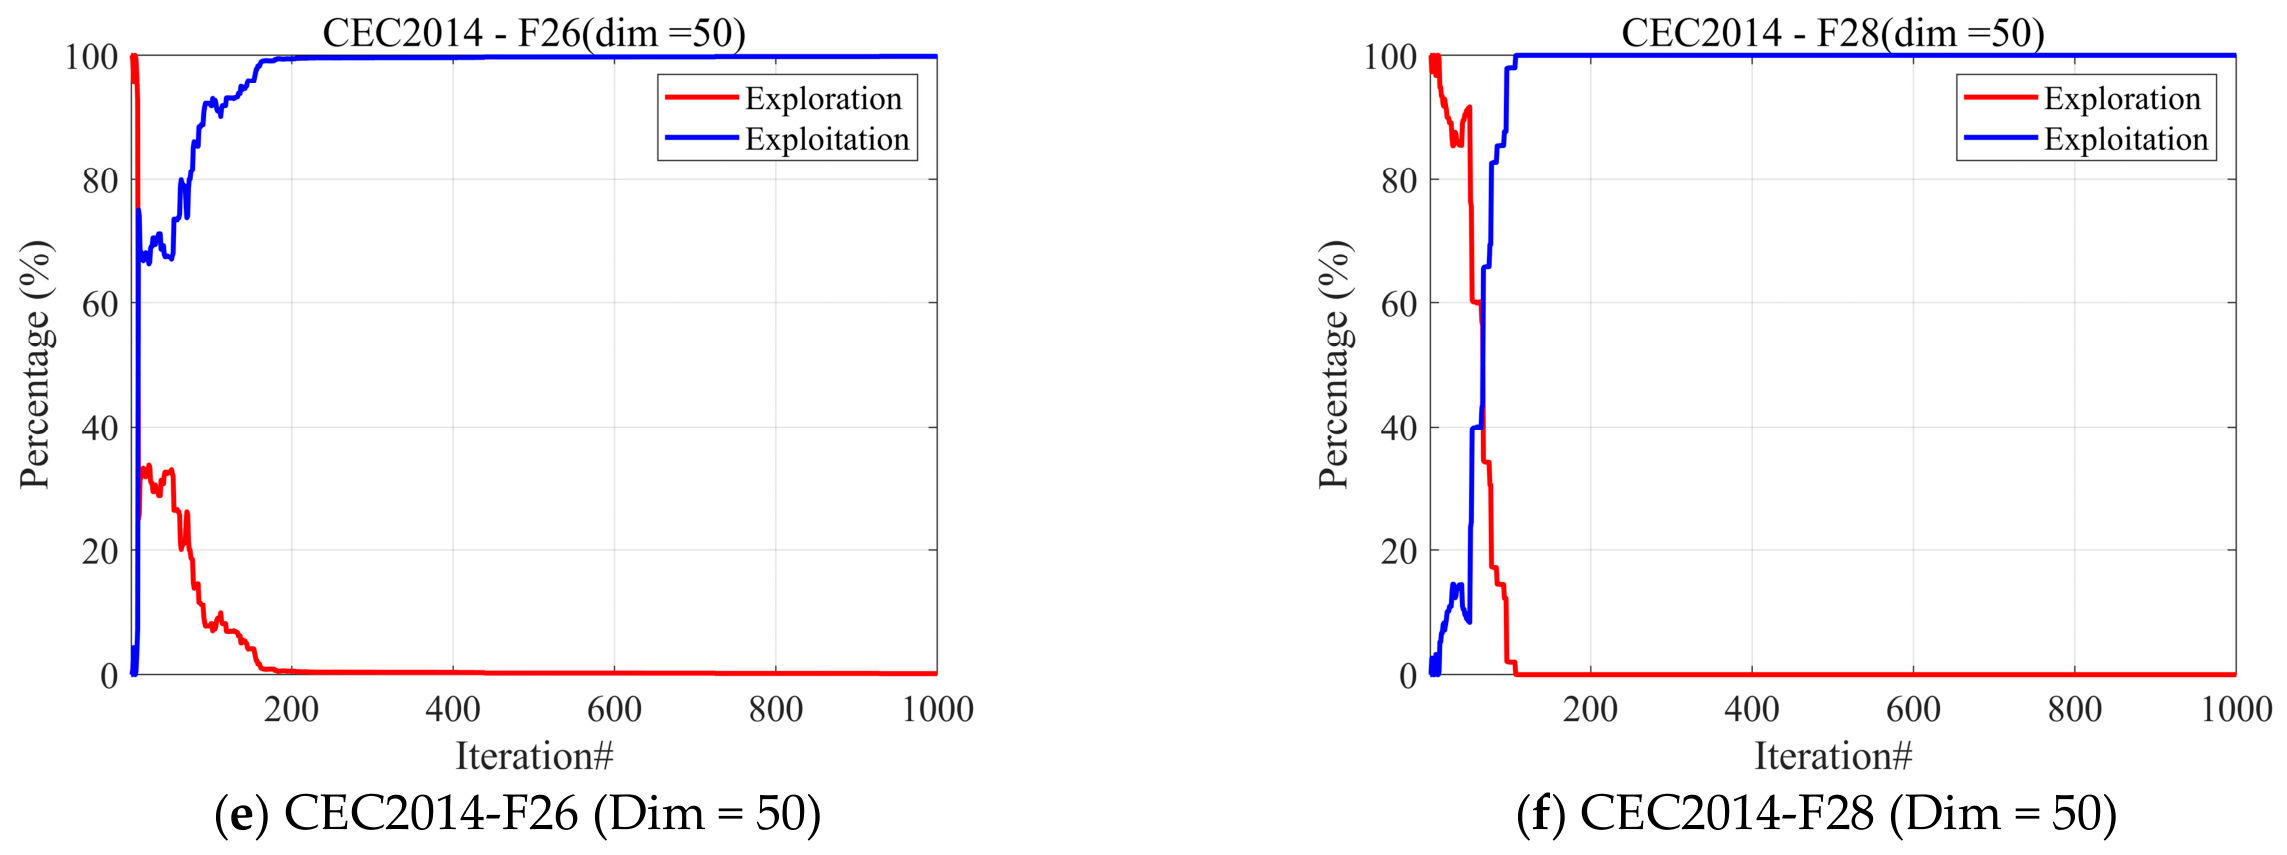
As shown in
Figure 10, EHUA exhibits a clear quantitative transition from global exploration to local exploitation on the six representative 50-dimensional CEC2014 functions. At the beginning of the optimization process, the exploration percentage is relatively high, indicating that the population is widely distributed and searches a broad region of the solution space. As the iterations proceed, exploration rapidly decreases while exploitation increases, and the exploitation percentage generally exceeds 95% after approximately 100–300 iterations. This transition is particularly smooth on F10 and F15, whereas F4 and F20 exhibit several temporary fluctuations during the early and middle stages. These short-term increases in exploration indicate that the stochastic radius adjustment and Gaussian perturbation mechanisms can partially restore population diversity when the search encounters complex landscape structures. On F26, the transition toward exploitation is relatively gradual, while F28 shows a more abrupt shift, suggesting that the exploration–exploitation pattern of EHUA adapts to the characteristics of different functions. In the later stage, exploitation becomes dominant on all six functions, enabling the population to concentrate on promising regions and perform accurate solution refinement. Overall, the results quantitatively confirm that EHUA maintains broad early-stage exploration, permits intermittent diversity recovery when necessary, and progressively strengthens exploitation during the later iterations, thereby achieving a dynamic balance between global search and local refinement.
5. EHUA for Cloud Task Scheduling Problems
5.1. Cloud Task Scheduling Model
Cloud task scheduling is a fundamental component of cloud resource management, aiming to allocate a large number of computational tasks to available virtual machine (VM) resources in an efficient manner. Effective scheduling strategies can improve resource utilization, reduce task execution overhead, balance workload distribution, and enhance the overall quality of cloud services. Therefore, cloud task scheduling can be formulated as a complex optimization problem that seeks the optimal mapping relationship between tasks and virtual machines [
34,
35].
Assume that a cloud computing environment consists of
virtual machines and
independent computational tasks. The corresponding virtual machine set and task set can be defined as:
where
represents the collection of available virtual machines and
denotes the set of user-submitted tasks.
The scheduling solution can be represented by an allocation matrix:
where
. Each virtual machine possesses heterogeneous resource capabilities, including computational power, storage capacity, and communication bandwidth. The resource vector of the
-th virtual machine is defined as:
where
,
, and
denote the computing capability, storage capacity, and communication bandwidth of the
-th virtual machine, respectively.
Similarly, the resource requirements of the
-th task can be expressed as:
where
,
, and
represent the computational demand, storage requirement, and communication bandwidth requirement of task
, respectively.
The present study considers a simplified static scheduling scenario in which tasks are independent and non-preemptive, all tasks and VMs are available at the beginning of scheduling, and the VM set remains unchanged during one scheduling episode.
5.2. Objective Function Formulation
In practical cloud environments, task scheduling usually involves multiple optimization objectives. To evaluate scheduling performance from different perspectives, three representative objectives are considered in this study: execution time, load balancing, and execution cost.
5.2.1. Execution Time Objective
Execution time reflects the efficiency of task processing and directly affects the quality of service provided by the cloud platform. A shorter execution time indicates higher processing efficiency and better utilization of computational resources.
The execution time objective is defined as:
where
represents the computational demand of task
;
denotes the computational capability of virtual machine
.
5.2.2. Load Balancing Objective
An appropriate workload distribution can effectively prevent resource congestion and avoid excessive concentration of tasks on specific virtual machines. Therefore, load balancing is another important performance indicator in cloud task scheduling.
The load balancing objective is formulated as:
where
denotes the storage requirement of task
, and
represents the storage capacity of virtual machine
.
A smaller value of indicates a more balanced resource allocation and better utilization of system resources.
5.2.3. Execution Cost Objective
Besides scheduling efficiency, execution cost is also a key factor affecting the economic performance of cloud service providers. Reducing execution cost helps improve resource utilization while minimizing operational expenses.
The execution cost objective is defined as:
where
and
represent the bandwidth requirement of task
and the communication capability of virtual machine
, respectively, and
denotes the unit execution cost coefficient.
5.3. Objective Normalization
Since the magnitudes of the three objective functions are significantly different, a normalization procedure is performed before constructing the final fitness function.
The normalized execution time objective is given by:
The normalized load balancing objective is:
Similarly, the normalized execution cost objective is:
5.4. Comprehensive Fitness Function
To simultaneously optimize execution efficiency, load distribution, and execution cost, the above objectives are integrated into a unified fitness function using a weighted-sum strategy.
The comprehensive objective function is defined as:
where
,
, and
are the weighting coefficients associated with execution time, load balancing, and execution cost, respectively, satisfying
.
To ensure equal importance among the three objectives, the weighting coefficients are uniformly assigned as:
Consequently, minimizing yields a preference-dependent scalarized compromise among execution efficiency, workload distribution, and monetary cost under the specified equal-weight setting.
In the primary experiments, equal weights are adopted to represent a neutral decision preference in which execution time, workload distribution, and monetary cost are treated as equally important. This weighted-sum formulation transforms the three normalized criteria into a scalar objective so that EHUA and the comparison algorithms can be evaluated under an identical single-objective framework. Therefore, the obtained scheduling result should be interpreted as a preference-dependent compromise solution rather than a complete representation of the Pareto-optimal set. In particular, a fixed weighted-sum formulation may not recover solutions located in non-convex regions of the Pareto front.
5.5. Experimental Setup for Cloud Task Scheduling
To ensure the reproducibility of the cloud task scheduling experiments, the detailed simulation configuration is presented in this subsection. The random-number generator is initialized using rng(1) before the cloud environment is generated. Consequently, the same virtual-machine configuration and task instances can be reproduced in repeated experiments. All compared algorithms are evaluated using identical cloud instances to prevent differences in randomly generated resources from affecting the fairness of the comparison.
The simulated cloud environment contains heterogeneous virtual machines. Each VM is randomly assigned one of two resource configurations with equal probability. Specifically, when a uniformly generated random number is no smaller than 0.5, the corresponding VM is assigned a computing capacity of , a storage capacity of , and a communication capacity of . Otherwise, the VM is assigned , , and . This configuration produces a heterogeneous resource pool containing virtual machines with different computing, storage, and communication capabilities.
For the
-th task, the computational requirement
, storage requirement
, and communication requirement
are independently generated according to uniform distributions:
The parameters generated by the current implementation are continuous values. Since no explicit physical units are assigned in the simulation code, the VM capacities and task requirements are represented using normalized simulation units. They are intended to construct heterogeneous resource–demand relationships rather than reproduce the configuration of a particular commercial cloud platform.
The largest-scale experiment contains tasks. For experiments involving other task scales, the value of is adjusted according to the corresponding scenario, while the VM configurations, task-generation rules, algorithm parameters, and price coefficient remain unchanged. All algorithms use a population size of 50 and a maximum of 100 iterations. The execution-price coefficient is fixed at .
To eliminate the effects of different numerical scales among the scheduling objectives, three normalization constants are calculated from all possible task-to-VM assignments. For each task
and VM
, the monetary cost-related value, execution time-related value, and load-related value are calculated as
The corresponding normalization constants are then determined by
These maximum values are calculated from the generated scheduling instance and are subsequently used to normalize the monetary cost, execution time, and load-related criteria. This procedure prevents an objective with a larger numerical magnitude from dominating the scalarized comprehensive fitness function.
Each task is assigned to exactly one virtual machine, and the task-to-VM mapping remains unchanged during one scheduling episode. Tasks are non-preemptive, and no task migration, dynamic task arrival, or VM rescheduling is considered. The scheduling policy searches for a static allocation matrix that minimizes the equally weighted scalarized objective consisting of normalized execution time, workload cost, and monetary cost. All compared algorithms use the same task instances, VM configurations, objective weights, population size, and iteration budget.
Note: All VM capacities and task requirements are expressed in normalized simulation units because the current implementation does not assign explicit physical units. The same randomly generated cloud instance is used for all compared algorithms.
5.6. Experimental Results and Discussion
To further investigate the effectiveness of EHUA in real-world cloud scheduling scenarios, a series of cloud task scheduling experiments are conducted and benchmarked against nine representative optimization algorithms. To eliminate the influence of parameter inconsistencies, all comparison methods are implemented under the same experimental conditions. The scheduling capability of different algorithms is examined from several aspects, including task processing efficiency, workload distribution, and resource expenditure.
Three key evaluation criteria are considered in the scheduling model, namely task execution time cost, load balancing cost, and resource pricing cost. Among them, the execution time cost reflects the efficiency of task completion, the load balancing cost measures the degree of workload distribution among virtual machines, and the pricing cost quantifies the expenses associated with resource utilization during task execution. To provide a more comprehensive assessment, these individual objectives are further combined into an overall scheduling cost, which is adopted as the primary metric for evaluating scheduling quality.
The corresponding experimental outcomes are presented in the subsequent tables and figures. By examining optimization results from the perspectives of objective values, convergence characteristics, and scheduling effectiveness, the performance of EHUA can be systematically analyzed and compared with that of the reference algorithms.
5.6.1. Experimental Analysis on Small-Scale Cloud Task Scheduling
To examine the scheduling capability of EHUA in small-scale cloud environments, a series of comparative experiments are conducted under different task loads. The analysis focuses on both convergence behavior and scheduling quality. Convergence profiles are utilized to reveal the evolutionary dynamics of the competing algorithms, while the resulting scheduling costs are adopted as quantitative indicators for measuring solution quality. By considering multiple task-scale scenarios, the ability of EHUA to allocate resources efficiently and produce high-quality scheduling schemes can be thoroughly evaluated.
Convergence Behavior Analysis: To further assess the search performance of EHUA in cloud task scheduling problems, the convergence characteristics of all candidate algorithms are investigated. To ensure consistency across experiments, the number of tasks is fixed at 100 and the maximum iteration count for each algorithm is set to 100. Under these unified settings, EHUA is compared with nine representative optimization algorithms.
Figure 11 compares the convergence behaviors of the ten algorithms on the small-scale cloud task scheduling problem with 100 tasks. EHUA exhibits a rapid decline during the first 10–20 iterations and then maintains a stable convergence state, indicating both fast search efficiency and low sensitivity to subsequent stochastic fluctuations. For the total cost, EHUA decreases from approximately 0.24 to 0.19 within the early search stage and finally stabilizes at about 0.186, clearly outperforming the other methods. A similarly pronounced advantage is observed for the load cost, where EHUA rapidly converges to approximately 0.17, whereas the remaining algorithms generally stabilize at higher levels. Regarding the price cost, EHUA reaches a competitive value of approximately 0.127 at an early stage and remains nearly unchanged thereafter, although BKA obtains a slightly lower final value after continued late-stage refinement. For the time cost, EHUA converges steadily to approximately 0.325; although several competing algorithms achieve lower final time-cost values, their improvements are accompanied by less favorable performance in other scheduling objectives. Compared with the original HUA, EHUA produces substantial reductions in total, price, and load costs while maintaining comparable time-cost performance. Therefore, the proposed method does not optimize a single component in isolation but achieves a more effective balance among multiple scheduling objectives, resulting in the lowest comprehensive cost and stable convergence performance for small-scale cloud task scheduling.
Performance Analysis Under Dynamic Task Loads: To further evaluate the scheduling capability of EHUA under varying workload conditions, a series of experiments are conducted with progressively increasing numbers of cloud tasks. Specifically, the task scale is expanded from 100 to 1000, generating scheduling problems with different levels of computational complexity and resource demand. Such a configuration provides an effective framework for examining the scalability and adaptability of the competing algorithms as the scheduling environment becomes increasingly challenging.
Figure 12 compares the scheduling performance of the ten algorithms as the number of cloud tasks increases from 100 to 1000. For the normalized total cost, EHUA consistently produces the lowest values across all task scales, remaining approximately within the range of 0.186–0.192 and exhibiting only minor fluctuations as the workload increases. This indicates that the proposed algorithm can preserve stable comprehensive scheduling performance even when the number of tasks grows substantially. Regarding the price cost, EHUA and BBO form the best-performing group, with their curves generally remaining below those of the other algorithms; EHUA also shows a gradual reduction at larger task scales and reaches its lowest value near 900 tasks. For the time cost, EHUA maintains relatively stable results around 0.34–0.35, although BKA, FTO, and NDO achieve lower values under several task settings, indicating that EHUA does not minimize execution time in isolation. A similar trade-off is observed for the load cost: EHUA remains at a low and stable level of approximately 0.16, while BBO obtains slightly lower values at several medium- and large-scale task settings. Nevertheless, several algorithms that perform well on a single cost component exhibit considerably higher price, load, or total costs. Therefore, the consistently lowest comprehensive cost achieved by EHUA demonstrates that it provides a more effective balance among execution time, monetary expenditure, and workload distribution. Overall, these results confirm the scalability, adaptability, and multiobjective scheduling capability of EHUA under dynamically increasing cloud task loads.
5.6.2. Experimental Analysis on Large-Scale Cloud Task Scheduling
Convergence Characteristics Analysis: To assess the applicability of EHUA to large-scale cloud task scheduling problems, a series of comparative experiments are performed under different scheduling scales. The evaluation focuses on both search dynamics and scheduling effectiveness. Convergence profiles are employed to reveal the optimization process of each algorithm, while scheduling costs are used as quantitative indicators of solution quality. By considering scheduling scenarios with varying task loads, the capability of EHUA to maintain efficient resource management and generate high-quality scheduling solutions can be systematically examined.
For consistency across all experiments, the number of tasks is fixed at 100 and the maximum iteration budget is set to 100 for every algorithm. Under these identical conditions, EHUA is compared with nine representative optimization approaches to investigate its search behavior and scheduling performance.
Figure 13 compares the convergence behaviors of the ten algorithms on the large-scale cloud task scheduling problem. EHUA exhibits rapid convergence during the first 10–20 iterations and subsequently maintains a highly stable search trajectory. For the total cost, EHUA quickly decreases from approximately 0.255 to 0.189 and achieves the lowest final value among the compared methods, while most other algorithms converge to noticeably higher levels. A similar trend is observed for the price cost, where EHUA rapidly approaches approximately 0.126 and performs comparably to BBO, clearly outperforming the remaining algorithms. For the load cost, EHUA stabilizes at around 0.159 and achieves the second-best result, only slightly higher than BBO, while substantially improving upon the original HUA and the other comparison methods. Regarding the time cost, EHUA converges to approximately 0.345 and maintains limited fluctuations after the middle stage, although BKA obtains a lower final value through continued late-stage refinement. This result indicates that EHUA does not optimize execution time independently at the expense of the other objectives; instead, it achieves a more balanced coordination among monetary cost, execution time, and workload distribution. Compared with the original HUA, EHUA produces clear reductions in all four scheduling indicators, particularly in total cost and load cost. Overall, the rapid early convergence, stable later-stage behavior, and lowest comprehensive scheduling cost demonstrate the effectiveness and reliability of EHUA for solving large-scale cloud task scheduling problems.
Scheduling Performance Under Large-Scale Dynamic Workloads: To further examine the behavior of EHUA under increasingly demanding scheduling conditions, additional experiments are conducted with task scales ranging from 1000 to 10,000. By continuously enlarging the number of cloud tasks, scheduling problems with substantially different computational burdens and resource requirements are generated. This experimental configuration provides an effective means of evaluating how well different algorithms adapt to rapidly growing problem sizes and whether their scheduling quality can be maintained under large-scale cloud environments.
Figure 14 compares the scheduling performance of the competing algorithms as the number of cloud tasks increases from 1000 to 10,000. Overall, EHUA achieves the lowest or tied-lowest values for all four evaluation indicators across nearly all workload levels, while exhibiting only minor fluctuations as the task scale expands. Its normalized total cost remains stable at approximately 0.31, which is consistently lower than those of the other algorithms and indicates that the overall scheduling quality is preserved under large-scale workloads. Similar advantages are observed for the price and load costs, where EHUA maintains values of approximately 0.28 and 0.28–0.29, respectively. For the time cost, EHUA also remains highly stable at about 0.46–0.47, demonstrating that the increase in task quantity does not cause evident deterioration in execution efficiency. Although BBO occasionally reaches values close to EHUA at 5000 and 7000 tasks, its results fluctuate considerably across different workload levels, indicating weaker stability and greater sensitivity to task-scale variation. By contrast, FTO shows a clear upward trend in all four indicators as the number of tasks increases, while NDO and several other algorithms remain at relatively high cost levels. Compared with the original HUA, EHUA produces substantial and consistent reductions in total, price, time, and load costs. These results demonstrate that the proposed enhancement mechanisms enable EHUA to maintain effective resource allocation, stable optimization behavior, and strong scalability when solving increasingly large cloud task scheduling problems.
The performance improvement of EHUA over the original HUA can be interpreted from the characteristics of the cloud scheduling search space. A candidate solution represents a task-to-VM allocation pattern, and different high-quality schedules may correspond to distinct regions of the search space. The original HUA relies primarily on a single capital, which may cause candidate schedules to concentrate rapidly around one allocation pattern. In contrast, the fitness-weighted logistics hub preserves information from multiple high-quality schedules and guides the population toward several promising allocation regions. This mechanism reduces excessive dependence on one incumbent solution and increases the possibility of identifying alternative task assignments with lower comprehensive cost.
The dynamic supply–demand redistribution mechanism further assigns different search ranges to cities according to their relative fitness and evolutionary progress. High-quality scheduling regions are gradually refined using smaller radii, whereas relatively poor regions retain wider search ranges to investigate alternative VM assignments. The cooperative logistics delivery mechanism then combines information from neighboring elite schedules and the global best solution, enabling candidate allocations to inherit useful task-assignment patterns from multiple solutions. The decreasing Gaussian perturbation provides additional stochastic variation during the early stage and progressively reduces its amplitude to support accurate late-stage refinement. Therefore, the three mechanisms respectively improve allocation diversity, adaptive search-range regulation, and directed schedule refinement. This interpretation is consistent with the ablation results, quantitative exploration–exploitation analysis, and the theoretical operator analysis presented in
Appendix A. Nevertheless, these mechanisms explain the observed search behavior rather than providing an unconditional guarantee of superior performance for every cloud environment. Future work will evaluate EHUA under non-uniform, bursty, and trace-driven workload distributions, broader heterogeneous VM configurations, dynamically changing resource pools, and scheduling scenarios exceeding the current scale of 10,000 tasks.
5.7. Scope and Limitations of the Scheduling Model
The cloud scheduling formulation considered in this study is a simplified static model designed primarily to examine the task-allocation capability and scalability of EHUA under controlled conditions. The tasks are independent and do not form precedence-constrained workflows. Therefore, the present model does not represent directed acyclic graph-based applications in which a successor task can start only after all predecessor tasks have been completed. Inter-task communication delays and bandwidth contention are also omitted, and the bandwidth-related terms only describe the resource requirement of a task and the nominal communication capability of a VM.
In addition, the current model does not explicitly include task deadlines, service-level agreements, energy consumption, carbon emissions, dynamic VM activation and shutdown, resource failures, migration overhead, or recovery operations. The VM set is assumed to remain available and unchanged during each scheduling episode. Consequently, the reported experiments demonstrate the effectiveness of EHUA for a static independent-task allocation problem but should not be interpreted as a complete validation in fully dynamic production cloud environments.
The weighted-sum model also provides only one preference-dependent compromise for a specified weight vector and does not generate a Pareto front. Future work will extend EHUA using non-dominated sorting, external archive maintenance, and diversity-preserving selection to construct a Pareto-based multiobjective EHUA. Alternative formulations based on decomposition or -constraint methods will also be investigated. The extended scheduling model will incorporate DAG-constrained workflows, communication and bandwidth contention, deadline and SLA constraints, energy and carbon objectives, and dynamic VM failures and recovery.
6. Conclusions and Outlook
This study developed an Enhanced Human Urbanization Algorithm (EHUA) for global optimization and cloud task scheduling. Rather than presenting elite guidance, adaptive control, neighborhood cooperation, and Gaussian perturbation as fundamentally new operators, EHUA reformulates and coordinates these mechanisms within the adventurer–city–citizen structure of the original HUA. The logistics-hub-guided adaptive exploration mechanism constructs a fitness-weighted virtual hub from multiple high-quality city centers and combines it with global best guidance, thereby reducing excessive dependence on a single capital. The dynamic supply–demand redistribution mechanism assigns city-specific search ranges according to relative fitness and evolutionary progress, supporting a gradual transition from global exploration to local exploitation. The cooperative logistics delivery exploitation mechanism integrates neighboring-city cooperation, global best attraction, and an iteration-dependent Gaussian perturbation to strengthen citizen-level refinement. The accompanying theoretical analysis further explains the expected search directions, stochastic variations, boundedness, Markov property, and convergence behavior of the best-so-far fitness sequence under the stated assumptions.
The performance of EHUA was systematically evaluated on the CEC2014 and CEC2020 benchmark suites using numerical statistics, convergence curves, box plots, Wilcoxon signed-rank tests, Friedman rankings, CPU-time measurements, ablation experiments, parameter sensitivity analysis, and quantitative exploration–exploitation analysis. EHUA achieved the lowest mean fitness values on 20 of the 30 CEC2014 functions under both the 30- and 50-dimensional settings, on 8 of the 10 CEC2020 functions at 10 dimensions, and on all 10 CEC2020 functions at 20 dimensions. These results demonstrate strong overall competitiveness, repeatability, and adaptability, while also confirming that EHUA does not achieve the best performance on every individual function. The ablation results verify that each proposed mechanism contributes positively to the optimization performance and that their coordinated integration produces the strongest overall effect. The parameter sensitivity analysis identifies , , and as suitable default settings under the experimental conditions considered in this study. Moreover, the exploration–exploitation analysis shows that EHUA maintains relatively broad search coverage during the early iterations and progressively strengthens local refinement as the search proceeds. Although the additional logistics hub and neighborhood-selection operations introduce some computational overhead, the measured CPU times indicate that the increase remains limited and acceptable relative to the improvement in solution quality.
The applicability of EHUA was further investigated through cloud task scheduling experiments involving workloads ranging from 100 to 10,000 tasks. Under the considered static scheduling model, EHUA consistently achieved low comprehensive scheduling costs and maintained favorable compromises among monetary cost, execution time, and workload distribution as the problem scale increased. Nevertheless, several limitations should be acknowledged. First, the pairwise city-distance calculation and neighborhood-selection mechanism may increase computational cost when the number of cities or problem dimension becomes large. Second, although recommended parameter settings were obtained through sensitivity analysis, problem-specific calibration may still be required for optimization tasks with substantially different dimensions, constraints, or search ranges. Third, the theoretical results establish the boundedness of the population and the convergence of the best-so-far fitness sequence, but they do not constitute an unconditional guarantee of convergence to the global optimum under the current finite-horizon perturbation schedule. Fourth, the practical evaluation is currently limited to a simulated static cloud scheduling scenario with independent tasks, a fixed VM set, and a weighted-sum scalarization. Consequently, the present model does not explicitly characterize complete Pareto trade-offs or incorporate task dependencies, communication latency and bandwidth contention, deadline and SLA constraints, energy consumption, carbon emissions, dynamic VM availability, migration, failure recovery, or other production-level factors. Future work will therefore focus on reducing neighborhood-selection costs, developing self-adaptive parameter mechanisms, strengthening persistent exploration, constructing a Pareto-based multiobjective EHUA, extending the scheduling model to more realistic dynamic cloud environments, and validating the proposed algorithm on additional constrained engineering optimization problems and publicly available application datasets.