1. Introduction
Frequent analytic assessment of student writing is difficult to sustain in many Chinese College English programmes. College English instructors may teach two or three classes of more than 50 students each, so a writing task assigned across their classes can generate more than one hundred scripts for a single instructor. Such large-class conditions create substantial marking demands and reduce opportunities for frequent, individualised feedback [
1,
2]. Under these conditions, writing tasks may be assigned only a few times each semester, and feedback is often limited to a holistic score or brief comments. This workload constrains the formative assessment encouraged in the Guidelines on College English Teaching [
3] and the timely and specific feedback that formative assessment research associates with learning improvement [
4]. Automated writing evaluation (AWE) systems such as Pigai, a Chinese online writing evaluation platform, can provide immediate feedback on large numbers of essays, particularly on grammar, collocation, and mechanics. However, studies have reported uneven feedback accuracy and continued reliance on teacher judgement [
5,
6].
Large language models (LLMs) extend the range of automated support because they can assign scale- or rubric-based scores to second-language (L2) essays [
7,
8,
9,
10]. Their educational value, however, depends on how they are incorporated into the assessment process and how teachers interpret and use their outputs. Research on technology-supported instruction in other subjects similarly emphasises the role of teachers’ pedagogical decisions, motivational strategies, and interaction with students [
11]. In L2 essay scoring, prompting strategies, calibration examples, and repeated scoring can affect score consistency and agreement with human ratings [
8,
9,
10]. More general LLM-as-a-judge research also reports position, verbosity, and self-enhancement biases [
12]. From a language-assessment perspective, such variation can be treated as a rater-management problem. Operational writing assessments address comparable problems through rater training with benchmark scripts [
13]; that is, previously rated exemplar essays used to clarify score-level standards, through double rating and consistency monitoring [
13,
14] and through statistical modelling of rater severity [
14,
15]. The central question for College English programmes is therefore not whether an LLM can produce a score, but whether its scores can be aligned with local teacher standards and limited to the kinds of judgement they can support.
To address this question, the study treats each LLM as an auxiliary ordinal rater and evaluates a teacher-referenced procedure for making its scores interpretable on the local assessment scale. Two sources of benchmark essays are examined in separate stages: panels selected through agreement between two separate LLMs and panels based on exact agreement between the two College English teachers. Repeated ratings are used to examine within-model consistency. The resulting scores are then calibrated to the teacher reference scale using equipercentile linking [
16,
17], with location–scale correction and isotonic calibration included as comparison methods. An instability-based rule is also evaluated as a means of identifying ratings for teacher review. These procedures address differences in consistency, severity, score distribution, and scale use. They do not establish that an LLM understands writing quality in the same way as a teacher, and this boundary defines the scope of the claims made here.
The empirical analysis uses the Corpus of College English Writing (CCEW-414), which contains 414 timed classroom essays written by first- and second-year Chinese non-English majors at one applied undergraduate institution in Northwest China. Each essay was independently rated by two trained College English instructors using a seven-dimension analytic rubric informed by China’s Standards of English Language Ability (CSE). The two independent ratings provide the teacher data against which the LLM scores are evaluated; the construction of the reference score is described in
Section 3.3. Three LLMs from different model families rated the same essays under repeated scoring conditions. The analysis examines whether agreement among LLMs corresponds to alignment with teacher judgement, whether statistical calibration reduces systematic severity differences, how agreement varies across writing dimensions, and whether rating instability can be used to identify cases requiring teacher review.
By placing local teacher judgement at the centre of model evaluation, the study makes three related contributions. First, it distinguishes inter-model agreement from alignment with teacher reference scores and compares how benchmark panels validated through machine agreement and teacher agreement are associated with raw scoring performance. Second, it compares alternative calibration methods and separates improvements in scoring severity and scale use from evidence of dimension-level alignment, while also examining whether instability across repeated rating occasions can support targeted teacher review. Third, for College English teaching, it provides an empirical basis for the selective formative use of LLM-assisted scores: relatively stable lexical and grammatical dimensions may inform diagnostic profiling and targeted feedback, whereas content, coherence, argumentation, communicative quality, and other discourse-level judgements remain under direct teacher interpretation. Together, these contributions position LLM-assisted scoring as a locally calibrated and teacher-governed resource for low-stakes writing assessment rather than as an autonomous replacement for teacher judgement.
3. Materials and Methods
3.1. Corpus and Essay Profile
This study used a corpus-based, cross-validated comparative rater-evaluation design to examine the agreement, calibration, and repeatability of LLM-assisted scores against a local teacher reference. The design is comparative in that several machine raters and several calibration methods were evaluated against the same teacher reference on the same held-out data; it is a rater-evaluation design in that the object of study is the behaviour of the raters rather than the writing development of the students. No instructional intervention was administered, and no experimental manipulation was applied to the students.
The data were drawn from the Corpus of College English Writing (CCEW-414), which comprises 414 timed argumentative essays written in regular College English courses by first- and second-year non-English majors at an applied undergraduate institution in Northwest China. The essays were collected over two academic years, with each student contributing one essay. Students wrote by hand for 30 min under supervised classroom conditions and were not permitted to use dictionaries, online resources, electronic devices, or large language model tools. The five writing topics were drawn from course instruction: time management, technology and life, smartphone influence, digital media, and staying up late.
The essays were produced as part of regular course activities. Students were informed that their writing would be included in the corpus and used for research purposes, and they agreed to its use. The essays were submitted anonymously, and anonymity was maintained throughout the rating and analysis. The analytic corpus included all eligible essays completed under the stated conditions. No random sampling or score-based filtering was applied. Blank scripts, duplicate submissions, and scripts with substantial missing or illegible content were not eligible for inclusion. Essays were not filtered by length, writing quality, language accuracy, or subsequent teacher ratings. Of the 414 essays, 300 were written by male students and 114 by female students, reflecting the enrolment profile of the institution. All 414 essays entered every analysis reported below; under the cross-validation design each essay contributed to the training partition of four folds and to the held-out partition of exactly one fold.
Essay length averaged 133.1 words (SD = 28.7; range = 53–240), and the essays contained on average 3.6 paragraphs (SD = 1.0; range = 1–7). At the essay level, the mean sentence count was 10.7 (SD = 3.6), and the mean sentence length was 13.4 words (SD = 4.3). The mean type–token ratio was 0.604 (SD = 0.093), and the mean bidirectional measure of textual lexical diversity (MTLD) was 73.6 (SD = 40.4). MTLD has been shown to be relatively insensitive to text length [
30]. These indices describe the observed corpus and do not constitute an independent classification of student proficiency.
Approximately 11.6% of the essays began with “Nowadays…” or “With the (rapid) development of…”, while 20.3% began with one of a broader set of textbook-style openings, including “As we all know…” and “In recent years…”. The relatively short texts and recurring textbook-style openings compress the range of observable quality differences that any rater, human or machine, must discriminate, and were taken into account when interpreting agreement statistics. Text-level indices recorded for each essay included token, type, sentence, and paragraph counts; type–token ratio and MTLD; mean sentence length; and counts of selected connectors, complex structures, and surface error patterns.
3.2. Analytic Rating Rubrics
Two analytic rubrics were used at different stages of the study. The teacher rubric provided the local reference framework for the main analyses, whereas a preliminary six-dimension machine rubric was used only in the initial machine-anchored comparison. The two rubrics were not treated as construct-equivalent; comparisons were limited to dimensions with sufficient overlap in their descriptors.
The teacher rubric adopted the overall proficiency score and six analytic dimensions/traits of the English Language Learner Insight, Proficiency and Skills Evaluation (ELLIPSE) framework [
27]—overall writing quality, cohesion and coherence, syntactic ability, vocabulary, phraseology, grammatical accuracy, and conventions—together with its 1–5 scale in half-point increments. The ELLIPSE framework was selected because it is a documented, peer-reviewed analytic scheme developed for the rating of English language learner writing, with published rater training materials and level descriptors. The level descriptors used in the present study were rewritten with reference to the 2018 edition of China’s Standards of English Language Ability, which was the version in force during rubric development, together with the Guidelines on College English Teaching and the College English Test writing specifications [
3,
18,
19], and were localised to the writing profile and instructional expectations of the study population. The structure of the revision followed established principles for analytic rating-scale development in second-language writing assessment [
13,
21]. For example, a score of 3 for overall writing quality indicated that the essay conveyed the basic message but showed limited development and noticeable structural and language problems.
The analytic design was intended to produce a dimension profile rather than only a single holistic mark. Such a profile can identify aspects of writing for which teacher explanation, student revision, or further instruction may be needed.
The preliminary machine rubric was a study-specific adaptation of the same ELLIPSE framework, and
Table 1 documents each step of that adaptation. Three changes were made. First, pairs of closely related source dimensions were merged so that the preliminary rubric would remain short enough to be applied by a single model call per dimension: vocabulary and phraseology were combined into vocabulary and expression, and grammar and syntax were combined into grammar and syntax. Second, two dimension labels were renamed to match the terminology used in College English teaching documents in China: cohesion became organisation and coherence, and conventions became mechanics. Third, one dimension with no counterpart in ELLIPSE, content and task fulfilment, was added to cover response to the writing task, a criterion that is explicit in the CET writing specifications [
19] but is not represented in the ELLIPSE analytic set. The resulting rubric was therefore a study-specific operational rubric rather than a direct reproduction of the ELLIPSE framework.
The machine rubric employed integer scores from 1 to 5 across the six dimensions. Integer scoring was adopted in this preliminary stage because the machine-agreed benchmark panels were defined by exact agreement between two independent models at each score level, and exact agreement is attainable at a useful rate only on a coarse scale. The choice has a measurable cost: an integer scale cannot represent the half-point distinctions the teachers used, and it therefore places a mechanical limit on agreement with a teacher reference expressed in quarter points. The machine-anchored stage is consequently reported as a preliminary comparison, and all substantive conclusions are drawn from the teacher-anchored stage, in which the models scored on the teachers’ own half-point scale.
Five machine-rubric dimensions had descriptor-level counterparts in the teacher rubric: overall quality, organisation and coherence, vocabulary and expression, grammar and syntax, and mechanics. The machine dimension of content and task fulfilment and the teacher dimensions of syntactic ability and phraseology had no one-to-one counterparts. The correspondences in
Table 1 indicate overlap in descriptor focus rather than construct equivalence. The five mapped dimensions were used only for descriptive comparisons in the machine-anchored stage. In the teacher-anchored stage, the LLMs applied the seven-dimension teacher rubric directly, without cross-rubric mapping.
3.3. Teacher Reference Scores
Two College English instructors, each with more than eight years of teaching experience, independently rated all 414 essays on the seven-dimension analytic rubric after norming on the dimension descriptors and the distinction between adjacent score levels. Neither instructor had access to the other’s scores, and both original ratings were retained in the dataset.
Under the rating protocol, essays for which the two overall scores differed by more than one point were flagged as large-disagreement cases; this occurred for 10 of the 414 essays (2.4%). No third-rater adjudication was conducted, and neither original rating was revised or replaced. The disagreement flag was retained in the dataset as a quality indicator, and all affected essays remained in the analysis. For each essay–dimension pair, the arithmetic mean of the two independent ratings was used as the teacher reference score because the two raters had equivalent training and status. The resulting mean is treated as a practical local reference rather than an error-free gold standard.
Each individual teacher score lay on the half-point grid from 1 to 5, so the mean of two such scores could also take quarter-point values. This resolution was retained in the error analyses; for quadratic weighted kappa, which requires a common category set, reference scores were assigned to the nearest half-point category, and all reported kappa values for every condition were computed in the same way.
Table 2 reports agreement between the two instructors. Dimension-level quadratic weighted kappa (QWK) ranged from 0.376 for overall writing quality to 0.670 for vocabulary, with a mean of 0.561 across the seven dimensions. Exact agreement ranged from 0.345 to 0.437, while the proportion of ratings within half a point ranged from 0.819 to 0.860. Pooled QWK was 0.724 for the five mapped dimensions used in the machine-anchored comparison and 0.747 across all seven dimensions used in the teacher-anchored comparison. Approximately two thirds of the teacher reference scores fell between 2.5 and 3.5. Because chance-corrected agreement statistics depend partly on marginal score distributions and score variation, these values were interpreted together with exact agreement and half-point tolerance [
31,
32].
The teacher–teacher values are used throughout as an empirical agreement benchmark for this corpus and not as a strict statistical ceiling. A machine rater compared with the mean of two teacher ratings is compared with a more reliable quantity than either teacher rating alone, and can in principle agree with that mean more closely than the two teachers agree with each other.
Section 4.5 therefore also reports agreement with each teacher’s original ratings separately.
Across the seven teacher-rubric dimensions, the instructors differed by more than half a point on 15.8% of essay–dimension pairs on average (15.7% across the five mapped dimensions). This proportion was used as the pair-level workload reference for the teacher-review rule defined in
Section 3.5.2.
3.4. LLM Raters and Rating Design
LLM scoring was organised in two stages that differed in the source of the rubric and benchmark essays. The machine-anchored stage examined scoring based on the six-dimension machine rubric and machine-agreed benchmark essays. The teacher-anchored stage examined scoring based on the local seven-dimension teacher rubric and teacher-agreed benchmark essays. Both stages included a rubric-only condition so that the contribution of benchmark referencing could be examined separately.
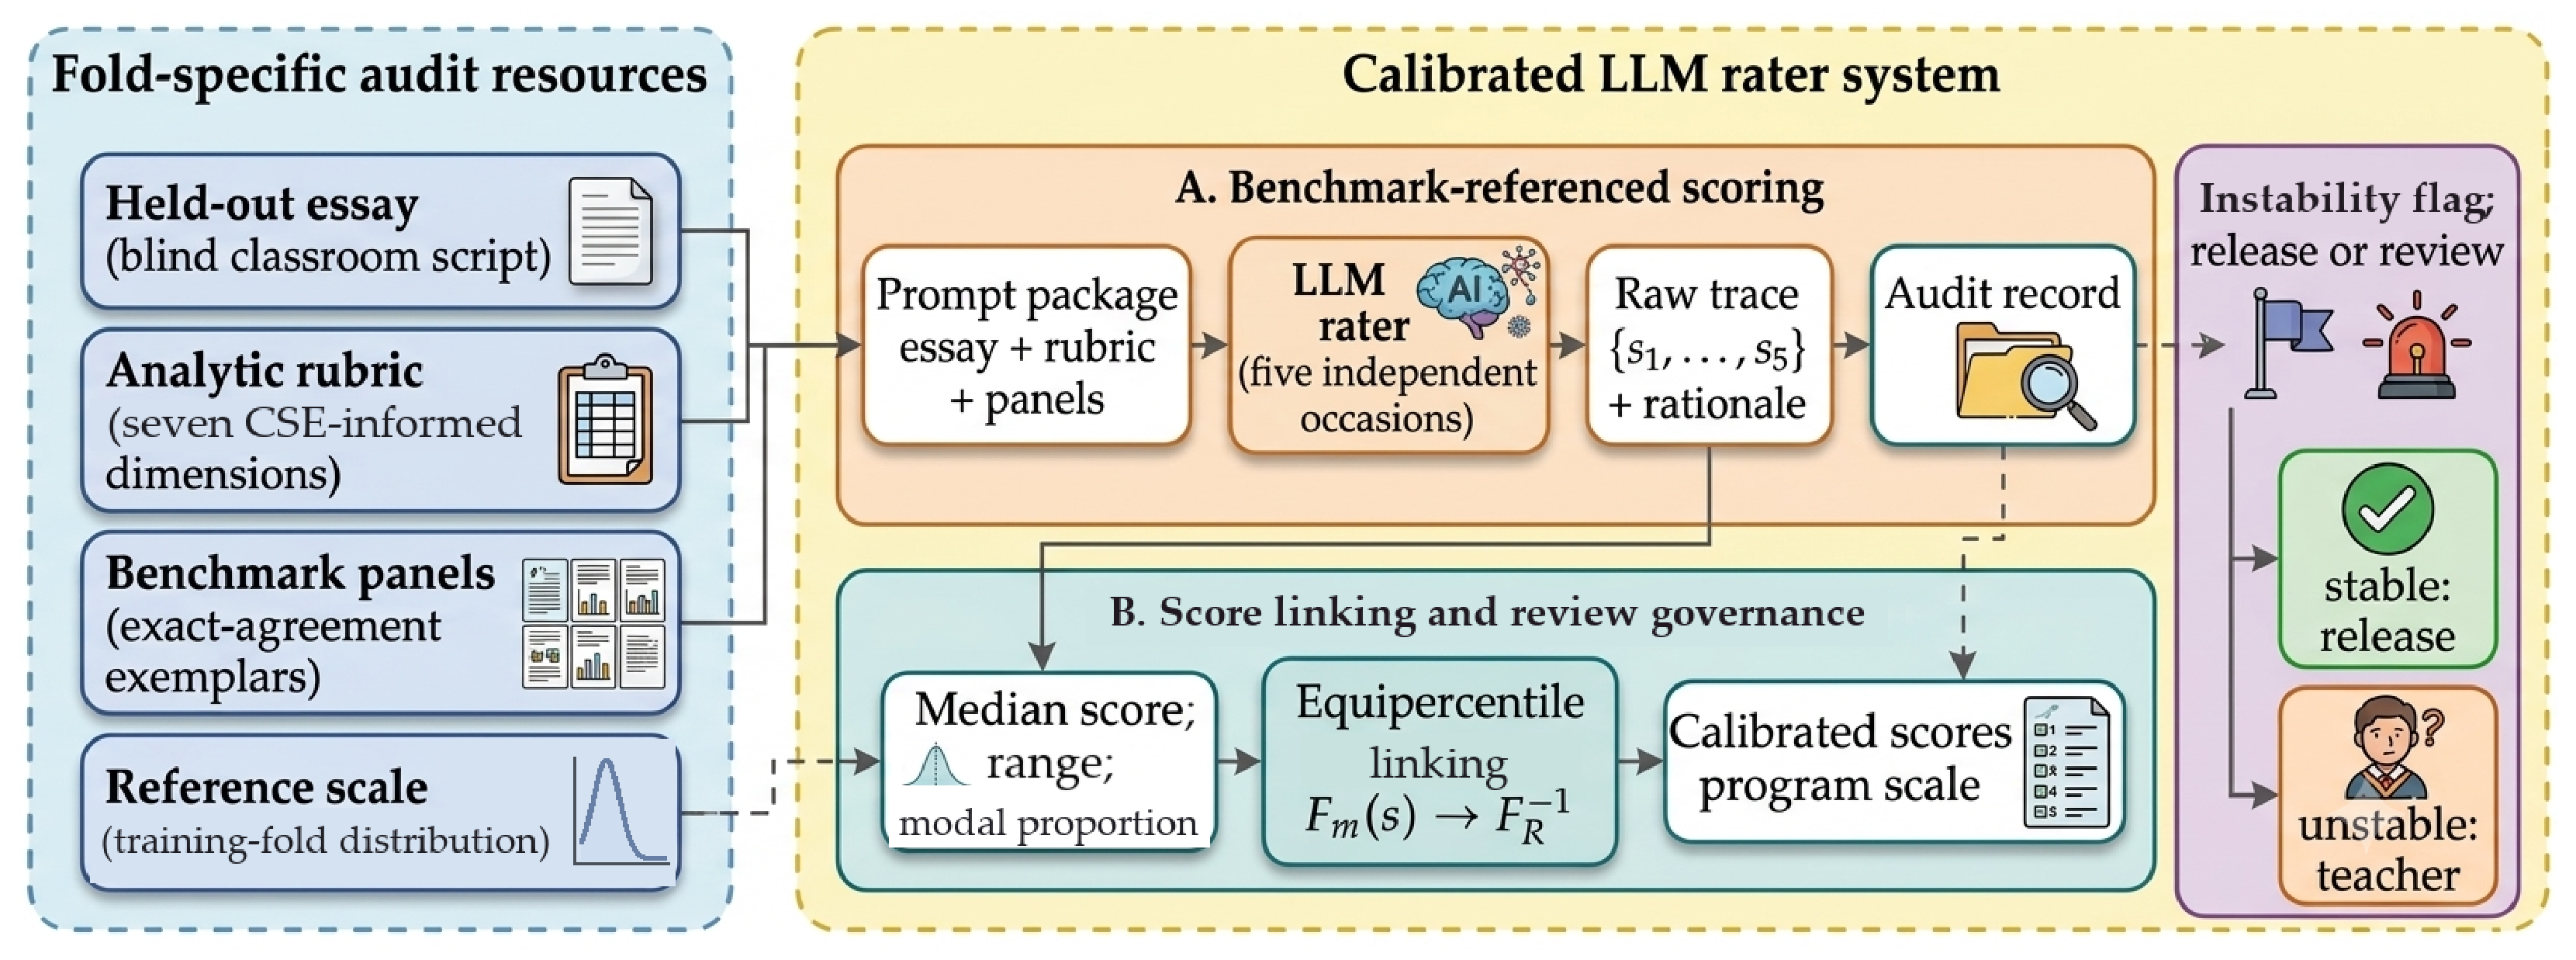
Figure 1 summarises the overall procedure, which combined fold-specific benchmark selection, repeated scoring, score aggregation, statistical calibration, and teacher-review flagging. No model was fine-tuned, and no model parameters were accessed. All benchmark panels and calibration functions were constructed from the training partition of each cross-validation fold, and target essays in the held-out partition were scored without access to their teacher ratings.
The two stages differed in rubric structure, score resolution, benchmark source, and model set. Their results are therefore interpreted within stage rather than as a controlled estimate of the independent effect of benchmark source. The machine-anchored stage examined whether agreement among models provided an adequate basis for defining the rating standard; the teacher-anchored stage examined scoring based directly on the local rubric and benchmark essays accepted by the two College English teachers.
3.4.1. Models, Parameters, and Prompt Design
Three deployable LLM raters from different model families were evaluated: DeepSeek-V3, GLM-4-Air, and Qwen3-Max. The machine-consensus benchmark-selection panel consisted of DeepSeek-R1 and GLM-4-Plus. The models were accessed through their providers’ public OpenAI-compatible interfaces. Provider-side model identifiers, endpoints, access dates, recorded decoding settings, prompt templates, and retry procedures are reported in
Appendix B.
The deployable raters were called with a temperature of 0.3, and the two benchmark-selection models with a temperature of 0.2. In the machine-anchored stage, DeepSeek-V3 and GLM-4-Air applied the six-dimension machine rubric and returned integer scores from 1 to 5. In the teacher-anchored stage, these two models and Qwen3-Max applied the seven-dimension teacher rubric and returned scores from 1 to 5 in half-point increments. Each call evaluated one dimension of one target essay.
The prompt contained a role instruction, the descriptors for the relevant dimension, the permitted score levels, and the target essay. In benchmark-referenced conditions, the prompt also presented the selected benchmark essays and their agreed scores in ascending order. The model was required to return a score in a structured format together with a one-sentence rationale.
The machine-consensus panel rated every essay once on the six-dimension machine rubric without access to teacher scores or to the other panel model’s output. Its ratings were used to select machine-agreed benchmark essays and to examine separately whether agreement between models corresponded to agreement with the teachers.
3.4.2. Benchmark Essay Panels
Benchmark panels were constructed separately within the training partition of each fold. No essay from the held-out partition could be selected as a benchmark for its own evaluation fold. Once selected, the same panel was used for all target essays rated under the corresponding fold, dimension, and experimental condition. Fixed consensus panels of this kind reproduce the benchmark-script logic of operational rater training, in which all raters are shown the same exemplars, and they differ deliberately from example-selection strategies that retrieve a different reference text for each target by lexical similarity [
33]. A fixed panel can also be read in full by a teacher, so the standard given to the model is inspectable.
For the machine-anchored stage, two benchmark essays were selected for each of the five integer score levels on each of the six machine-rubric dimensions. Eligible essays were those for which DeepSeek-R1 and GLM-4-Plus assigned exactly the same score on the relevant dimension. When more than two eligible essays were available, the two essays closest to the corpus median length were selected to reduce systematic length differences across benchmark levels. This procedure produced a ten-essay panel for each machine-rubric dimension.
For the teacher-anchored stage, benchmark essays were selected from scripts on which the two teachers had assigned exactly the same score on the relevant teacher-rubric dimension. One essay was selected for each half-point level represented among the eligible scripts, and where several essays were eligible at the same level the essay closest to the corpus median length was selected. Because exact teacher agreement was not observed at every half-point level of every dimension, the resulting panels contained between four and seven essays rather than the nine that a fully populated scale would allow; the attested levels for each dimension are listed in
Appendix B,
Table A6.
The machine-agreed and teacher-agreed panels were not assumed to embody the same standard merely because their component essays had received internally consistent ratings. Machine agreement indicated consistency between the two panel models, whereas teacher agreement linked the benchmark essays to the standards applied in the local College English programme.
3.4.3. Repeated Rating and Score Aggregation
Each essay–dimension pair was rated on five occasions under the same prompt condition. The five occasions were independent in the following sense: each occasion was issued as a separate stateless request to the provider’s chat-completions endpoint, containing a single user message with the full prompt and no conversation history; no score, rationale, or identifier from any previous occasion was included in the request; and no provider-side session, thread, or caching option was enabled. The five requests for a given pair were therefore identical in content and differed only in the model’s sampling behaviour at a temperature of 0.3.
The median of the five occasion scores was used as the aggregated raw machine score, because the median retains the original score scale and limits the influence of a single atypical response. Two additional indicators described consistency across occasions: the occasion range, defined as the difference between the highest and lowest of the five scores, and the modal proportion, defined as the proportion of the five occasions producing the most frequently assigned score, which can therefore take the values 0.2, 0.4, 0.6, 0.8, and 1.0. A smaller range and a higher modal proportion indicate greater consistency across repeated ratings. These three quantities are defined formally in
Appendix C, Equations (A1) and (A2).
These indicators describe within-model stability rather than agreement with teacher judgement. A model may repeatedly assign the same score while applying a rating standard that differs from that of the teachers. The one-sentence rationales were retained as part of the scoring record but were not used in score aggregation, calibration, or statistical analysis.
3.5. Score Calibration and Teacher Review
3.5.1. Calibration Methods
Three calibration methods were compared: location–scale correction, isotonic calibration, and equipercentile linking. Calibration was conducted separately for each model, rubric dimension, prompt condition, and cross-validation fold. All calibration parameters and mappings were estimated from the training partition and then applied without modification to the held-out partition. The three mappings are defined formally in
Appendix C, Equations (A3)–(A5), and their treatment of interpolation, boundary values, and rounding is summarised in
Appendix A,
Table A3.
Location–scale correction provided the simplest comparison method. It adjusted the mean and standard deviation of the machine scores so that they matched those of the teacher reference scores in the training partition. The method therefore addressed general differences in rating severity and score spread, but it did not account for uneven relationships between individual score levels.
Isotonic calibration used paired machine and teacher reference scores in the training partition to estimate a nondecreasing score relationship that minimises squared error. The adjustment could vary across different parts of the scale, but higher raw machine scores could not be mapped below lower raw scores. Because it minimises squared error, the method also shrinks predictions towards the conditional mean of the reference scores, a property examined directly in
Section 4.2.
Equipercentile linking related machine and teacher scores through their positions in the two training-fold score distributions. A machine score was assigned the value occupying approximately the same percentile position in the teacher reference distribution, with linear interpolation where percentile positions fell between observed score points. Linked values were restricted to the 1–5 reference range and rounded to the score grid used for reporting. Unlike the other two methods, equipercentile linking is estimated from the two marginal distributions rather than from paired observations, and the resulting mapping can be tabulated and inspected by a teacher.
The three methods represent different levels of score adjustment: average severity and spread, the relationship between paired scores, and the relative positions of the two distributions. Their comparison was intended to determine whether the observed improvements resulted specifically from equipercentile linking or could also be obtained through simpler or alternative forms of score correction.
A fixed strictly increasing score transformation does not change the rank ordering of the essays to which it is applied. In the present analysis, however, the mappings were estimated separately within each combination of fold and dimension, and rounding to a discrete score grid could create additional ties. A correlation computed over observations pooled across dimensions is therefore not the image of a single monotone transformation, and can change even when no within-dimension ordering is reversed. Spearman correlations were consequently examined at three levels: within each combination of fold and dimension, within each fold, and across the pooled out-of-fold predictions.
All three methods operate on score information rather than on the linguistic content of the essays. Reductions in severity, mean absolute error, or distributional mismatch are therefore evidence about score-scale alignment and not about the model’s judgement of content, argumentation, coherence, communicative effect, or overall writing quality.
3.5.2. Instability-Based Teacher-Review Rule
Repeated-rating instability was evaluated as a possible basis for directing selected scores to teacher review. An essay–dimension score was flagged when the range across the five rating occasions reached two scale points or when the modal proportion fell below a specified threshold; the rule is stated formally in
Appendix C, Equation (A6). Rules of this general form, in which a computed indicator assigns items to differentiated downstream handling rather than treating all items alike, are used in other applied settings, for example in the priority-based classification of data units for protected transmission [
34].
The modal-proportion threshold was determined from the training partition so that the proportion of flagged essay–dimension pairs remained as close as possible to, but did not exceed, the 15.8% pair-level workload reference derived from teacher disagreement. The resulting threshold was then applied to the held-out partition without further adjustment. Because the modal proportion takes only five distinct values, the attainable flagging rates form a coarse grid, and the rate obtained under the budget therefore differs across models. An essay was counted as requiring review if at least one of its seven dimension scores was flagged.
The review rule was evaluated by comparing teacher-referenced errors for flagged and unflagged scores. Quadratic weighted kappa, mean absolute error, and half-point tolerance accuracy were reported for both groups, together with essay-level paired bootstrap confidence intervals for the difference between them. The analysis also reported the accuracy of the scores that would have been released without teacher review, the proportion of essay–dimension pairs flagged, and the proportion of essays containing at least one flagged dimension. Repeated-score instability was treated as a screening indicator rather than as a complete measure of uncertainty, since a stable score is not necessarily accurate.
3.6. Evaluation Metrics and Statistical Analysis
Following psychometric guidelines for automated scoring evaluation [
23,
24], machine scores were compared with the teacher reference scores using five complementary indices: quadratic weighted kappa, Spearman rank correlation, mean absolute error, signed bias, and half-point tolerance accuracy. Complete definitions are given in
Appendix A,
Table A2.
Quadratic weighted kappa was used as the principal agreement statistic because the scores were ordinal, larger discrepancies required greater penalties, and chance agreement was non-negligible given the concentration of teacher scores within a restricted range. QWK is also widely used in automated essay-scoring evaluation. Because it is sensitive to marginal score distributions and score-range restriction [
31,
32], it was interpreted together with Spearman correlation, MAE, signed bias, and half-point tolerance accuracy.
Spearman correlation measured the similarity of the rank ordering produced by the machine and teacher reference scores, and was reported separately because a model may rank essays in a similar order while assigning scores at a different level of severity. Fold-level and within-dimension Spearman correlations were reported before and after calibration to distinguish changes caused by fold-specific mappings, by aggregation across dimensions, or by additional tied scores from genuine changes in rank ordering. Mean absolute error reported the average distance, in score points, between the machine score and the teacher reference score. Signed bias reported the average machine-minus-teacher difference, with negative values indicating greater severity than the teacher reference. Half-point tolerance accuracy reported the proportion of machine scores falling within half a point of the teacher reference score, the scoring interval used by the individual teachers.
Results were reported both across pooled essay–dimension observations and separately for each writing dimension. Dimension-level results provided the primary basis for educational interpretation because pooled statistics could conceal substantial differences among vocabulary, grammar, cohesion, conventions, and overall writing quality.
All analyses used stratified five-fold cross-validation at the essay level, stratified on the rounded teacher reference score for overall writing quality, with a fixed random seed. The five held-out partitions contained 83, 83, 83, 83, and 82 essays. Benchmark panels, calibration parameters, review thresholds, and score mappings were estimated only from the training partition of each fold. Each essay received one set of held-out predictions, and no teacher score from a held-out essay was used to construct the resources applied to that essay. The three calibration methods were compared using the same held-out raw machine scores.
Statistical uncertainty for the main comparisons was estimated through paired bootstrap resampling at the essay level with 1000 resamples. Resampling was conducted by essay rather than by individual dimension score so that the dependence among ratings of different dimensions from the same essay was retained. Ninety-five per cent confidence intervals were reported for the main differences between raw and calibrated conditions, between calibration methods, and between flagged and unflagged scores.
In addition to comparison with the mean teacher reference score, machine scores were compared separately with the original ratings of each teacher as a sensitivity analysis, and subgroup consistency was examined descriptively by gender and by essay-length terciles. The subgroup analyses were used to identify variation within the present corpus rather than to establish general fairness across student populations.
4. Results
4.1. Inter-Model Agreement and Teacher-Referenced Alignment of Raw LLM Scores
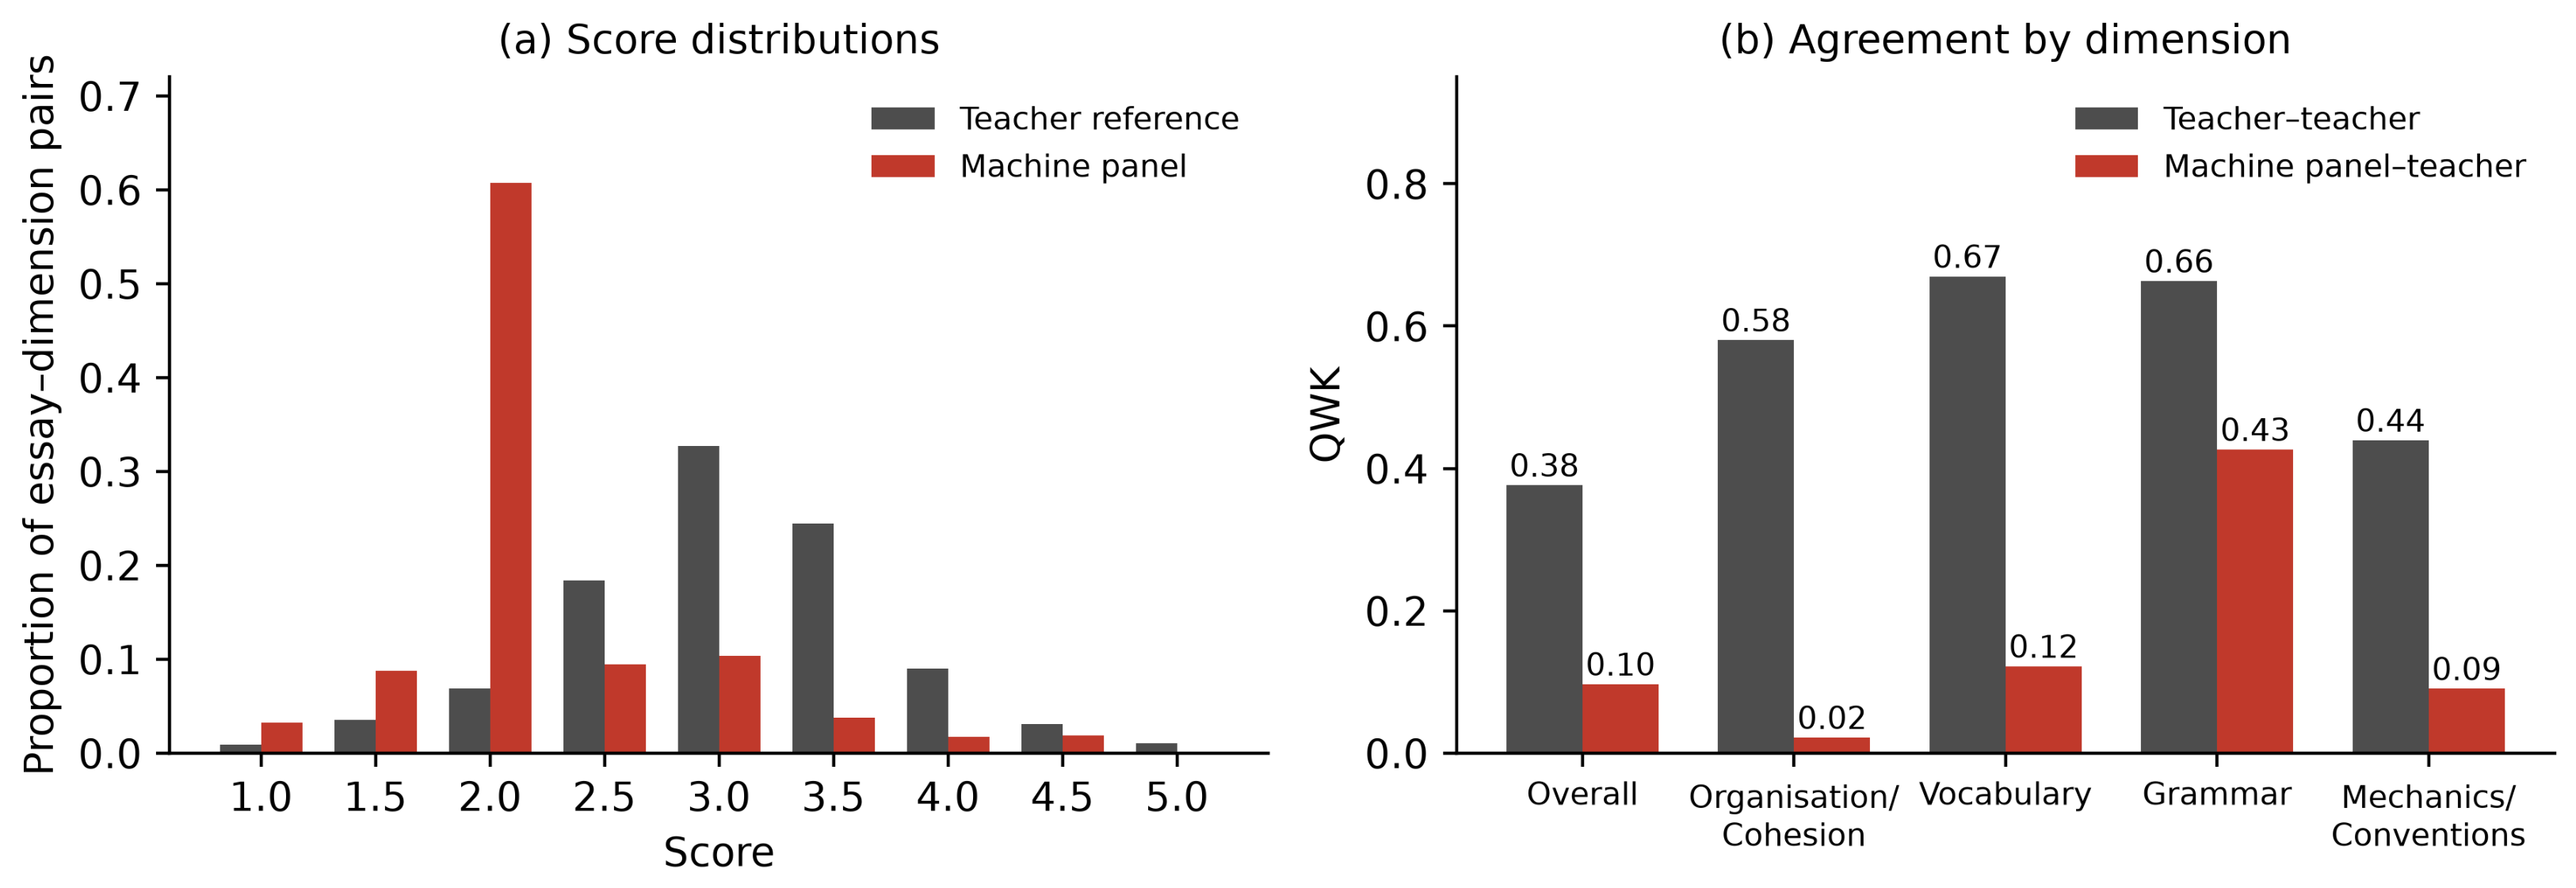
The preliminary machine-anchored comparison examined whether agreement between LLMs provided evidence that their ratings reflected the standards applied by the two College English teachers. DeepSeek-R1 and GLM-4-Plus showed high inter-model agreement across the six machine-rubric dimensions, with QWK values ranging from 0.695 to 0.778 and exact agreement of 77.7%. These values were higher than the corresponding teacher–teacher agreement values, indicating that the two models applied broadly similar rating standards.
Their agreement with the teacher reference scores was substantially lower. When the two panel ratings were combined for comparison with the teacher reference, mean teacher-referenced QWK was 0.152 across the five mapped dimensions. Dimension-level QWK was 0.097 for overall writing quality, 0.022 for organisation and cohesion, 0.122 for vocabulary, 0.427 for grammar, and 0.090 for mechanics and conventions. Grammar showed the closest correspondence with teacher ratings, whereas agreement was limited for overall writing quality, discourse organisation, vocabulary, and conventions.
The difference was also evident in rating severity. Across the five mapped dimensions, the panel models assigned scores 0.95 points below the teacher reference scores on average, with dimension-level signed bias ranging from −1.64 to −0.40. Only 26.1% of the machine-panel scores fell within half a point of the teacher reference score, compared with 84.3% of the paired teacher ratings on the same dimensions. As shown in
Figure 2, the machine-panel score distribution was concentrated at lower score levels, while the degree of teacher-referenced agreement varied considerably across dimensions.
The raw rubric-only scores produced by the two deployable raters showed a similar directional pattern. DeepSeek-V3 obtained a pooled QWK of 0.086, a signed bias of −0.989, and a half-point tolerance accuracy of 0.223. GLM-4-Air showed closer, but still limited, teacher-referenced agreement, with a pooled QWK of 0.249, a signed bias of −0.656, and a half-point tolerance accuracy of 0.360. Both deployable raters therefore assigned systematically lower raw scores than the teachers, although the extent of severity and agreement differed between models.
These results show that inter-model agreement alone was insufficient to define the local rating standard. Because the preliminary stage used an integer machine rubric, its values are not directly comparable with those from the teacher-anchored analysis.
4.2. Effects of Benchmark Referencing and Score Calibration
Table 3 compares raw scores obtained with and without benchmark essays under the machine-anchored and teacher-anchored conditions. In the machine-anchored stage, machine-agreed benchmark panels produced small and inconsistent changes in teacher-referenced performance. For DeepSeek-V3, pooled QWK increased only from 0.086 in the rubric-only condition to 0.107 in the benchmark-referenced condition, while Spearman correlation increased from 0.164 to 0.181. MAE decreased from 1.180 to 1.133, and signed bias changed from −0.989 to −0.935. For GLM-4-Air, machine-agreed benchmarks reduced MAE from 0.926 to 0.802 and reduced signed severity from −0.656 to −0.432, and half-point tolerance accuracy increased from 0.360 to 0.456; however, pooled QWK decreased from 0.249 to 0.225 and Spearman correlation decreased from 0.352 to 0.251. The machine-agreed panels therefore affected score location and absolute error but did not consistently improve teacher-referenced agreement or rank ordering.
A clearer pattern was observed in the teacher-anchored stage. Teacher-agreed benchmark panels improved raw QWK for all three deployable raters. For DeepSeek-V3, QWK increased from 0.161 under direct scoring with the teacher rubric to 0.286 with teacher-agreed benchmarks. The corresponding increases were from 0.249 to 0.379 for GLM-4-Air and from 0.230 to 0.401 for Qwen3-Max. Spearman correlation also increased from 0.183 to 0.322, from 0.309 to 0.409, and from 0.301 to 0.468, respectively. The teacher-agreed panels reduced absolute error and systematic severity as well: MAE decreased from 0.808 to 0.747 for DeepSeek-V3, from 0.783 to 0.684 for GLM-4-Air, and from 0.835 to 0.686 for Qwen3-Max, and signed bias moved from −0.445 to −0.302, from −0.332 to −0.115, and from −0.418 to −0.194, respectively.
Teacher-agreed benchmark panels were consistently associated with closer raw alignment in the teacher-anchored stage. Because the two stages differed in several design features, the contrast is descriptive rather than causal.
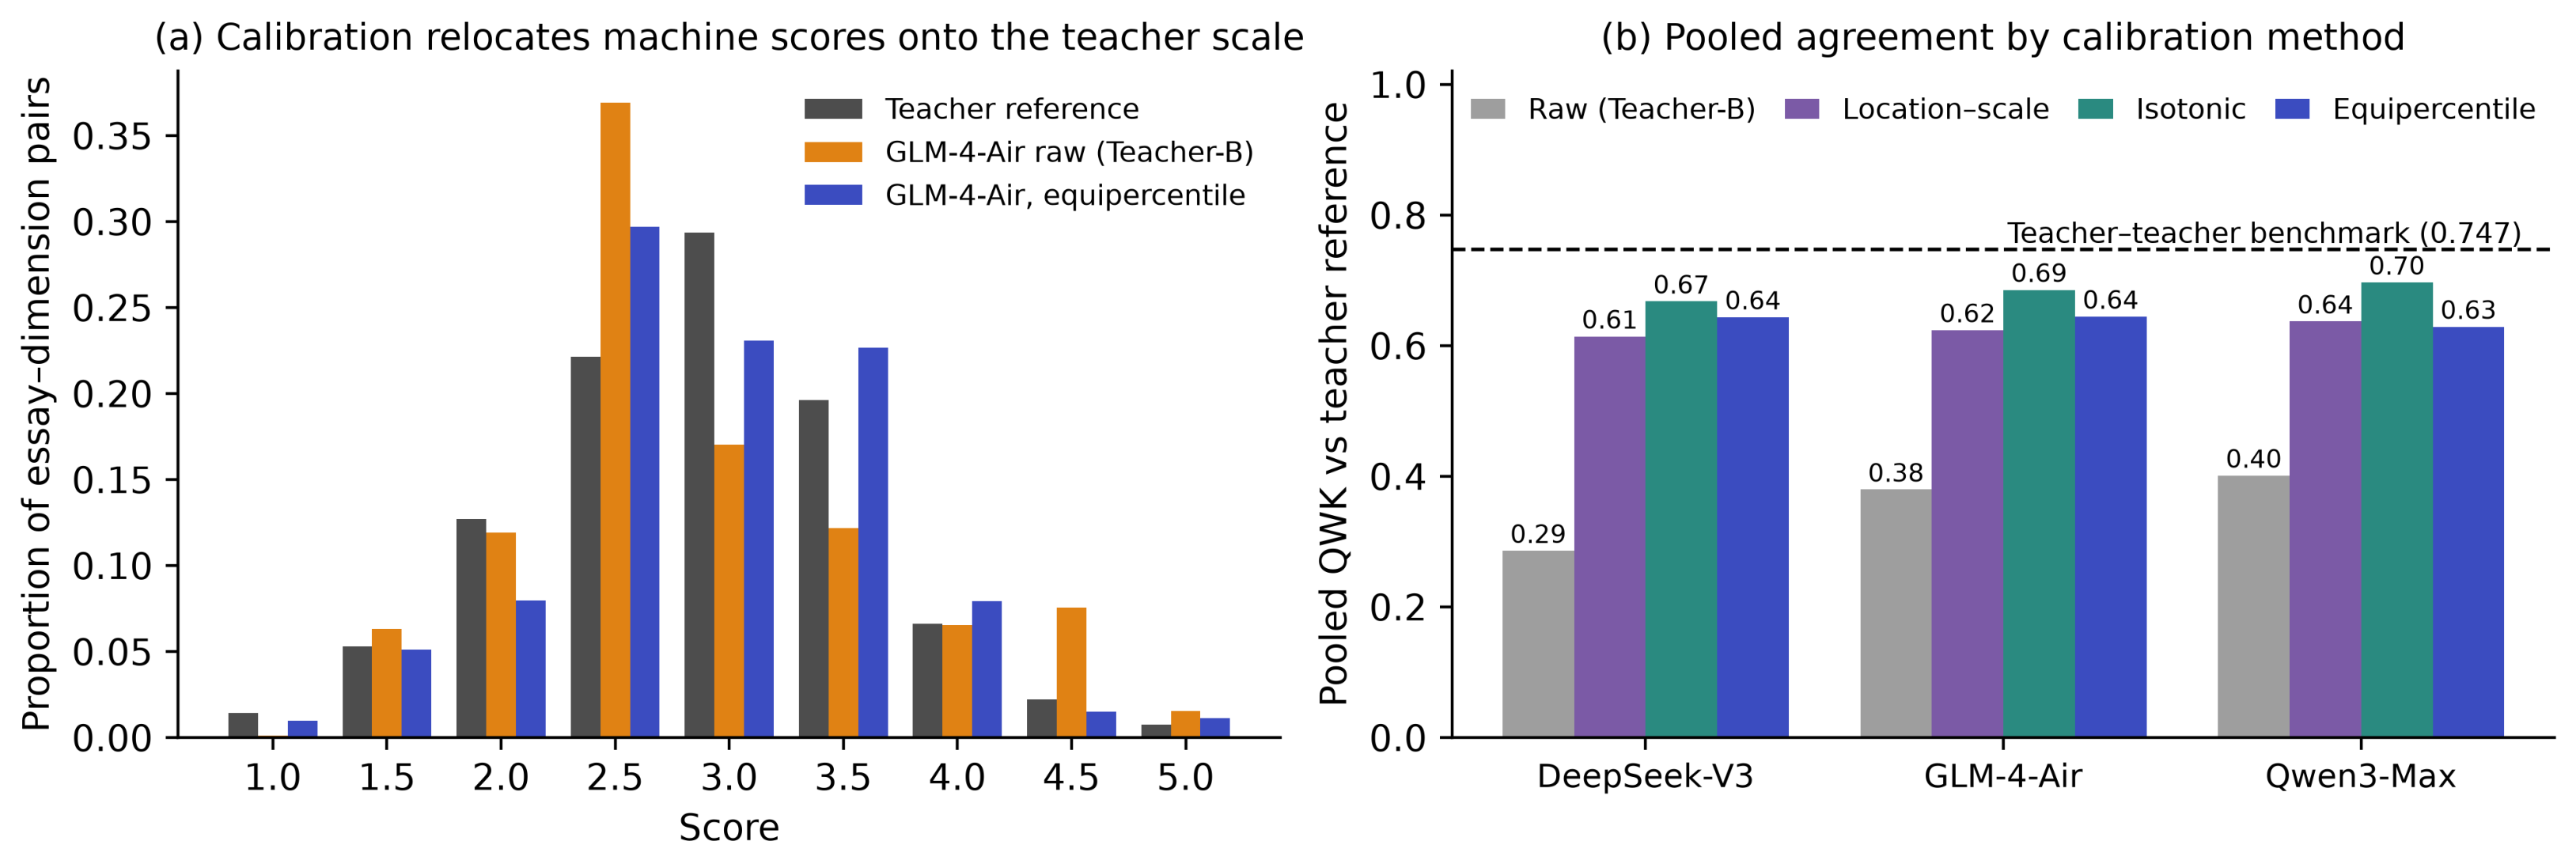
Table 4 compares location–scale correction, isotonic calibration, and equipercentile linking using the same held-out raw scores under the teacher-benchmark condition. All three methods produced large and broadly similar improvements over the raw scores. Across the three models, pooled QWK after location–scale correction ranged from 0.614 to 0.637, compared with 0.668 to 0.697 after isotonic calibration and 0.629 to 0.644 after equipercentile linking, against raw values of 0.286 to 0.401. Corresponding MAE values were 0.475–0.484, 0.378–0.385, and 0.462–0.487, against raw values of 0.684–0.747. Signed bias, which ranged from −0.302 to −0.115 across the three models in the raw condition, was reduced to −0.027 to +0.028 after location–scale correction, −0.034 to +0.031 after isotonic calibration, and −0.150 to −0.072 after equipercentile linking. Half-point tolerance accuracy ranged from 0.688 to 0.699, 0.794 to 0.803, and 0.704 to 0.723 respectively, against raw values of 0.481–0.543. The same ordering of methods was obtained in the rubric-only condition, where pooled QWK reached 0.593–0.609 after location–scale correction, 0.661–0.687 after isotonic calibration, and 0.617–0.638 after equipercentile linking.
The improvement was therefore not specific to equipercentile linking. Paired bootstrap comparisons at the essay level showed that the differences among the three methods were an order of magnitude smaller than the difference between any of them and the raw scores. Relative to raw scores, equipercentile linking increased pooled QWK by +0.358 (95% CI [+0.337, +0.378]) for DeepSeek-V3, +0.265 ([+0.247, +0.284]) for GLM-4-Air, and +0.228 ([+0.212, +0.245]) for Qwen3-Max. Relative to location–scale correction, the corresponding differences were only +0.030 ([+0.018, +0.042]), +0.021 ([+0.009, +0.033]), and −0.008 ([−0.022, +0.007]). Relative to isotonic calibration, equipercentile linking was lower by −0.025 ([−0.043, −0.007]), −0.041 ([−0.057, −0.025]), and −0.068 ([−0.085, −0.050]), and also produced higher MAE by +0.077 to +0.103 points and lower half-point tolerance accuracy by 0.073 to 0.090. Because a correction based on two summary statistics recovers almost the whole of the gain, the improvement reflects the removal of systematic severity and scale-use differences rather than a property of any individual method.
Figure 3 shows the distributional effect of calibration. Before calibration, machine scores were concentrated below the teacher reference distribution; after calibration their location and spread more closely approximated the teacher scores.
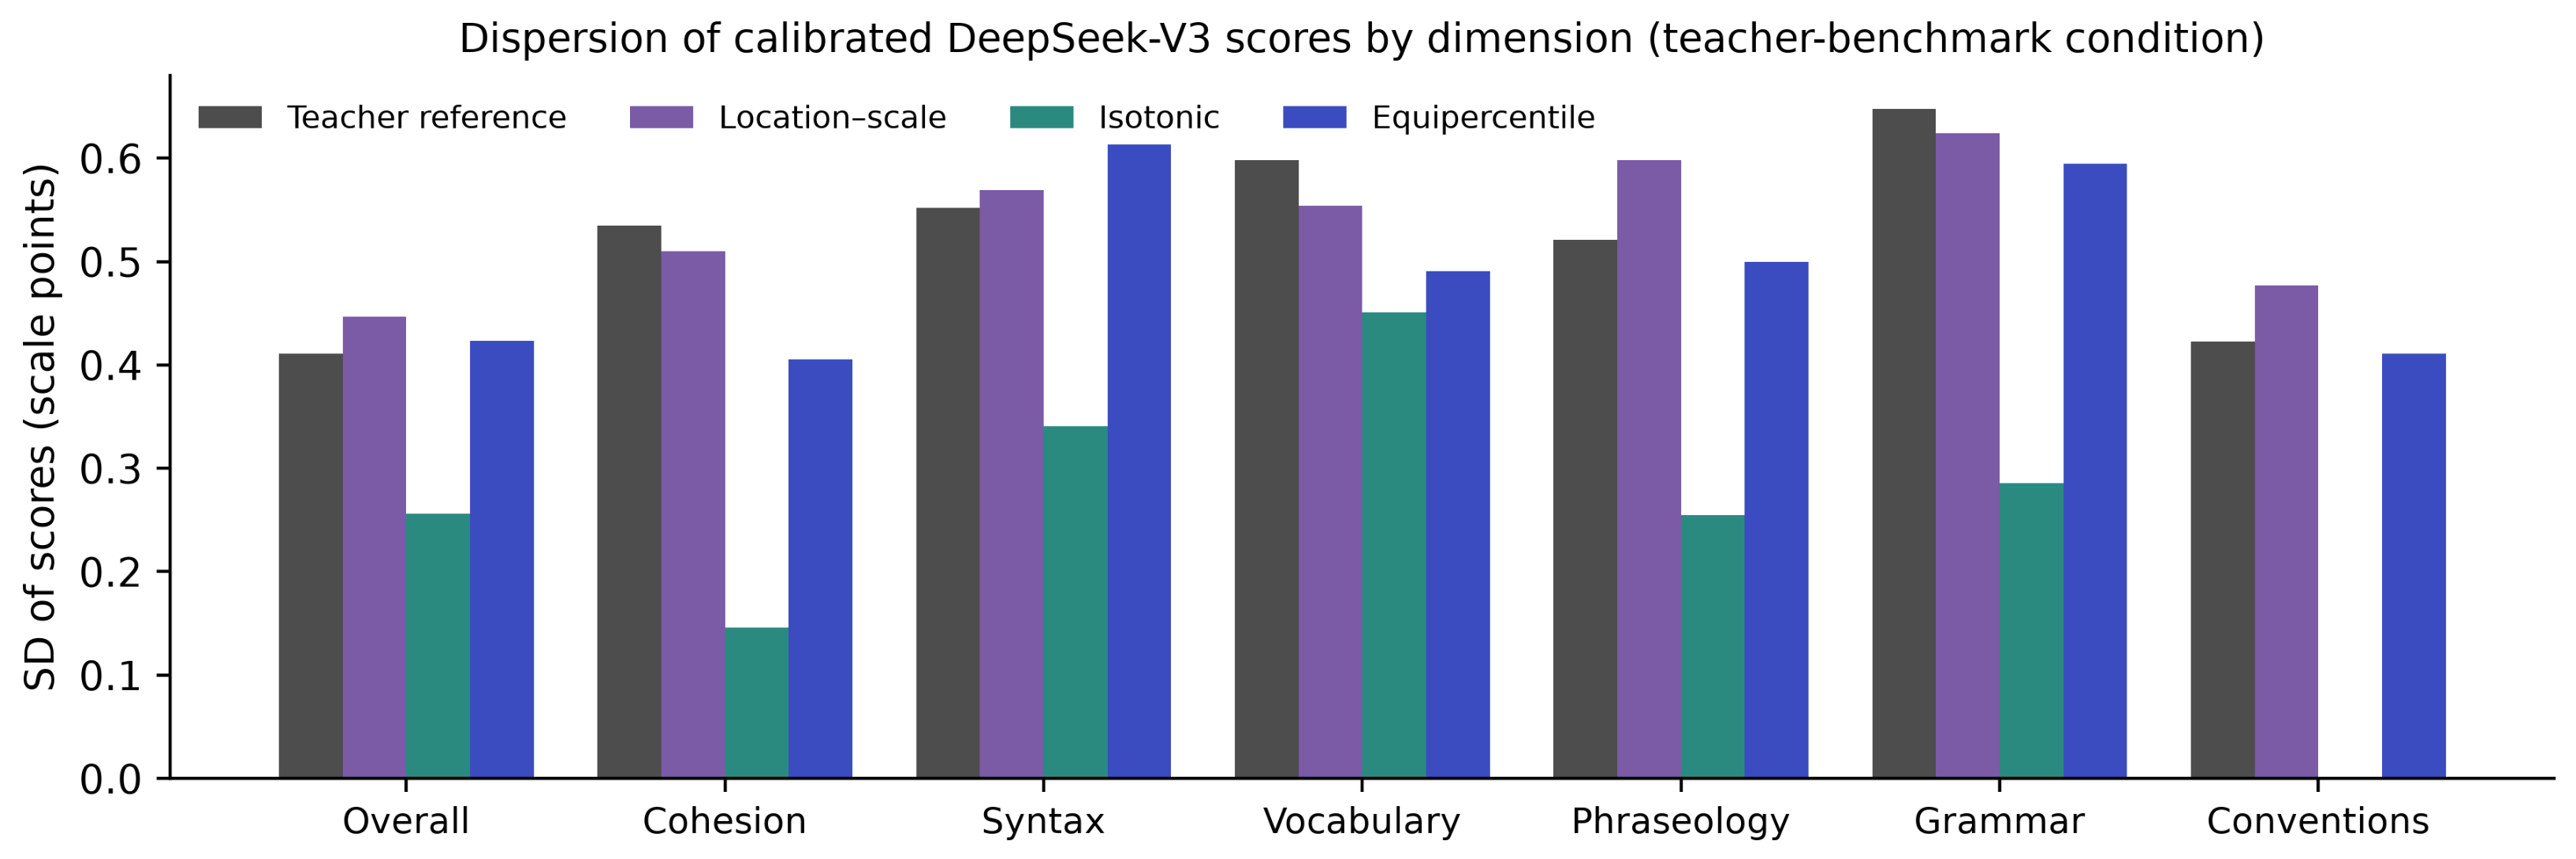
The pooled advantage of isotonic calibration is accompanied by a compression of the score distribution, shown in
Figure 4. Pooled across the seven dimensions, the standard deviation of the teacher reference scores was 0.719, and the standard deviations of the calibrated machine scores were 0.710–0.753 after location–scale correction and 0.694–0.717 after equipercentile linking, but only 0.553–0.594 after isotonic calibration. At the dimension level the compression was severe: for conventions, isotonic calibration returned the single value 3.0 for every essay in every model, giving a standard deviation of 0 and a dimension-level QWK of 0, while its MAE for that dimension was low because a constant close to the reference mean minimises absolute deviation in a narrow distribution. Its higher pooled QWK is obtained because differences in level between dimensions survive the pooling even when within-dimension discrimination has been removed. Equipercentile linking retained score dispersion more closely than isotonic calibration and was therefore used in the subsequent dimension-level, review-rule, and subgroup analyses. The contrast also shows that pooled agreement alone is insufficient for selecting a calibration method for classroom reporting.
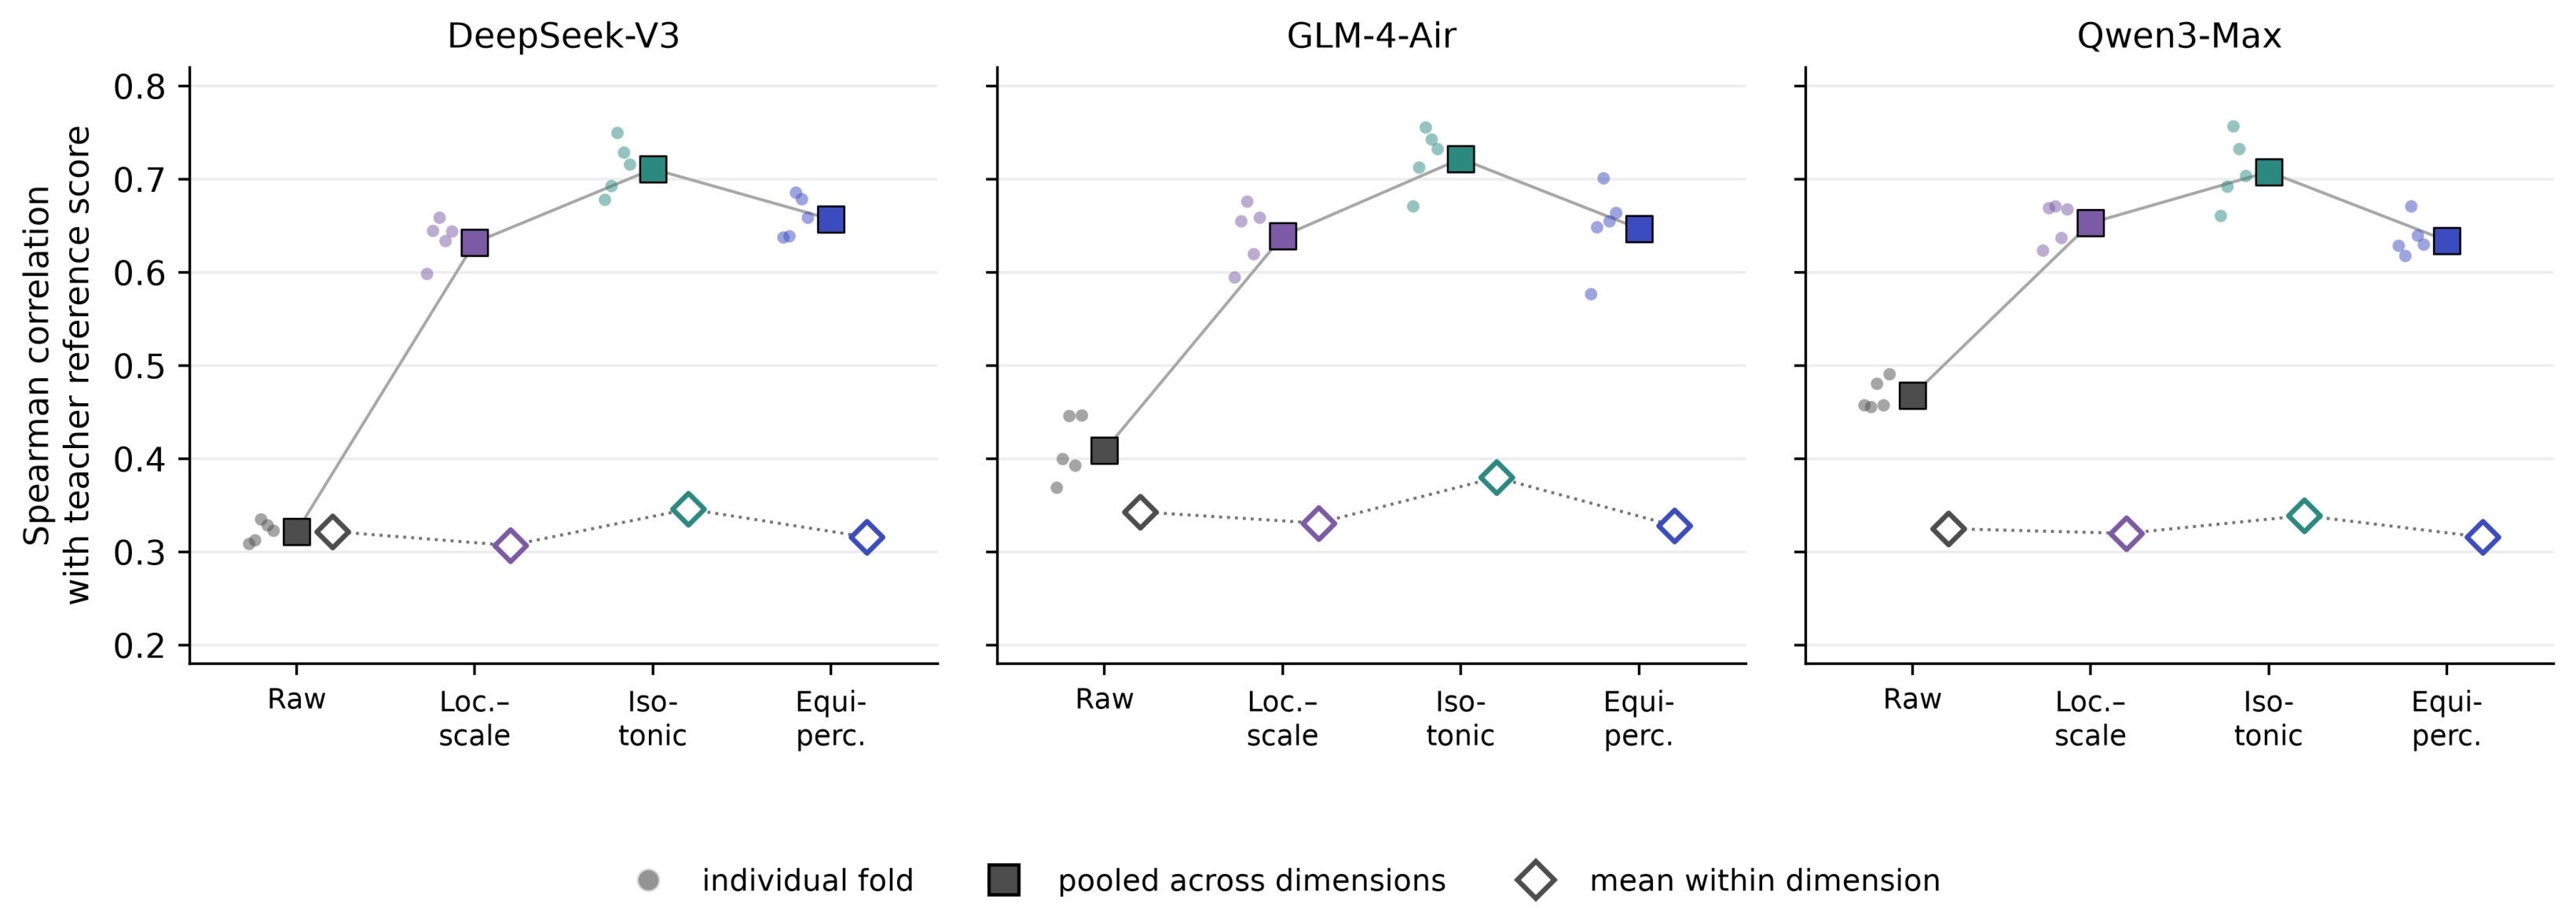
Pooled Spearman correlations increased after calibration, including increases from 0.322 to 0.657 for DeepSeek-V3, from 0.409 to 0.647 for GLM-4-Air, and from 0.468 to 0.634 for Qwen3-Max in the teacher-benchmark condition after equipercentile linking.
Figure 5 separates the levels at which this change occurs. Within each fold, the correlation computed over all seven dimensions rose in the same way as the pooled value, from 0.309–0.335 to 0.638–0.686 for DeepSeek-V3, from 0.369–0.447 to 0.577–0.701 for GLM-4-Air, and from 0.456–0.491 to 0.618–0.671 for Qwen3-Max. Within each individual combination of fold and dimension, where the calibration is a single monotone mapping, the correlation was essentially unchanged: the mean change across the 35 cells was +0.0004 for DeepSeek-V3, −0.0110 for GLM-4-Air, and −0.0011 for Qwen3-Max, and the largest change observed in any single cell was 0.113. Averaged over the seven dimensions, the within-dimension correlation did not improve, moving from 0.322 to 0.316 for DeepSeek-V3, from 0.343 to 0.328 for GLM-4-Air, and from 0.325 to 0.316 for Qwen3-Max.
Calibration was estimated separately for each dimension, so a correlation computed over observations pooled across dimensions is not the image of one monotone transformation. Before calibration, the seven dimensions were displaced from the teacher scale by different amounts, which misaligned the pooled ranking; correcting each dimension separately removes that misalignment and raises the pooled correlation without reordering any essay within any dimension. The small residual changes within individual cells follow from rounding to the discrete reporting grid, which increased the mean number of tied values per cell from 75.7–75.8 to 77.8–78.2. The increase in pooled rank correlation therefore indicates improved comparability of scores across dimensions rather than improved discrimination among essays.
4.3. Dimension-Level Teacher-Referenced Performance
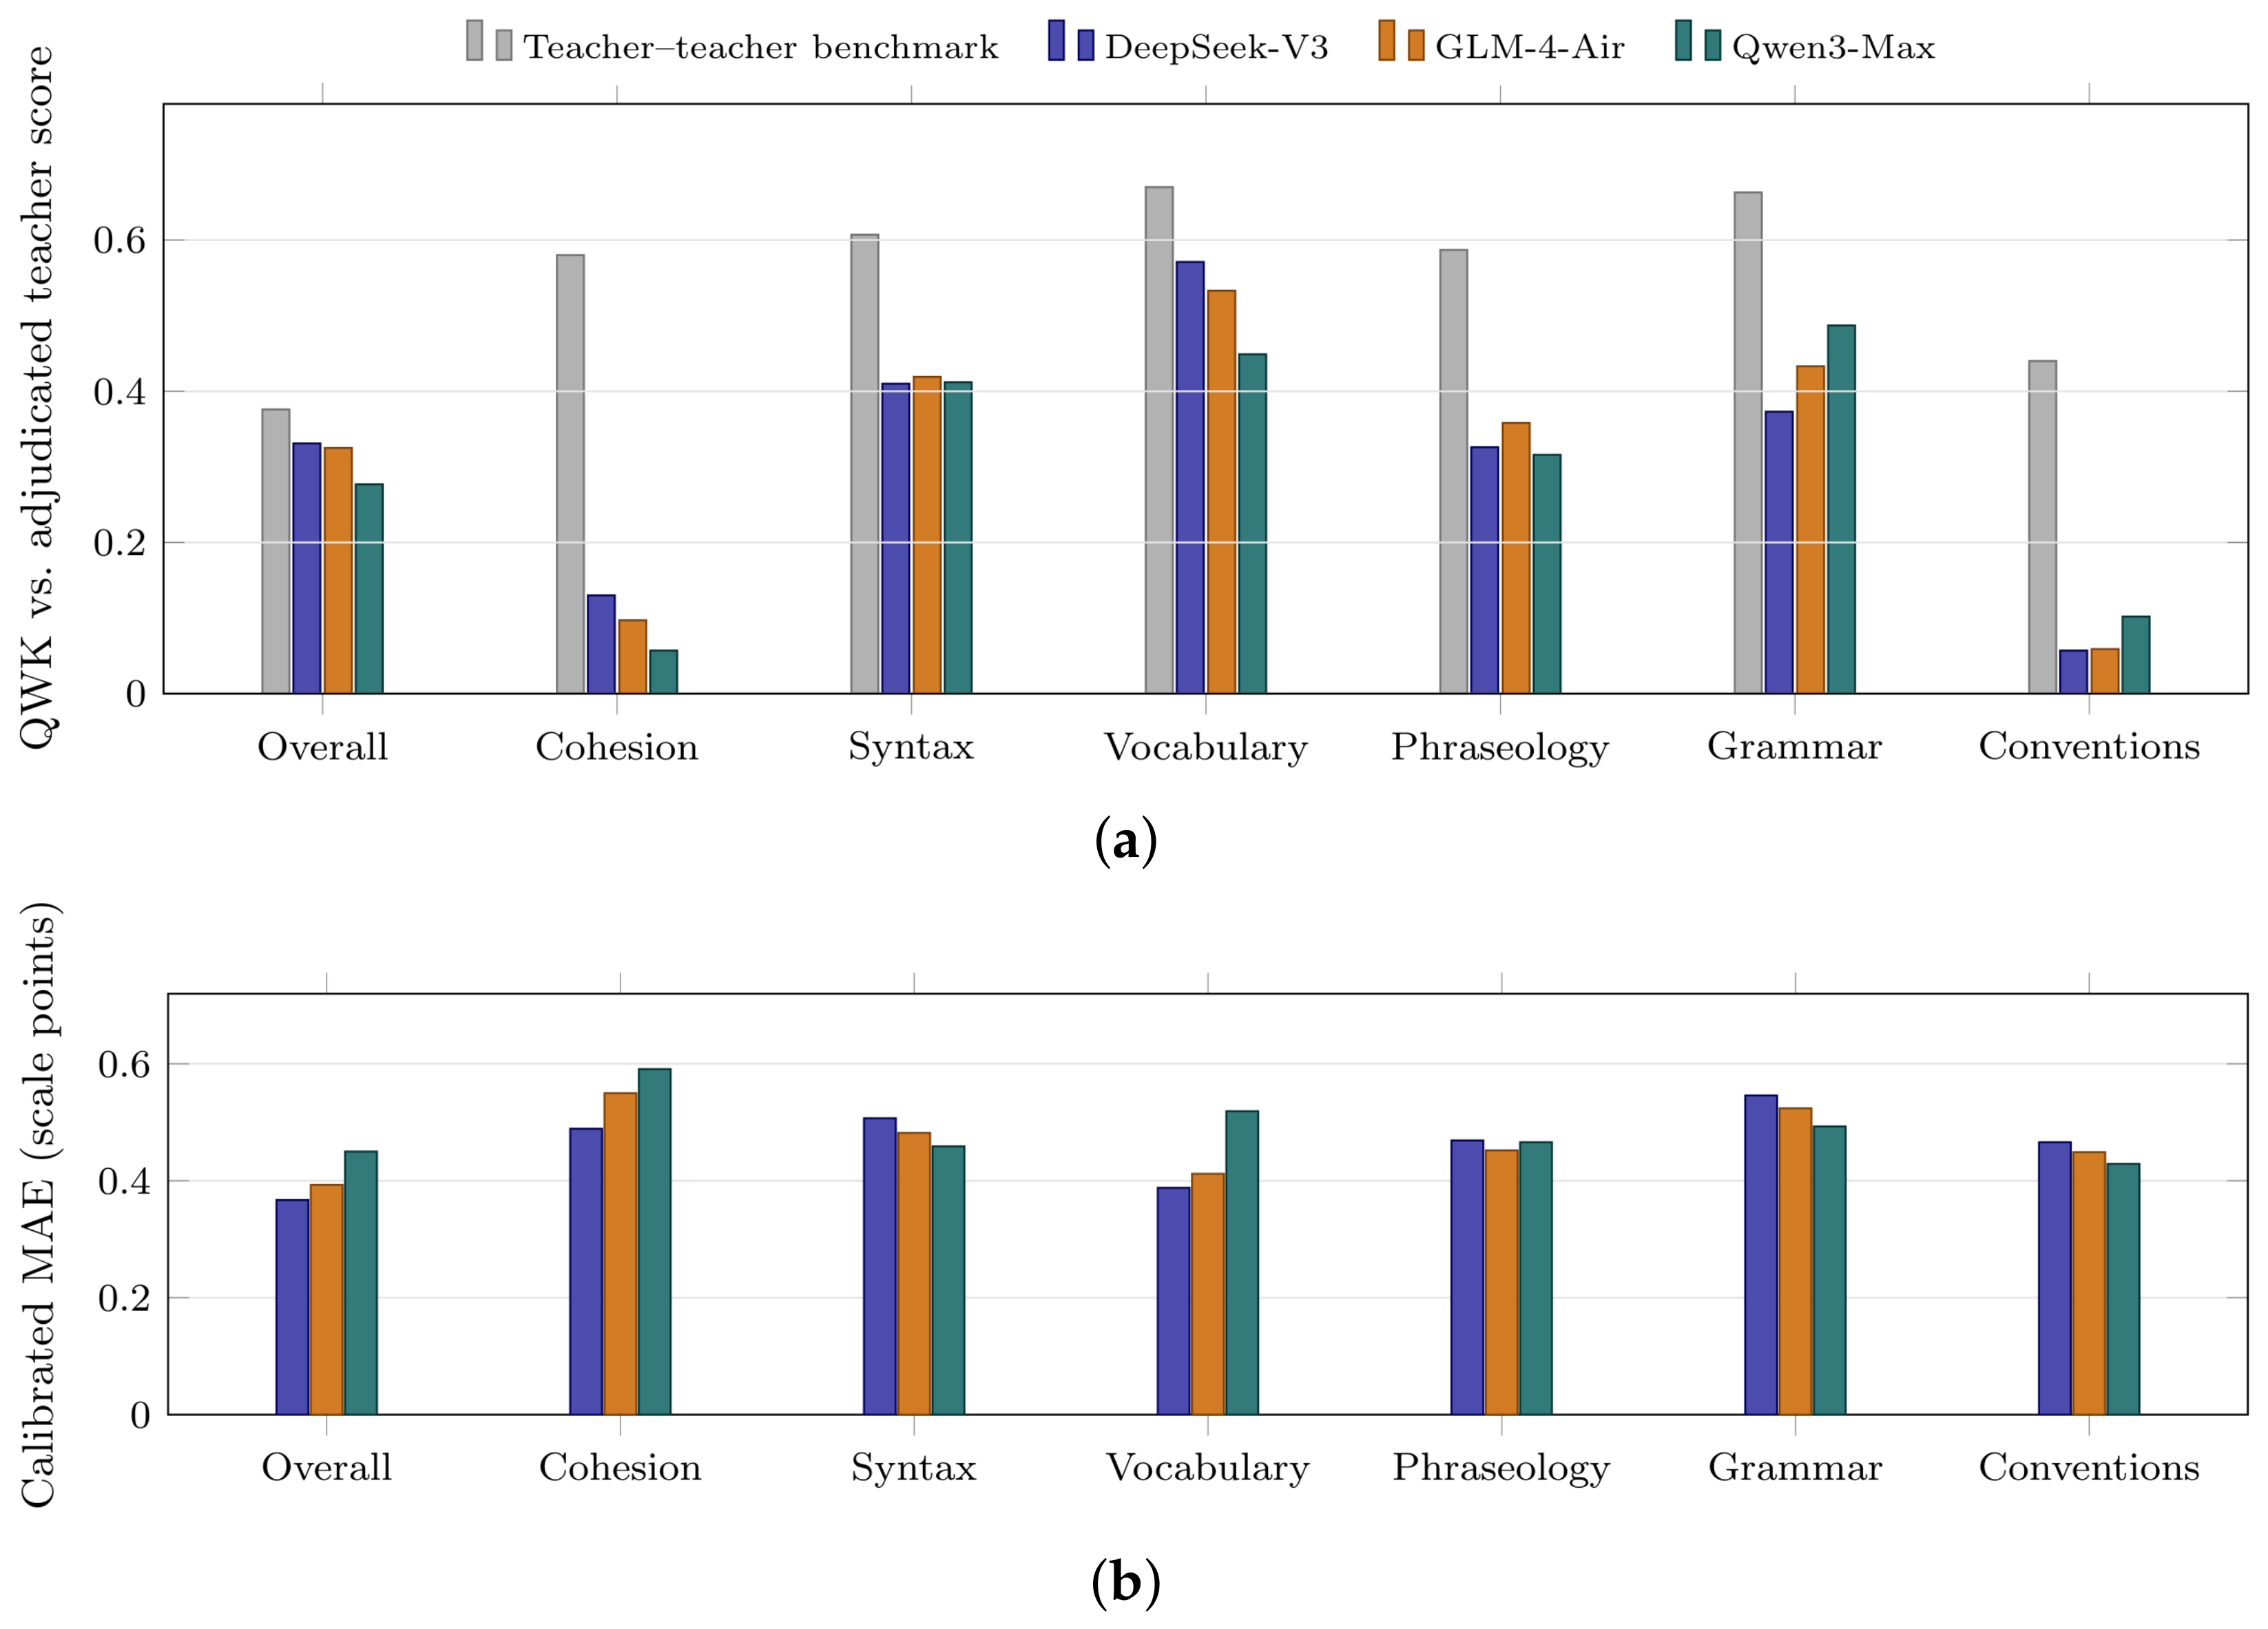
Table 5 and
Figure 6 present dimension-level results for the teacher-benchmark condition. Agreement differed substantially across the seven dimensions, and broadly similar patterns were observed for DeepSeek-V3, GLM-4-Air, and Qwen3-Max. The values quoted in this section are those obtained after equipercentile linking.
Vocabulary showed the highest teacher-referenced agreement, with QWK values ranging from 0.449 to 0.571 across the three models, compared with a teacher–teacher agreement benchmark of 0.670. Syntactic ability produced QWK values of 0.410–0.419, compared with a benchmark of 0.607. Grammatical accuracy ranged from 0.373 to 0.487, compared with a benchmark of 0.663. Phraseology showed more moderate agreement, with QWK values of 0.316–0.358, compared with a benchmark of 0.587.
Overall writing quality produced QWK values of 0.277–0.331. These values were lower in absolute terms than those for vocabulary, syntax, and grammar, but the corresponding teacher–teacher benchmark was also relatively low at 0.376, indicating that the reference score for this dimension is itself measured with more error than the others. The results do not establish that the calibrated models reproduced the teachers’ interpretation of overall writing quality, particularly for judgements involving content development, argumentation, and communicative effect.
The weakest teacher-referenced agreement was found for cohesion and coherence and for conventions. Cohesion and coherence produced QWK values of 0.057–0.130, compared with a benchmark of 0.580. Conventions produced values of 0.057–0.102, compared with a benchmark of 0.440. These low values were observed across all three model families and under every calibration method tested, including the raw scores, which produced QWK values of 0.008–0.080 for cohesion and 0.065–0.103 for conventions. The pattern is therefore not a by-product of the choice of calibration method.
For cohesion and conventions, calibrated MAE remained between 0.429 and 0.591 scale points, and signed bias remained within ±0.19 points. The relatively moderate absolute error, together with low QWK, indicates that distributional calibration placed many scores close to the teacher scale without reproducing the teachers’ distinctions among individual essays.
The comparatively stronger results for vocabulary, syntactic ability, and grammatical accuracy indicate that calibrated machine scores in these dimensions may provide more stable information for teacher-reviewed formative profiles, whereas the substantially lower agreement for cohesion, conventions, and aspects of overall writing quality indicates that these judgements should continue to depend primarily on teacher evaluation. The pooled values of 0.63–0.64 reported in
Section 4.2 are consistent with dimension-level agreement ranging from near zero to approximately 0.57, so statements about classroom use must be made at the dimension level.
4.4. Instability-Based Review and Automatically Released Scores
The instability-based review analysis examined whether variation across the five rating occasions identified scores with larger teacher-referenced errors. The analysis was conducted under the teacher-benchmark condition after equipercentile linking, and the proportion of flagged essay–dimension pairs was constrained by the 15.8% pair-level workload reference derived from disagreements between the two teachers.
Table 6 reports the results.
Because the modal proportion of five occasions takes only the values 0.2, 0.4, 0.6, 0.8, and 1.0, the attainable flagging rates are coarse, and the largest threshold satisfying the budget differed across models. The selected rule flagged 15.1% of essay–dimension pairs for DeepSeek-V3 (438 of 2898), 0.3% for GLM-4-Air (10 of 2898), and 10.2% for Qwen3-Max (296 of 2898). For GLM-4-Air the next available threshold would have flagged 16.9% of pairs, which exceeds the budget. At the essay level, at least one of the seven dimension scores was flagged for 66.7% of essays for DeepSeek-V3 (276 of 414), 2.4% for GLM-4-Air (10 of 414), and 53.6% for Qwen3-Max (222 of 414). The essay-level rates were much higher than the pair-level rates because a single essay contained seven independently evaluated dimensions; a pair-level flagging rate of about 15% distributed independently across seven dimensions implies that roughly two thirds of essays contain at least one flagged score.
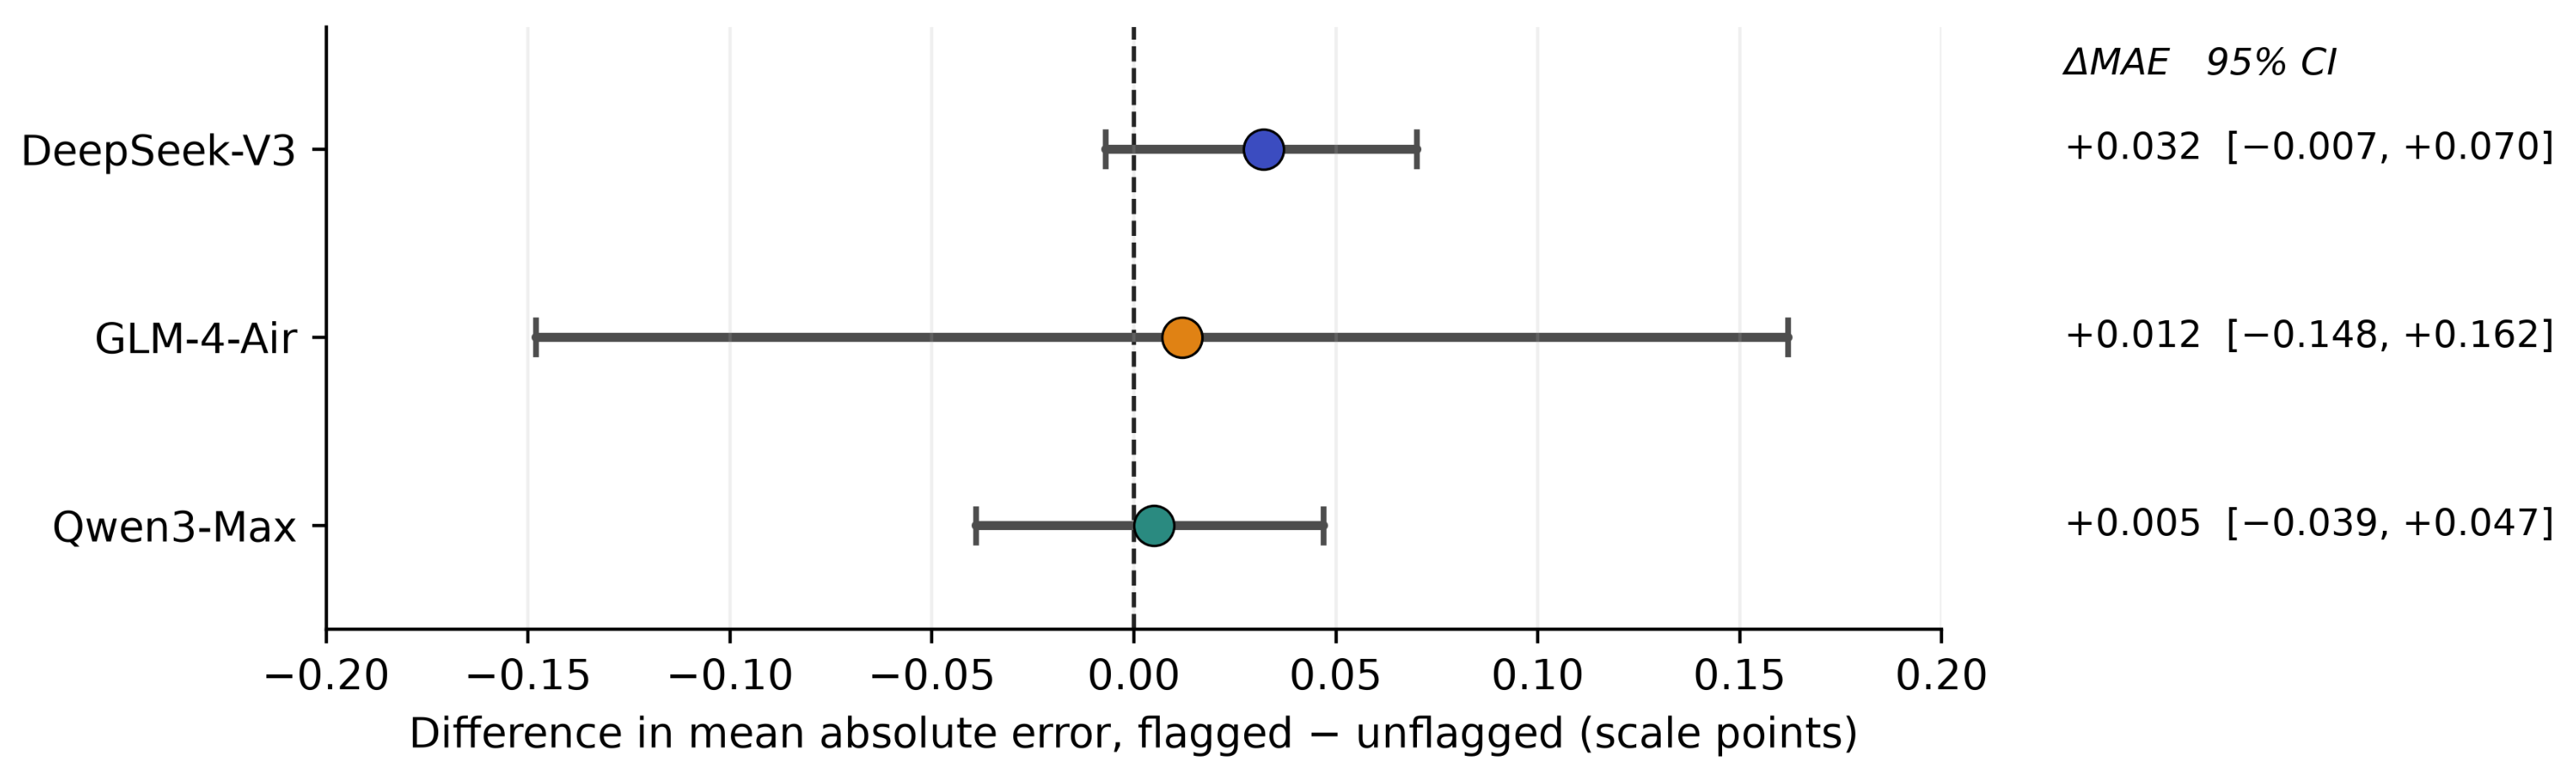
For DeepSeek-V3, flagged scores showed somewhat lower teacher-referenced agreement than unflagged scores, with QWK values of 0.595 and 0.650, MAE of 0.489 and 0.457, and half-point tolerance accuracy of 0.674 and 0.730, respectively. The direction of this difference is consistent with the intended use of the rule, but its magnitude was small and the essay-level bootstrap interval included zero: the difference in MAE between flagged and unflagged scores was +0.032 (95% CI [−0.007, +0.070]).
The same pattern was not observed for the other two models. For GLM-4-Air, the ten flagged scores obtained a QWK of 0.503, an MAE of 0.475, and a tolerance accuracy of 0.700, compared with 0.644, 0.466, and 0.723 for the 2888 unflagged scores; the difference in MAE was +0.012 (95% CI [−0.148, +0.162]). For Qwen3-Max, flagged and unflagged scores produced QWK values of 0.637 and 0.628, MAE values of 0.490 and 0.486, and tolerance accuracy values of 0.699 and 0.704; the difference in MAE was +0.005 (95% CI [−0.039, +0.047]). At a common threshold applied to all three models, the flagged group was slightly more accurate than the unflagged group for two of the three: flagging every pair with a modal proportion of 0.6 or below gave flagged-versus-unflagged QWK values of 0.595 versus 0.650 for DeepSeek-V3 but 0.661 versus 0.641 for GLM-4-Air and 0.660 versus 0.627 for Qwen3-Max. Consistently with this, the rank correlation between the occasion range and the absolute teacher-referenced error was +0.038, −0.037, and +0.007 for the three models respectively.
The automatically released, unflagged scores obtained QWK values of 0.650 for DeepSeek-V3, 0.644 for GLM-4-Air, and 0.628 for Qwen3-Max, with MAE values of 0.457, 0.466, and 0.486 and half-point tolerance accuracy values of 0.730, 0.723, and 0.704. These figures describe the accuracy of the scores that would have been returned to students without teacher review under the specified rule. They are barely distinguishable from the accuracy of the full score set, which is the expected consequence of a screening rule that does not separate accurate from inaccurate scores.
The relationship between occasion-level instability and teacher-referenced error was therefore weak for DeepSeek-V3 and absent for GLM-4-Air and Qwen3-Max, and
Figure 7 shows the flagged-minus-unflagged difference in mean absolute error, with its bootstrap confidence interval, for each model. The pair-level flag rates remained at or below the prespecified workload reference by construction, but this does not establish a reduction in teacher marking time: the practical review burden depends on the number of complete essays requiring review, and the essay-level rates of 66.7% and 53.6% for two of the three models indicate that a rule calibrated to a pair-level budget can nevertheless send the majority of essays to a teacher.
4.5. Comparison with Each Teacher Separately
The calibrated scores were compared with each teacher’s original ratings as well as with their mean, because a comparison with a two-rater mean is not equivalent to a comparison with an individual rater.
Table 7 reports the results for the teacher-benchmark condition after equipercentile linking.
Agreement with either individual teacher was lower than agreement with their mean. Pooled QWK against Teacher 1 was 0.615, 0.619, and 0.597 for DeepSeek-V3, GLM-4-Air, and Qwen3-Max, and against Teacher 2 it was 0.603, 0.603, and 0.571, compared with 0.643, 0.644, and 0.629 against the mean. All of these values were below the teacher–teacher value of 0.747. The mean is a more reliable quantity than either constituent rating, so agreement with it is expected to be higher; no model reached the teacher–teacher level against either individual teacher.
The pattern was reversed for half-point tolerance accuracy, which was higher against each individual teacher (0.738–0.770) than against the mean (0.704–0.723), because an individual teacher rating falls on the half-point grid used by the models whereas the mean can take quarter-point values that no machine score can match exactly. The two indices therefore respond to different properties of the reference.
The two teachers did not differ greatly in the severity with which the models matched them. Signed bias against Teacher 1 was −0.036, −0.030, and −0.108 for the three models, and against Teacher 2 it was −0.119, −0.113, and −0.191, indicating that Teacher 2 rated slightly more leniently than Teacher 1 by approximately 0.08 scale points. Dimension-level agreement showed the same ordering of dimensions against each teacher separately as against the mean, with cohesion and conventions weakest in every comparison. The main findings therefore do not depend on the choice between the mean and either individual teacher as the reference.
4.6. Descriptive Subgroup and Essay Length Checks
Calibrated performance was examined descriptively across gender groups and essay-length terciles under the teacher-benchmark condition after equipercentile linking. For DeepSeek-V3, pooled QWK was 0.642 for the 300 essays written by male students and 0.648 for the 114 essays written by female students. The corresponding values were 0.641 and 0.654 for GLM-4-Air and 0.618 and 0.658 for Qwen3-Max. Signed bias remained within ±0.16 scale points in every group. Absolute error was slightly larger for essays written by male students in all three models, with MAE of 0.471, 0.475, and 0.496 against 0.437, 0.443, and 0.461 for essays written by female students. Signed bias did not follow a single direction: for male and female groups it was −0.092 and −0.040 for DeepSeek-V3 and −0.075 and −0.064 for GLM-4-Air, whereas for Qwen3-Max it was −0.147 and −0.157. All six values lie within a range of 0.12 scale points.
The differences between gender groups were modest, but they should be interpreted cautiously because the subgroup sizes were unequal, with 300 male and 114 female writers. These comparisons do not establish the absence of gender-related effects and do not provide evidence that would generalise beyond the study population.
Essay-length terciles were formed at 122 and 145 words, giving groups of 140, 140, and 134 essays. Across terciles, DeepSeek-V3 produced calibrated QWK values of 0.653, 0.654, and 0.607 for short, middle, and long essays; GLM-4-Air produced 0.655, 0.657, and 0.602; and Qwen3-Max produced 0.632, 0.644, and 0.598. Agreement was therefore slightly lower for the longest third of the corpus in all three models, but the differences were small and no monotonic relationship was observed. Signed bias remained within ±0.17 points in every length group for every model. Within this corpus, calibration did not appear to improve aggregate alignment by introducing a consistent advantage for longer or shorter essays.
5. Discussion
5.1. Local Teacher Standards and Statistical Calibration
The findings show that agreement among LLMs does not necessarily indicate alignment with the standards used in a local College English programme. Models may apply similar scoring criteria while differing from teachers in their interpretation of the rubric and their use of the score scale. For instructional assessment, the relevant reference is therefore the locally defined writing construct rather than consistency among machine raters.
Teacher-approved rubrics and benchmark essays provide a practical basis for anchoring LLM scoring to local expectations. The benchmark essays make score-level interpretations more concrete and allow teachers to inspect the standards presented to the model. Although teacher ratings are not error-free, they represent the operational standard of the programme in which the scores will be interpreted and used. Because the two experimental stages differed in several design features, their contrast remains descriptive rather than a controlled estimate of the effect of benchmark provenance.
Statistical calibration has a narrower function. It can reduce systematic differences in severity and make machine scores more interpretable on the local scale, but it does not change how the model evaluates the linguistic or rhetorical quality of an essay. That a two-parameter location–scale correction recovered almost the whole of the observed gain indicates how general this adjustment is. A calibrated score may be closer to the teacher score distribution without reproducing teacher judgements about content, argumentation, coherence, or communicative effect. Calibration should therefore be understood as score-scale adjustment rather than evidence that the model has acquired a teacher-like understanding of writing quality.
5.2. Dimension-Specific Formative Use and Teacher Governance
The educational value of LLM-assisted scoring varies across writing dimensions. Vocabulary, syntactic ability, and grammatical accuracy showed comparatively stronger alignment with teacher ratings. Under local validation, scores in these dimensions may provide preliminary information about lexical range, sentence construction, and grammatical control. Such information could support more frequent analytic profiles, help teachers identify recurring language problems, and provide a basis for targeted revision activities.
These scores should not be treated as complete diagnoses or as substitutes for written feedback. A dimension score does not explain why a particular expression is ineffective, how a sentence should be revised, or whether a language choice is appropriate for the task. Its instructional value depends on teacher interpretation, the student’s previous work, and the learning objectives of the course. The model-generated rationales were not evaluated in this study and should not be assumed to provide reliable instructional feedback.
Greater caution is required for overall writing quality, content development, cohesion and coherence, argumentation, and communicative effect. These judgements depend on the relevance and development of ideas, relations among claims, task fulfilment, discourse organisation, and the needs of the intended reader. They cannot be secured through score calibration alone. Teachers should therefore retain primary responsibility for these dimensions and for the final interpretation of student performance.
The appropriate division of labour is one in which the LLM provides preliminary, low-stakes information while teachers remain responsible for consequential and complex judgements. Machine-assisted profiles may help teachers direct attention towards disputed essays, weak arguments, discourse-level problems, and individual learning needs. They may also support more frequent formative assessment between assignments receiving full teacher marking. This potential benefit, however, requires classroom evaluation rather than being inferred from agreement statistics.
Teacher control should begin with the design of the assessment. Teachers should determine the rubric, approve the benchmark essays, and decide which dimensions are suitable for machine assistance. Benchmark panels should reflect current course objectives and the writing profile of the local student population. Changes in the model, prompt, rubric, writing task, or learner group should lead to renewed local validation.
Operational use also requires continuing oversight. Schools should document the model version, prompts, benchmark panels, calibration procedures, and conditions under which scores are reported. Teachers should periodically check a sample of machine-assisted scores, and dimensions with weak local validation should receive mandatory human review. Repeated-score stability should not be treated as sufficient evidence of accuracy.
Students should have access to a clear procedure for requesting teacher reconsideration of a machine-assisted score. Institutional policies should also address the storage and transmission of student writing, access permissions, retention periods, and possible reuse of texts or ratings. These arrangements ensure that the model remains an auxiliary assessment resource rather than an independent scoring authority.
5.3. Limitations and Future Research
The findings are limited to 414 essays from one institution, five writing topics, two teacher raters, and the models and prompts examined in this study. The teacher reference was based on the mean of two independent ratings without third-rater adjudication, and the benchmark panels did not cover every score level in every dimension. Teacher workload, cost, latency, student responses, and the instructional quality of model-generated feedback were not measured.
Future research should examine the procedure across institutions, writing genres, topics, learner groups, and larger panels of trained raters. Classroom studies are also needed to determine whether dimension-level profiles support revision, increase the frequency of useful feedback, and change how teachers allocate marking time. Until such evidence is available, LLM-assisted scoring is best positioned as a teacher-governed, locally calibrated, low-stakes formative resource rather than as a replacement for professional judgement.
6. Conclusions
This study examined whether LLM-assisted scoring could support more frequent formative assessment of College English writing while remaining accountable to the standards applied by local teachers. Using 414 classroom essays independently rated by two trained College English teachers, the study found that high agreement between LLMs did not indicate corresponding alignment with the teacher reference scores. The raw LLM ratings were generally more severe, and the degree of teacher-referenced agreement varied substantially across writing dimensions.
Use of the local teacher rubric and teacher-agreed benchmark essays was associated with closer raw alignment than the preliminary machine-anchored conditions. Statistical calibration further reduced differences in score severity and scale use. Under the teacher-anchored conditions, pooled QWK reached 0.614–0.637 after location–scale correction, 0.668–0.697 after isotonic calibration, and 0.629–0.644 after equipercentile linking, compared with a teacher–teacher agreement benchmark of 0.747 and raw values of 0.286–0.401. Because a two-parameter correction recovered almost the whole of the gain, these improvements are attributed to the correction of score severity and scale use rather than to any particular calibration method. The pooled advantage of isotonic calibration was obtained by compressing the score distribution and in one dimension by returning a constant score, which makes it unsuitable for classroom score reporting despite its aggregate accuracy. Calibration did not establish that the models understood writing quality in the same way as the teachers, nor did it remove the marked differences among writing dimensions.
Teacher-referenced agreement was relatively stronger for vocabulary, syntactic ability, and grammatical accuracy, suggesting that these dimensions may provide preliminary information for targeted formative work when interpreted by teachers. Agreement remained weak for cohesion and coherence and was limited for aspects of overall writing quality involving content development, argumentation, discourse meaning, and communicative effect. These judgements should remain under teacher control. Repeated-score instability did not reliably identify higher-error ratings for any of the three models and should not be used as a criterion for releasing scores without human review.
The findings therefore support a limited role for LLMs in College English writing assessment. When constrained by a locally developed rubric, teacher-approved benchmark essays, statistical calibration, repeated scoring, and continuing teacher review, LLM-assisted scoring may help provide dimension-level information more frequently and allow teachers to direct greater attention to disputed essays, complex writing problems, and individual guidance. It should be used for low-stakes formative purposes rather than as an independent scoring authority, and teaching programmes must retain responsibility for defining the assessment standard, determining which scores may be reported, reconsidering disputed results, and interpreting students’ writing development. Because all evidence reported here comes from one institution, five topics, and two raters, these conclusions are conditional on the setting studied and should be re-established locally before the procedure is adopted elsewhere.