1. Introduction
Cooperation is a common phenomenon in diverse living systems, which bolsters group competitiveness through self-sacrifice and altruism [
1]. The prevalence of cooperation is a key indicator of a population’s potential and prosperity. However, this contradicts Darwin’s theory of evolution [
2]. According to Darwinian natural selection theory, individuals should be more selfish to improve their competitive advantages. Although cooperators can exist in cooperator–defector dynamics [
3,
4,
5], how to promote the emergence of cooperation and ensure it becomes the prevalent strategy remains a critical scientific challenge to be resolved.
Complex network architectures and evolutionary game theory are usually combined to systematically research cooperation–defection dynamics and reveal critical determinants of cooperative persistence [
6,
7]. In the pioneering analysis of spatial networks of Nowak et al., topological configurations are proven to be an important factor in promoting cooperation [
8,
9]. This foundation led to the development of five mechanisms that explain human cooperation in game theory [
10,
11,
12,
13,
14].
Traditional game theory predominantly focuses on single-layer networks, which inadequately explain the complexity of the real world. In the real world, individuals often take part in multiple overlapping interaction layers, and these layers do not exist independently. Instead, they interact and influence each other through cross-layer feedback, a coupling relationship that cannot be characterized by single-layer networks. [
15,
16,
17,
18]. A two-layer coupled structure can simulate the universal hierarchical guidance effects in reality, such as experienced groups guiding novice groups and macro-level rules constraining micro-level behaviors. The two-layer coupled framework provides a concise mathematical model of such realistic hierarchical interactions [
19,
20,
21,
22,
23,
24,
25]. Zhang et al.’s research has demonstrated the facilitative effect of two-layer networks on cooperation [
26], and subsequent studies have further confirmed the advantages of the many-to-one model in maintaining cooperation [
27]. Li et al. found that topological heterogeneity alters the cross-layer diffusion patterns of cooperative behavior in interconnected multi-layer networks [
28], while Basak et al. verified that moderate synergistic effects and optimized cross-layer feedback can promote inter-layer cooperation in multiplex networks [
29]. Through the interaction of these coupled networks, more accurate models of real-world social groups can be constructed [
30,
31,
32,
33,
34].
Importantly, both in nature and in society, behavior adapts because individuals will dynamically adjust strategies using historical memory and environmental feedback. They constantly update their strategies based on environmental feedback and historical experience [
35,
36,
37]. This kind of learning fits the principles of reinforcement learning, as shown in a classic model called the Bush–Mosteller model (BM model). In the BM model, players are endowed with an aspiration level. After a strategic adjustment of the aspiration threshold, the BM model can effectively facilitate the emergence of cooperative behavior. Cognitive rationality and a more robust explanation for the evolution of cooperation are provided by this update mechanism [
38,
39].
While tremendous advances have been made in evolutionary dynamics among populations with a distinct structural setup, non-directly interacting population models that compete for space at the individual level have received relatively little attention. Szolnoki and Perc innovatively introduced a critical constraint: interactions across subpopulations do not generate benefits [
40]. This model has made a great breakthrough in complexity frameworks, which proves that payoff neutrality could significantly improve cooperative behavior in a single-layer network. Researchers have also conducted extensive studies on the impact of neutral traits in evolutionary game theory, and the findings indicate that the introduction of neutral traits can promote the emergence of cooperative behavior in games.
Building on this foundation, subsequent work extended the neutral subpopulation framework to two-layer coupled networks and verified that two neutral subpopulations can suppress the spread of defectors through inter-group isolation [
41]. However, this binary subpopulation model suffers from three fundamental limitations that restrict its generality and practical applicability. First, it can only form a one-dimensional linear mutual inhibition relationship between two groups and cannot generate the closed cyclic invasion dynamics that are ubiquitous in natural and social systems, leading to fragile cooperation that easily collapses under severe social dilemmas. Second, it adopts an overly extreme zero-payoff assumption for cross-subpopulation interactions, which fails to capture the widespread fixed neutral payoff interactions between strangers in real societies (e.g., routine transactions and casual communication). Third, it cannot explain the tripartite checks and balances mechanisms that are widely observed in biological hierarchies (dominant–intermediate–subordinate) and social organizations (senior–average–novice), thus lacking sufficient explanatory power for real-world multi-group systems.
For instance, researchers have investigated the influence of neutral subpopulations on the cooperation rate in the context of two-layer networks, and the results show that such subpopulations also exert a significant facilitative effect on the cooperation rate within this network structure. Previous work [
41] first introduced two neutral subpopulations into two-layer coupled networks and demonstrated that isolation between neutral groups can limit the spread of defectors. However, this binary model can only form a linear mutual inhibition relationship and lacks closed-loop dynamics. Furthermore, this model simplifies neutral interactions to zero payoff, failing to capture the common neutral interactions with fixed payoffs between strangers in real societies. These limitations motivated us to extend the framework to three subpopulations to explore more general and robust cooperation mechanisms. Our extended framework explains the evolutionary advantages of multi-population structures in biological systems and tripartite checks and balances mechanisms in social systems, and fills the gap left by the two-subpopulation model, which cannot account for the phenomenon of multi-group coexistence.
Studies on neutral populations have also demonstrated that in structured populations, the combination of neutral and non-neutral subgroups can significantly enhance cooperation robustness under high dilemma strengths [
42,
43]. These works mainly studied two neutral subpopulations; however, in the real world, there are usually two or more groups. Two neutral subpopulations cannot fully represent the group structure of real-world systems. In biological systems, populations are often structured into three tiers: dominant, intermediate, and subordinate. Similarly, social systems typically form hierarchical groups, such as senior, average, and novice members [
44]. In both cases, three or more groups with neutral interactions exist. A model with two neutral subpopulations fails to capture the inter-group balancing mechanisms among multiple groups and cannot reflect the realistic features of group interactions in practice. Studies have shown that introducing multiple groups enhances the complexity and robustness of population evolution, thus facilitating the emergence of cooperative behaviors [
45,
46]. Meanwhile, a growing body of research has confirmed that third-party strategies can effectively mitigate inter-group disputes and conflicts: third-party intervention drives the evolution of collective cooperation, and targeted third-party regulation on multi-layer networks can further balance inter-group interactions and curb the spread of uncooperative behaviors [
47,
48].
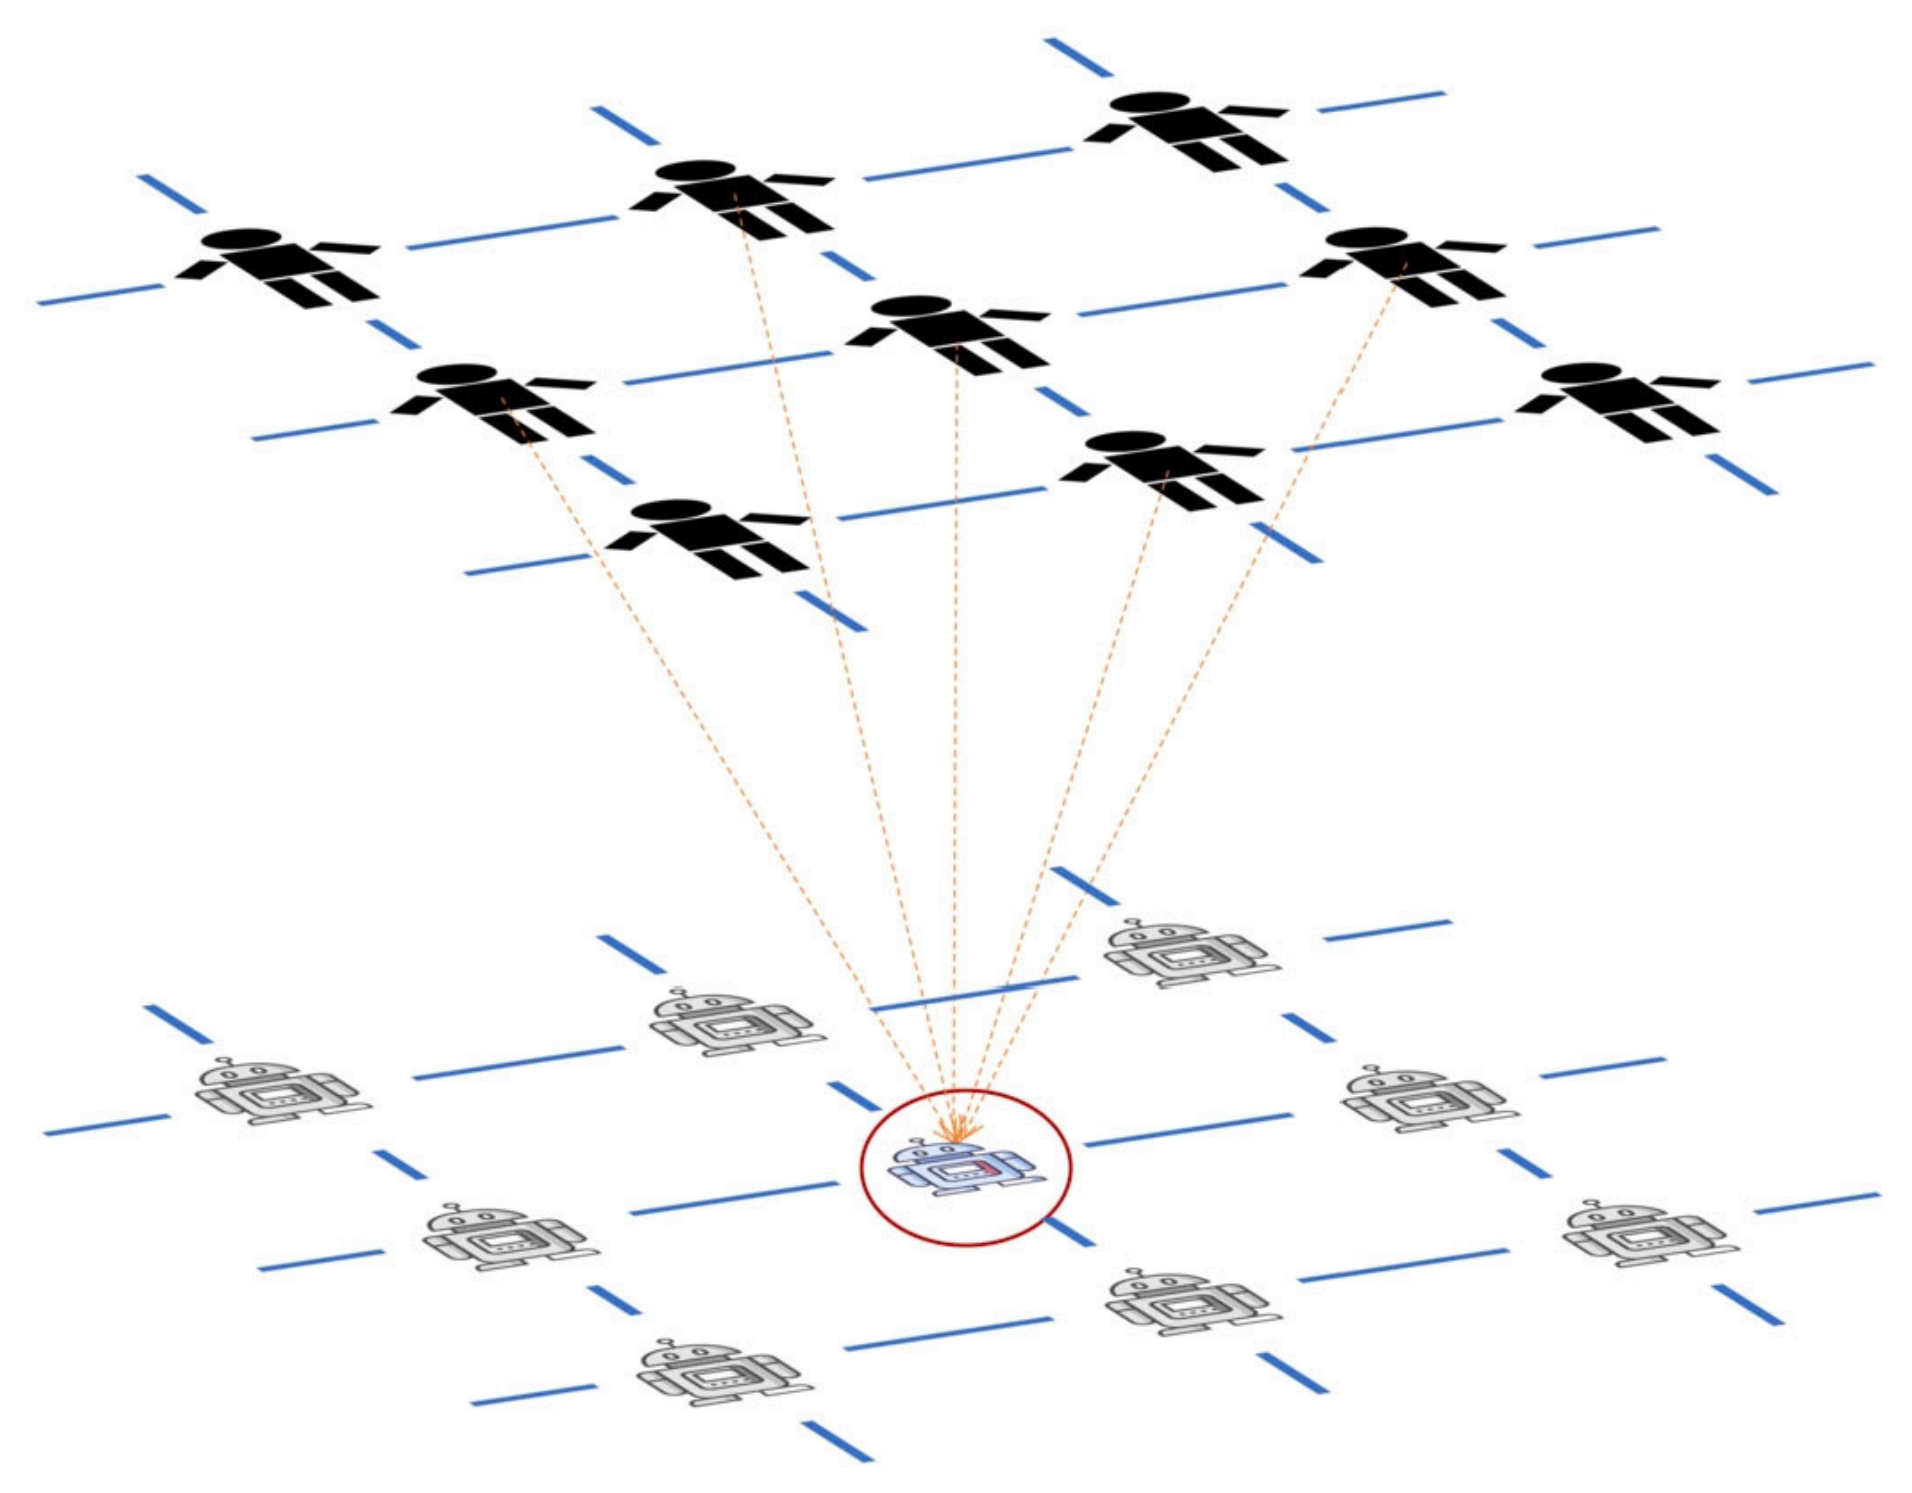
Inspired by this, we introduce a three-subpopulation system in a two-layer coupled network to investigate the evolution of cooperative behavior. Interactions are defined by the prisoner’s dilemma game. The upper layer represents human populations that use the Fermi strategy update. This constitutes a rule that enables them to mimic neighbors’ strategies according to their payoff values, a mechanism that conforms to human decision-making patterns. The lower layer corresponds to the individuals that adopt the reinforcement learning algorithm, the Bush–Mosteller (BM) model. We established an influence transmission paradigm where humans affect agents through the coupling parameter a. Crucially, human populations in the upper network are partitioned into three distinct subpopulations with inter-group neutrality: players derive fixed benefits from cross-subpopulation neighbors. The lower network also maintains identical neutrality constraints. Cross-subpopulation interactions yield invariant neutral payoffs () regardless of strategy selection.
We deliberately limit the number of subpopulations to exactly three for two fundamental scientific reasons. First, three is the minimum number of groups required to form a self-sustaining closed cyclic invasion loop—the core mechanism that fundamentally distinguishes this work from previous two-subpopulation models [
49,
50]. As demonstrated in
Section 1, two subpopulations can only form a one-dimensional linear mutual inhibition relationship, which cannot effectively block the global spread of defectors under high dilemma strengths. In contrast, three subpopulations generate a balanced tripartite checks-and-balances structure that maintains population diversity and prevents any single strategy from achieving global dominance. Second, adding more than three subpopulations would introduce redundant computational and analytical complexity without fundamentally changing the core cyclic dominance mechanism: all multi-subpopulation systems with
≥ 3 exhibit qualitatively similar cyclic invasion patterns [
51], while increasing computational costs exponentially. Since
≥ 3 systems share identical mechanisms and marginal effects, testing
= 4, 5 provides no additional theoretical insight but drastically increases computing costs. Furthermore, the three-subpopulation structure directly maps to the ubiquitous tripartite hierarchical structures in natural (dominant–intermediate–subordinate) and social (senior–average–novice) systems, enhancing the model’s interpretability and practical relevance.
Using the research approach outlined above, we studied the evolutionary dynamics of multiple neutral subpopulations on two-layer coupled networks and explored how they influence the evolution of cooperation, so as to further enrich the theory of cooperative evolution. This two-layer coupled network model can represent several typical real-world scenarios. It effectively characterizes human–machine collaboration systems, such as intelligent customer service and industrial robot cooperation. The upper layer captures the rational decision-making and experiential imitation of human operators, while the lower layer describes the autonomous learning and behavioral adaptation of agents. Human guidance over agents through inter-layer payoff feedback is highly consistent with the model’s coupling mechanism. The model also applies to social group interactions, such as cooperation between senior and new employees in the workplace. The strategies of senior employees in the upper layer influence the learning behaviors of new employees in the lower layer via payoff incentives, showing a distinct hierarchical guidance effect. In addition, it depicts public governance, where upper-layer macro policies affect individual public decisions through payoff adjustment, matching the model’s unidirectional coupling and hierarchical regulation. Neutral groups refer to individuals or organizations without direct interest conflicts or competition.
The manuscript’s structure is as follows:
Section 2 delineates the methodological framework,
Section 3 analyzes empirical outcomes, and
Section 4 synthesizes concluding perspectives.
3. Results
In our model, the upper-layer human population uses parameter coupling strength a to adjust the payoffs of the lower-layer agent population. Changes in a will alter the payoffs in the lower-layer population. Whether the parameter a rises or falls, the cooperation rate within the upper layer demonstrates no observable fluctuation. Therefore, we focus our analysis on how cooperative behavior in the lower-layer network evolves with a.
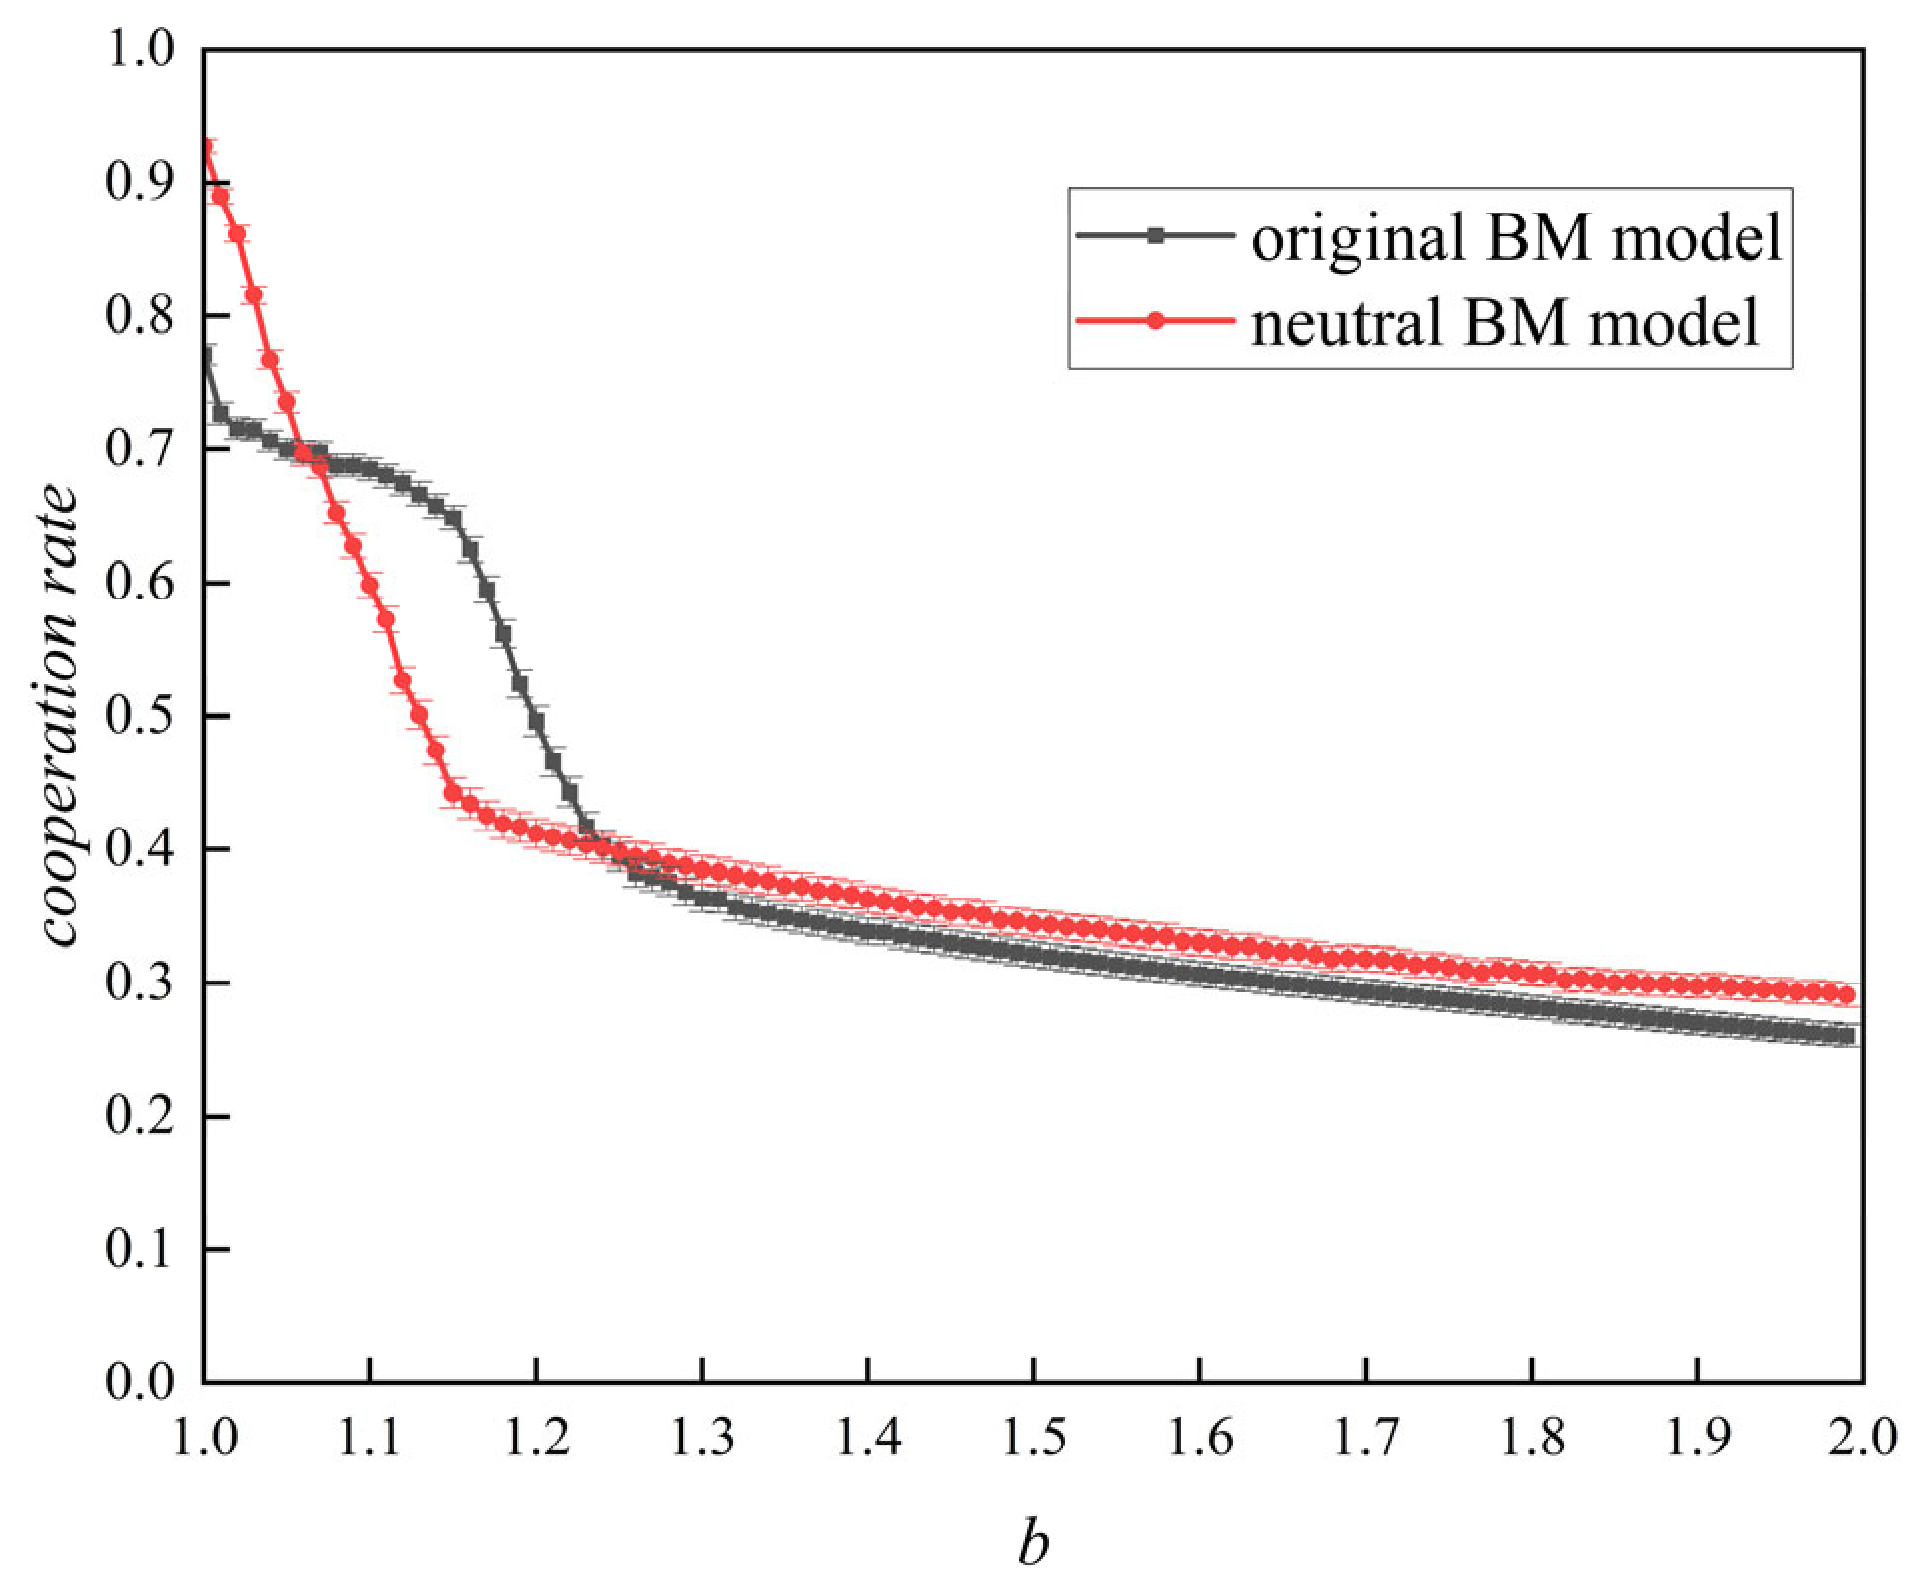
First, as shown in
Figure 3, we initially compared the cooperation rate of our model operating independently in the upper layer (
= 0) with that of the original BM model. The agent population in the lower layer employed a modified BM model incorporating neutral subpopulations. The results indicate that under single-layer operation, when parameter
ranges from 1 to 1.06, the cooperation rate of the neutral BM model exceeds that of the original BM model. However, for
values between 1.06 and 1.26, our model exhibits a lower cooperation rate compared to the original BM model. When the value of
is small, the social dilemma strength is low, and the baseline cooperation rate is relatively high. However, the neutral payoff
between different subpopulations is less than the cooperation fitness of 1, which impairs the benefits of cooperators. At this time, the gains brought by cyclic dynamics are not enough to compensate for such losses, so the cooperation rate decreases instead. Nevertheless, this phenomenon only appears within a narrow parameter interval. On the whole, the neutral model still achieves a higher cooperation rate when b is large. It is important to note that when the temptation to defect
is high (
> 1.26), our model achieves higher cooperation levels. This shows that neutral groups play a key role in keeping cooperation stable. As a result, a relatively high level of cooperation can be maintained by the players even when the social dilemma is relatively strong.
The cooperation rate is relatively low in the range 1.06 < < 1.26, which stems from the evolutionary adaptation cost introduced by the three neutral subpopulations.
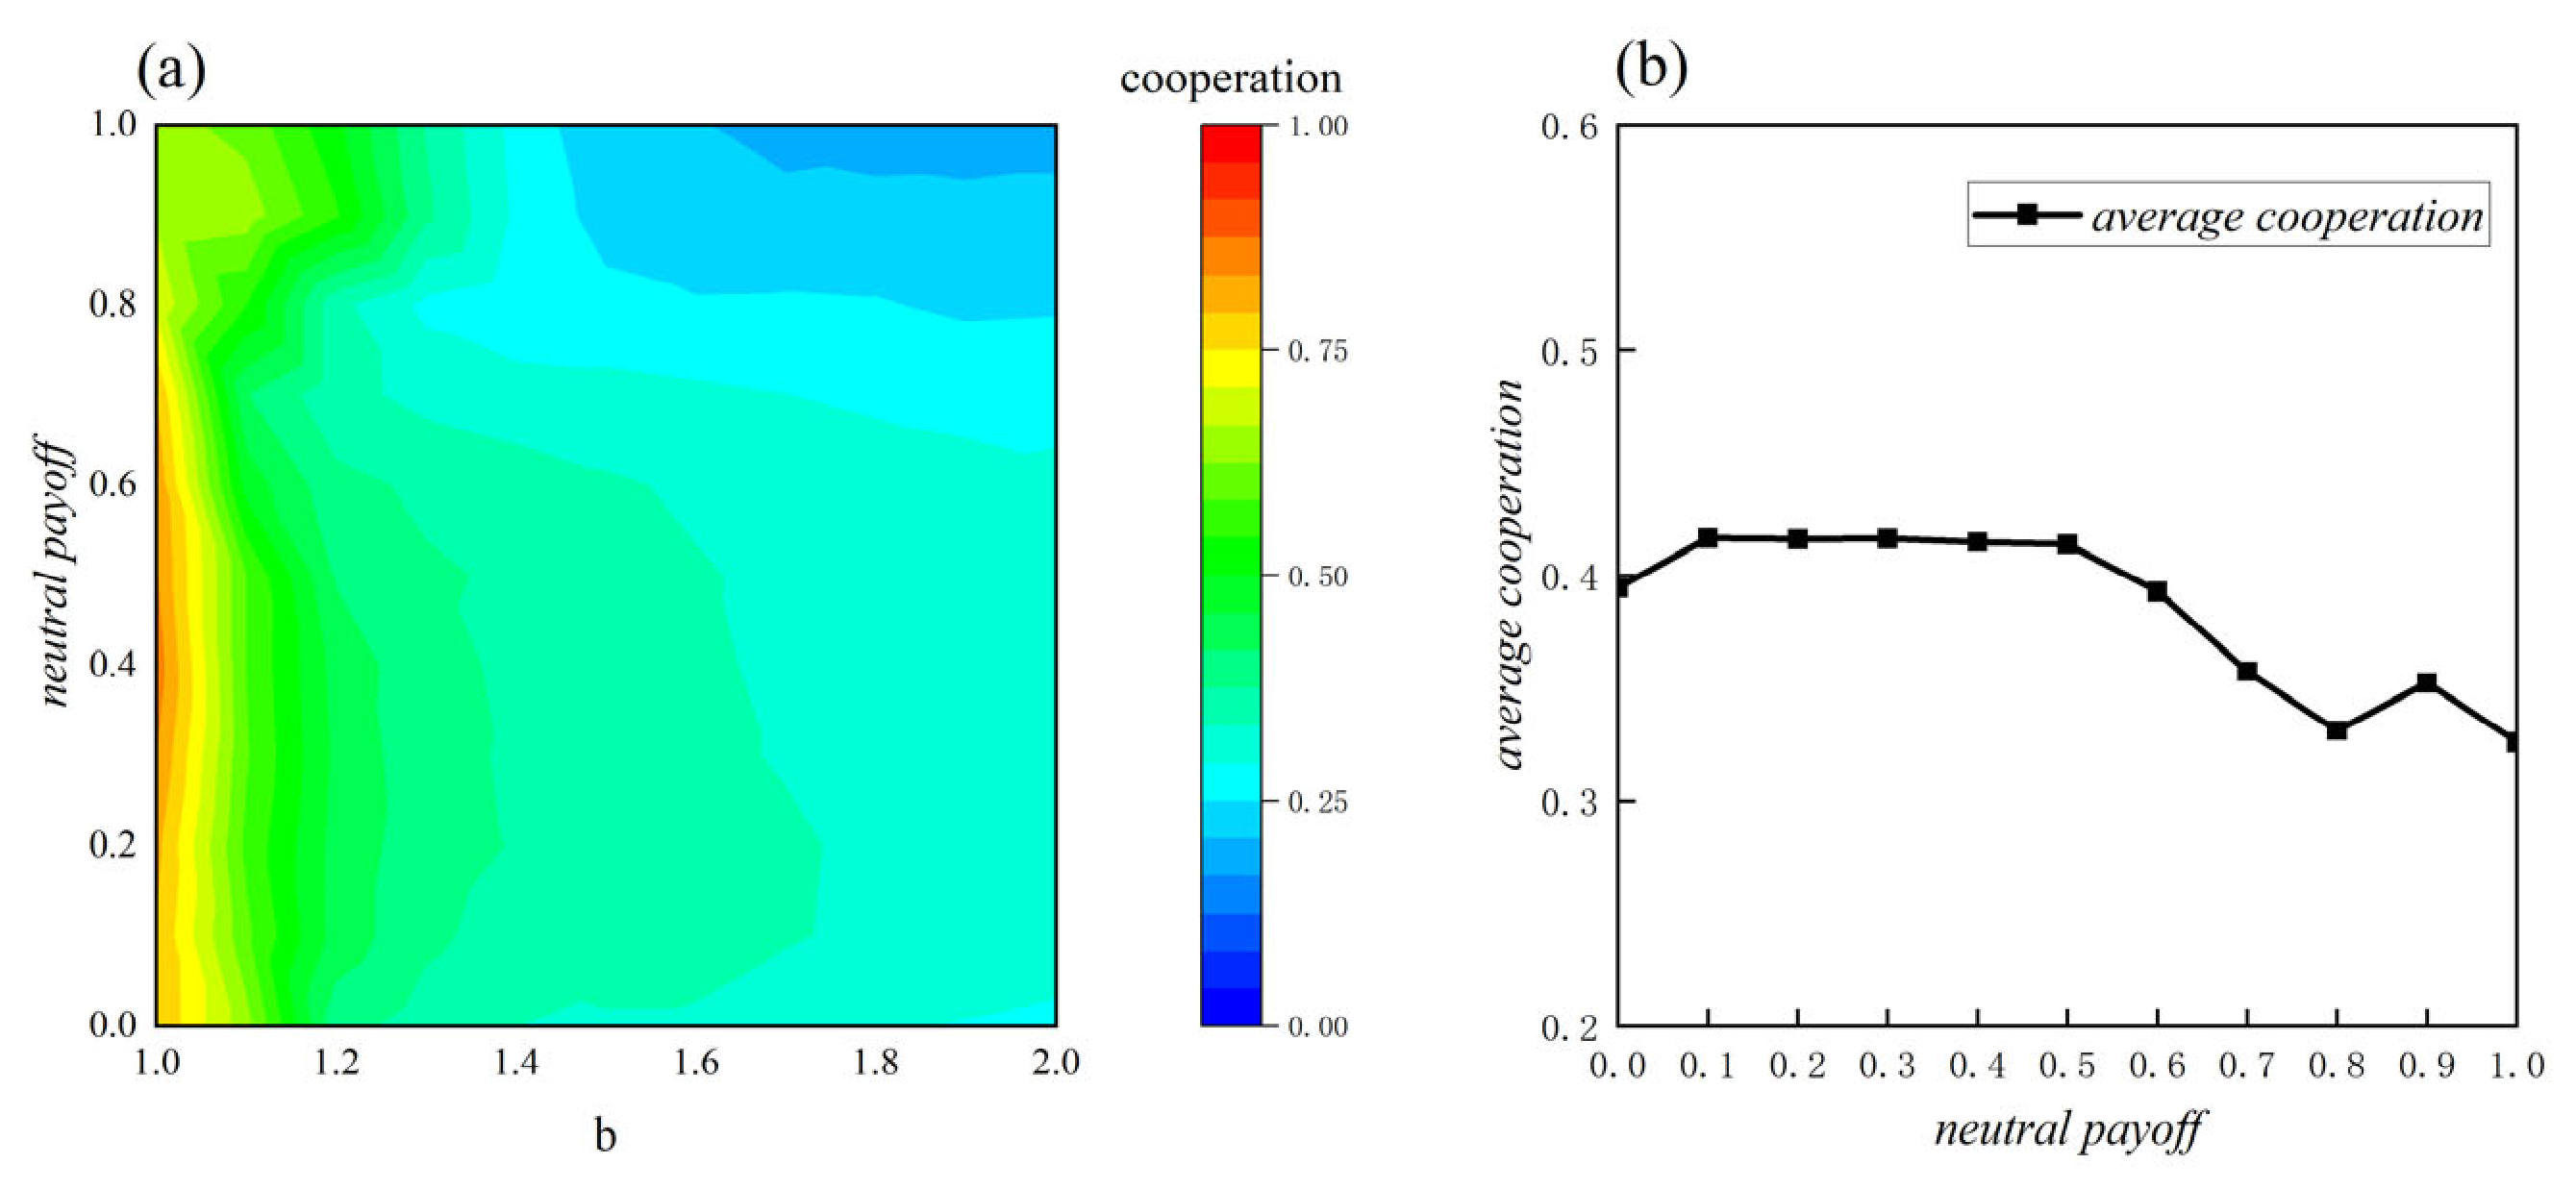
Figure 4a illustrates how the cooperation rate varies with social dilemma intensity
under the regulatory effect of neutral payoffs. We conduct a systematic parameter sweep over
and
with a uniform step size of 0.1. The results confirm that the variation trend of the cooperation rate with
is consistent across all tested values of
: the cooperation rate first increases and then decreases as
rises, and the optimal value consistently appears around
.
Figure 4b is derived by averaging the cooperation rates across all values of
for each fixed
in
Figure 4a, which demonstrates the overall impact of
on the cooperation rate. The results presented in this figure are obtained with
= 0.2. We selected this value as the representative display parameter because the cyclic suppression effect and cooperation enhancement effect are most pronounced under this setting, which facilitates a clear demonstration of the core mechanism.
The optimality criterion adopted in this study is the steady-state average cooperation rate of the global system. Specifically, for each parameter configuration, we run a sufficient number of time steps to ensure the system enters a stable stationary state. We then calculate the arithmetic mean of the global cooperator proportion over the last 5000 time steps of evolution, and take the average across multiple independent repeated trials as the final steady-state cooperation rate for that parameter set.
In
Figure 4a, when
ranges from 0.2 to 0.6, the cooperation rate reaches its peak at small values of
, corresponding to the dark red regions in the figure. In
Figure 4b, the average cooperation rate remains at a relatively high level when
falls within 0.1 to 0.5. Meanwhile, the core cyclic invasion mechanism remains qualitatively stable across all tested values of
and
, and the optimal peak around
exhibits good robustness. Based on the combined results of both subfigures, we selected
= 0.5 for subsequent experiments.
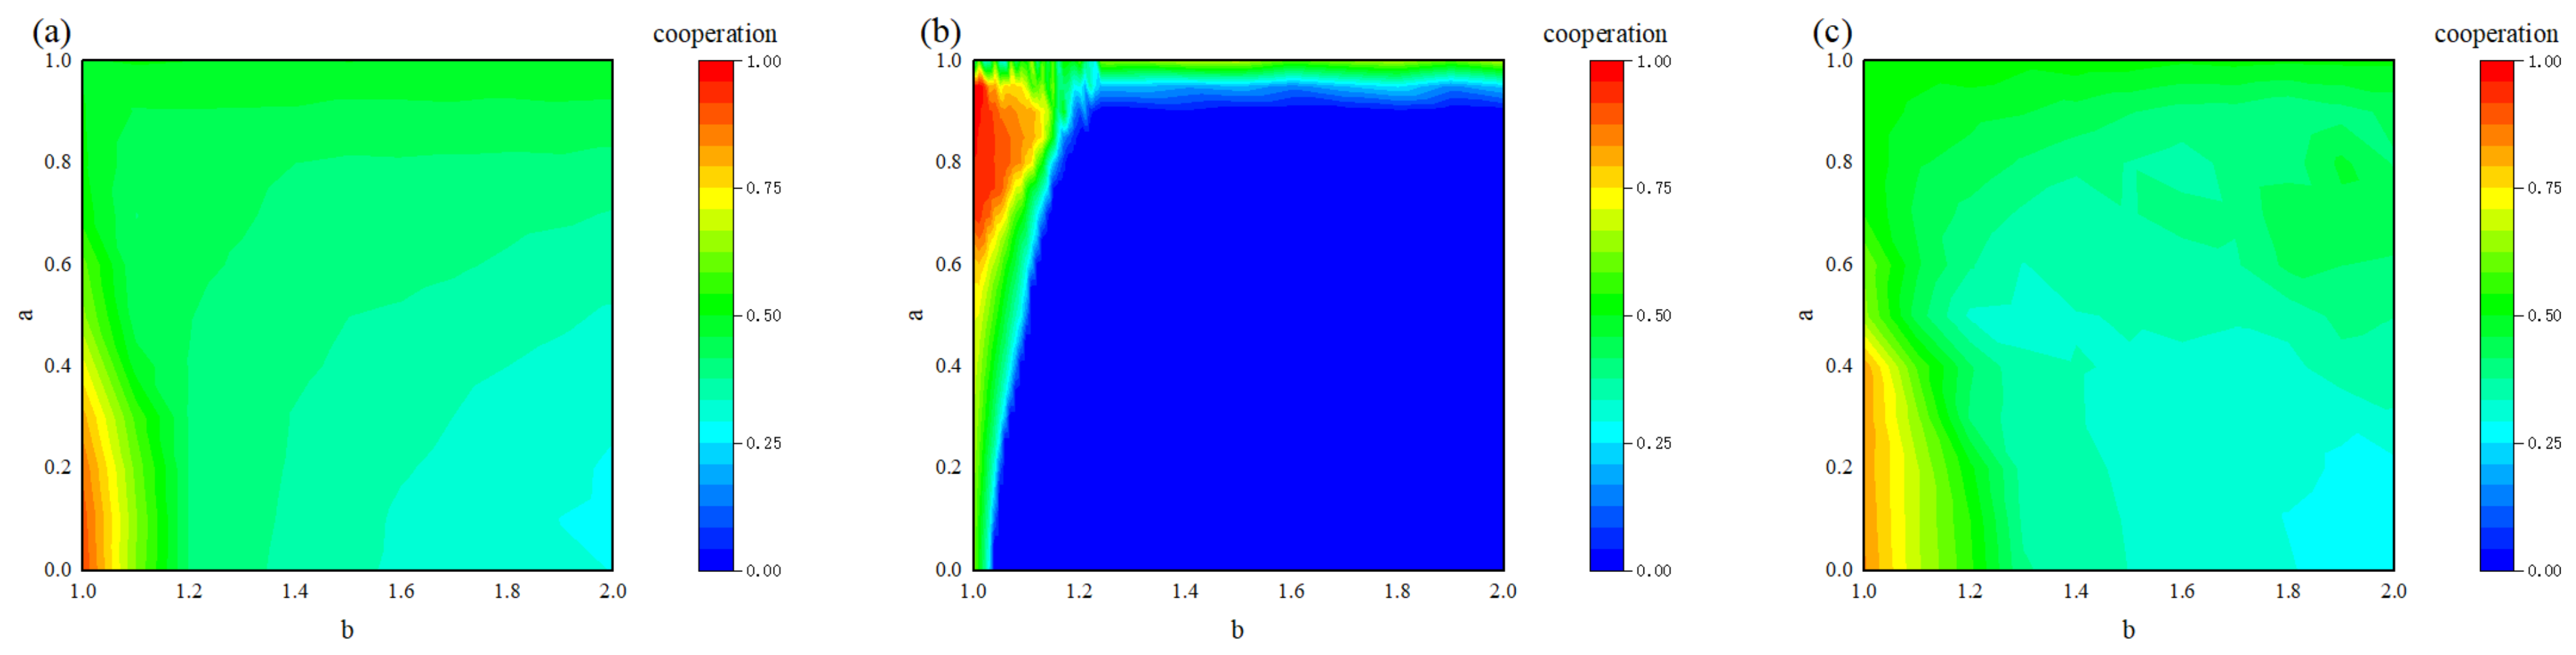
Figure 5 presents a definitive comparison of global cooperation rates across three distinct evolutionary models.
In the baseline model lacking neutral interactions (
Figure 5b), cooperation collapses almost entirely as the social dilemma intensity
increases. Mechanistically, this confirms that standard network reciprocity is fragile; without structural barriers, defectors can relentlessly exploit adjacent cooperators until the system completely unravels.
Introducing a two-subpopulation structure with a strictly zero-payoff neutral interaction (
Figure 5c) prevents immediate system collapse but yields a noticeably lower cooperation rate. Theoretically, this bipartite structure acts as a passive “spatial firewall”. It physically segregates groups, halting direct cross-group exploitation. However, because the interaction yields precisely zero payoff, it merely stalls the defectors’ advance without providing cooperators any evolutionary momentum. The system reaches a stagnant, low-level equilibrium.
In stark contrast, our proposed three-subpopulation model with a non-zero neutral payoff (
Figure 5a) demonstrates remarkable resilience, sustaining robust cooperation across the entire parameter space even under severe dilemmas. The fundamental advantage lies in a topological paradigm shift: the three-group architecture, fueled by the neutral payoff
, catalyzes a closed cyclic invasion loop.
This transforms the evolutionary dynamic from passive defense (as in Model c) to active reciprocal suppression. Because the neutral payoff is positive, cooperators in one subpopulation can actively accumulate fitness advantages against defectors in an adjacent group. This continuous cross-group policing acts as a built-in regulatory valve, constantly culling defector clusters and preventing their global expansion, thereby maintaining high system diversity and long-term cooperation stability.
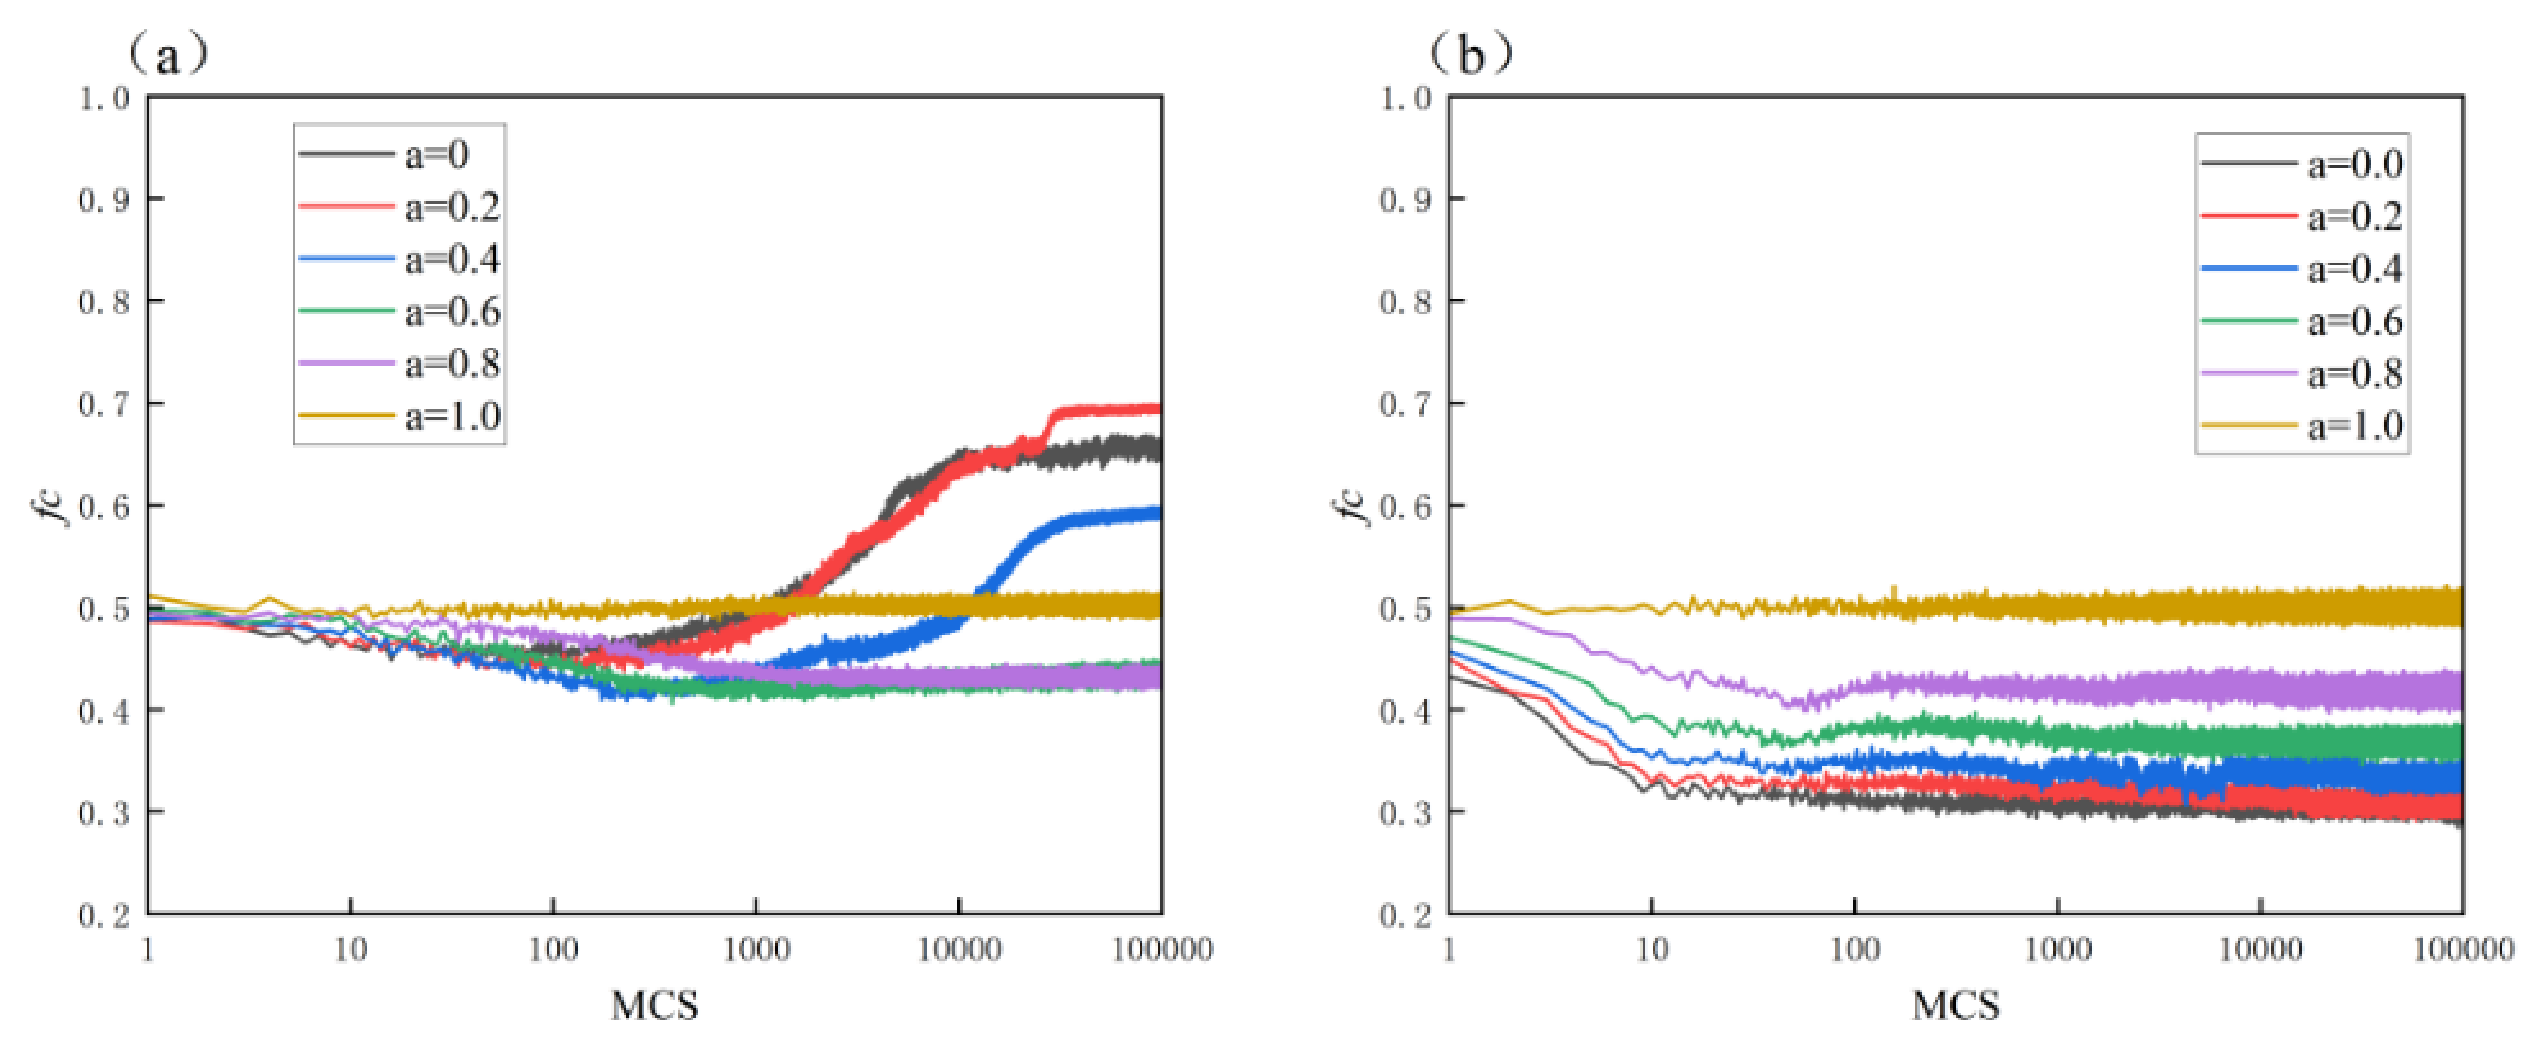
Cooperative evolution under varying social dilemma intensity
is compared in
Figure 6. Results show that when
is small, agents spontaneously achieve a high cooperation level without human intervention, and human intervention may conversely reduce the cooperation rate. Higher
values lead to lower initial cooperation rates, so a coupling strength
is needed to maintain network reciprocity.
Specifically, under weak dilemmas, such as = 1.1, cooperation rates rise significantly over evolutionary steps when = 0 and = 0.2. However, higher values inhibit this self-driven evolution. Under strong dilemmas, such as = 1.8, agents have a natural limit in their ability to cooperate. By increasing , the agents’ fitness levels are effectively boosted, which leads to better cooperation and a final stable rate of around 50%.
Our research shows that large-scale cooperative behavior can exist under stronger social dilemmas with reasonable human guidance. This phenomenon demonstrates the important role that human guidance plays in complex network systems.
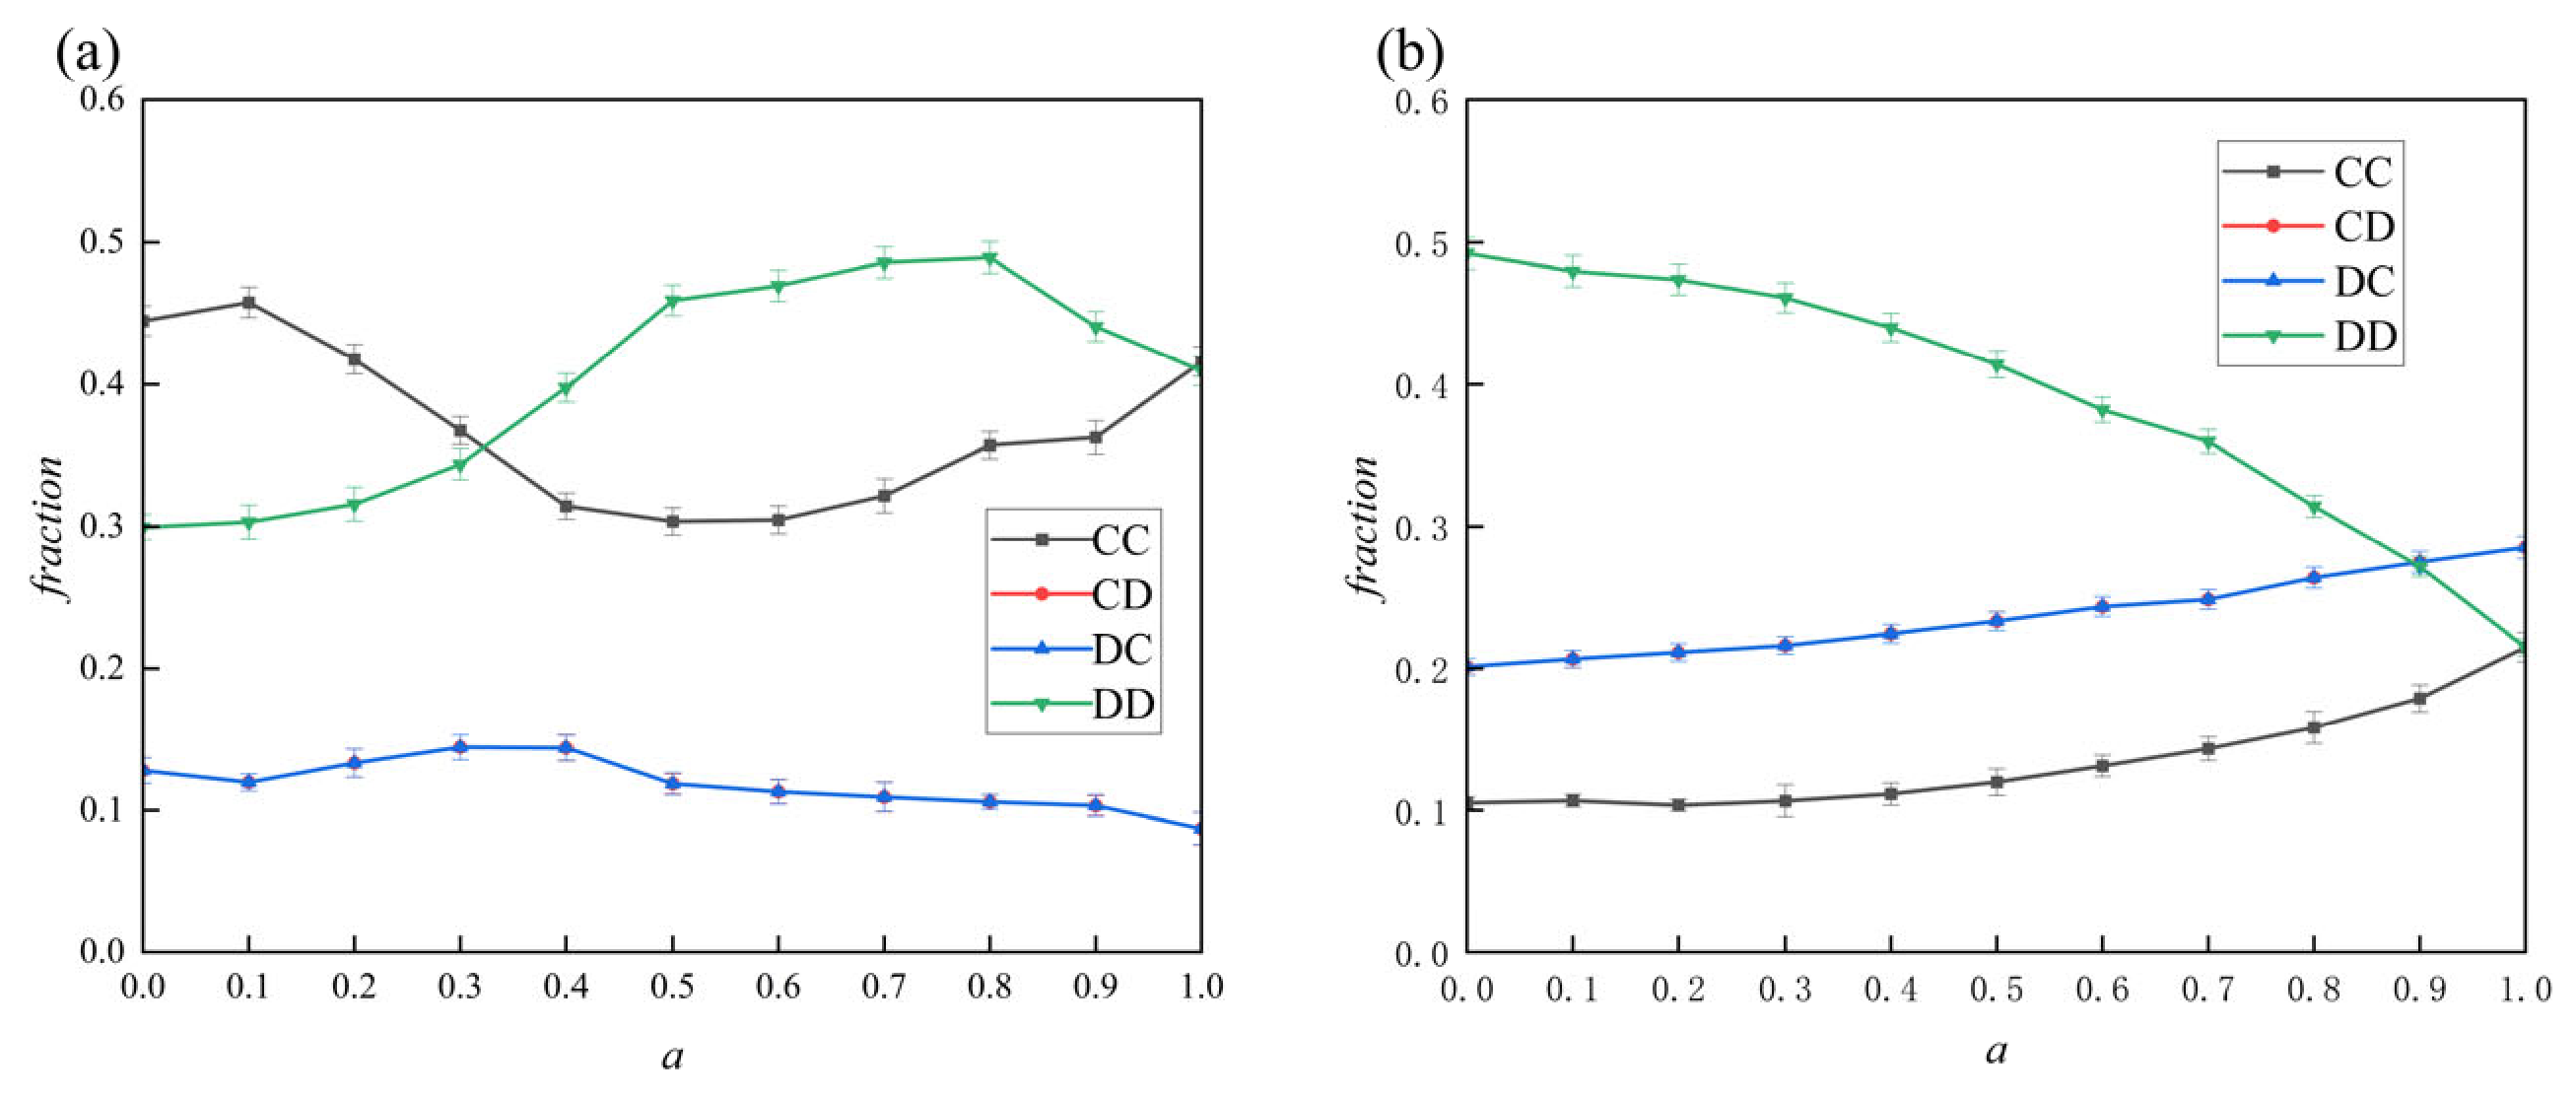
In
Figure 7, the CC curve represents the probability that the player chooses cooperation in both the current step and the next step. The DD curve represents the probability that the player chooses defection in the current step and continues to choose defection in the next step. The CD curve represents the probability that the player chooses cooperation in the current step and defection in the next step. The DC curve represents the probability that the player chooses defection in the current step and cooperation in the next step. The four curves (CC/CD/DC/DD) in
Figure 7 represent the one-step transition probabilities of the first-order discrete-time Markov chain describing strategy evolution. This Markov chain satisfies the memoryless property: the future strategy state depends only on the current state.
Figure 7 illustrates the regulation of transition probabilities of the discrete-time Markov chain (DTMC) for strategy evolution by interlayer coupling strength
under different social dilemma intensities. We model the strategy evolution of a single agent as a two-state DTMC with the state space
.
The transition matrix
of the two-state discrete-time Markov chain is formulated as:
Black squares represent the persistence probability of cooperation, ; red circles denote the transition probability from cooperation to defection, ; blue triangles stand for the transition probability from defection to cooperation, ; and green inverted triangles indicate the persistence probability of defection, . All data points satisfy probability conservation (, ) and steady-state detailed balance (), which validates the applicability of the DTMC model to this system.
Under a strong social dilemma (
,
Figure 7a), the system is dominated by defection when interlayer guidance is absent (
). At this moment,
is only 0.11 while
reaches 0.49. As the coupling strength
increases from 0 to 1.0, all transition probabilities change in a monotonic linear trend. Specifically,
rises by 91% to 0.21, and
decreases by 55% to 0.22. Meanwhile, the overall activity of strategy switching increases by 40%. The results demonstrate that guidance from the upper human layer systematically optimizes
,
,
, and
, gradually shifting the steady-state distribution of the DTMC from defection bias toward equilibrium. Finally, the system maintains a stable cooperation level of approximately 0.48.
Under a weak social dilemma (
,
Figure 7b), the system spontaneously evolves into a cooperation-dominated state without guidance, with
reaching 0.44. However,
exhibits a non-monotonic two-stage variation as
increases. In the range
, heterogeneous fitness noise introduced by upper-layer guidance disturbs the inherent cooperative steady state of the lower layer, causing
to drop by 32% to the minimum value of 0.30. When
, the positive effect of guidance prevails over noise interference, and
rebounds to a peak of 0.48. This phenomenon reveals that interlayer coupling has an optimal intervention range, and excessive intervention will suppress cooperation under weak social dilemmas.
In summary, the DTMC analysis establishes a rigorous mathematical relationship between microscopic strategy transitions and macroscopic cooperation levels. It clarifies that the essential role of upper human guidance is to reshape the strategy evolution dynamics by adjusting the transition matrix composed of , , , and . The increase in directly enhances the ability of cooperators across subpopulations to invade defector groups, which provides crucial microscopic dynamical support for the core three-dimensional cyclic invasion mechanism of this paper. The steady-state cooperation probability rises continuously, which quantitatively shows that upper-layer guidance stabilizes cooperation and promotes the switch from defection to cooperation by adjusting the transition probabilities of the Markov chain. Guidance from the upper human layer modulates the transition probabilities of the strategy evolution Markov chain, driving it to converge to a higher steady-state cooperation level even under strong social dilemmas.
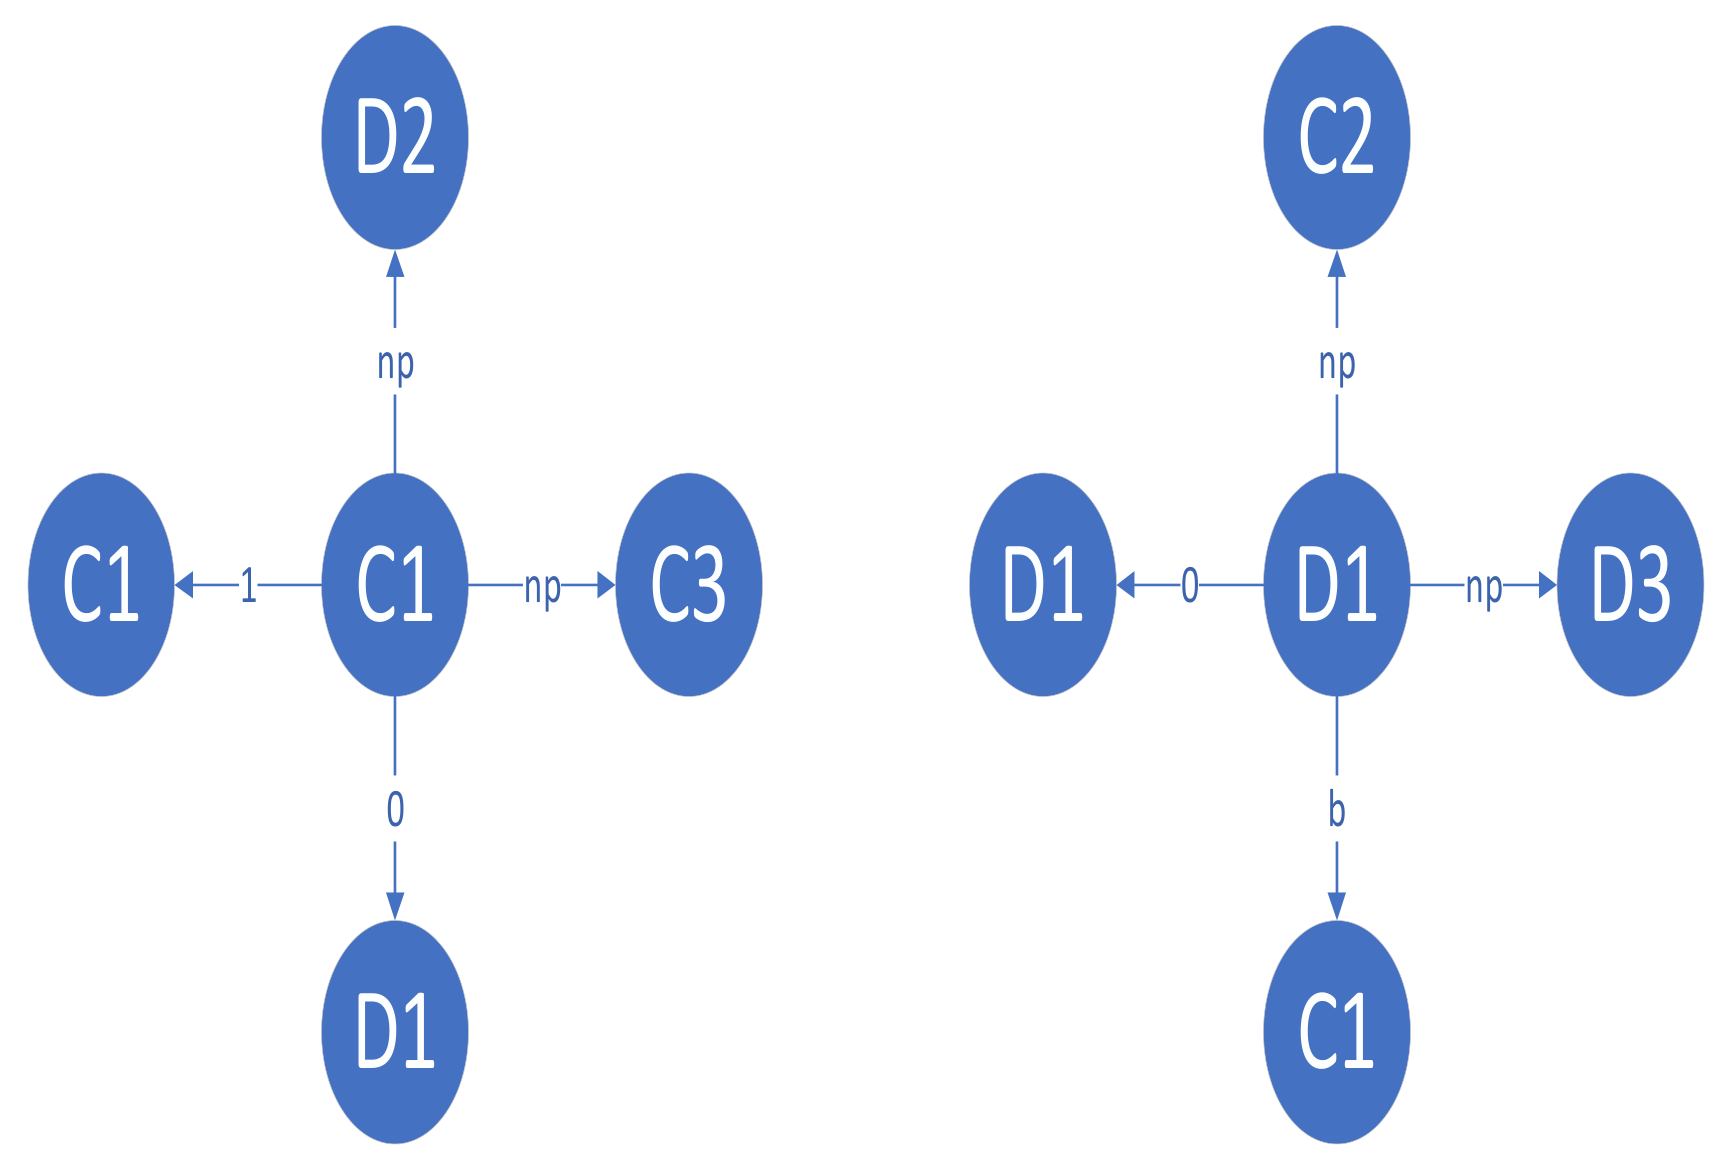
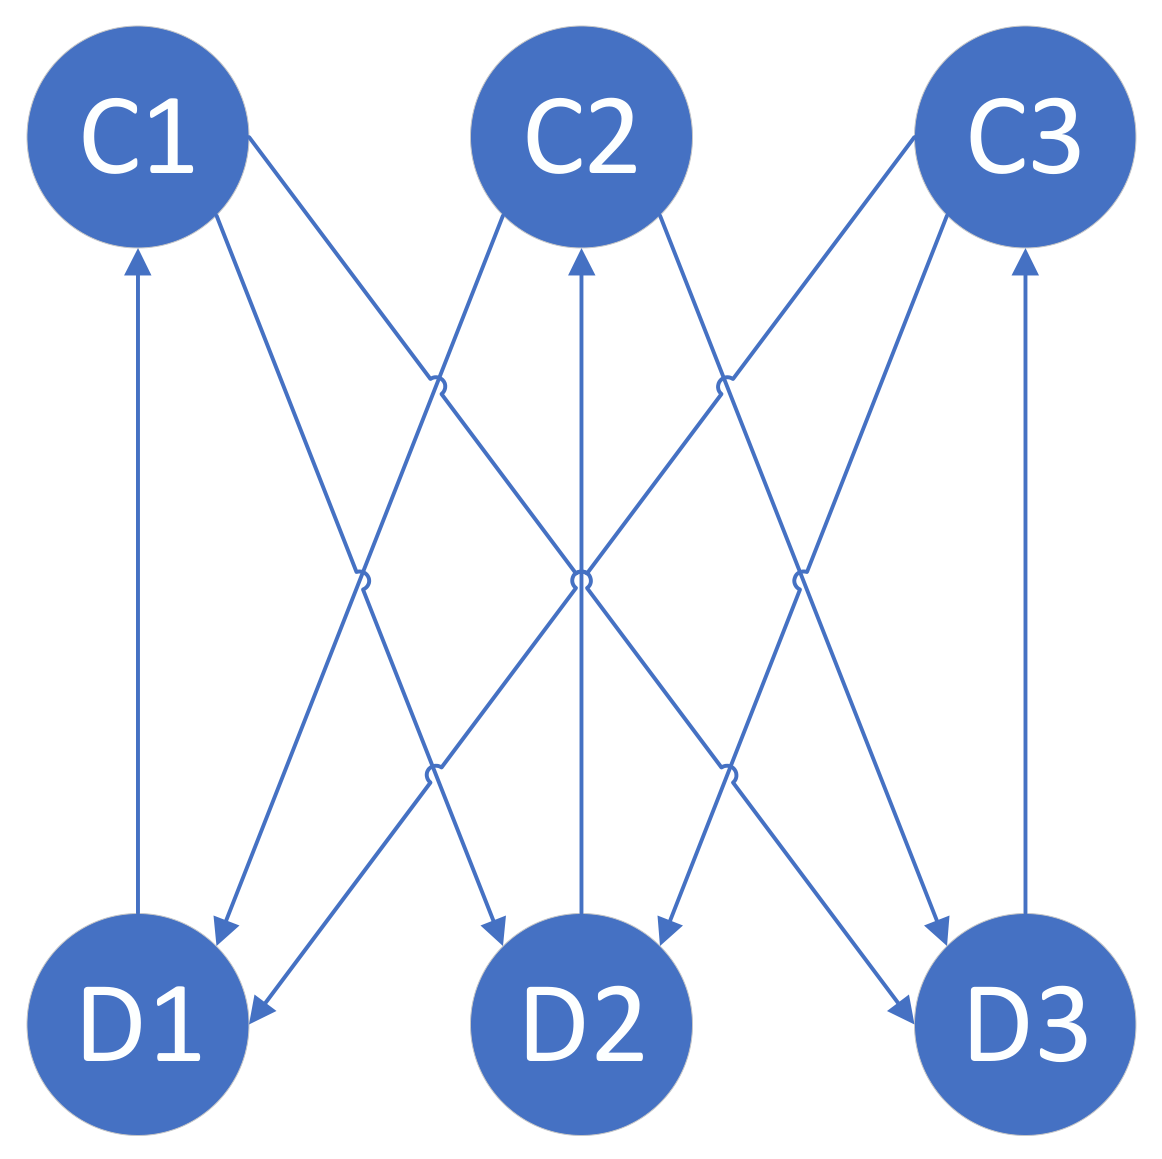
Figure 8 is the schematic diagram of the cyclic invasion food web in the three-subpopulation neutral BM model. Nodes C1, C2, and C3 represent the three cooperator subpopulations, while nodes D1, D2, and D3 represent the corresponding defector subpopulations. Directed arrows indicate the direction of evolutionary invasion: each cooperator subpopulation can invade and replace the defector subpopulations of the other two groups, while each defector subpopulation can only exploit the cooperator subpopulation within its own group. This cross-subpopulation reciprocal suppression pattern forms closed invasion cycles (e.g., C1 → D2 → C2 → D3 → C3 → D1 → C1 or C1 → D3 → C3 → D2 → C2 → D1 → C1), which is the core mechanism that maintains system diversity and prevents defectors from achieving global dominance. Practically, these invasion cycles manifest as a continuous dynamic process: defectors first expand within their own subpopulation by exploiting local cooperators but lose their competitive advantage when encountering cooperators from other subpopulations, and are then invaded and replaced. The newly expanded cooperator clusters in turn breed internal defectors, starting a new round of intra-group expansion. This alternating dominance forms a self-sustaining cycle, which is the core mechanism that maintains system diversity and prevents defectors from achieving global dominance.
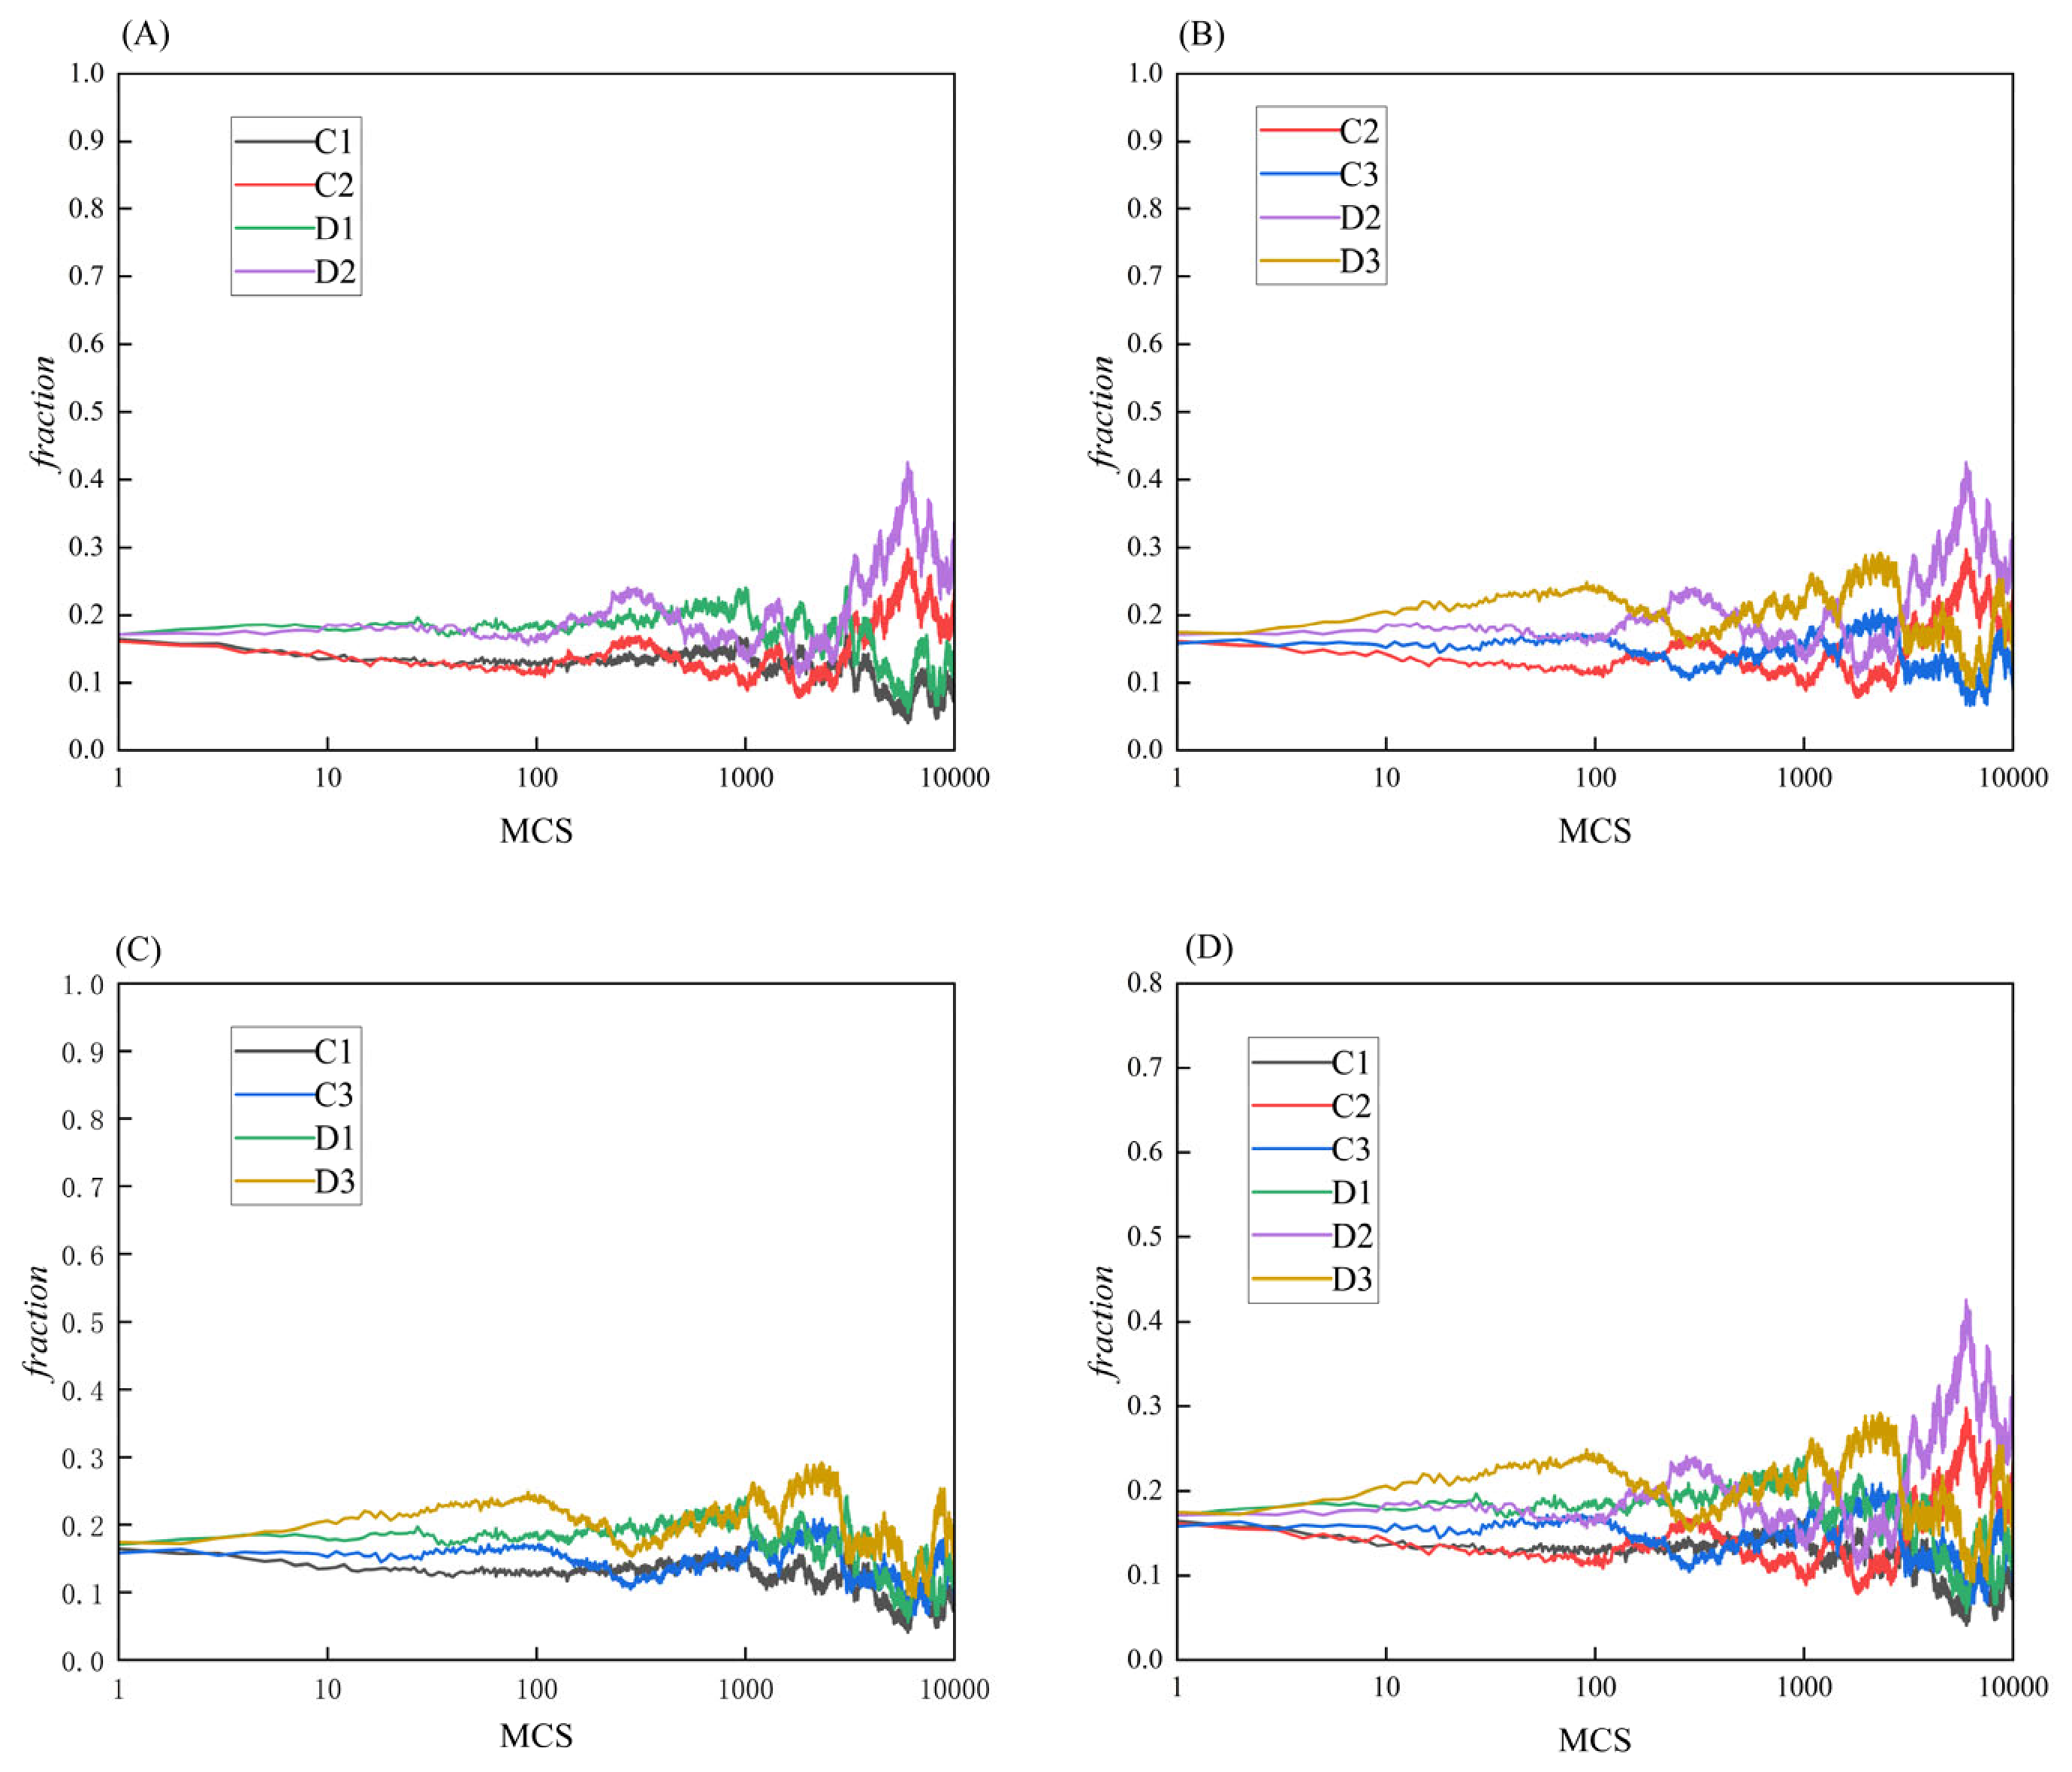
Figure 9 tracks the evolutionary dynamics of four agent types in networked games. Taking Type 1 and Type 2 agents as examples, C1 and D2 exhibit complementary oscillations, while C1 and D1 fluctuate synchronously. Specifically, the D2 population expands when C1 declines (and vice versa), which occurs because C1 agents strategically suppress D2 to achieve competitive dominance. Meanwhile, C1 growth stimulates D1 proliferation, since C1 constitutes essential resources for D1. A similar relationship exists among tag 2 players. C2 and D1 players change in the opposite trend, while C2 and D2 players change in the same trend. These rules also apply to interactions between Type 1–Type 3 and Type 2–Type 3 agents, as shown in
Figure 8.
A population can improve its survival advantage not only by weakening its enemies but also by boosting the competitiveness of its prey [
52]. Within a single subpopulation, defectors have a greater competitive advantage than cooperators, but they also become targets to be attacked by cooperators from other subpopulations. This hunting pattern forms repeating invasion cycles that maintain system stability. The key point is that invasion cycles effectively preserve diversity, allowing cooperative behaviors to exist even under high social dilemma intensity. Mutual invasion cycles are the core process sustaining cooperation. Unlike conventional network reciprocity, which relies solely on local pairwise interactions to maintain cooperation, this mechanism enables cooperators from different subpopulations to sequentially constrain defectors. This cross-subpopulation reciprocal suppression not only stabilizes cooperative strategies against exploitation but also sustains continuous evolutionary dynamics within the system.
To analytically prove the existence of the cross-subpopulation cyclic dominance described above, we employ a spatial boundary mean-field approximation. In structured populations, individuals rapidly form homogeneous clusters. The evolutionary dynamics are therefore dominated by the strategy transitions at the boundaries between these clusters.
Let us consider a straight macroscopic interface between a cluster of cooperator subpopulation 1 (C1) and a cluster of defector subpopulation 2 (D2) on a regular lattice with node degree
. For an individual located exactly at this boundary, approximately half of its neighbors belong to its own cluster, and the other half belong to the invading cluster. The expected fitness of a C1 individual at the boundary is calculated by interacting with two C1 neighbors (yielding reward
) and two D2 neighbors. Crucially, the cross-subpopulation interactions yield the neutral payoff
. Thus, the expected fitness for C1 is:
Conversely, the expected fitness of a D2 individual on the other side of the boundary involves interacting with two D2 neighbors (yielding punishment
) and two neighbors (yielding
):
Regarding the fitness definition, for the upper human population where interlayer coupling is absent, individual fitness is directly equivalent to game payoff (), so holds naturally. Consequently, the Fermi transition probability of D2 individuals imitating the C1 strategy approaches 1, while the probability of C1 imitating D2 approaches 0.
For the lower agent population, the composite fitness follows the definition in Equation (2): . Since the local payoff advantage already exists, and the upper-layer guided payoff also favors (), the relation is strictly preserved. Under the Bush–Mosteller reinforcement learning rule, this payoff advantage exerts a positive stimulus on C1 agents to reinforce their cooperative strategies, and a negative stimulus on D2 agents to prompt them to adjust their defection strategies.
This mathematically proves that cooperators of one subpopulation possess an absolute evolutionary advantage over defectors of another subpopulation (C1), i.e., C1 can invade D2 in both layers of the population.
Since , the Fermi transition probability of D2 imitating C1 approaches , while that for C1 imitating D2 approaches . This mathematically proves that cooperators of one subpopulation possess an absolute evolutionary advantage over defectors of another subpopulation (C1 D2).
On the other hand, for intra-group interactions (e.g., at the boundary between C1 and D1), the standard prisoner’s dilemma fitness apply. The expected fitness at the interface is:
As long as the social dilemma intensity , we have , meaning defectors invariably exploit cooperators within the same subpopulation (D1 C1).
Combining these two boundary conditions analytically proves the closed cyclic dominance loop. The introduction of the neutral payoff structurally alters the cross-population payoff matrix, providing the exact mathematical mechanism that shields cooperators from global extinction by creating a refuge through cross-group suppression.
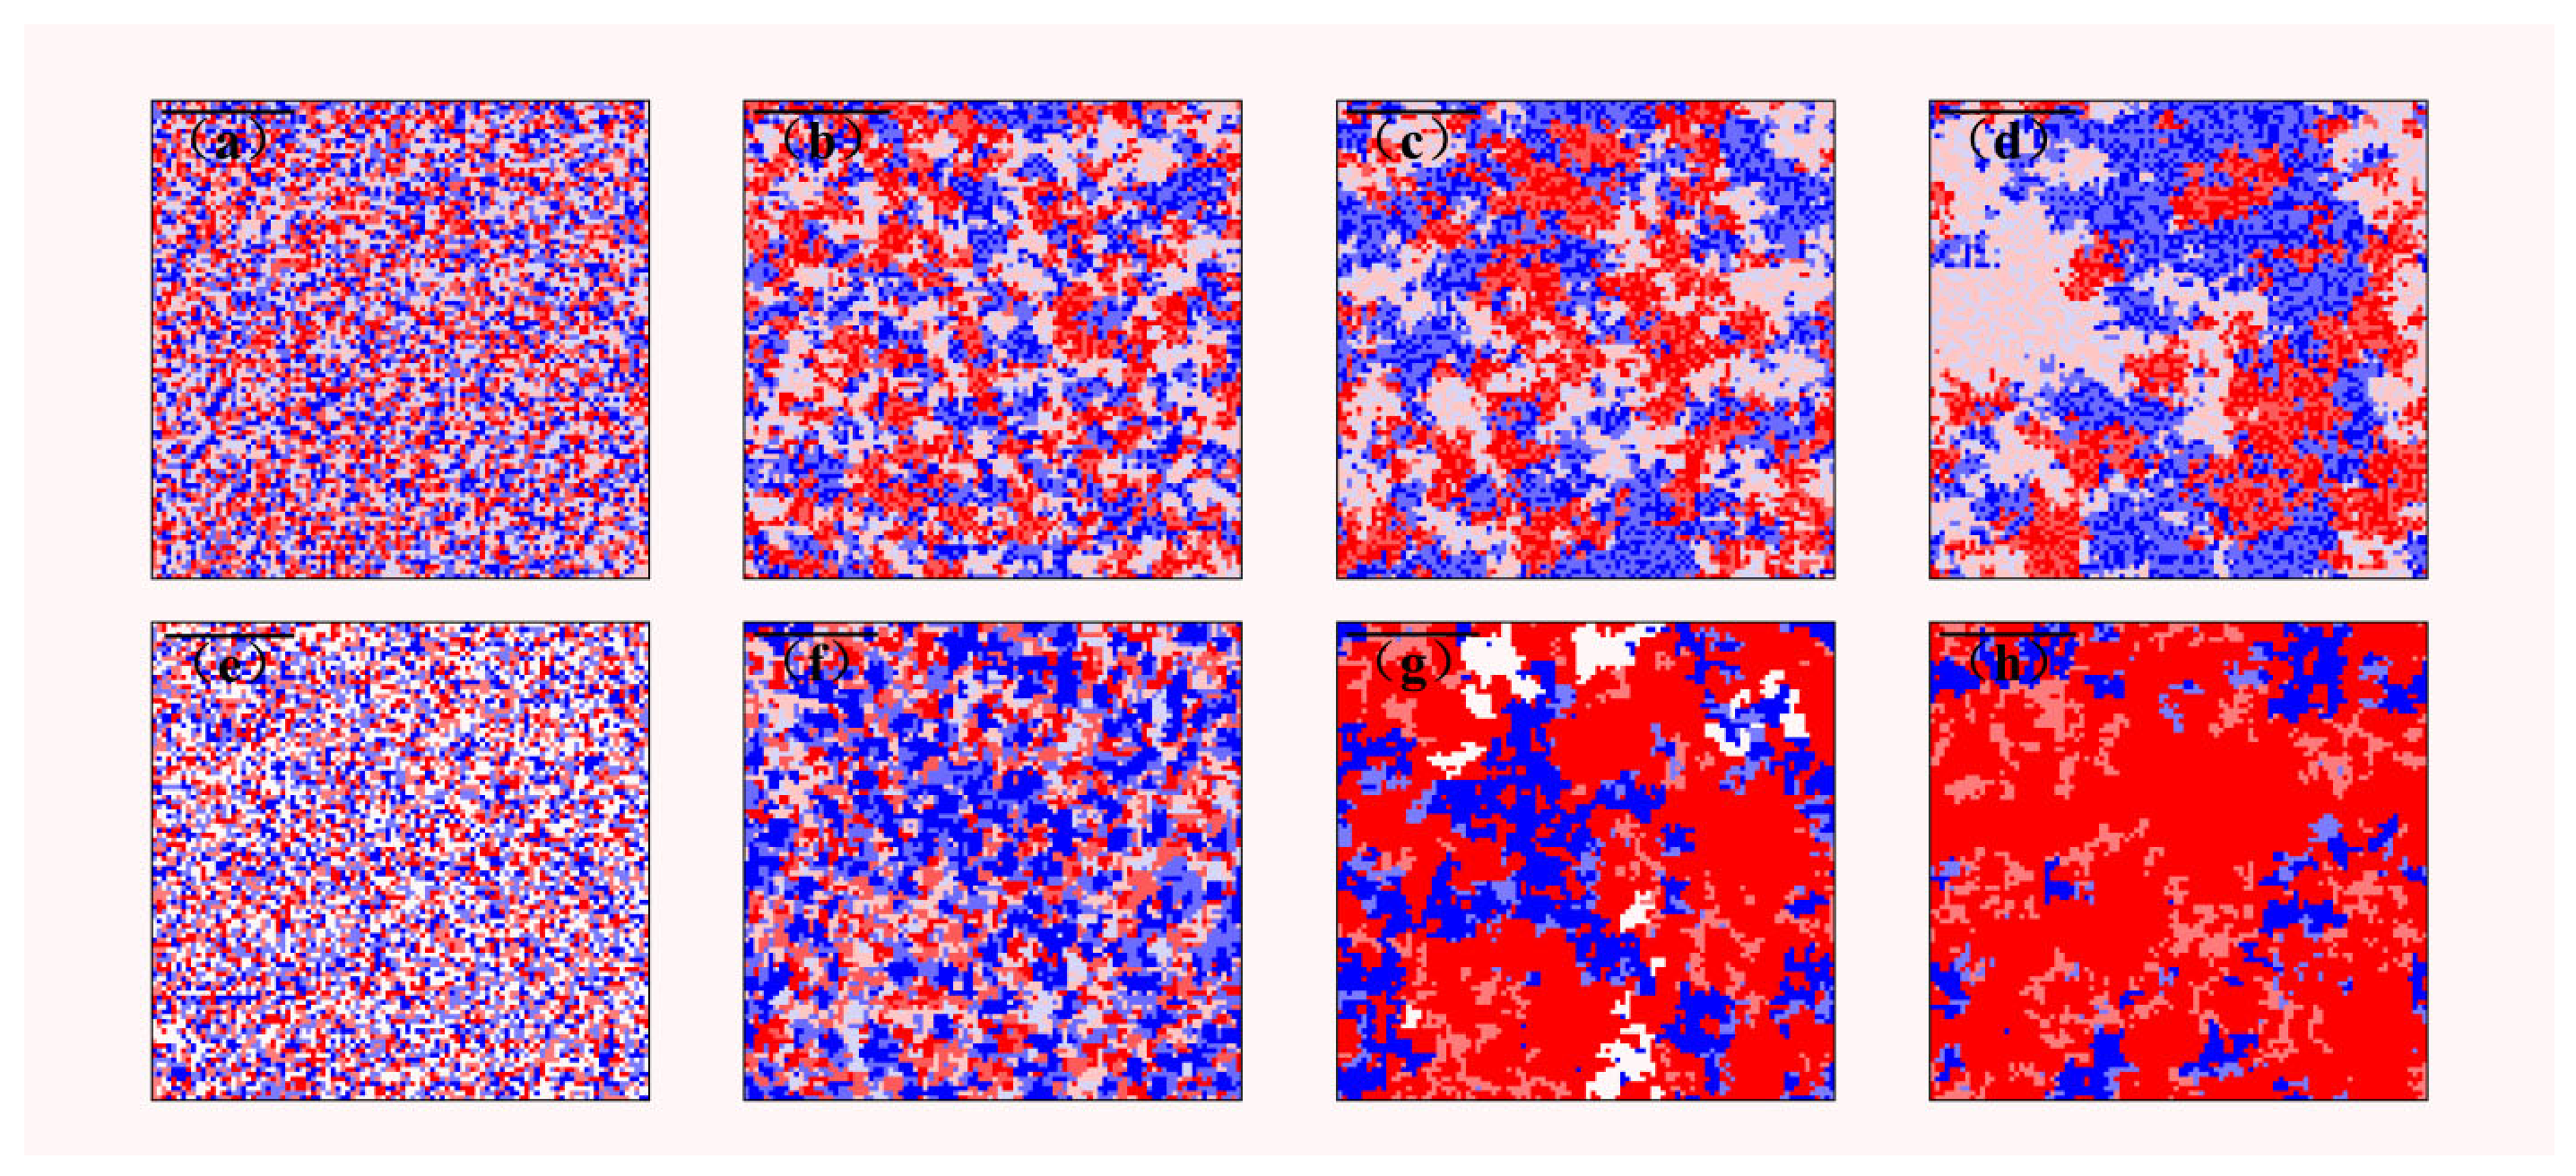
As
Figure 10 shows, color coding is as follows: crimson = D3, red = C3, light red = D2, dark blue = C2, blue = D1, and light blue = C1. After initialization, homogeneous players rapidly form clusters, which is an important characteristic of network reciprocity. In our two-layer model, rather than forming passively, this spatial assortment is actively anchored by the top-down fitness coupling from the upper layer, which acts as a buffer against localized exploitation. Due to these clusters, the system’s structural complexity increases, leading to more stable cooperation compared to single-network reciprocity.
Let us take Type 1 and 2 subpopulations as an example. First, light red D2 invaders take over areas from dark blue C2. Later, light blue C1 occupies these areas. Mechanistically, this occurs because cross-group interactions yield neutral payoff, which strips D2 of its exploitation advantage when facing C1, allowing C1 to expand via upper-layer cooperative guidance. After that, blue D1 moves into the C1 zones. Then, C2 wins the areas back. This circular pattern is a direct spatial manifestation of the closed cyclic invasion mechanism. Instead of simple territorial shifts, this topology creates a “spatial firewall”, where defectors in one group are naturally culled by cooperators from another group, as shown in
Figure 9. We can see this same process repeat between Type 1–3 and Type 2–3 subpopulations.
However, the BM model does not use the imitation update strategy, which allows isolated defectors to survive in the cooperator clusters by feeding off of cooperators. Unlike the Fermi rule, where individuals copy successful neighbors, BM agents rely on internal aspiration-based reinforcement learning. An isolated defector occasionally harvests a high fitness from adjacent cooperators, temporarily satisfying its internal aspiration and thus freezing its strategy update. Even with guidance from the upper layer, these defectors continue to exist. Their persistence limits any further improvement of the cooperation rate.
In
Figure 10e–h, the social dilemma intensity
is 1.8. These figures show that, when social conflict gets stronger, the weaker types die out. Even with only two types left, they still form the same patterns in space and time as systems with three types. This phenomenon shows the robustness and stability of our model, proving that the inter-group neutral mechanism can autonomously adapt to extreme social dilemmas by degrading into a resilient bipartite state.
4. Conclusions
This study constructs a two-layer coupled regular lattice network containing three neutral subpopulations and explores the evolutionary dynamics of cooperation under the framework of the prisoner’s dilemma game. The upper-layer human population adopts the Fermi updating rule, and the lower-layer agent population follows the Bush–Mosteller (BM) reinforcement learning model. The two layers are linked by a five-to-one inter-layer payoff-coupling mechanism.
Both layers are divided into three neutral subpopulations. Interactions within subpopulations follow the prisoner’s dilemma payoff matrix, while interactions between subpopulations produce a fixed neutral payoff . Simulation analysis is carried out using 100,000-step Monte Carlo simulations and 20 independent repeated experiments, verifying the reliability of the results.
The coexistence of multiple subpopulations creates invasion cycles that cannot appear in single-population systems, which makes evolution more complex in structured populations. Defectors gain a competitive advantage within a single subpopulation but become targets of invasion by cooperators from other subpopulations. This feature not only maintains the diversity of population structure but also blocks the cascading spread of defectors across the entire population and prevents them from achieving global dominance. Meanwhile, weaker subpopulations may go extinct as social conflict intensifies; even if only two subpopulations remain, they still form the same spatiotemporal patterns as the three-subpopulation system. This phenomenon reflects the robustness and stability of our model. Cooperative behavior spreads widely also because cooperators quickly form clusters to protect their long-term benefits. Traditional models show that while cooperation within a group is stable, cooperators on the boundaries are easily invaded. In our model, cooperators avoid this problem by invading defectors in other subpopulations, which reinforces the stability and robustness of cooperation. With guidance from the upper layer, the players can overcome social dilemmas. Even at high dilemma intensities, the cooperation rate maintains a relatively high level which proves that our model effectively helps spread cooperation.
Compared with the model without neutral subpopulations, our model resolves the issue that the boundaries of cooperator clusters are easily invaded by defectors, as well as strengthening the stability of cooperation. In contrast to the two-subpopulation model, the three-subpopulation design enriches the dimensions of interaction and forms invasion cycles. Cooperation remains more stable under high dilemma intensity, and the model shows stronger robustness.
The cyclic invasion mechanism induced by the three neutral subpopulations stems from neutral interactions among subpopulations, rather than the spatial topology itself. Accordingly, we reasonably infer that this core mechanism is qualitatively independent of specific network topologies, and the core dynamical pattern of cyclic invasion will persist when the regular lattice is replaced by other network structures. Future work will further conduct simulation studies on complex network topologies such as scale-free networks and small-world networks, to verify the evolutionary patterns of this mechanism under different topologies and bridge the gap between the proposed model and real-world scenarios of human–machine collaboration and public governance.
This study adopts multiple simplified hypotheses to isolate the core cyclic suppression mechanism, which inevitably limits the model’s real-world generalization capacity, and the corresponding constraints are elaborated as follows.
First, all individuals are assigned a fixed number of four neighbors on regular lattices with uniform topology. This setup eliminates topological noise and simplifies mathematical boundary analysis, yet real social groups feature heterogeneous connection degrees. Extreme high-degree hubs or isolated nodes may alter the spread speed of cooperator/defector clusters and weaken cyclic balancing effects.
Second, only asynchronous Monte Carlo updating is adopted throughout all simulations. Asynchronous iteration prevents simultaneous strategy conflicts, but synchronous global updating will produce distinct transient evolutionary trajectories and shift the critical threshold of dilemma strength where cooperation collapses, which has not been systematically compared here.
Third, all lower-layer agents share identical BM aspiration, sensitivity, and learning coefficients. Homogeneous parameters serve as controlled variables to clarify baseline dynamics, but individual cognitive differences in real agents create heterogeneous learning speeds that may disrupt stable cyclic oscillations.
Fourth, one-way five-to-one human–agent coupling ignores reverse behavioral feedback from agents to humans. The current framework only models top-down human guidance, while two-way mutual influence in real human–machine systems could reshape the steady-state cooperation equilibrium.
Additionally, neutral payoffs are fixed static values, whereas real inter-group neutral interactions dynamically shift with inter-group trust and contact frequency. These simplifications facilitate clear mechanism analysis. In future work, we will relax the above constraints via heterogeneous networks, synchronous benchmarks, diversified hyperparameters, bidirectional layer feedback, and dynamic neutral payoff terms to improve practical applicability.
We conducted a horizontal comparison between the hierarchical learning mechanism adopted in our two-layer coupled framework and three mainstream single-learning schemes. The pure Fermi imitation rule updates strategies by copying neighbors’ behaviors, which fails to depict the independent decision-making characteristics of autonomous agents and generates redundant node interactions. The standalone BM reinforcement learning adjusts strategies merely based on individual payoffs and the fixed aspiration threshold A, making it unable to effectively utilize surrounding group information. Q-learning requires maintaining large-scale state-action tables, which substantially increases the computational burden of our lattice simulations. By contrast, the hierarchical coupling mechanism proposed in this paper can remarkably raise the steady-state cooperation level without introducing complicated interaction constraints. Our study provides a new perspective for exploring cooperative behavior in complex heterogeneous systems. The derived cyclic suppression mechanism can be applied to human–machine collaborative systems, enterprise organizational structure design, and public governance: by dividing participants into multiple neutral subgroups and introducing hierarchical payoff guidance. Managers can curb the large-scale spread of uncooperative behaviors and stabilize long-term group cooperation, which endows this work with clear theoretical significance and targeted practical reference value for cooperative mechanism design in multiple real scenarios.